Article

Preparation and Physicochemical Properties of 10-Hydroxycamptothecin (HCPT) Nanoparticles by Supercritical Antisolvent (SAS) Process

Key Laboratory of Forest Plant Ecology, Northeast Forestry University, Ministry of Education, Harbin 150040, China
*
Author to whom correspondence should be addressed.
Int. J. Mol. Sci. 2011, 12(4), 2678-2691; https://doi.org/10.3390/ijms12042678
Submission received: 14 March 2011 / Revised: 13 April 2011 / Accepted: 18 April 2011 / Published: 20 April 2011
(This article belongs to the Section Materials Science)

Abstract

:
The goal of the present work was to study the feasibility of 10-hydroxycamptothecin (HCPT) nanoparticle preparation using supercritical antisolvent (SAS) precipitation. The influences of various experimental factors on the mean particle size (MPS) of HCPT nanoparticles were investigated. The optimum micronization conditions are determined as follows: HCPT solution concentration 0.5 mg/mL, the flow rate ratio of CO2 and HCPT solution 19.55, precipitation temperature 35 °C and precipitation pressure 20 MPa. Under the optimum conditions, HCPT nanoparticles with a MPS of 180 ± 20.3 nm were obtained. Moreover, the HCPT nanoparticles obtained were characterized by Scanning electron microscopy, Dynamic light scattering, Fourier-transform infrared spectroscopy, High performance liquid chromatography-mass spectrometry, X-ray diffraction and Differential scanning calorimetry analyses. The physicochemical characterization results showed that the SAS process had not induced degradation of HCPT. Finally, the dissolution rates of HCPT nanoparticles were investigated and the results proved that there is a significant increase in dissolution rate compared to unprocessed HCPT.

1. Introduction

10-Hydroxycamptothecin (HCPT) (Figure 1), one of the natural camptothecin analogues, has been shown to have a broad spectrum of antitumor activity against breast, colon, lung, and ovarian cancers in clinical practice. More importantly, HCPT was shown to be more potent and less toxic than camptothecin(CPT) in experiments on animals and in human clinical evaluations, mainly in China [1,2]. However, due to its poor solubility in water or in physiologically acceptable organic solvents and in vitro and in vivo instability, clinical practical use of HCPT is limited [3]. The earlier clinical trials using its highly water-soluble sodium salt, HCPT-Na+, which was the product of opening the lactone ring of HCPT, showed minimal anticancer activity and several unpredictable side effects such as myelosuppression, hemorrhagic cystitis, diarrhea, nausea, vomiting, and dermatitis. The lactone form is a more effective inhibitor of topoisomerase I compared to the carboxylate form, which has much lower anti-tumor activity [4]. Therefore, it is of great significance in developing the high performance delivery systems for the insoluble lactone form 10-HCPT. Recently, some novel delivery systems of HCPT have been reported, such as nanosuspensions [5], prodrugs [69], nanoparticles [10,11], microspheres [1214], niosomes [3], emulsions [15] and polymeric micelle systems [16,17]. Among these tested approaches, nanosuspensions system, a sub-micro colloidal dispersion system, is considered as one of the most promising methods because of its characteristics in drug loading, release, delivery, stability and various options for administration, such as oral, parenteral, ocular and pulmonary pathways [18]. Production technologies of nanosuspensions currently used are pearl milling and high-pressure homogenization either in water or alternatively in mixtures of water with water miscible liquids or non-aqueous media, such as liquid polyethylene glycols or oils. Supercritical antisolvent (SAS) is a new micronization technology that has been developed in recent years. It is suitable to prepare nanocrystals of drugs or biologically active substances because of their low temperature and inertia. Until now, many bioactive materials have been successfully processed into nanocrystals [1924].
However, no report has been carried out on the micronization of HCPT using SAS process. Therefore, the aims of this work are to study the feasibility of HCPT nanoparticle preparation by SAS process and to evaluate the SAS process factors which influence the mean particle size (MPS) of HCPT nanoparticles. The effects of concentration of HCPT solution, precipitation temperature, precipitation pressure and drug solution flow rate on the MPS of HCPT nanoparticles were studied by a four-factor, four-level OAD with an OA16 (45) matrix. Moreover, characterization of HCPT nanoparticles was analyzed by SEM, DLS, FTIR, LC-MS, XRD and DSC with the purpose of developing a suitable drug delivery system of cancer chemotherapy, nanosuspension of close-ring HCPT.

2. Experimental Section

2.1. Materials

10-HCPT (98.5% purity) was obtained from Zhejiang Hisun Pharmaceutical Co. Ltd (PR China). High purity CO2 (99.99% purity) was purchased from Liming Gas Company of Harbin (PR China). Dimethyl sulfoxide (DMSO, 98.5% purity) was purchased from Sigma Aldrich. All solutions used in HPLC analysis were of HPLC grade and filtered using a 0.22 μm membrane filter (YDHITECH, China) with a filtration system (SHB-III, China).

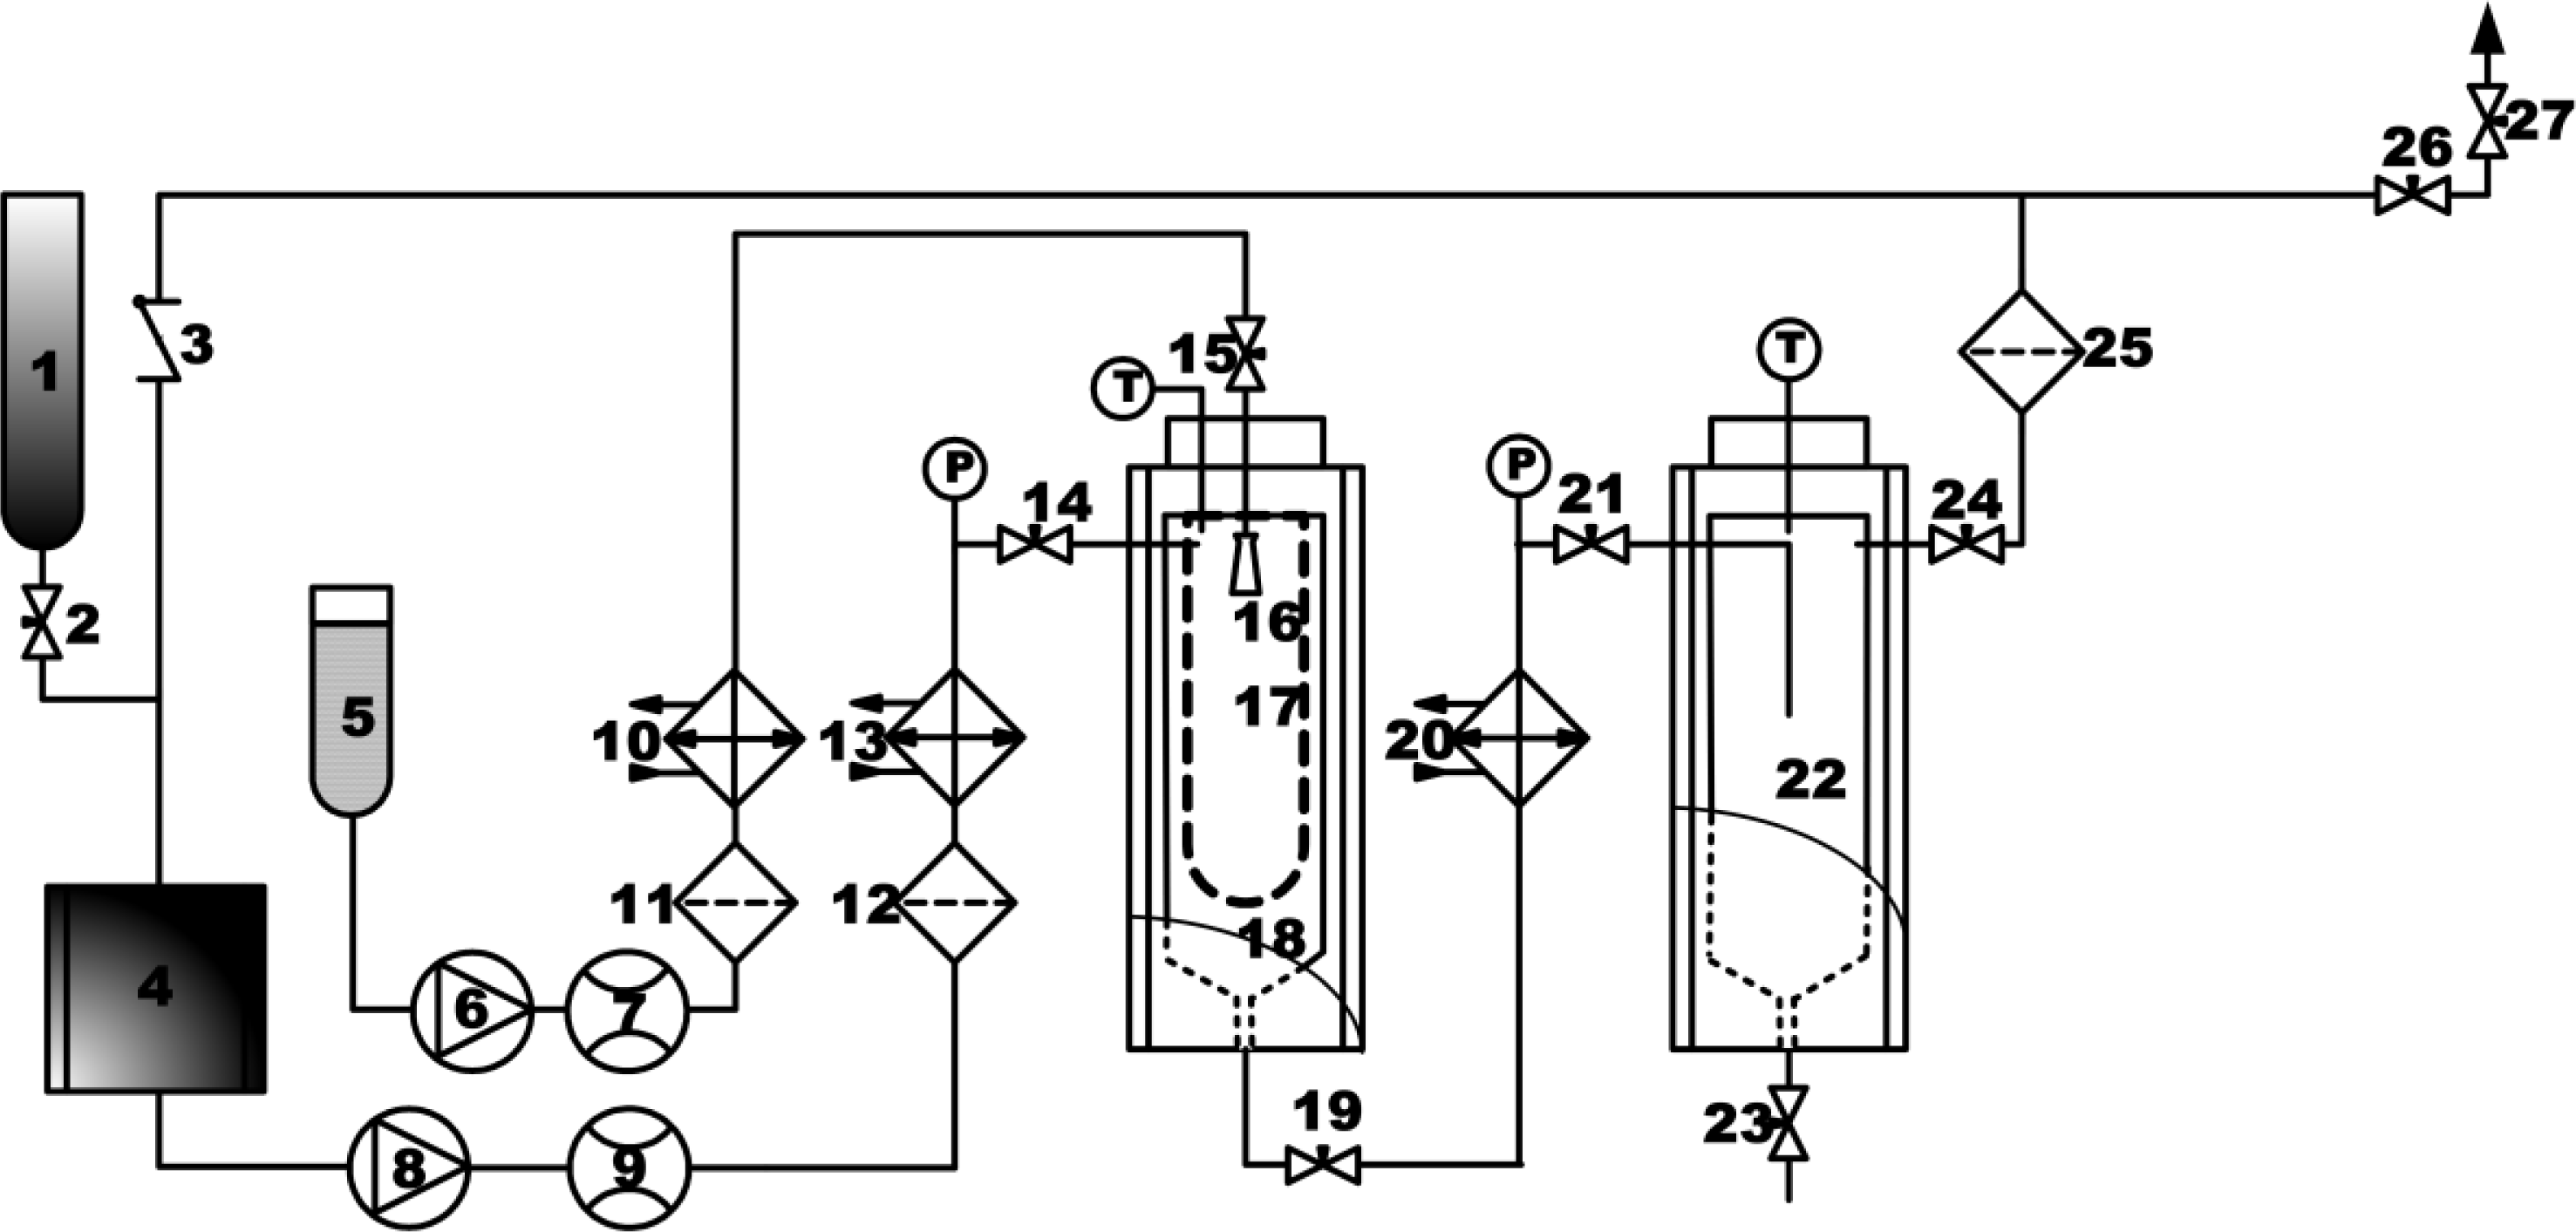
2.2. Apparatus and Supercritical Anti-Solvent (SAS) Process

The schematic of SAS process is shown in Figure 2. The apparatus consists of a precipitation chamber and a gas-liquid separation chamber. The CO2 is cooled with a cooler before being compressed by a liquid pump and the pressure is controlled by a back pressure regulator. Afterwards, the CO2 is pre-heated in a heat exchanger and enters into the precipitation chamber. Simultaneously, the solution is pumped, heated and fed to the 1000 mL precipitation chamber through a stainless steel nozzle. This nozzle is located in a distinct inlet point from the CO2, but also in the top of the precipitation chamber. A stainless steel frit vessel of 200 nm was put into the precipitation chamber to collect the micronized particles and to let the SC–CO2/organic solvent mixture pass through. The flow rate of the mixture that leaves the precipitator is controlled by a valve located between the precipitation chamber and the gas-liquid separation chamber. Here the mixture undergoes a decompression (pressure < 5 MPa) to induce the separation of the CO2 from the organic solvent. Further information and a schematic representation of the apparatus have been given elsewhere [25].
An SAS experiment begins by delivering supercritical CO2 to the precipitation chamber until the desired pressure is reached. CO2 steady flow of 8.5 kg/h is established; then pure DMSO is sent through the liquid pump to the precipitation chamber with the aim of obtaining steady state composition conditions during the HCPT precipitation. At this point, the flow of the pure DMSO is stopped and the HCPT/DMSO liquid solution is delivered through the nozzle of 150 μm. Once injected the fixed quantity of HCPT/DMSO solution, the liquid pump is stopped. However, supercritical CO2 continues to flow for 30 min to wash the stainless steel frit vessel of 200 nm from the residual content of liquid solubilized in the supercritical antisolvent. If the final purge with pure CO2 is not performed, DMSO condenses during the depressurization and redissolves the micronized HCPT.

2.3. Optimization of SAS Process

An orthogonal OA16 (4)5 test design was used to investigate the optimal micronized condition of HCPT. The SAS experiment was carried out with 4 factors and 4 levels, namely: concentration of HCPT solution (0.5, 1.5, 3.0, 5.0 mg/mL), drug solution flow rate (3.3, 6.6, 9.9, 13.2 mL/min), precipitation temperature (35, 46, 57, 68 °C) and precipitation pressure (10, 15, 20, 25 MPa). The range of each factor level was based on the results of preliminary experiments. The mean particle size (MPS) of micronized HCPT (nm) was the dependent variable. The micronized HCPT obtained from the above 16 tests (Table 1) was operated following the method in the Section 3.2.

2.4. Physicochemical Properties of HCPT Nanoparticles

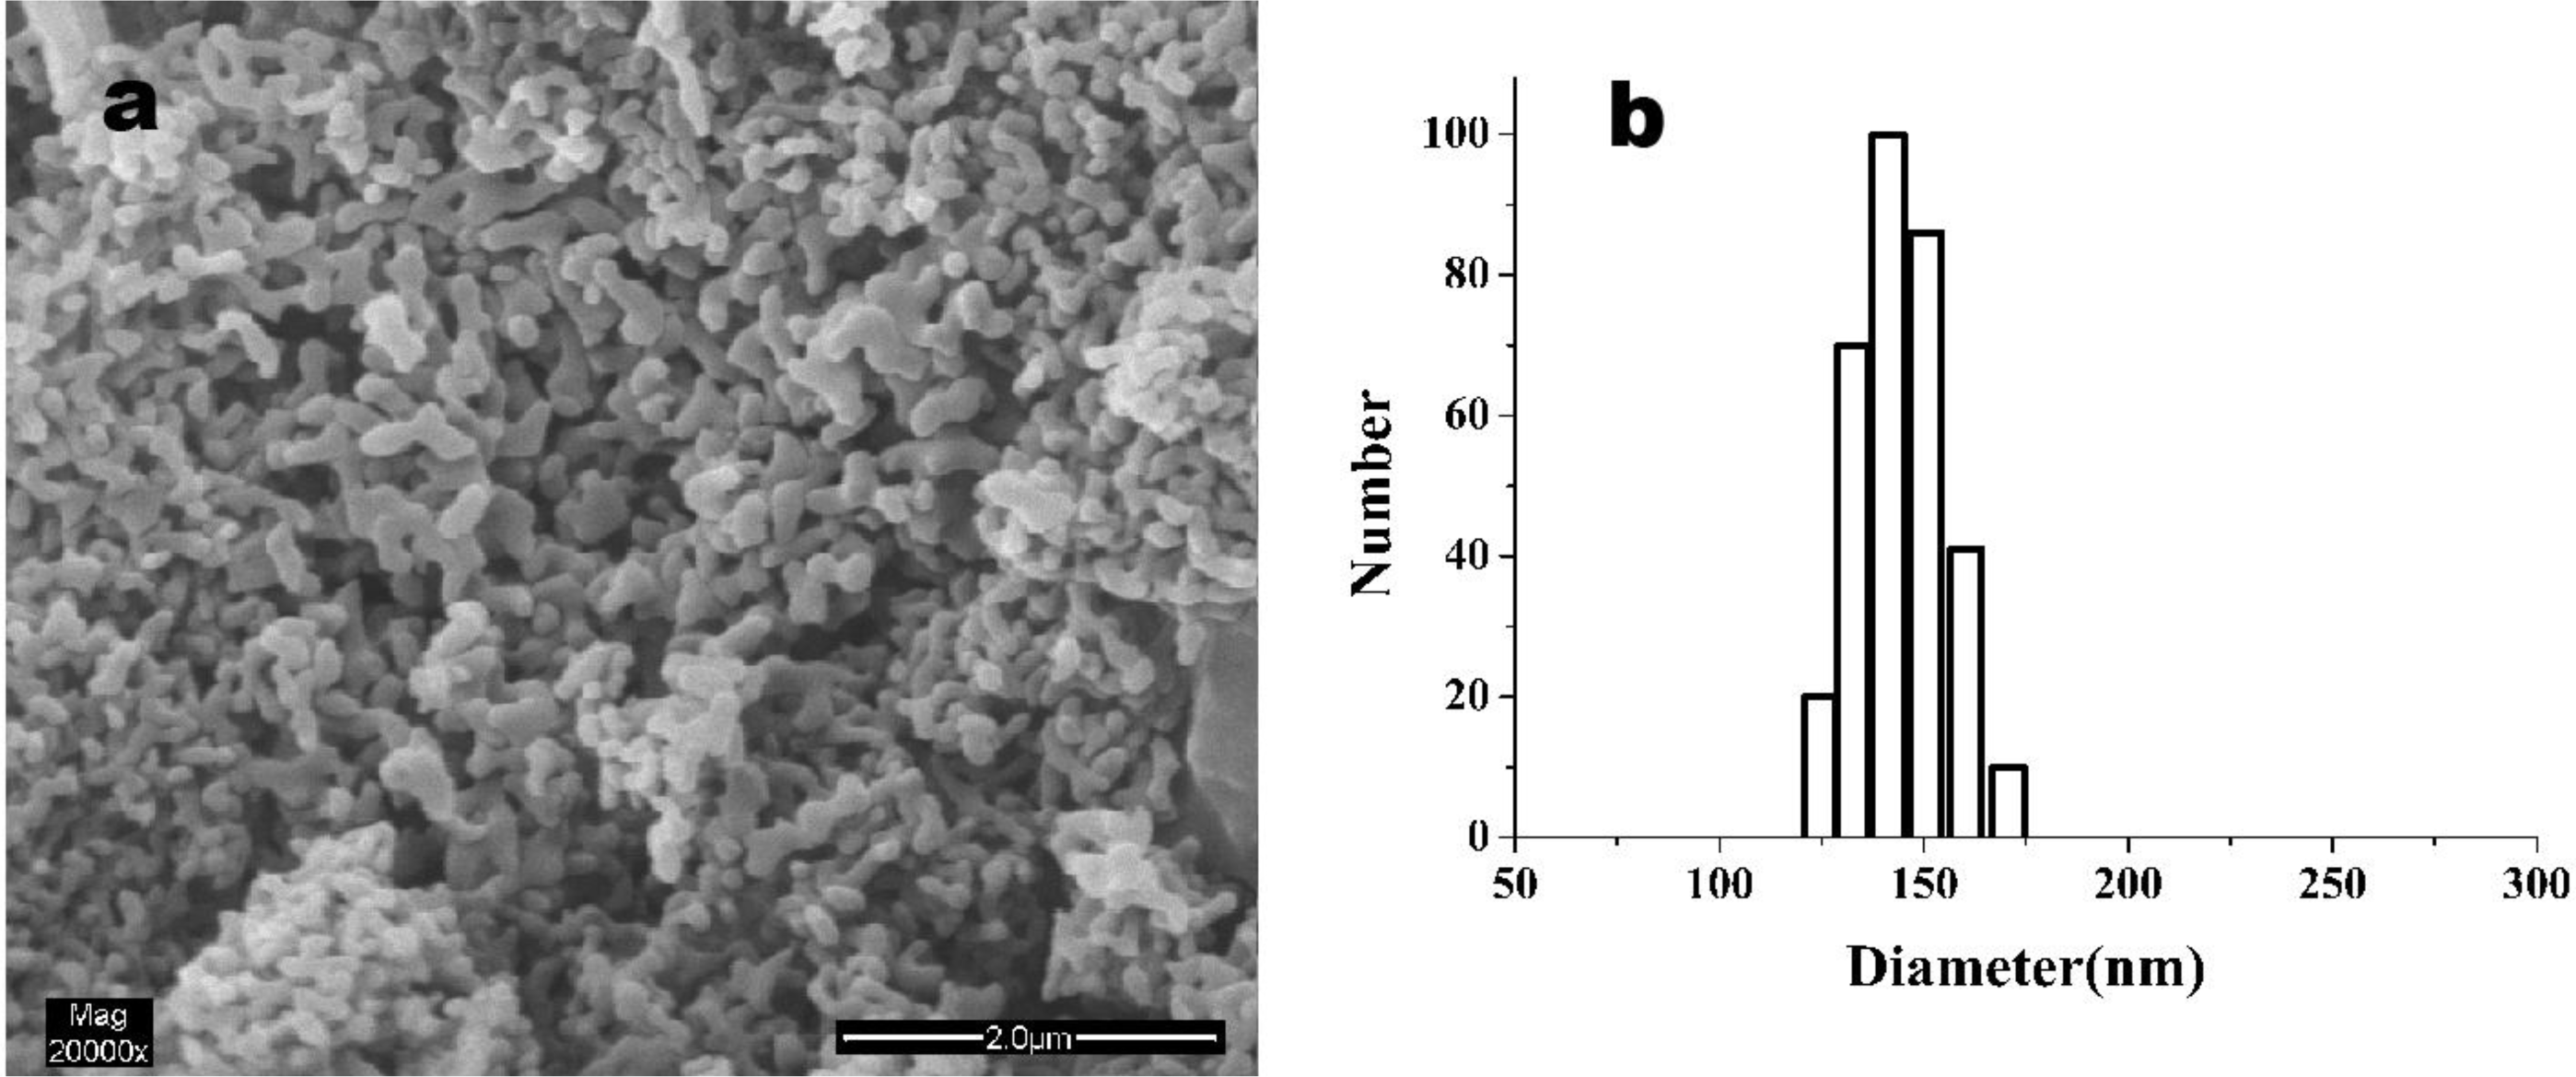
2.4.1. Research of the Morphology

The morphology analysis of HCPT particles was carried out using SEM (Quanta 200, FEI). The samples were prepared by direct deposition of the powders onto a carbon tape placed on the surface of an aluminium stub. Before analysis, the samples were coated with gold for 4 min using a sputter coater.

2.4.2. Dynamic Light Scattering (DLS)

Micronized HCPT was suspended in filtered pure water and special cares were taken to eliminate dust and to avoid the aggregation of particles. The water was pre-saturated with HCPT to avoid dissolution of the micronized particles. The suspension was analyzed in DLS (ZetaPALS, Brookhaven Instruments). Every measurement was repeated at least three times.

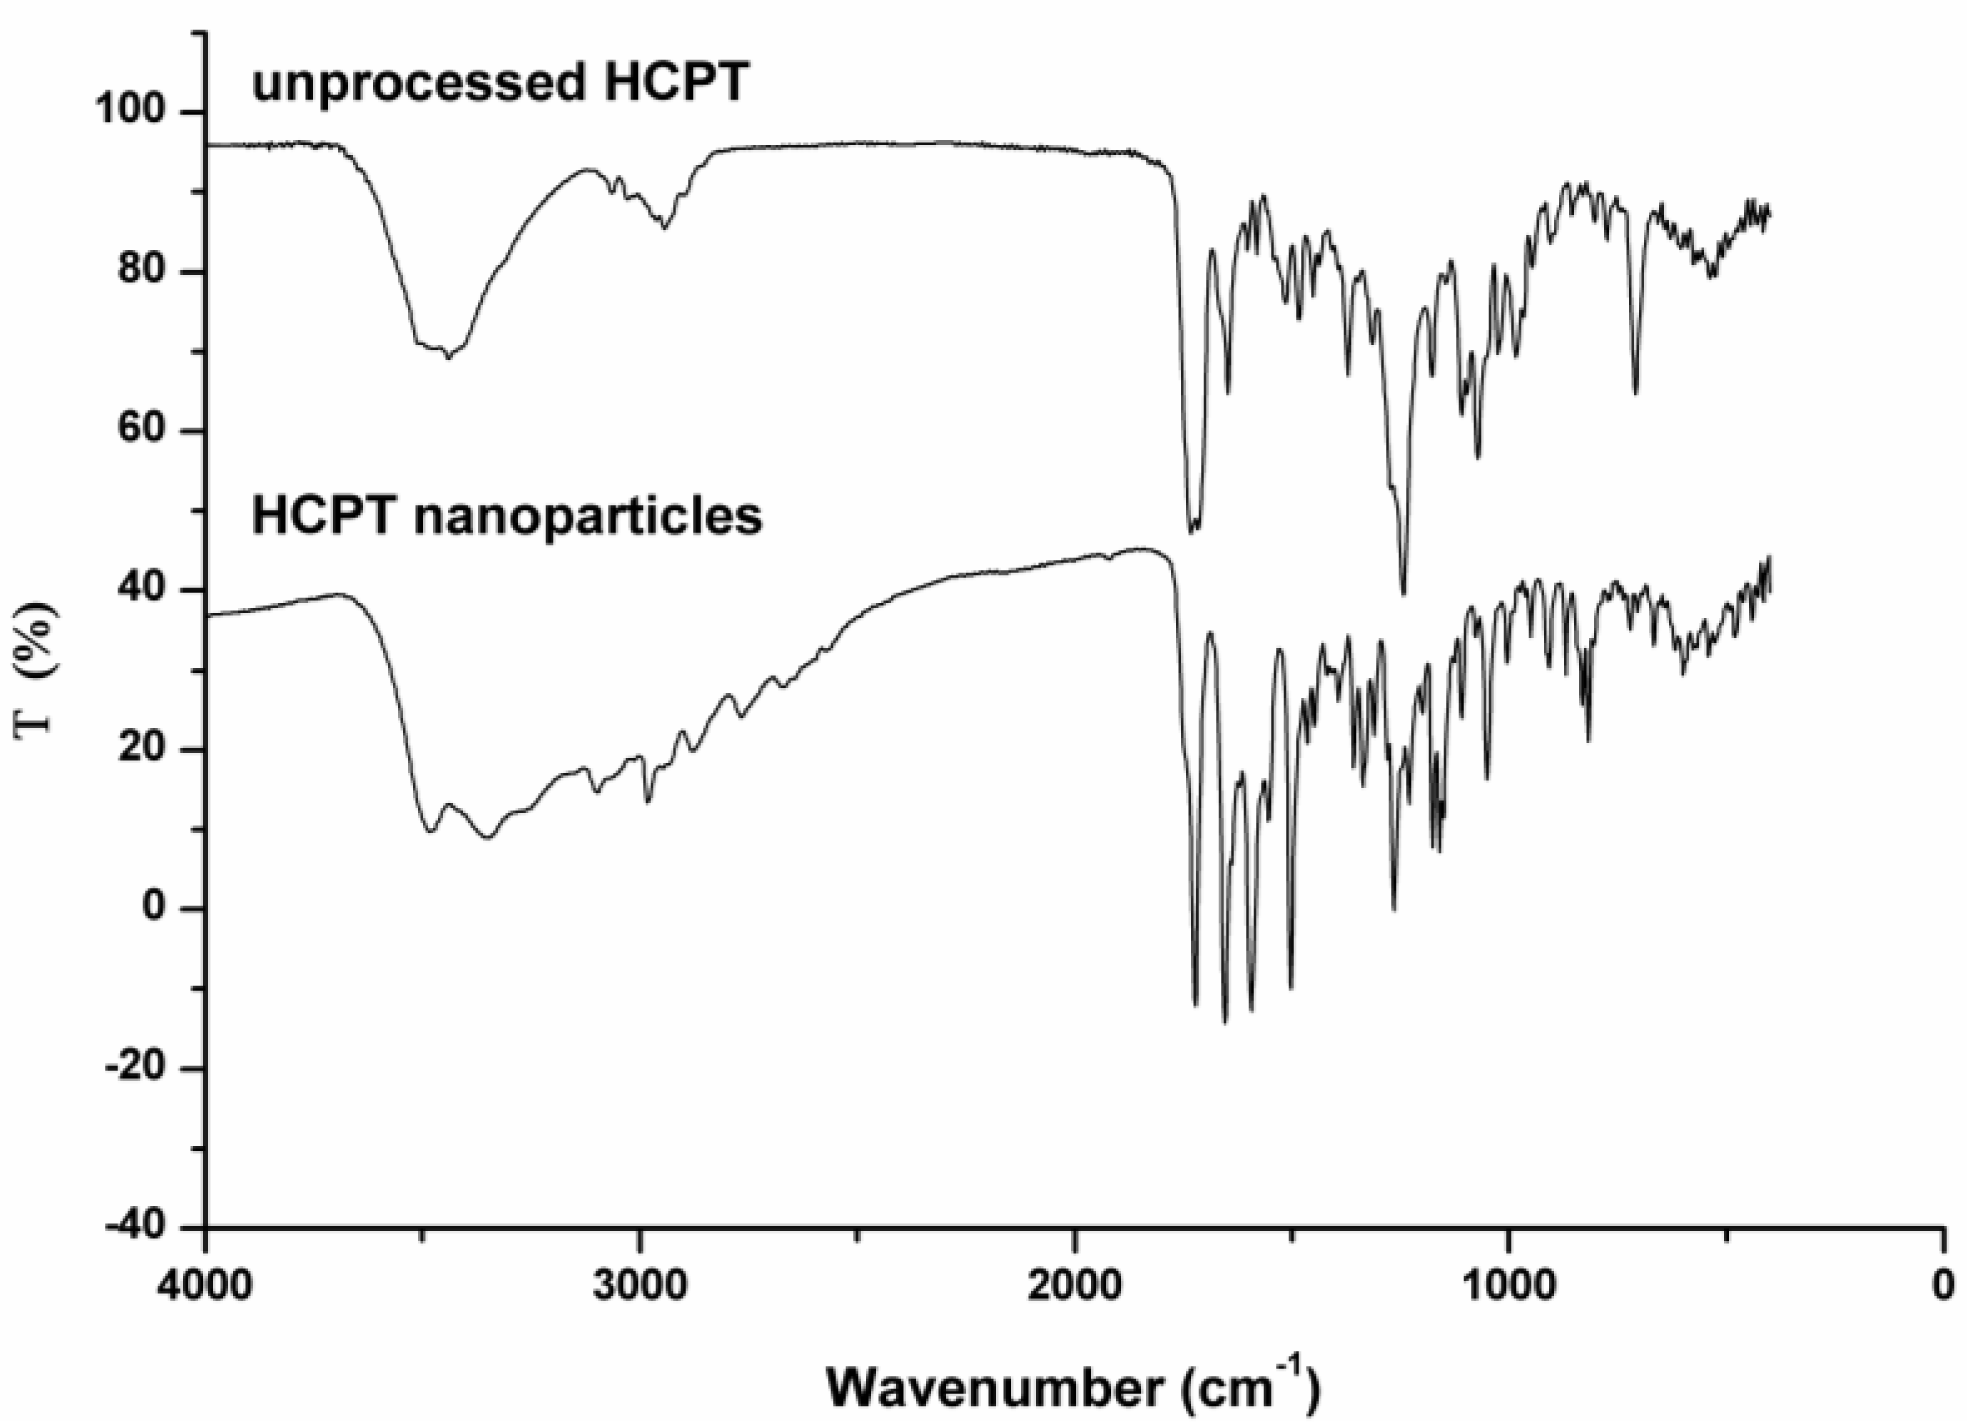
2.4.3. FTIR Analysis

The HCPT particles were diluted with KBr mixing powder at 1% and separately pressed to obtain self-supporting disks. The FTIR spectrum was obtained by IRAffinity-1 (SHIMADZU, Jepan) and recorded in the wave number range of 4000–500 cm−1 at a resolution of 4 cm−1.

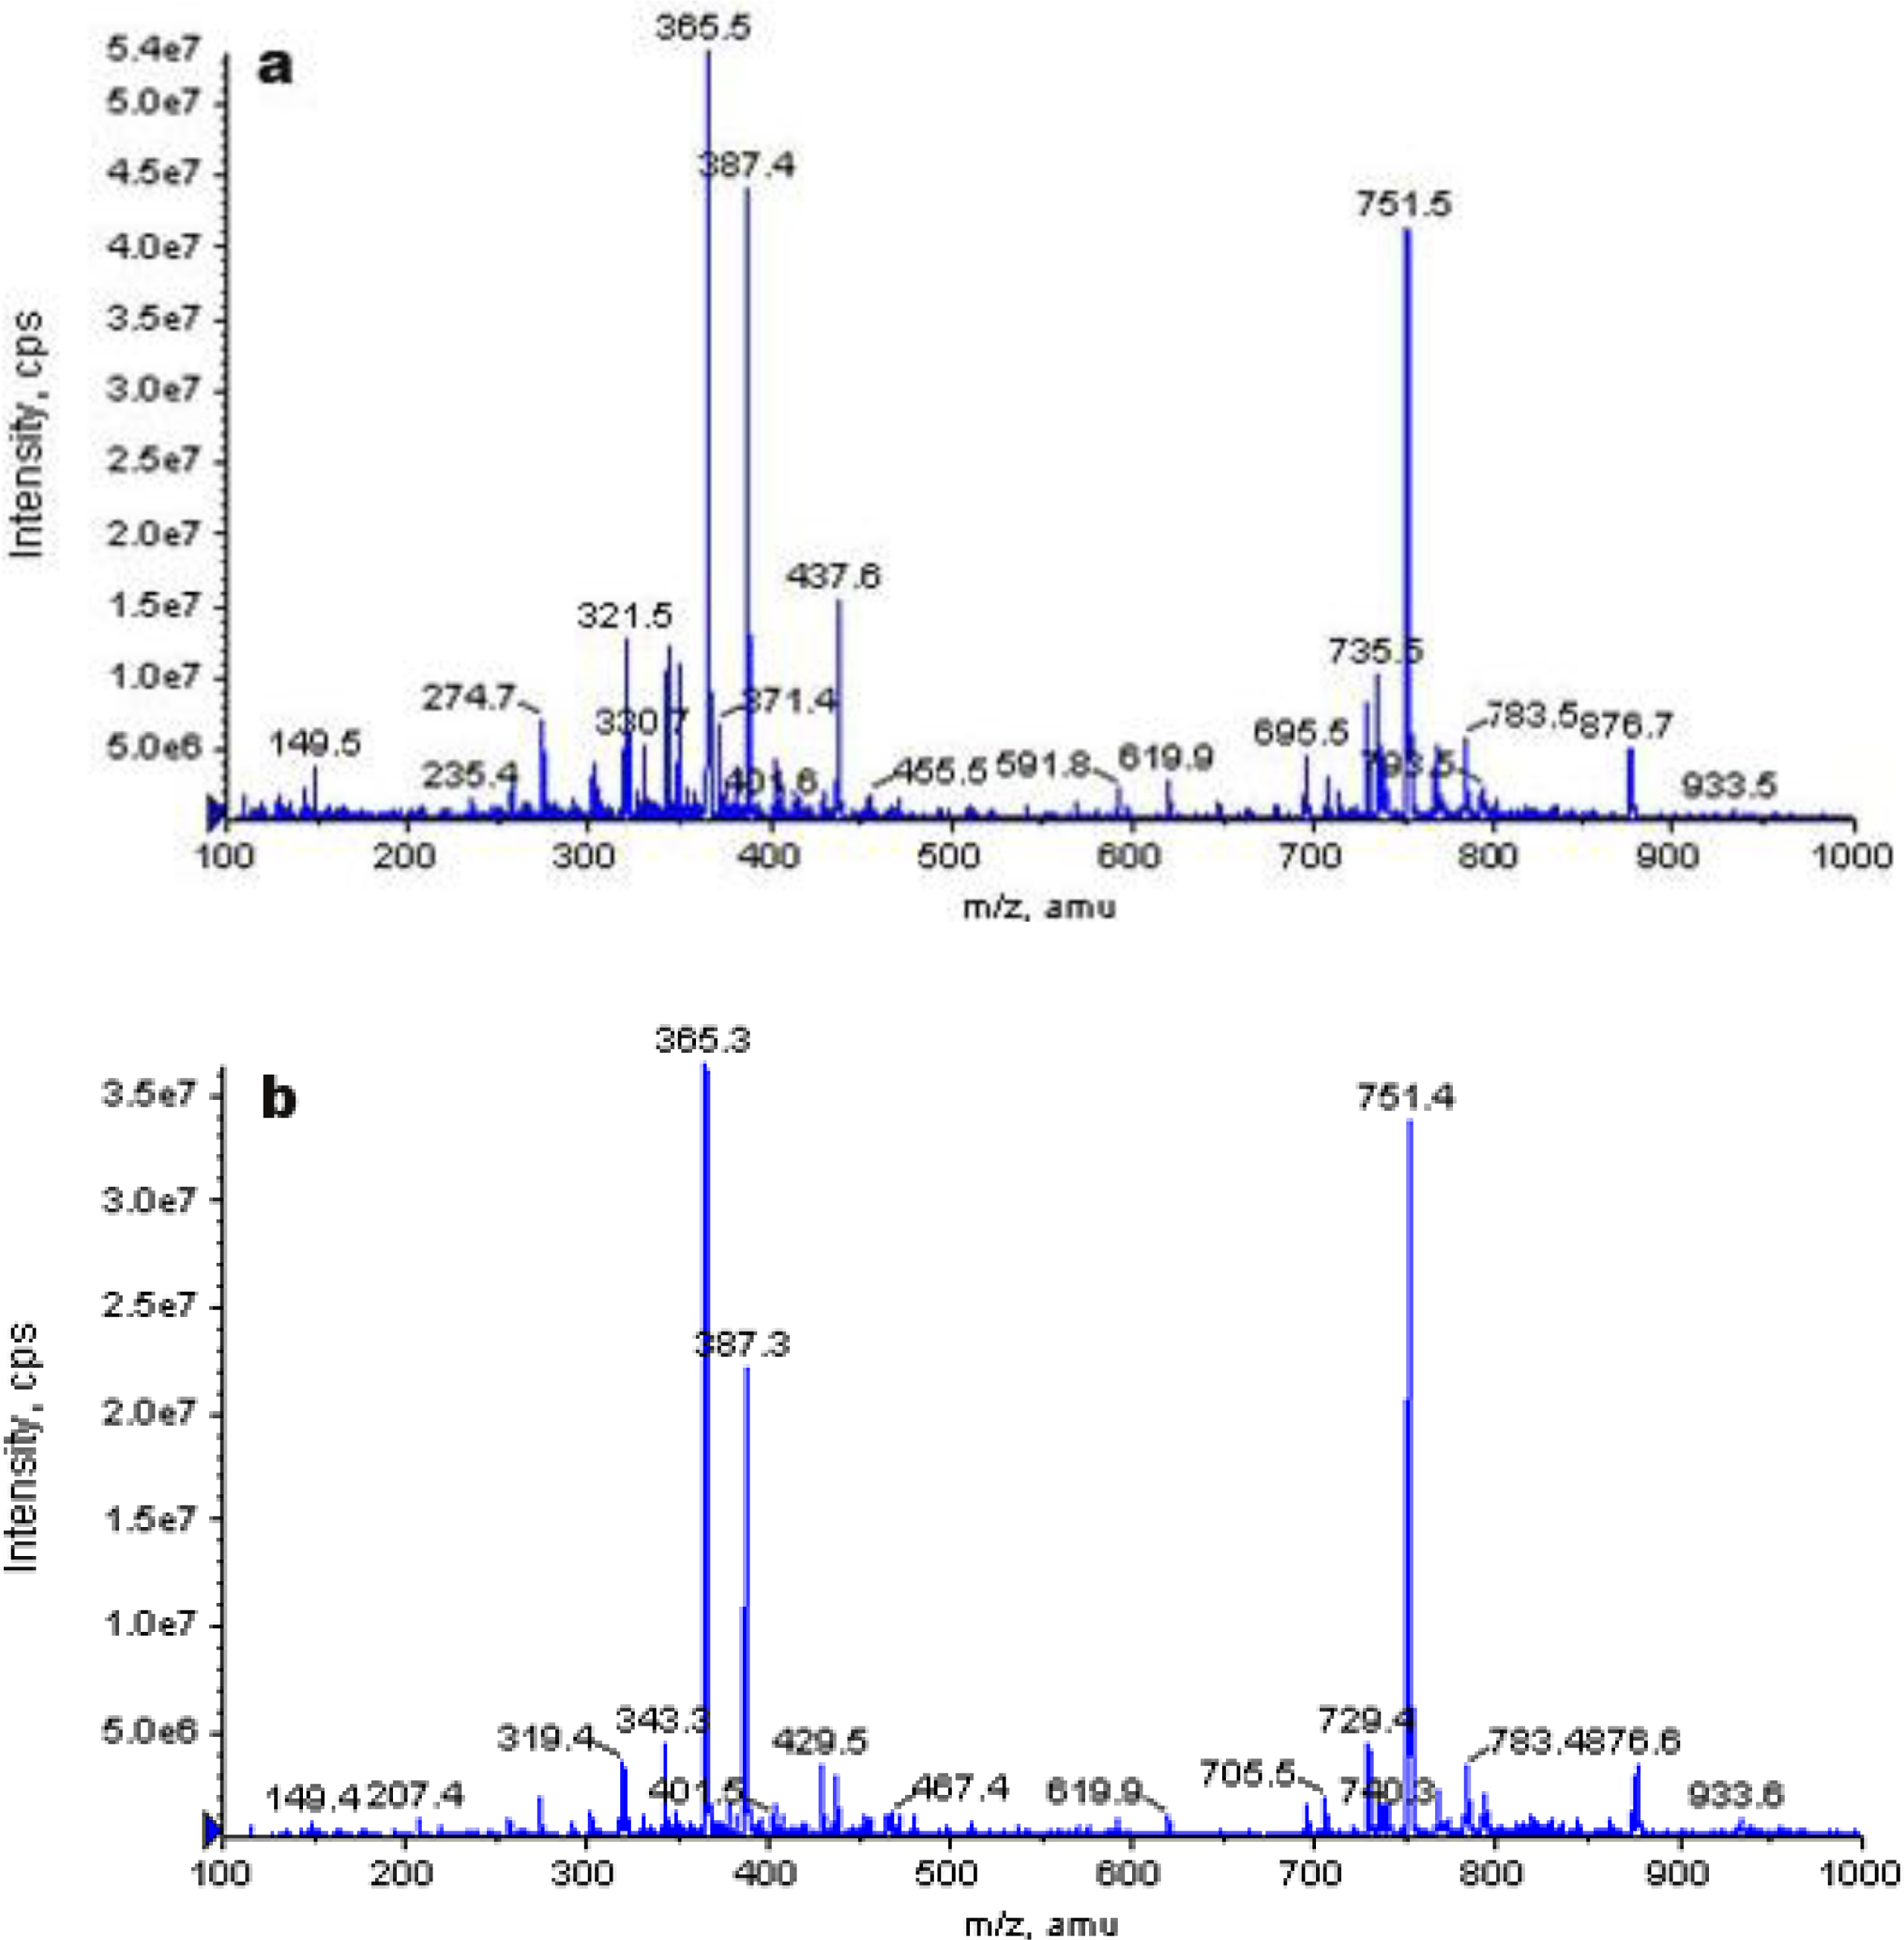
2.4.4. LC-MS Analysis
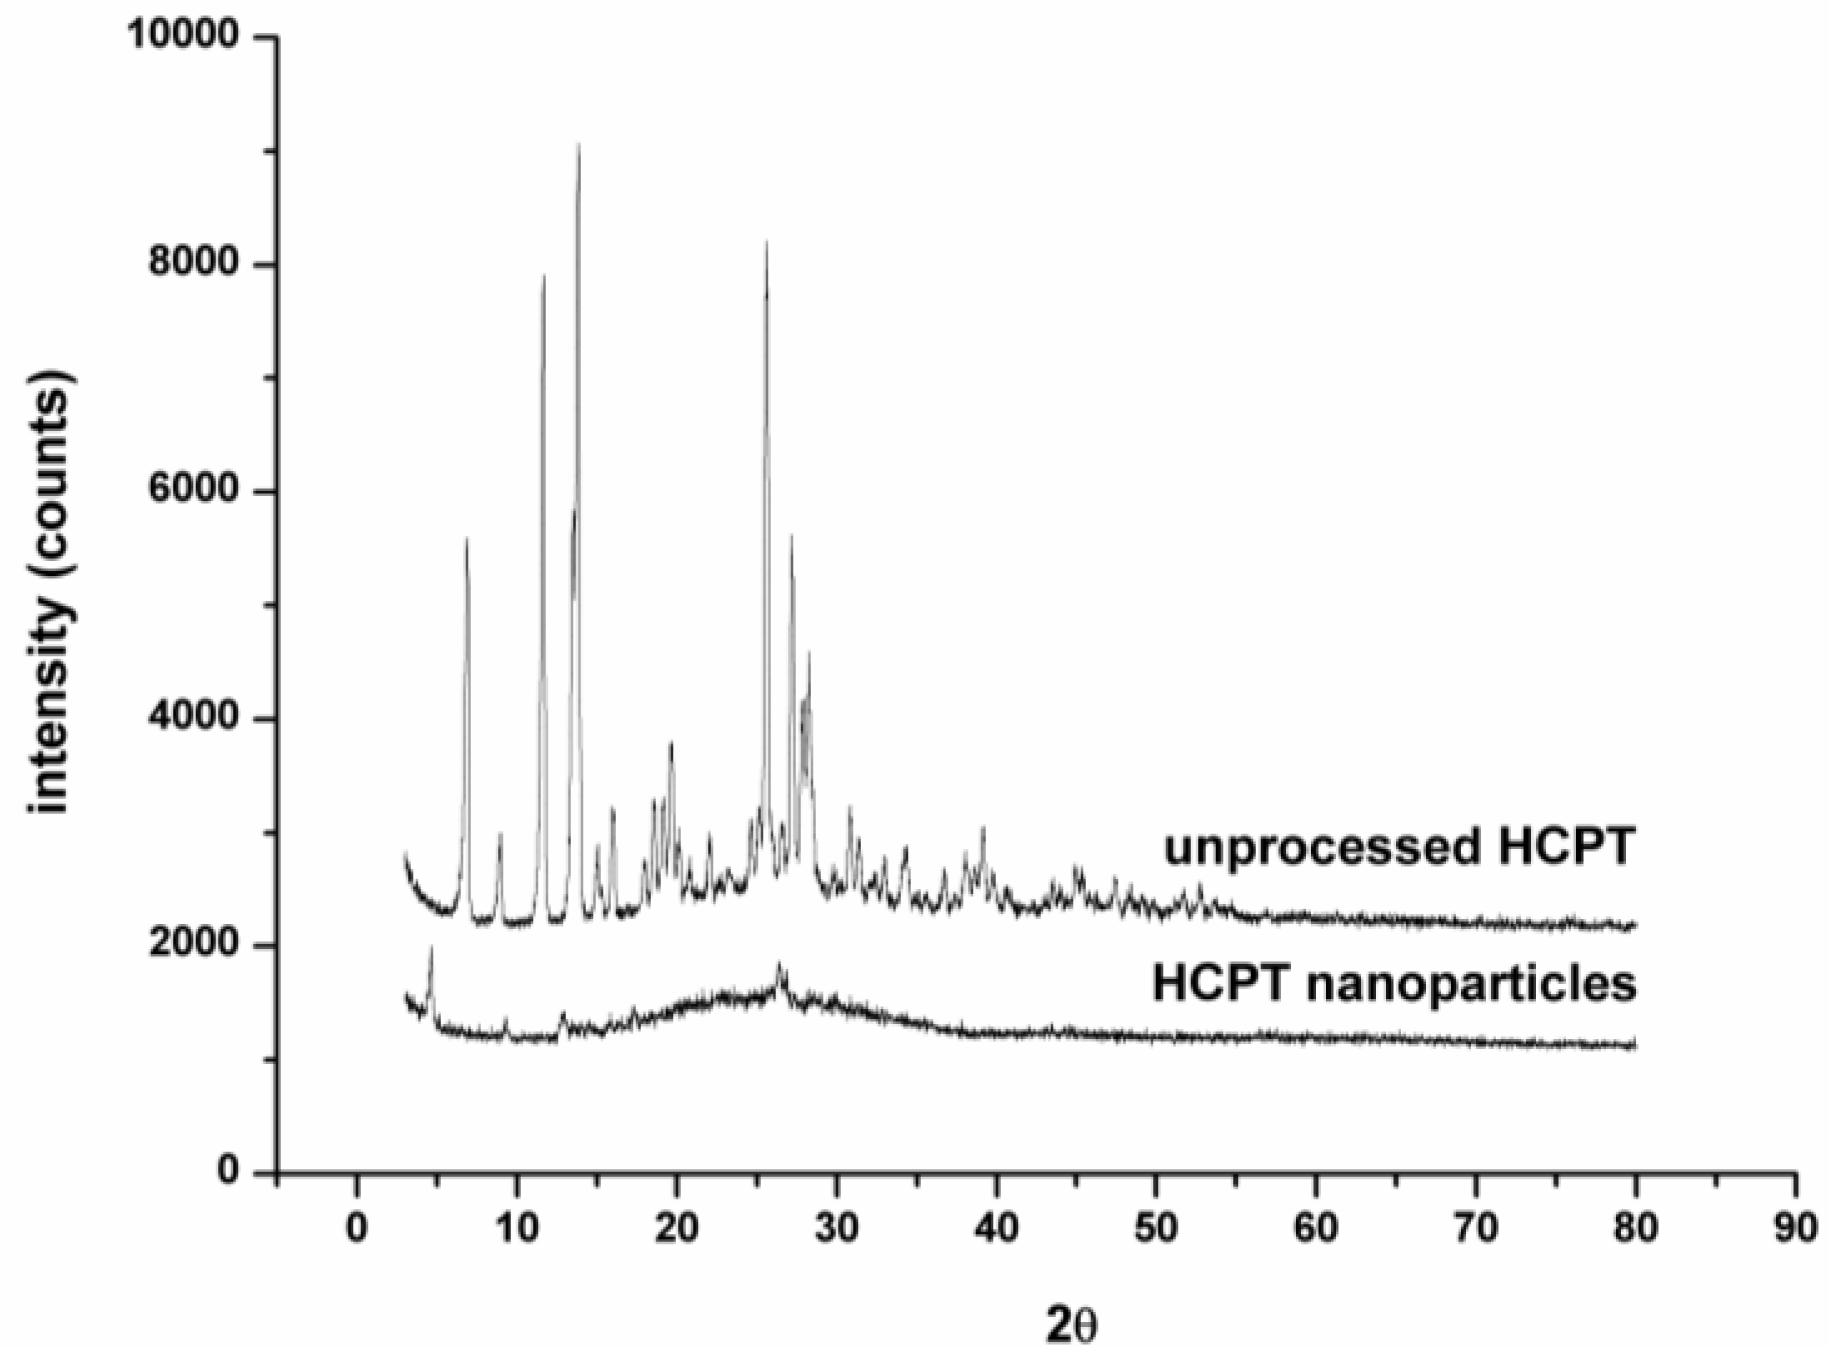
The HCPT particles were dissolved in ethanol and LC-MS was obtained by analyst 1.4 of AB API 3000 (USA). The mass spectrometer was operated in positive ion mode.

2.4.5. XRD Analysis

10 mg samples of HCPT particles, forming a weighted dispersion on a glass slide, were evaluated using an X-ray powder diffractometer (Philips, Xpert-Pro, The Netherlands). The samples were irradiated using a Cu target tube at 30 mA and 50 kV. The samples were filled to the same depth inside the sample holder by leveling with a spatula. The scanning rate (5° min.) was constant for all XRD analysis.

2.4.6. DSC Analysis

Thermal analysis was carried out using DSC (TA instruments, model DSC 204) for HCPT particles. All thermal analyses were performed in an inert atmosphere (N2). Analysis was performed for 5.0 mg samples at a temperature heating rate of 5 °C/min and a temperature range of 20–265 °C.

2.4.7. Dissolution Studies in Vitro

100 mg sample was added to a 500 mL dissolution medium (6.4 g Na2HPO4, 12H2O; 0.6 g KH2PO4; 5.85 g NaCl in 1000 mL distilled water; pH 7.4). Bath temperature and paddle speed were set at 37 ± 0.5 °C and 100 rpm. At selected periods of 5, 10, 15, 30, 45, 60 and 120 min, 2 mL aliquots were withdrawn without media replacement, filtered, and analyzed using reversed-phase HPLC (waters) at λ = 266 nm. The data was expressed as a mean value ± S.D (n = 6). The percentage of cumulated dissolution was defined as the sum of the mass of dissolved HCPT at time t, divided by the mass of added HCPT (100 mg). The dissolution profiles were plotted as the percentage of cumulated dissolution versus incubation time.
Filtered samples were appropriately diluted with methanol and assayed for HCPT concentration by HPLC. Chromatographic analyses were performed on a waters HPLC system consisting of a pump (Model 1525), an auto-sampler (Model 717 plus), UV detector (Waters 2487 Dual λ Absorbance Detector). The C18 reverse phase column (Diamonsil, μm, 4.6 mm × 250 mm, Dikma Technologies) was used at room temperature. The mobile phase consisted of 70% acetonitrile delivered at 1.0 mL/min. The injection volume was 10 μL. The signal was monitored at 266 nm.

3. Results and Discussion

3.1. Optimization Study

The first step in the SAS micronization process is to optimize the operating conditions to obtain a minimum MPS of micronized HCPT. Since various parameters potentially affect the micronization process, the optimization of the experimental conditions is a critical step in developing an SAS method. In fact, the concentration of drug solution, precipitation temperature, precipitation pressure and drug solution flow rate are generally considered the most important factors that affect the MPS of HCPT. The investigated levels of each factor were selected depending on the preliminary experiment results of the single-factor. The optimization of the suitable operating conditions in SAS can be carried out step by step or by using an experimental design. In the present study, all selected factors were examined using an orthogonal OA16 (45) test design. The total evaluation index was used to analyse by statistical methods. The analysis results of orthogonal test, performed by statistical software Design Expert 7.0, are presented in Table 1. Table 2 lists the data of the analysis of variance (ANOVA) table of this experiment. The results of experiments presented in Table 2 indicate that the MPS of micronization HCPT varied between 210.5 and 900.7 nm. The maximum MPS was found for trial 16 and the lowest for trial 2. The factors influence the MPS of micronization HCPT were listed in a decreasing order as follows: A > C > B > D according to the R value. So, the minimum MPS of micronization HCPT was obtained when the concentration of HCPT solution, precipitation temperature, precipitation pressure and drug solution flow rate were A1B1C3D2 (0.5 mg/mL, 35 °C, 20 MPa and 6.6 mL/min), respectively. Through a confirmatory test, smaller micronized HCPT was obtained, with a MPS of 180 ± 20.3 nm.

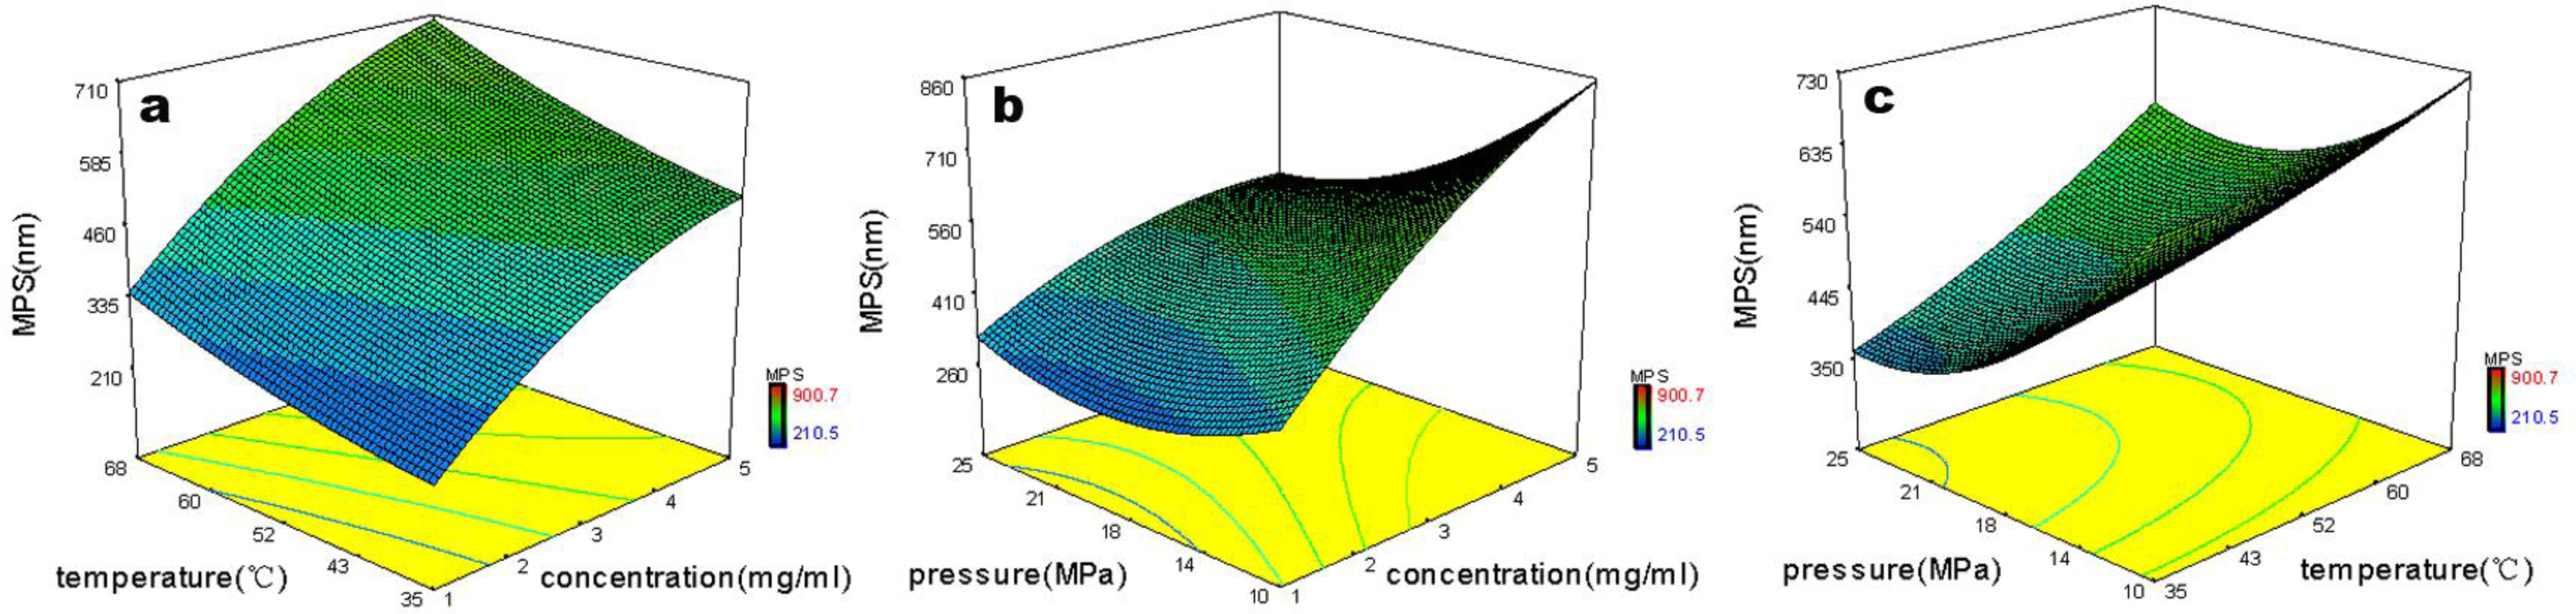
3.2. Effect of Operating Conditions on the MPS of Micronized HCPT

Analysis of variance showed that the concentration of HCPT solution, precipitation temperature and precipitation pressure had a significant effect on the MPS of micronized HCPT (p < 0.05) in the selected ranges (Table 2). However, drug solution flow rate has no significant influence on the MPS.
An orthogonal experimental design allows the separation of the effects of each individual factor investigated. However, it is interesting to analyze the effects of two factors on MPS. A nonlinear regression was applied using Design Expert 7.0 software to plot surface responses. The correlation related the MPS of micronized HCPT to the main variables-concentration of HCPT solution, precipitation temperature and precipitation pressure.
Equation (1) is expressed as follows:
Y = 915.8459 + 191.1776 × A 8.0994 × B 67.5255 × C + 0.3836 × A × B 4.6189 × A × C + 0.3836 × A × B 4.6189 × A × C + 0.2973 × B × C 10.4852 × A 2 + 0.0640 × B 2 + 1.4603 × C 2
Where Y is the MPS of micronized HCPT (nm), A is the concentration of HCPT solution (MPa), B is the precipitation temperature (°C), and C is precipitation pressure (MPa). The correlation coefficient is 0.9591.
Figure 3 shows the three-dimensional response surfaces which were constructed to show the effects of the SAS process variables on MPS of micronized HCPT (Y). Figure 3a–c shows the interaction effect of precipitation temperature and concentration of HCPT solution, precipitation pressure and concentration of HCPT solution, and precipitation pressure and precipitation temperature on the MPS, respectively. The MPS of micronized HCPT was found to increase with increasing precipitation temperature and concentration of HCPT solution and decrease with increasing precipitation pressure.

3.3. Morphology of Processed HCPT

Figure 4 shows the SEM photomicrograph of original HCPT particles. As we can see, commercial HCPT particles are not uniform and basically pillar or bar shaped. The average particle size was found to be about 1 × 1 × 50 μm. Figure 5a shows the SEM images of HCPT nanoparticles precipitated from DMSO under the optimum SAS process condition (0.5 mg/mL of concentration of HCPT solution, 35 °C of precipitation temperature, 20 MPa of precipitation pressure and 6.6 mL/min of HCPT solution flow rate), from which it is obvious that the HCPT nanoparticles are close to ellipsoidal with the MPS of 180 ± 20.3 nm and the particle size distribution (PSD) is shown in Figure 5b.

3.4. Physicochemical Properties of HCPT Nanoparticles

3.4.1. FTIR Analysis

We performed some analysis on original HCPT particles and HCPT nanoparticles to obtain information on the change of chemical structure after SAS processing. It can be seen that FTIR spectra between unprocessed and HCPT nanoparticles do not show any significant differences (Figure 6). Several characteristic IR absorption bands and their assignments are shown as follows: 3494 and 3346 cm−1 (the O–H stretching mode), 3100–2750 cm−1 (the C–H stretching vibration), 1723 cm−1 (C═O stretching vibration of lactone), 1653 cm−1 (the C═O stretching vibration of amide), 1593 and 1502 cm−1 (the aromatic ring mode), 1266 and 1051 cm–1 (the C–O and/or C–N stretching mode).

3.4.2. LC-MS Analysis

The unprocessed and processed HCPT samples were evaluated by using LC-MS to determine the molecular weights, as shown in Figure 7. It can be seen that no modification occurred in molecular weight (364.5). The two forms exhibit the mass spectral peak, at 365.5, coming from the [C20H16N2O5 + H]+ peak. This explains why there were no varieties about chemistry structure of HCPT before/after SAS process. Therefore, the SAS process has not induced degradation of HCPT.

3.4.3. X-ray Analysis
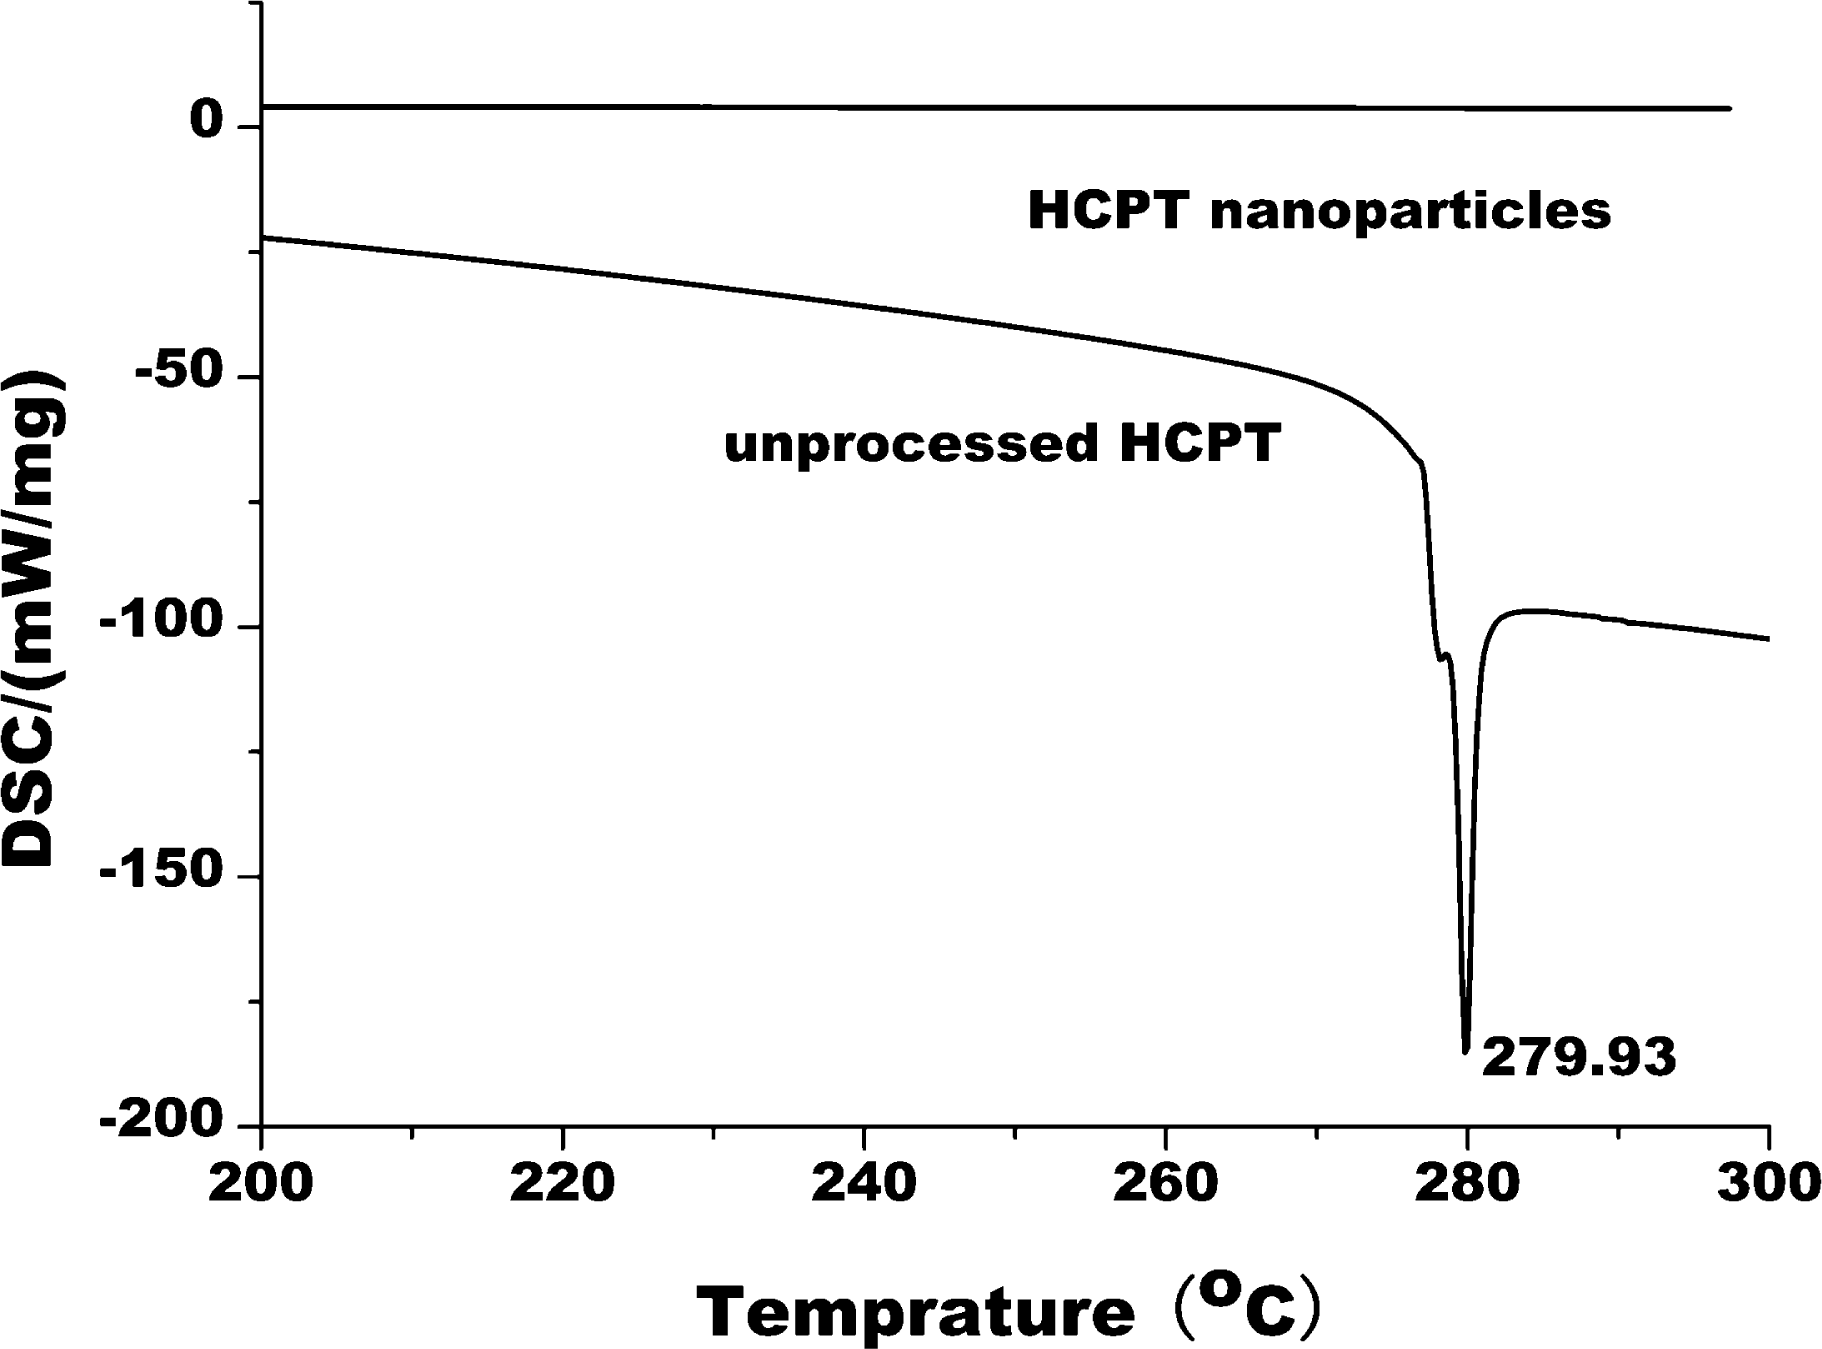
In order to further investigate particles, crystalline XRD analysis was performed. Figure 8 shows the XRD results for unprocessed HCPT particles and HCPT nanoparticles. The presence of several distinct peaks in the XRD of unprocessed HCPT at the diffraction angles of 2θ = 13.821°, 11.659°, 25.640°, 13.521°, 6.900°, 28.260°, 27.919° and 27.219° reveals that the drug is present as a crystalline form. On the other hand, HCPT nanoparticles were characterized by the complete absence of any diffraction peak corresponding to unprocessed HCPT. This fact suggests that HCPT particles after SAS processing are no longer present in crystalline form, but exist in the amorphous state. Less crystalline smaller drug particles are higher in the dissolution rate or bioavailability than crystals and, thus, the therapeutic action is obtained in shorter times.

3.4.4. DSC Analysis

Figure 9 shows the DSC curves of unprocessed HCPT particles and HCPT nanopaticles. The DSC curves of unprocessed HCPT, a sharp endotherm at 279.93 °C were observed. The sharp endotherm at 279.93 °C might be due to the melting point of HCPT. However, no endotherms were observed in the DSC curves for HCPT nanoparticles. This result indicates that HCPT is no longer present as a crystalline form when processed using SAS, but exists in the amorphous state.

3.4.5. Dissolution Studies in Vitro

Dissolution profiles of HCPT particles are shown in Figure 10. The HCPT nanoparticles showed a more rapid dissolution than the unprocessed HCPT. After 120 min, the dissolution rate of HCPT nanoparticles and unprocessed HCPT were 85.89% and 7.64%, respectively. The HCPT nanoparticles had solubility eleven times higher than the unprocessed HCPT material. The dramatic increase in drug dissolution rate can be explained by the reduction of particle size resulting in an increased specific surface area. The literature has also discussed how an increase in the amorphous content and porosity of the micronized drugs led to an enhanced dissolution rate [26].

4. Conclusions

In the present work, a process for micronization of HCPT by supercritical antisolvent (SAS) has been developed. Of the four factors that have an effect on SAS micronization of HCPT from DMSO, three of the factors-concentration of HCPT solution, precipitation temperature and precipitation pressure-have a significant effect on the MPS of micronized HCPT, while the drug solution flow rate showed insignificant effects. The optimum micronization conditions are as follows: 35 °C of precipitation temperature, 20 MPa of precipitation pressure, the flow rate ratio of CO2 and HCPT solution 19.55 and 0.5 mg/mL of HCPT solution concentration. Under the optimum conditions, HCPT nanoparticles with an MPS of 180 ± 20.3 nm were obtained. The characterization data of the HCPT nanoparticles using SEM, DLS, FTIR, LC-MS, XRD and DSC showed on one hand, no degradation of HCPT is induced by the SAS process, on the other hand, the obtained HCPT particles have lower crystallinity. Additionally, there is a great increase of dissolution rate in HCPT nanoparticles by the SAS process compared to unprocessed HCPT. In conclusion, the SAS process proposed in the study proved an efficient method for the preparation of HCPT nanoparticles.

Acknowledgments

The authors are grateful for the precious comments and careful corrections made by anonymous reviewers. The authors would also like to acknowledge the financial support from the Special Fund for Forestry Scientific Research in the Public Interest (2010040072), 948 Project of the State Forestry Administration of China (2010-4-20) and the Fundamental Research Funds for the Central Universities (DL09BB08). The authors are also grateful to Lin Zhang for performing the LC-MS analysis.

References

  1. Yang, L; Cui, F; Cun, D; Tao, A; Shi, K; Lin, W. Preparation, characterization and biodistribution of the lactone form of 10-hydroxycamptothecin (HCPT)-loaded bovine serum albumin (BSA) nanoparticles. Int. J. Pharm 2007, 340, 163–172. [Google Scholar]
  2. Wang, SL; Lin, SY; Hsieh, TF; Chan, SA. Thermal behavior and thermal decarboxylation of 10-hydroxycamptothecin in the solid state. J. Pharm. Biomed. Anal 2007, 43, 457–463. [Google Scholar]
  3. Hong, M; Zhu, S; Jiang, Y; Tang, G; Pei, Y. Efficient tumor targeting of hydroxycamptothecin loaded PEGylated niosomes modified with transferrin. J. Control. Release 2009, 133, 96–102. [Google Scholar]
  4. Ma, J; Liu, CL; Zhu, PL; Jia, ZP; Xu, LT; Wang, R. Simultaneous determination of the carboxylate and lactone forms of 10-hydroxycamptothecin in human serum by restricted-access media high-performance liquid chromatography. J. Chromatogr. B 2002, 772, 197–204. [Google Scholar]
  5. Zhao, YX; Hua, HY; Chang, M; Liu, WJ; Zhao, Y; Liu, HM. Preparation and cytotoxic activity of hydroxycamptothecin nanosuspensions. Int. J. Pharm 2010, 392, 64–71. [Google Scholar]
  6. Takayama, H; Watanabe, A; Hosokawa, M; Chiba, K; Satoh, T; Aimi, N. Synthesis of a new class of camptothecin derivatives, the long-chain fatty acid esters of 10-hydroxycamptothecin, as a potent prodrug candidate, and their in vitro metabolic conversion by carboxylesterases. Bioorg. Med. Chem. Lett 1998, 8, 415–418. [Google Scholar]
  7. Pessah, N; Reznik, M; Shamis, M; Yantiri, F; Xin, H; Bowdish, K; Shomron, N; Ast, G; Shabat, D. Bioactivation of carbamate-based 20(S)-camptothecin prodrugs. Bioorg. Med. Chem 2004, 12, 1859–1866. [Google Scholar]
  8. Ohwada, J; Ozawa, S; Kohchi, M; Fukuda, H; Murasaki, C; Suda, H; Murata, T; Niizuma, S; Tsukazaki, M; Ori, K; Yoshinari, K; Itezono, Y; Endo, M; Ura, M; Tanimura, H; Miyazaki, Y; Kawashima, A; Nagao, S; Namba, E; Ogawa, K; Kobayashi, K; Okabe, H; Umeda, I; Shimma, N. Synthesis and biological activities of a pH-dependently activated water-soluble prodrug of a novel hexacyclic camptothecin analog. Bioorg. Med. Chem. Lett 2009, 19, 2772–2776. [Google Scholar]
  9. Angenault, S; Thirot, S; Schmidt, F; Monneret, C; Pfeiffer, B; Renard, P. Cancer chemotherapy: A SN-38 (7-ethyl-10-hydroxycamptothecin) glucuronide prodrug for treatment by a PMT (Prodrug MonoTherapy) strategy. Bioorg. Med. Chem. Lett 2003, 13, 947–950. [Google Scholar]
  10. Zhang, L; Yang, M; Wang, Q; Li, Y; Guo, R; Jiang, X; Yang, C; Liu, B. 10-Hydroxycamptothecin loaded nanoparticles: Preparation and antitumor activity in mice. J. Control. Release 2007, 119, 153–162. [Google Scholar]
  11. Wang, A; Li, S. Hydroxycamptothecin-loaded nanoparticles enhance target drug delivery and anticancer effect. BMC Biotechnol 2008, 8, 46. [Google Scholar]
  12. Shenderova, A; Burke, TG; Schwendeman, SP. Stabilization of 10-hydroxycamptothecin in poly(lactide-co-glycolide) microsphere delivery vehicles. Pharm. Res 1997, 14, 1406–1414. [Google Scholar]
  13. Mallery, SR; Shenderova, A; Pei, P; Begum, S; Ciminieri, JR; Wilson, RF; Casto, BC; Schuller, DE; Morse, MA. Effects of 10-hydroxycamptothecin, delivered from locally injectable poly(lactide-co-glycolide) microspheres, in a murine human oral squamous cell carcinoma regression model. Anticancer Res 2001, 21, 1713–1722. [Google Scholar]
  14. Lu, B; Zhang, Z. Novel colon-specific microspheres with highly dispersed hydroxycamptothecin cores: Their preparation, release behavior, and therapeutic efficiency against colonic cancer. J. Pharm. Sci 2006, 95, 2619–2630. [Google Scholar]
  15. Zhao, Y; Gao, J; Sun, X; Chen, H; Wu, L; Liang, W. Enhanced nuclear delivery and cytotoxic activity of hydroxycamptothecin using o/w emulsions. J. Pharm. Pharm. Sci 2007, 10, 61–70. [Google Scholar]
  16. Zhang, C; Ding, Y; Yu, LL; Ping, Q. Polymeric micelle systems of hydroxycamptothecin based on amphiphilic N-alkyl-N-trimethyl chitosan derivatives. Colloid. Surface. B 2007, 55, 192–199. [Google Scholar]
  17. Zhou, YY; Du, YZ; Wang, L; Yuan, H; Zhou, JP; Hu, FQ. Preparation and pharmacodynamics of stearic acid and poly (lactic-co-glycolic acid) grafted chitosan oligosaccharide micelles for 10-hydroxycamptothecin. Int. J. Pharm 2010, 393, 144–152. [Google Scholar]
  18. Pu, X; Sun, J; Wang, Y; Liu, X; Zhang, P; Tang, X; Pan, W; Han, J; He, Z. Development of a chemically stable 10-hydroxycamptothecin nanosuspensions. Int. J. Pharm 2009, 379, 167–173. [Google Scholar]
  19. Tavares Cardoso, MA; Geraldes, V; Cabral, JMS; Palavra, AMF. Characterization of minocycline powder micronized by a supercritical antisolvent (SAS) process. J. Supercrit. Fluid 2008, 46, 71–76. [Google Scholar]
  20. Kim, M-S; Jin, S-J; Kim, J-S; Park, HJ; Song, H-S; Neubert, RHH; Hwang, S-J. Preparation, characterization and in vivo evaluation of amorphous atorvastatin calcium nanoparticles using supercritical antisolvent (SAS) process. Eur. J. Pharm. Biopharm 2008, 69, 454–465. [Google Scholar]
  21. Reverchon, E; De Marco, I; Torino, E. Nanoparticles production by supercritical antisolvent precipitation: A general interpretation. J. Supercrit. Fluid 2007, 43, 126–138. [Google Scholar]
  22. Chang, S-C; Lee, M-J; Lin, H-M. Role of phase behavior in micronization of lysozyme via a supercritical anti-solvent process. Chem. Eng. J 2008, 139, 416–425. [Google Scholar]
  23. Dowy, S; Braeuer, A; Reinhold-López, K; Leipertz, A. In situ optical monitoring of the solution concentration influence on supercritical particle precipitation. J. Supercrit. Fluid 2010, 55, 282–291. [Google Scholar]
  24. Reverchon, E; Adami, R; Cardea, S; Porta, GD. Supercritical fluids processing of polymers for pharmaceutical and medical applications. J. Supercrit. Fluid 2009, 47, 484–492. [Google Scholar]
  25. Zhao, X; Zu, Y; Li, Q; Wang, M; Zu, B; Zhang, X; Jiang, R; Zu, C. Preparation and characterization of camptothecin powder micronized by a supercritical antisolvent (SAS) process. J. Supercrit. Fluid 2010, 51, 412–419. [Google Scholar]
  26. Chattopadhyay, P; Gupta, RB. Production of griseofulvin nanoparticles using supercritical CO(2) antisolvent with enhanced mass transfer. Int. J. Pharm 2001, 228, 19–31. [Google Scholar]
Figure 1. Molecular structure of 10-hydroxycamptothecin (HCPT).
Ijms 12 02678f1
Figure 2. Schematic illustration of the supercritical antisolvent (SAS) experimental apparatus.1. CO2 cylinder; 2. 14, 15, 19, 21, 23, 24, 26 and 27. Valves; 3. Check valve; 4. CO2 cooler; 5. Liquid solution supply; 6. Liquid pump; 7 and 9. Flow meter; 8. CO2 pump; 10, 13 and 20. Heat exchangers; 11, 12 and 25. Filters; 16. Nozzle; 17. Stainless steel frit vessel of 200 nm; 18. Precipitation chamber; 22. Gas-liquid sepatation chamber.
Ijms 12 02678f2
Figure 3. Response surface for MPS of micronized HCPT obtained by nonlinear regression.
Ijms 12 02678f3
Figure 4. Scanning electron microscope (SEM) image of unprocessed HCPT.
Ijms 12 02678f4
Figure 5. SEM image (a) and particle size distribution (PSD) (b) of HCPT nanoparticles.
Ijms 12 02678f5
Figure 6. FTIR spectra of unprocessed HCPTand HCPT nanoparticles.
Ijms 12 02678f6
Figure 7. LC-MS spectra of the unprocessed HCPT (a) and HCPT nanoparticles (b).
Ijms 12 02678f7
Figure 8. XRD patterns of the unprocessed HCPT and HCPT nanoparticles.
Ijms 12 02678f8
Figure 9. DSC results of the unprocessed HCPT and HCPT nanoparticles.
Ijms 12 02678f9
Figure 10. Dissolution profiles of the unprocessed HCPT and HCPT nanoparticles.
Ijms 12 02678f10
Table 1. Orthogonal array design matrix L16 (4)5 and experimental results.
Trial No.ABCDErrorMPS (nm) ± SD (n = 3)
11 (0.5)1 (35)1 (10)1 (3.3)1381.2
21 (0.5)2 (46)2 (15)2 (6.6)2210.5
31 (0.5)3 (57)3 (20)3 (9.9)3350.0
41 (0.5)4 (68)4 (25)4 (13.2)4424.8
52 (1.5)1 (35)2 (15)3 (9.9)4409.4
62 (1.5)2 (46)1 (10)4 (13.2)3458.3
72 (1.5)3 (57)4 (25)1 (3.3)2437.9
82 (1.5)4 (68)3 (20)2 (6.6)1446.0
93 (3.0)1 (35)3 (20)4 (13.2)2350.6
103 (3.0)2 (46)4 (25)3 (9.9)1428.2
113 (3.0)3 (57)1 (10)2 (6.6)4752.8
123 (3.0)4 (68)2 (15)1 (3.3)3641.1
134 (5.0)1 (35)4 (25)2 (6.6)3402.9
144 (5.0)2 (46)3 (20)1 (3.3)4474.5
154 (5.0)3 (57)2 (15)4 (13.2)1720.6
164 (5.0)4 (68)1 (10)3 (9.9)2900.7
K1a341.6386.0623.3483.7494.0
K2437.9392.9495.4453.1475.0
K3543.2565.3405.3522.1463.1
K4624.7603.2423.5488.6515.4
Rb283.1217.1218.069.052.3
Optimal levelA1B1C3D2
A, Concentration of HCPT solution (mg/mL); B, Precipitation temperature (°C); C, Precipitation pressure (MPa); D, Drug solution flow rate (mL/min)
aKi = ∑(mean particle size at Ai)/4, the mean values of MPS for a certain factor at each level with standard deviation.
bR = max Ki – min Ki.
Table 2. ANONA analysis of four parameters for SAS micronization of 10-hydroxycamptothecin (HCPT).
SourceSum of squares (SS)Degrees of freedom (df)F-ratioF0.05Type of effect
(A) Concentration of HCPT solution182618.6329.0389.28Significant
(B) Precipitation temperature154724324.6029.28Significant
(C) Precipitation pressure117408.4318.6699.28Significant
(D) Drug solution flow rate9585.18731.5249.28
Error6289.023

