Spectral Inverse Quantum (Spectral-IQ) Method for Modeling Mesoporous Systems: Application on Silica Films by FTIR


Abstract
:
1. Introduction
2. Results and Discussion
2.1. Spectral-IQ Method
- The maximum absorption line wave-number υ̃0 (Amax) that relates to the classical path, and the same for squared average measure in the inverse manner as:
- The left and right wave-numbers υ̃L, υ̃R of the working absorption band, being arithmetically-to-geometrically averaged to get the average of quantum paths “inside” the band:
- The full width of a half maximum (FWHM) wave-number Δ υ̃FWHM of the concerned absorption band that is reciprocally associated with the dispersion of the quantum paths of vibrations within the band:
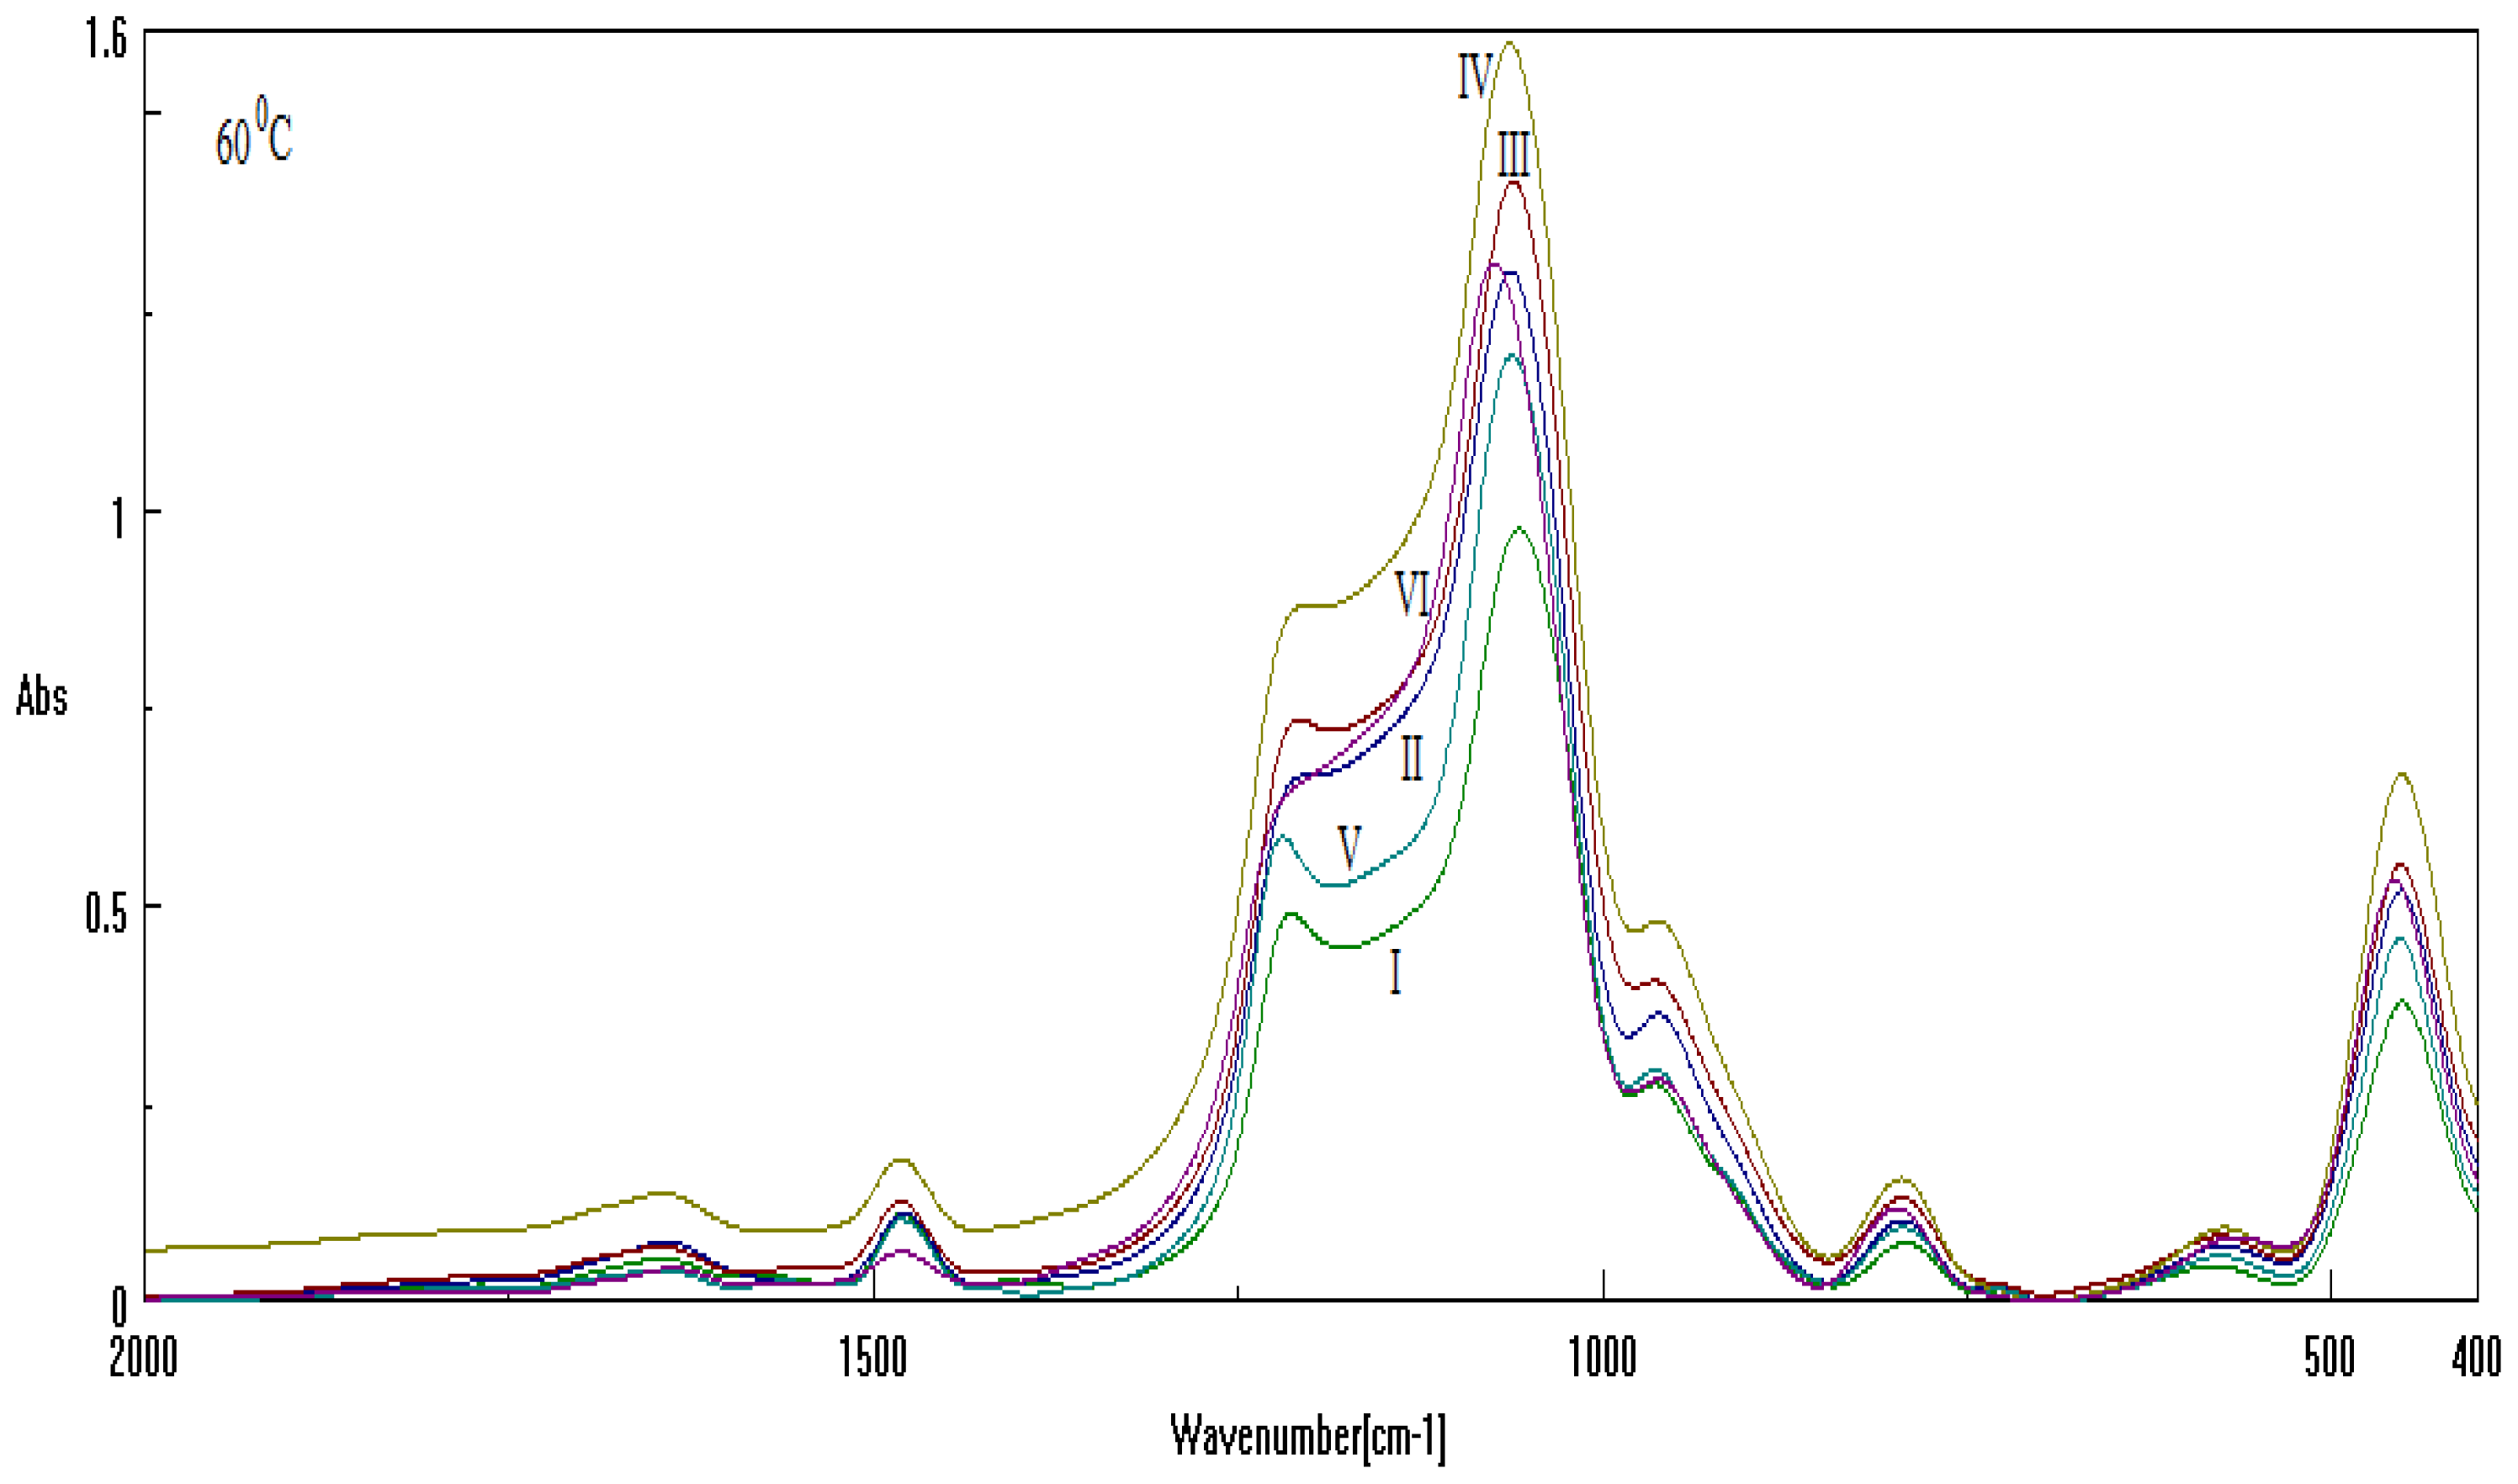
2.2. Results on Silica Sol-gel-based Mesosystems
- Both series contain all CTAB, DTAB and their combinations;
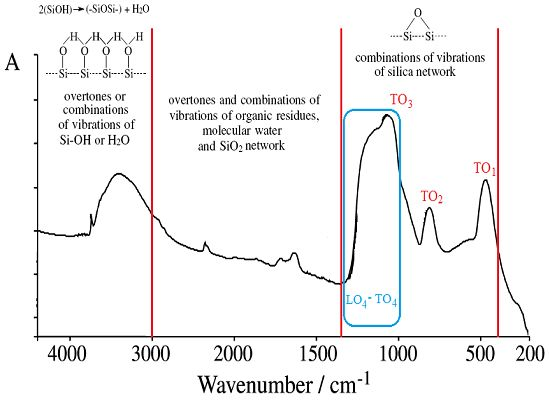
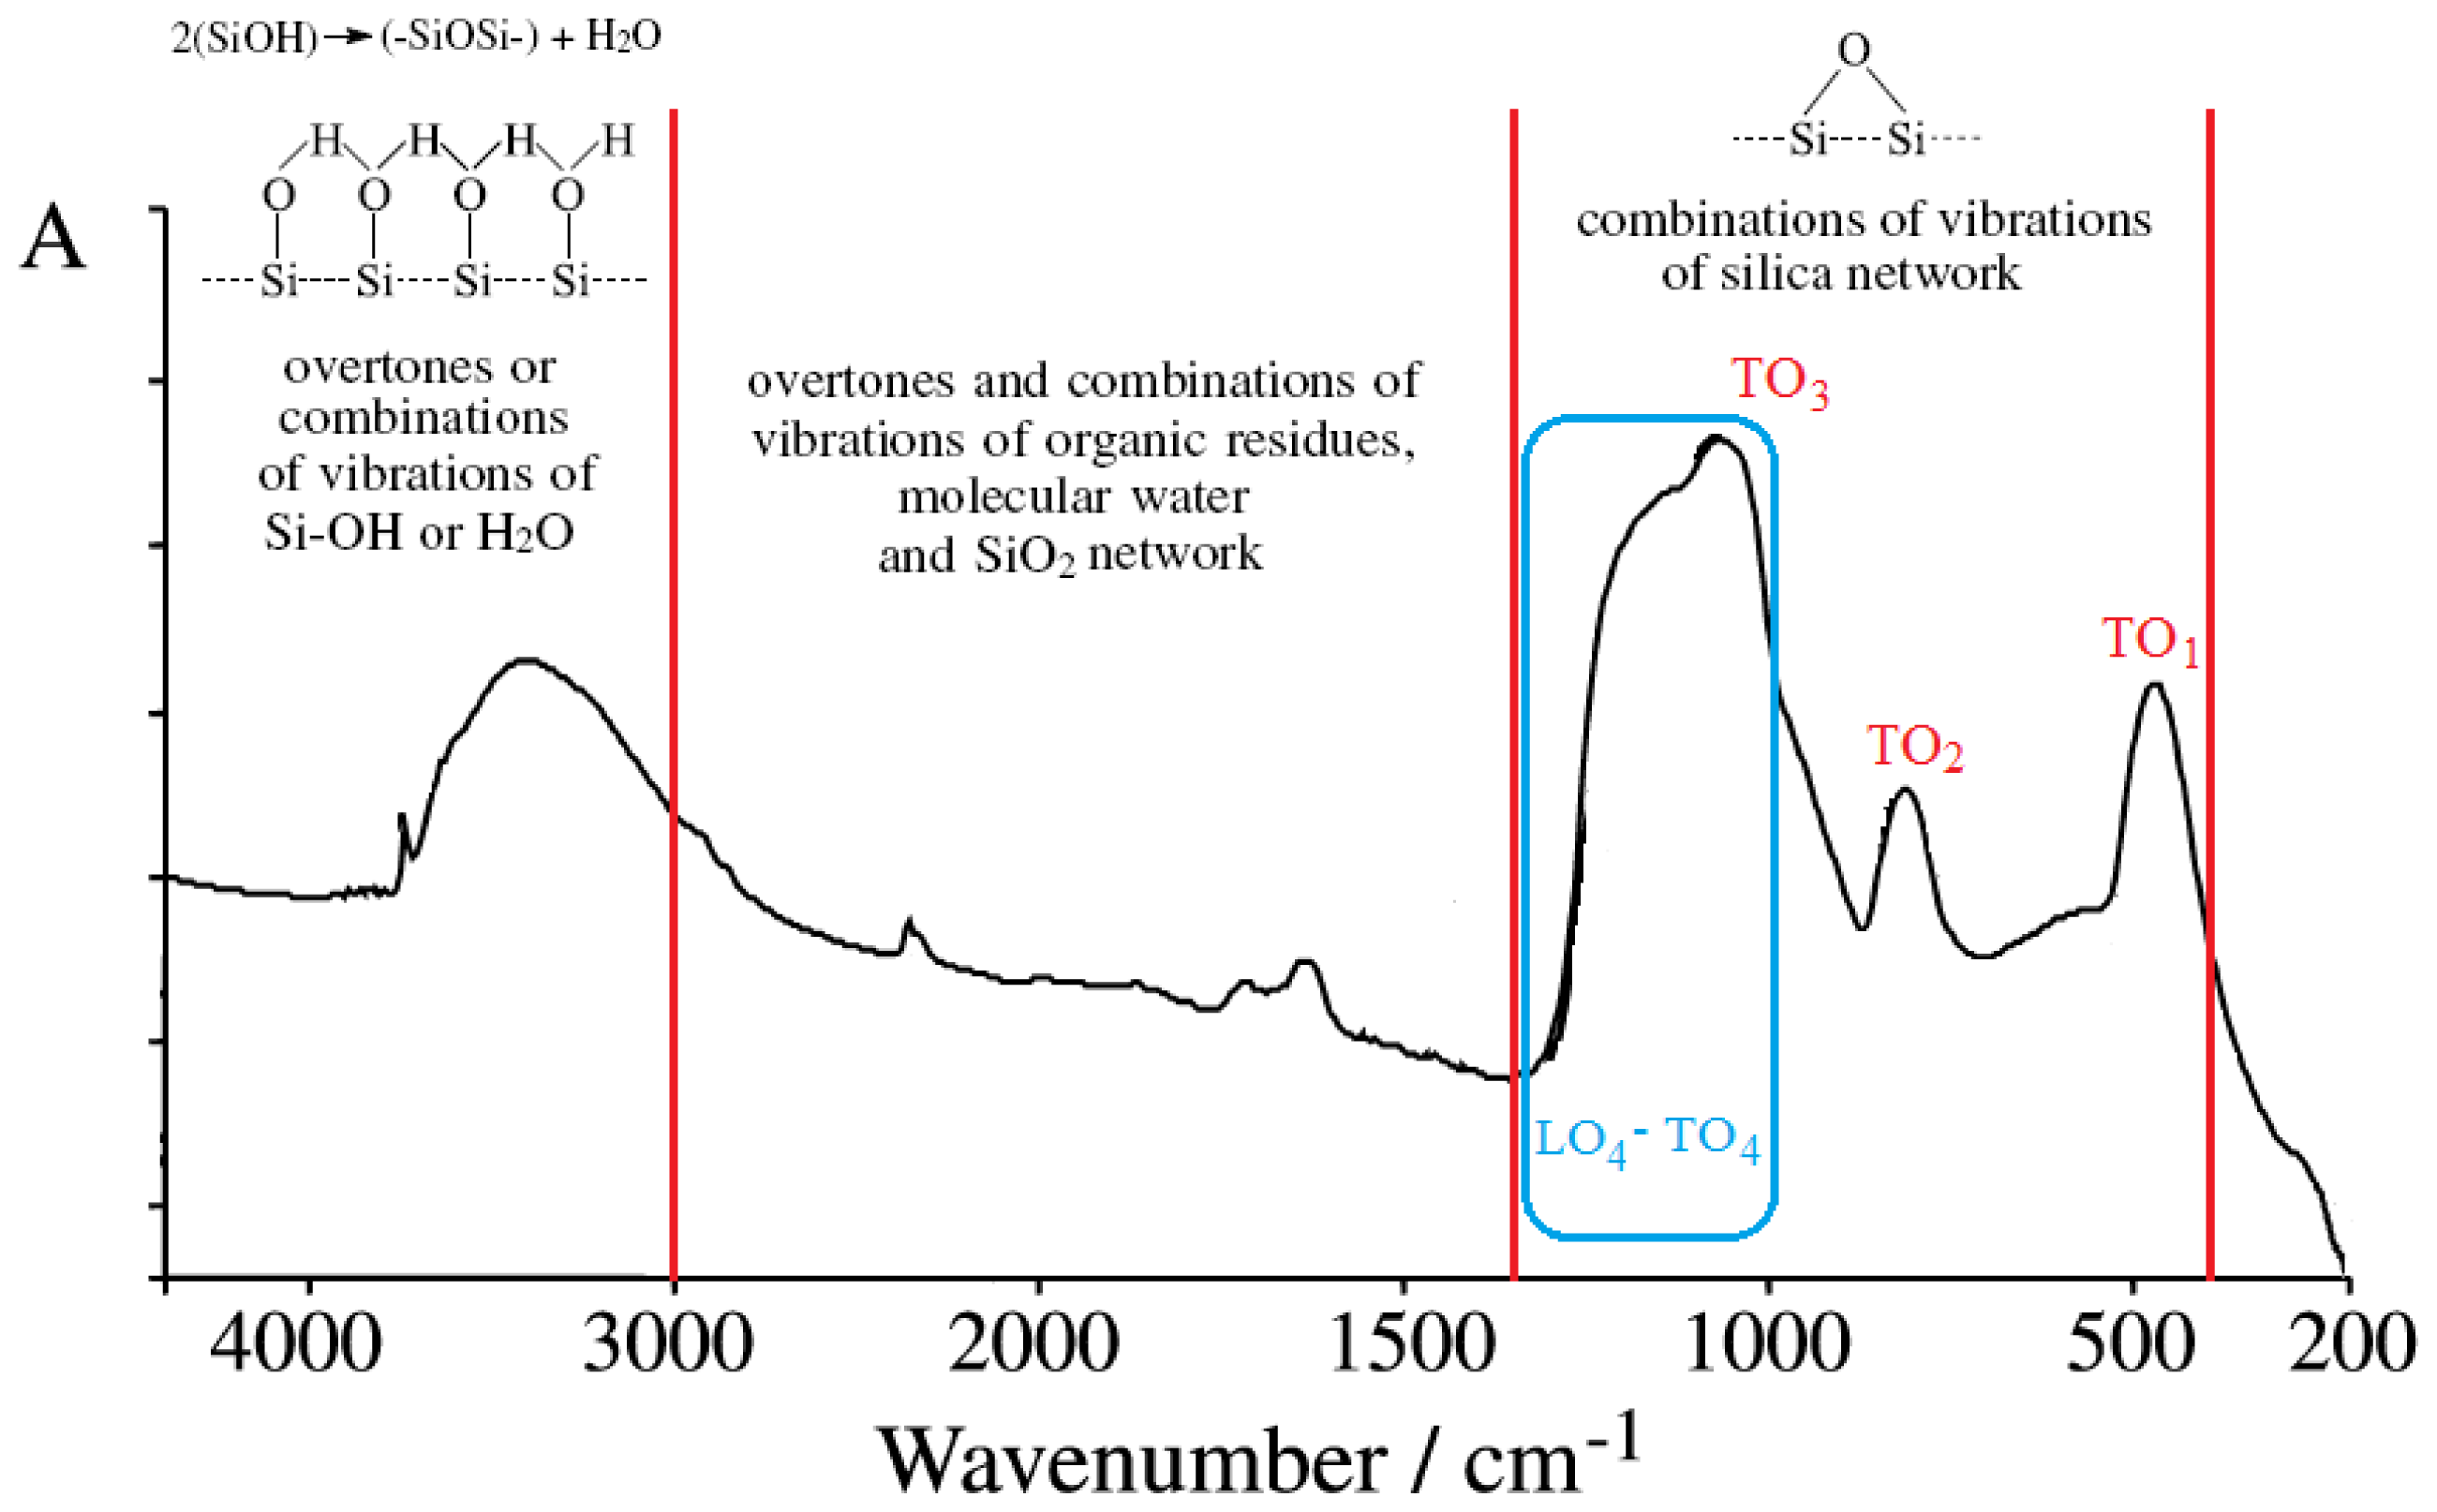
- The used basic environment is the discriminating factor, here NaOH leaving with more free binding (and less porosity) potential for further interaction than NH3, most probably due to the OH group ability (reactivity) to be further involved (and therefore blocked) in the Si surface through the related vibrations and overtones’ combinations; see Figure 1.
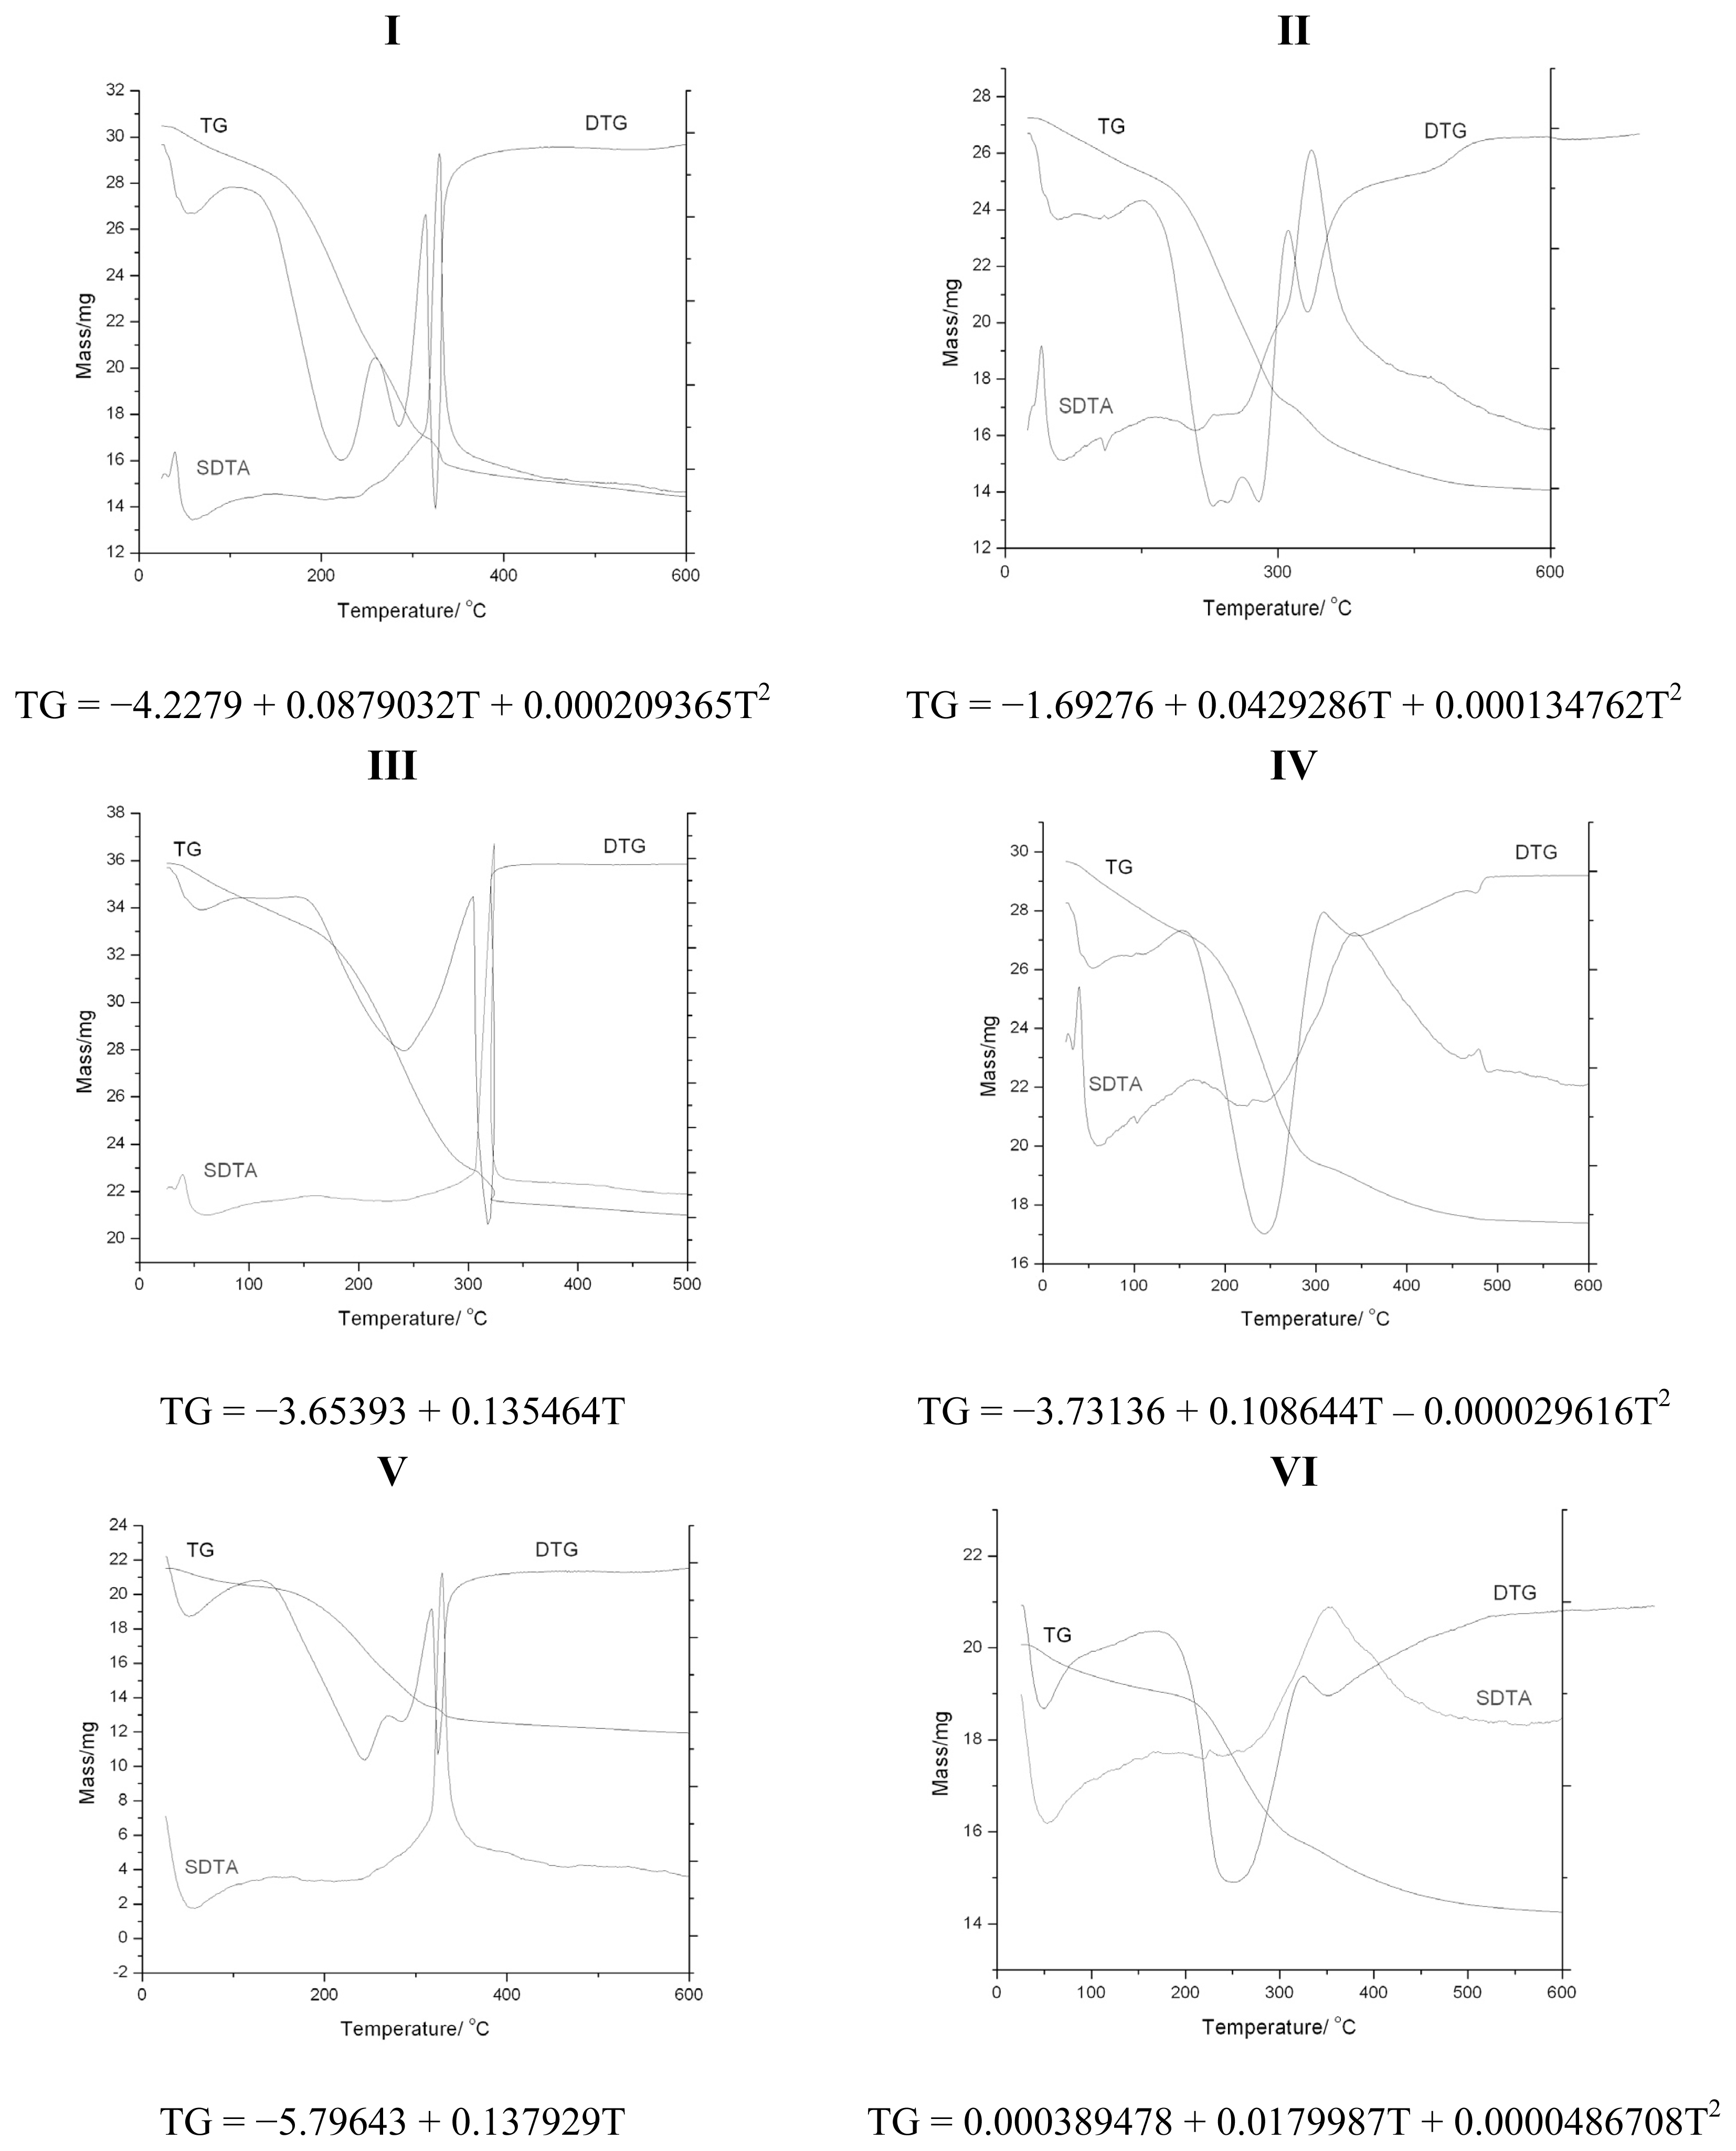
2.3. Discussion: Cross-Check by Thermal Analysis
3. Experimental Section
4. Conclusions
Acknowledgements
- Conflict of InterestThe authors declare no conflict of interest.
References
- El-Safty, S.A. Instant synthesis of mesoporous monolithic materials with controllable geometry, dimension and stability: A review. J. Porous Mater 2011, 18, 259–287. [Google Scholar]
- Xia, W.; Chang, J. Well-ordered mesoporous bioactive glasses (MBG): A promising bioactive drug delivery system. J. Controlled Release 2006, 110, 522–530. [Google Scholar]
- Yang, Q.; Wang, S.H.; Fan, P.W.; Wang, L.F.; Di, Y.; Lin, K.F.; Xiao, F.S. pH-responsive carrier system based on carboxylic acid modified mesoporous silica and polyelectrolyte for drug delivery. Chem. Mater 2005, 17, 5999–6003. [Google Scholar]
- Tan, S.; Wu, Q.; Wang, J.; Wang, Y.; Liu, X.; Sui, K.; Deng, X.; Wang, H.; Wu, M. Dynamic self-assembly synthesis and controlled release as drug vehicles of porous hollow silica nanoparticles. Microporous Mesoporous Mater 2011, 142, 601–608. [Google Scholar]
- Tanev, P.T.; Vlaev, L.T. An attempt at a more precise evaluation of the approach to mesopore size distribution calculations depending on the degree of pore blocking. J. Colloid Interface Sci 1993, 160, 110–116. [Google Scholar]
- Wahab, M.A.; Kim, I.I.; Ha, C.S. Hybrid periodic mesoporous organosilica materials prepared from 1,2-bis(triethoxysilyl)ethane and (3-cyanopropyl)triethoxysilane. Microporous Mesoporous Mater 2004, 69, 19–27. [Google Scholar]
- Ryoo, R.; Kim, J.M.; Ko, C.H.; Shin, C.H. Disordered molecular sieve with branched mesoporous channel network. J. Phys. Chem 1996, 100, 17718–17721. [Google Scholar]
- De, G.; Kundu, D.; Karmakar, B.; Ganguli, D. FTIR studies of gel to glass conversion in TEOS-fumed silica derived gels. J. Non-Cryst. Solids 1993, 155, 253–258. [Google Scholar]
- Al-Oweini, R.; El-Rassy, H. Synthesis and characterization by FTIR spectroscopy of silica aerogels prepared using several Si(OR)4 and R00Si(OR0)3 precursors. J. Mol. Struct 2009, 919, 140–145. [Google Scholar]
- Xue, W.; He, H.; Zhu, J.; Yuan, P. FTIR investigation of CTAB–Al–montmorillonite complexes. Spectrochim. Acta Part A 2007, 67, 1030–1036. [Google Scholar]
- Brinker, C.J.; Scherer, G.W. Sol-Gel Science: The Physics and Chemistry of Sol-Gel Processing; Academic: New York, NY, USA, 1990; pp. 581–585. [Google Scholar]
- Lenza, R.F.S.; Vasconcelos, W.L. Preparation of silica by sol-gel method using formamide. Mat. Res 2001, 4, 175–179. [Google Scholar]
- Brunet-Bruneau, A.; Bourgeois, A.; Cagnol, F.; Grosso, D.; Sanchez, C.; Rivory, J. An in situ study of mesostructured CTAB-silica film formation using infrared ellipsometry: Evolution of water content. Thin Solid Films 2004, 455–456, 656–660. [Google Scholar]
- Ramila, A.; Munoz, B.; Perez-Pariente, J.; Vallet-Regi, M.J. Mesoporous MCM-41 as drug host system. J. Sol–Gel Sci. Technol 2003, 26, 1199–1202. [Google Scholar]
- Wang, G.; Otuonye, A.N.; Blair, E.A.; Denton, K.; Tao, Z.; Asefa, T. Functionalized mesoporous materials for adsorption and release of different drug molecules: A comparative study. J. Solid State Chem 2009, 182, 1649–1660. [Google Scholar]
- Kung, K.H.S.; Hayes, K.F. Fourier transform infrared spectroscopic study of the adsorption of cetyltrimethylammonium bromide and cetylpyridinium chloride on silica. Langmuir 1993, 9, 263–267. [Google Scholar]
- Chatterjee, S.; Lee, M.W.; Woo, S.H. Influence of impregnation of chitosan beads with cetyl trimethyl ammonium bromide on their structure and adsorption of congo red from aqueous solutions. Chem. Eng. J 2009, 155, 254–259. [Google Scholar]
- Kresge, C.T.; Leonowicz, M.E.; Roth, W.J.; Vartuli, J.C.; Beck, J.S. Ordered mesoporous molecular sieves synthesized by a liquid-crystal template mechanism. Nature 1992, 359, 710–712. [Google Scholar]
- Innocenzi, P. Infrared spectroscopy of sol–gel derived silica-based films: A spectra-microstructure overview. J. Non-Cryst. Solids 2003, 316, 309–319. [Google Scholar]
- Coates, J. Interpretation of Infrared Spectra, A Practical Approach. In Encyclopedia of Analytical Chemistry; Meyers, R.A., Ed.; John Wiley & Sons, Ltd: Chichester, UK, 2000; pp. 10815–10837. [Google Scholar]
- Ojha, P.K.; Rath, S.K.; Chongdar, T.K.; Gokhale, N.M.; Kulkarni, A.R. Structural Inversion and Behavioural Changes as a Function of Composition in Sr-La-Al-B-Si Based Glasses. New J. Glass Ceram 2011, 1, 21–27. [Google Scholar]
- El-Egili, K. Infrared Studies of Na2O-B2O3-SiO2 and Al2O3-Na2O-B2O3-SiO2 Glasses. Physica B 2003, 325, 340–348. [Google Scholar]
- Sidek, H.A.A.; Rosmawati, S.; Talib, Z.A. Synthesis and optical properties of ZnO-TeO2 glass system. Am. J. Appl. Sci 2009, 6, 1489–1494. [Google Scholar]
- Lu, K.; Mahapatra, M.K. Network structure and thermal stability study of high temperature seal glass. J. Appl. Phys 2008, 104, 074910:1–074910:9. [Google Scholar]
- Brix, P.; Gaschler, L. Sealing glass for the production of glass-to-metal seals. U.S. Patent 5,137,849, 11 August 1992. [Google Scholar]
- Almeida, R.M.; Guiton, T.A.; Pantano, G.C. Characterization of silica gels by infrared reflection spectroscopy. J. Non-Cryst. Solids 1990, 121, 193–197. [Google Scholar]
- Primeau, N.; Vautey, C.; Langlet, M. The effect of thermal annealing on aerosol-gel deposited SiO2 films: A FTIR deconvolution study. Thin Solid Films 1997, 310, 47–56. [Google Scholar]
- Putz, M.V. On Heisenberg uncertainty relationship, its extension, and the quantum issue of wave-particle duality. Int. J. Mol. Sci 2010, 11, 4124–4139. [Google Scholar]
- Mandl, F. Quantum Mechanics; John Wiley & Sons: New York, NY, USA; p. 1992.
- Orcel, G.; Phalippou, J.; Hench, L.L. Structural changes of silica xerogels during low temperature dehydration. J. Non-Cryst. Solids 1986, 88, 114–130. [Google Scholar]
- Neivandt, D.J.; Gee, M.L.; Tripp, C.P.; Hair, M.L. Coadsorption of poly(styrenesulfonate) and cetyltrimethylammonium bromide on silica investigated by attenuated total reflection techniques. Langmuir 1997, 13, 2519–2526. [Google Scholar]
- Paruchuri, V.K.; Fa, K.; Moudgil, B.M.; Miller, J.D. Adsorption density of spherical cetyltrimethylammonium bromide (CTAB) micelles at a silica/silicon surface. Appl. Spectrosc 2005, 59, 668–672. [Google Scholar]
- Zhao, D.; Feng, J.; Huo, Q.; Melosh, N.; Fredickson, G.H.; Chmelka, B.F.; Stucky, G.D. Triblock copolymer syntheses of mesoporous silica with periodic 50 to 300 Angstrom pores. Science 1998, 279, 548–552. [Google Scholar]
- Huo, Q.; Leon, R.; Petroff, P.M.; Stucky, G.D. Mesostructure design with gemini surfactants: Super cage formation in a three-dimensional hexagonal array. Science 1995, 268, 1324–1327. [Google Scholar]
- Zhao, D.; Huo, Q.; Feng, J.; Chmelka, B.F.; Stucky, G.D. Nonionic triblock and star diblock copolymer and oligomeric surfactant syntheses of highly ordered, hydrothermally stable, mesoporous silica structures. J. Am. Chem. Soc 1998, 120, 6024–6036. [Google Scholar]
- Krasnoholovets, V. Sub microscopic description of the diffraction phenomenon. Nonlinear Opt. Quantum Opt 2010, 41, 273–286. [Google Scholar]
- Putz, M.V. The bondons: The quantum particles of the chemical bond. Int. J. Mol. Sci 2010, 11, 4227–4256. [Google Scholar]
- Putz, M.V.; Ori, O. Bondonic characterization of extended nanosystems: Application to graphene’s nanoribbons. Chem. Phys. Lett 2012, 548, 95–100. [Google Scholar]
- Savii, C.; Putz, A.M. Recent advances in bioresponsive nanomaterials. In Carbon Bonding and Structures: Advances in Physics and Chemistry; Putz, M.V., Ed.; Springer Verlag: London, UK, 2011; pp. 379–435. [Google Scholar]


| cm−1 | Assignments of the IR vibrations | References |
|---|---|---|
| 3470–3450 | Overlapping of the O-H stretching bands of hydrogen-bonded water molecules (H–O–H···H) with SiO–H stretchings of surface silanols hydrogen-bonded to molecular water (SiO–H···H2O) | [11] |
| 3460–3000 | Molecular water hydrogens bonded to each other and to SiOH groups; the bands are mainly due to overtones or to combinations of vibrations of Si–OH or H2O | [12,13] |
| 3360 | The water absorption bands | [13] |
| 3260 | Silanol groups absorption bands | [13] |
| 3000–2800 | Stretching of the C–H bond within various organic groups | [14,15] |
| 3000–2800 | Symmetric and asymmetric fundamental stretching vibrations of CH2 and CH3 groups belonging to alkoxide and solvent residues | [12] |
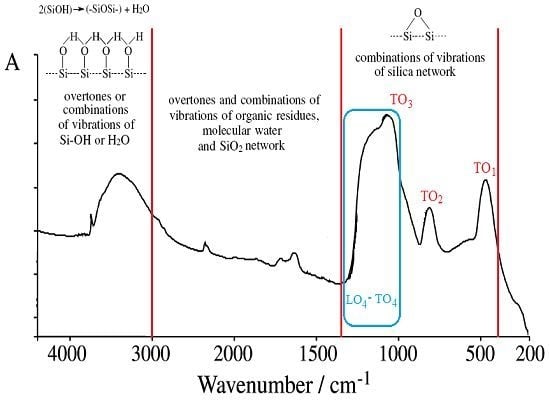
| 3000–1350 | Overtones and combinations of vibrations of organic residues, molecular water and SiO2 network | [12] |
| 2960–2940 | Asymmetric stretching of C–CH3 and symmetric N–CH3 stretching vibration | [16] |
| 2960 | Asymmetric C–H stretching of methyl [CH3] group of CTAB molecules, if present | [17] |
| 2927 | Stretching of the C–H within surfactant (it disappears in the calcinated samples) | [15,18] |
| 2925 | Absorption bands due to the CTAB surfactant | [13] |
| 2922–2920 | Asymmetric stretching vibration of C–CH2 from the methylene chain | [16,17] |
| 2890 | Vibration for (CH3) can be used to identify the presence of vibrational modes of unreacted TEOS and ethanol in the silica films | [19] |
| 2872 | Symmetric stretching vibration of C–CH3 | [16] |
| ~2850 | Absorption bands due to the CTAB surfactant; symmetric C–H stretching of methylene [CH2] chain in CTAB | [13,16,17] |
| 2259 | A CN stretch | [14,15] |
| 1870–960, 1640–960 | Combination of vibrations of the SiO2 network (1640 cm−1 band is often hidden by molecular water band) | [12] |
| 1640 | Molecular water band | [13] |
| 1630–1620 | Vibrations of molecular water (present only in the calcinated samples, if it is the case) | [12] |
| 1478 | C–H bending of the surfactant (it disappears in the calcinated samples) | [15,18] |
| ~1470 | A strong methylene/methyl band (indicative of a long-chain linear aliphatic structure and a high degree of regularity for the linear backbone structure) | [20] |
| ~1350 | Absorption band due to the CTAB surfactant | [13] |
| 1350–500 | Vibrations of C–H bonds | [12,21] |
| 1300–400 | Combinations of vibrations of silica network | [12,21] |
| 1260–1000 | Asymmetric stretching vibrations of Si–O–Si bridging sequences | [12,21] |
| 1200–850 | Stretching vibration of structural groups containing SiO4 tetrahedral | [21–25] |
| 1115–1000 | Band for formation of the siloxane bond | [15] |
| 1070 | Asymmetric stretching vibrations of Si–O–Si in transverse optical mode (ASTO) | [12] |
| 1050–900, 980–900 | Stretching vibration of free silanol groups on the surface of the amorphous solid | [12] |
| 965 | Vibration for H3CO, can be used to identify the presence of vibrational modes of unreacted TEOS and ethanol in the silica films | [19] |
| 960 | Si-OH stretching mode typical of gel structure (decreases in intensity till becoming insignificant when the material undergoes a polycondensation process during drying) | [12] |
| 950 | Si–OH bending vibration modes | [13] |
| 929 | When identified for CH2 can be used to identify the presence of vibrational modes of unreacted TEOS and ethanol in the silica films | [19] |
| 820–800 | Symmetric stretching vibrations of Si–O–Si bonds belonging to ring structures | [12] |
| 810 | Symmetric Si–O–Si motion | [12] |
| 793 | Identified for Si–O and C–O, it can be used to recognize the presence of vibration modes of unreacted TEOS and ethanol in the silica films | [19] |
| 789 | Indicates the organic groups as intact through being ascribed to their C–H stretching | [15] |
| 725–720 | Methylene rocking vibration (indicative of a long-chain linear aliphatic structure and of a high degree of regularity for the linear backbone structure) | [20] |
| 460–450 | Associated with Si–O–Si bond bending (rocking) vibration | [12,21] |
| Sample | Template | Base | Cosolvent | Solution |
|---|---|---|---|---|
| I | CTAB | NH3 | Metoxy-ethanol | TEOS |
| II | CTAB | NaOH | ||
| III | DTAB | NH3 | ||
| IV | DTAB | NaOH | ||
| V | CTAB+DTAB | NH3 | ||
| VI | CTAB+DTAB | NaOH |
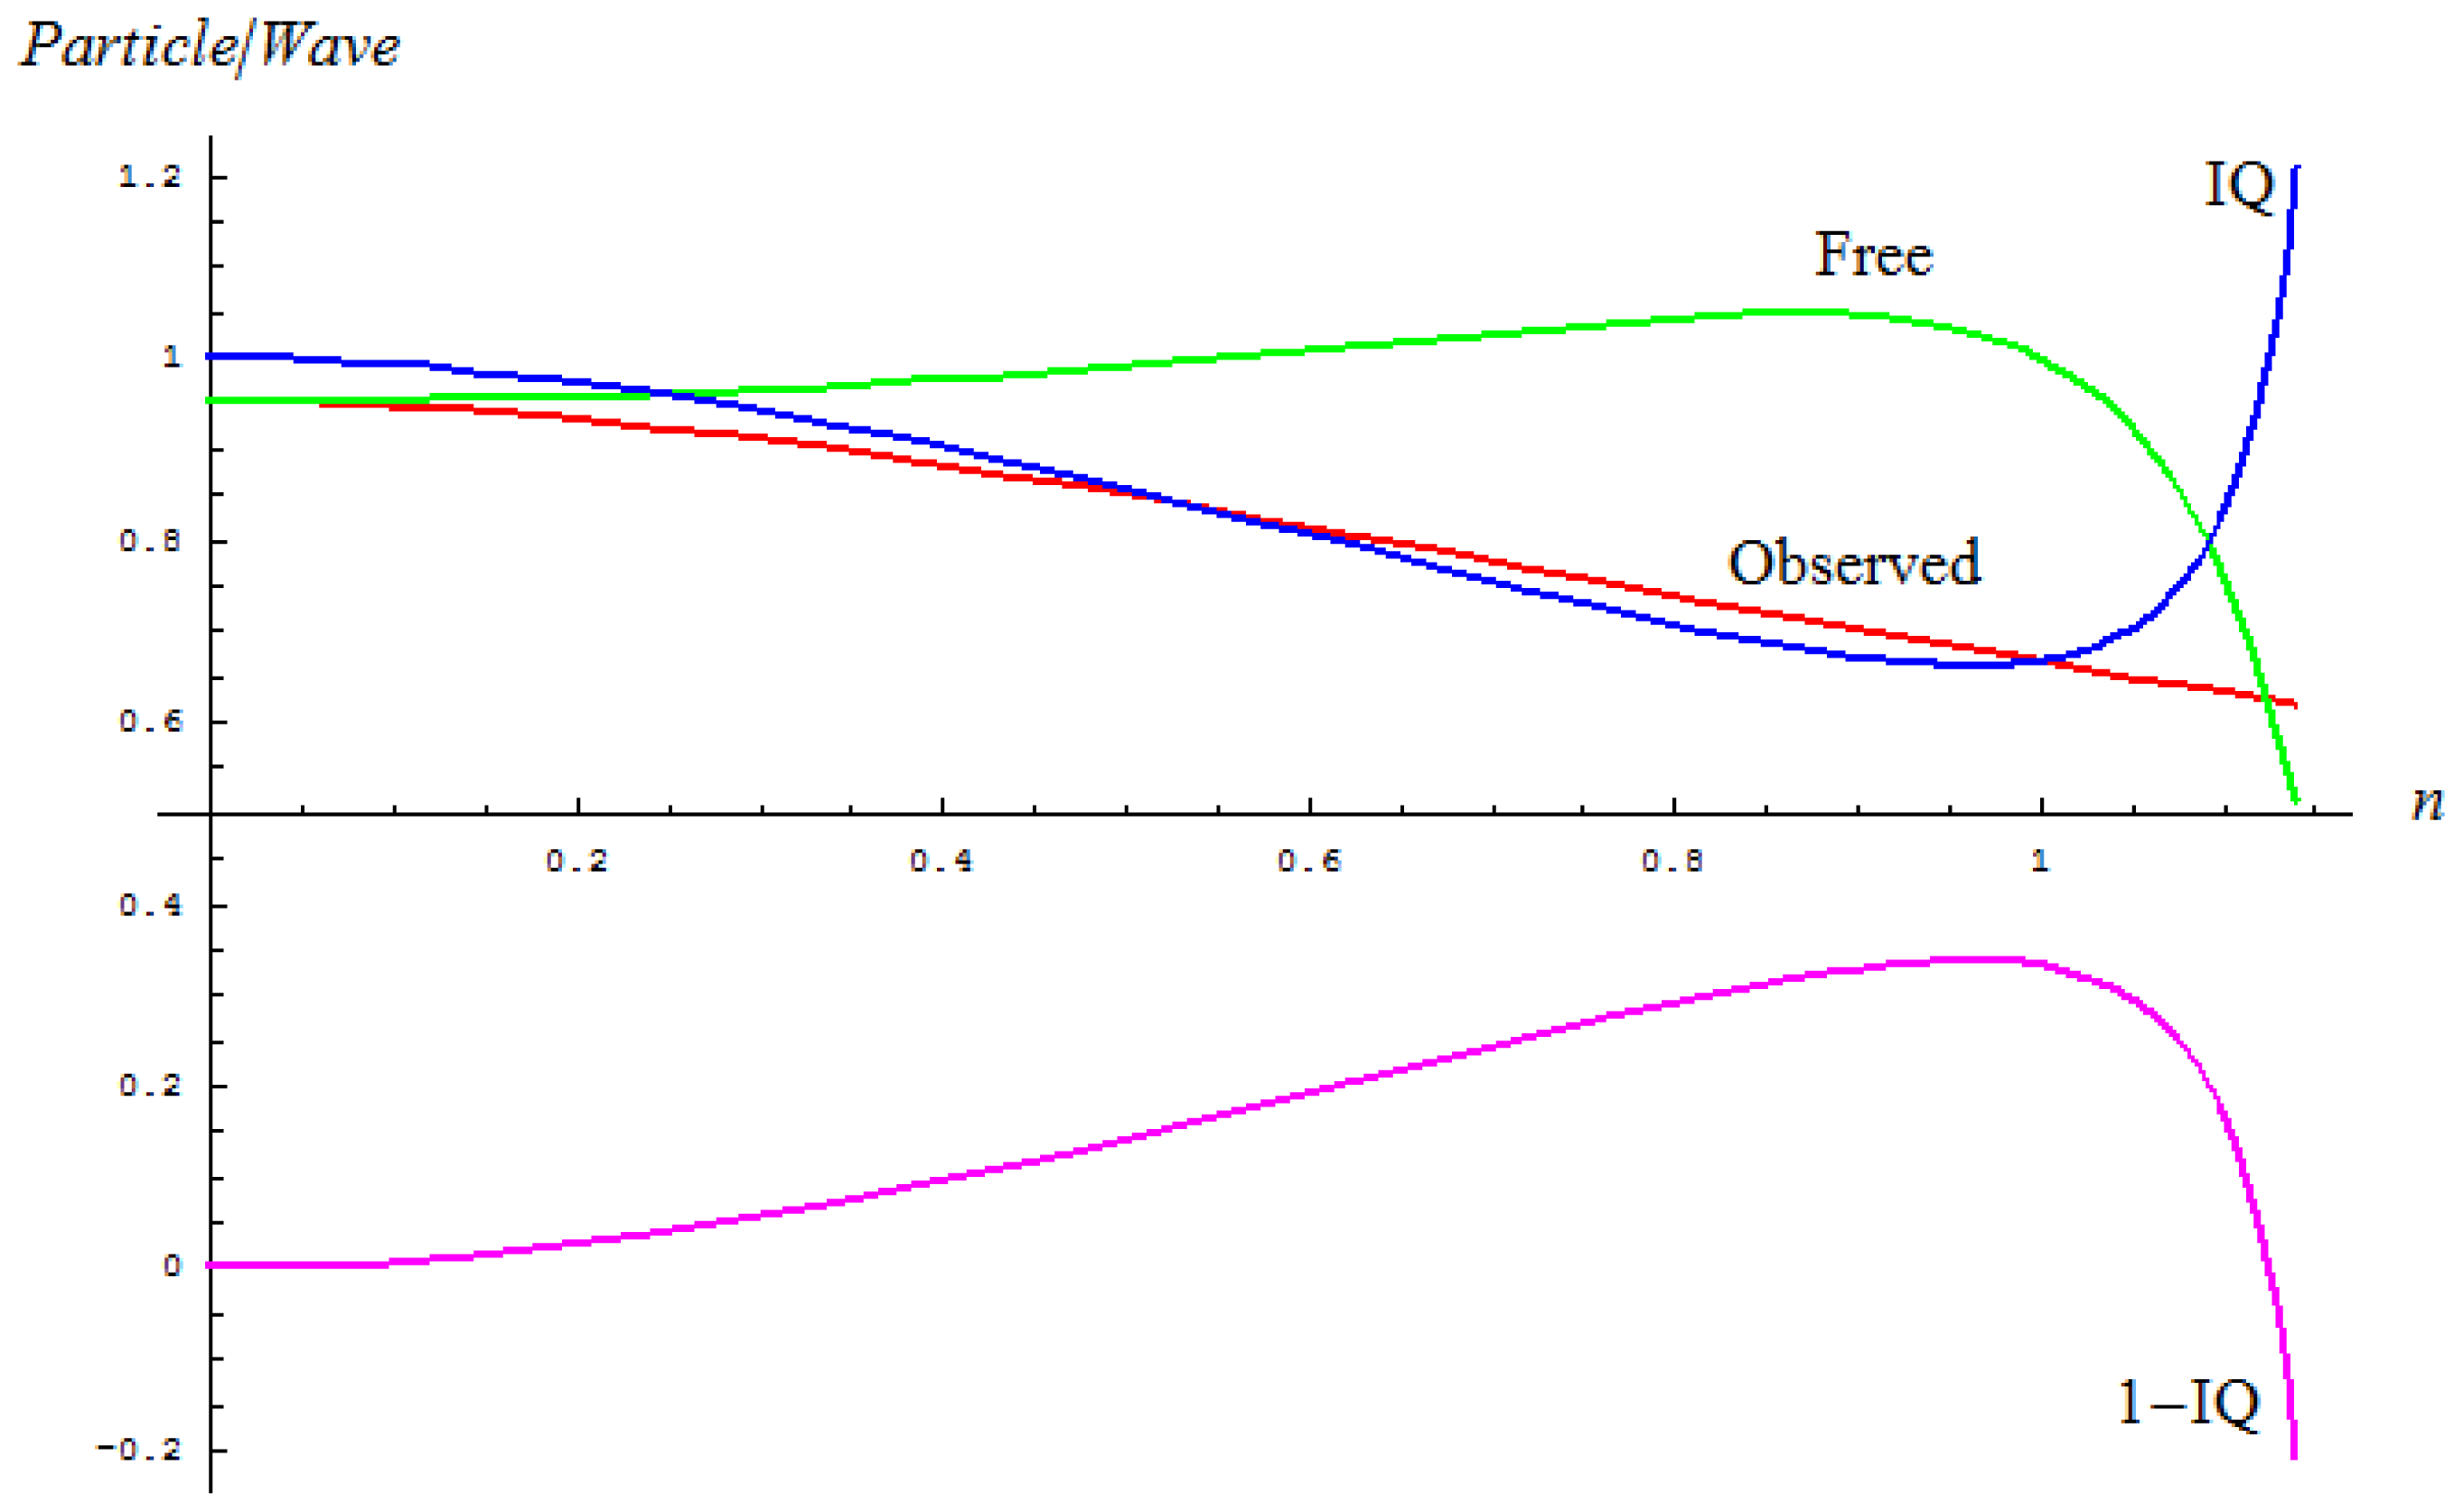
| Sample | υ̃0 (Amax) | Δυ̃FWHM | nObs | (P/W)EvolutionObserved | nFree | (P/W)EvolutionFree | IQ | 1 – IQ |
|---|---|---|---|---|---|---|---|---|
| I-60 | 1057.76 | 79.4905 | 0.0751762 | 0.94921 | 0.0747549 | 0.952777 | 0.996257 | 0.00374301 |
| II-60 | 1063.55 | 107.4623 | 0.1011 | 0.947056 | 0.100083 | 0.95348 | 0.993266 | 0.00673417 |
| III-60 | 1061.62 | 91.0061 | 0.0857609 | 0.948407 | 0.085137 | 0.95304 | 0.995138 | 0.00486168 |
| IV-60 | 1063.55 | 112.1339 | 0.105501 | 0.946633 | 0.104346 | 0.953619 | 0.992674 | 0.00732553 |
| V-60 | 1062.59 | 80.1571 | 0.0754605 | 0.94919 | 0.0750345 | 0.952783 | 0.996229 | 0.00377119 |
| VI-60 | 1074.16 | 117.5866 | 0.109532 | 0.946227 | 0.108241 | 0.95375 | 0.992112 | 0.00788823 |
| Sample | υ̃0 (Amax) | Δυ̃FWHM | nObs | (P/W)EvolutionObserved | nFree | (P/W)EvolutionFree | IQ | 1 – IQ |
|---|---|---|---|---|---|---|---|---|
| I-700 | 1079.94 | 126.9705 | 0.117643 | 0.945365 | 0.116048 | 0.954029 | 0.990919 | 0.00908062 |
| II-700 | 1083.8 | 156.5567 | 0.144573 | 0.942084 | 0.141643 | 0.955078 | 0.986395 | 0.0136049 |
| III-700 | 1078.01 | 94.9767 | 0.0881346 | 0.948212 | 0.0874579 | 0.953104 | 0.994868 | 0.0051321 |
| IV-700 | 1085.73 | 87.0955 | 0.0802383 | 0.948839 | 0.0797267 | 0.952899 | 0.99574 | 0.0042602 |
| V-700 | 1083.8 | 70.1104 | 0.0647003 | 0.949903 | 0.0644312 | 0.952549 | 0.997223 | 0.00277721 |
| VI-700 | 1092.48 | 101.4627 | 0.0929001 | 0.947807 | 0.0921086 | 0.953237 | 0.994304 | 0.00569644 |
| Sample | TG mass loss [%] | DTG [°C] | DTA |
|---|---|---|---|
| I | 1.80 | 60 | *endothermic |
| 32.78 | 260 | *endothermic | |
| 47.58 | 330 | *exothermic | |
| II | 0.24 | 40 | *endothermic |
| 4.66 | 110 | *endothermic | |
| 13.51 | 210 | endothermic | |
| 40.6 | 340 | exothermic | |
| 46.57 | 460 | *exothermic | |
| III | 0.41 | 30 | *endothermic |
| 38.34 | 310 | *exothermic | |
| IV | 0.567 | 40 | *endothermic |
| 8.49 | 160 | exothermic | |
| 19.69 | 230 | *endothermic | |
| 36.84 | 350 | exothermic | |
| 40.789 | 470 | *exothermic | |
| V | 1.1 | 50 | *endothermic |
| 39.72 | 330 | *exothermic | |
| VI | 1.022 | 50 | *endothermic |
| 22.947 | 350 | exothermic | |
| 29.09 | 610 | *exothermic |
| Index | I | II | III | IV | V | VI |
|---|---|---|---|---|---|---|
| R1-IQ[%] | 142.602 | 102.028 | 5.56227 | 41.8445 | 26.3572 | 27.7856 |
| TG700[%] | 159.893 | 94.3906 | 91.1711 | 57.8074 | 90.7536 | 36.4482 |
© 2012 by the authors; licensee Molecular Diversity Preservation International, Basel, Switzerland. This article is an open-access article distributed under the terms and conditions of the Creative Commons Attribution license (http://creativecommons.org/licenses/by/3.0/).
Share and Cite
Putz, A.-M.; Putz, M.V. Spectral Inverse Quantum (Spectral-IQ) Method for Modeling Mesoporous Systems: Application on Silica Films by FTIR. Int. J. Mol. Sci. 2012, 13, 15925-15941. https://doi.org/10.3390/ijms131215925
Putz A-M, Putz MV. Spectral Inverse Quantum (Spectral-IQ) Method for Modeling Mesoporous Systems: Application on Silica Films by FTIR. International Journal of Molecular Sciences. 2012; 13(12):15925-15941. https://doi.org/10.3390/ijms131215925
Chicago/Turabian StylePutz, Ana-Maria, and Mihai V. Putz. 2012. "Spectral Inverse Quantum (Spectral-IQ) Method for Modeling Mesoporous Systems: Application on Silica Films by FTIR" International Journal of Molecular Sciences 13, no. 12: 15925-15941. https://doi.org/10.3390/ijms131215925
APA StylePutz, A.-M., & Putz, M. V. (2012). Spectral Inverse Quantum (Spectral-IQ) Method for Modeling Mesoporous Systems: Application on Silica Films by FTIR. International Journal of Molecular Sciences, 13(12), 15925-15941. https://doi.org/10.3390/ijms131215925