Pyrrolo[3,2-d]pyrimidine Derivatives as Type II Kinase Insert Domain Receptor (KDR) Inhibitors: CoMFA and CoMSIA Studies

Abstract
:1. Introduction
2. Materials and Methods
2.1. General
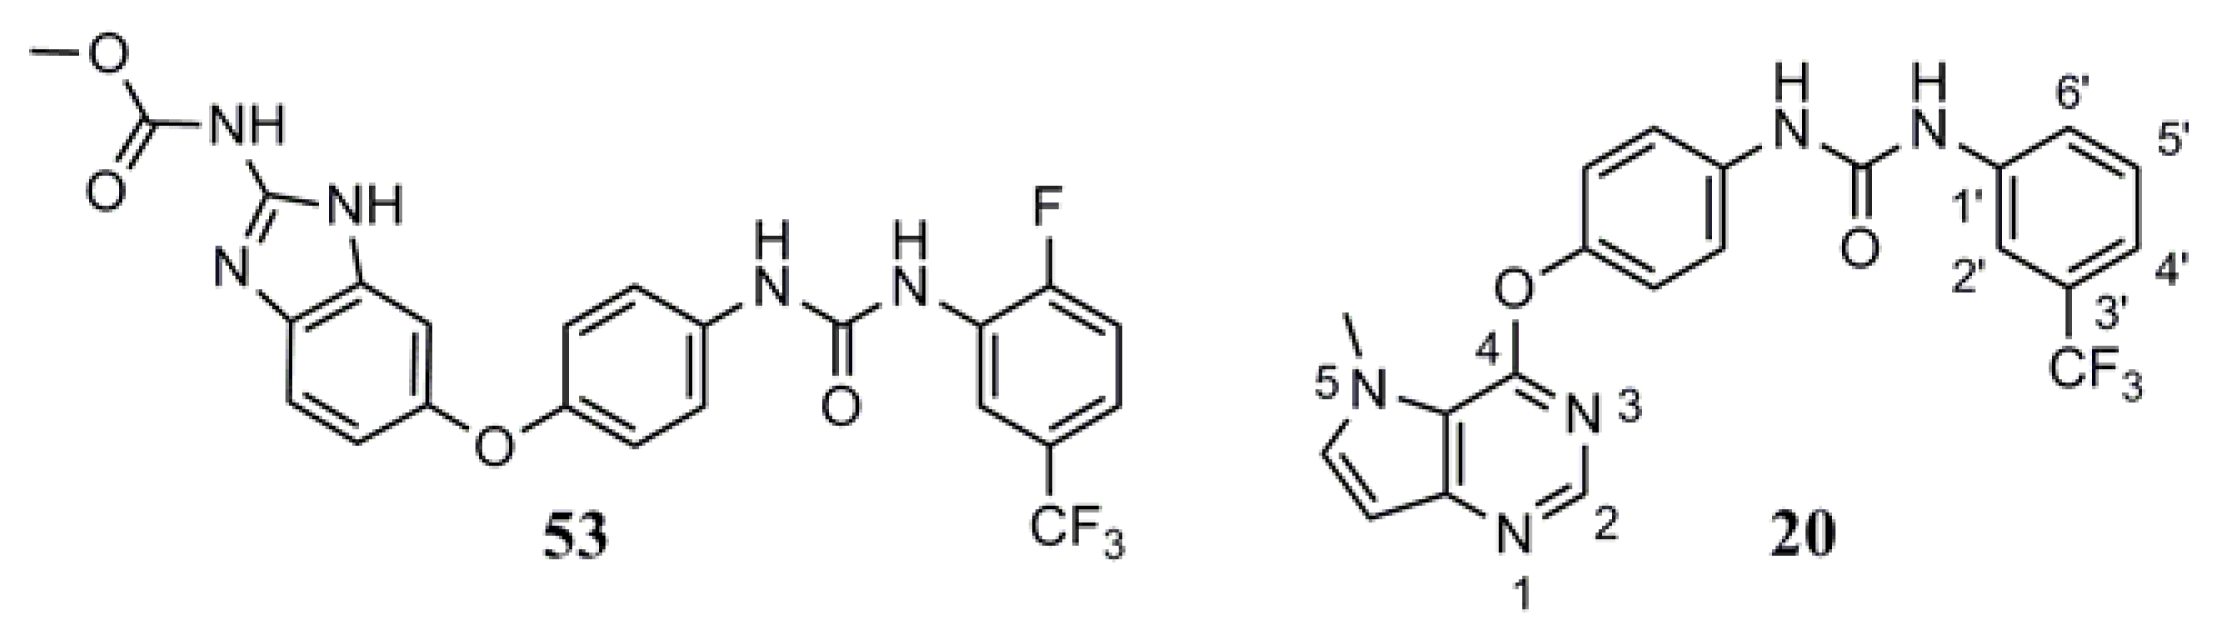
2.2. Data Sets
2.3. Molecular Docking
2.4. Molecular Modeling
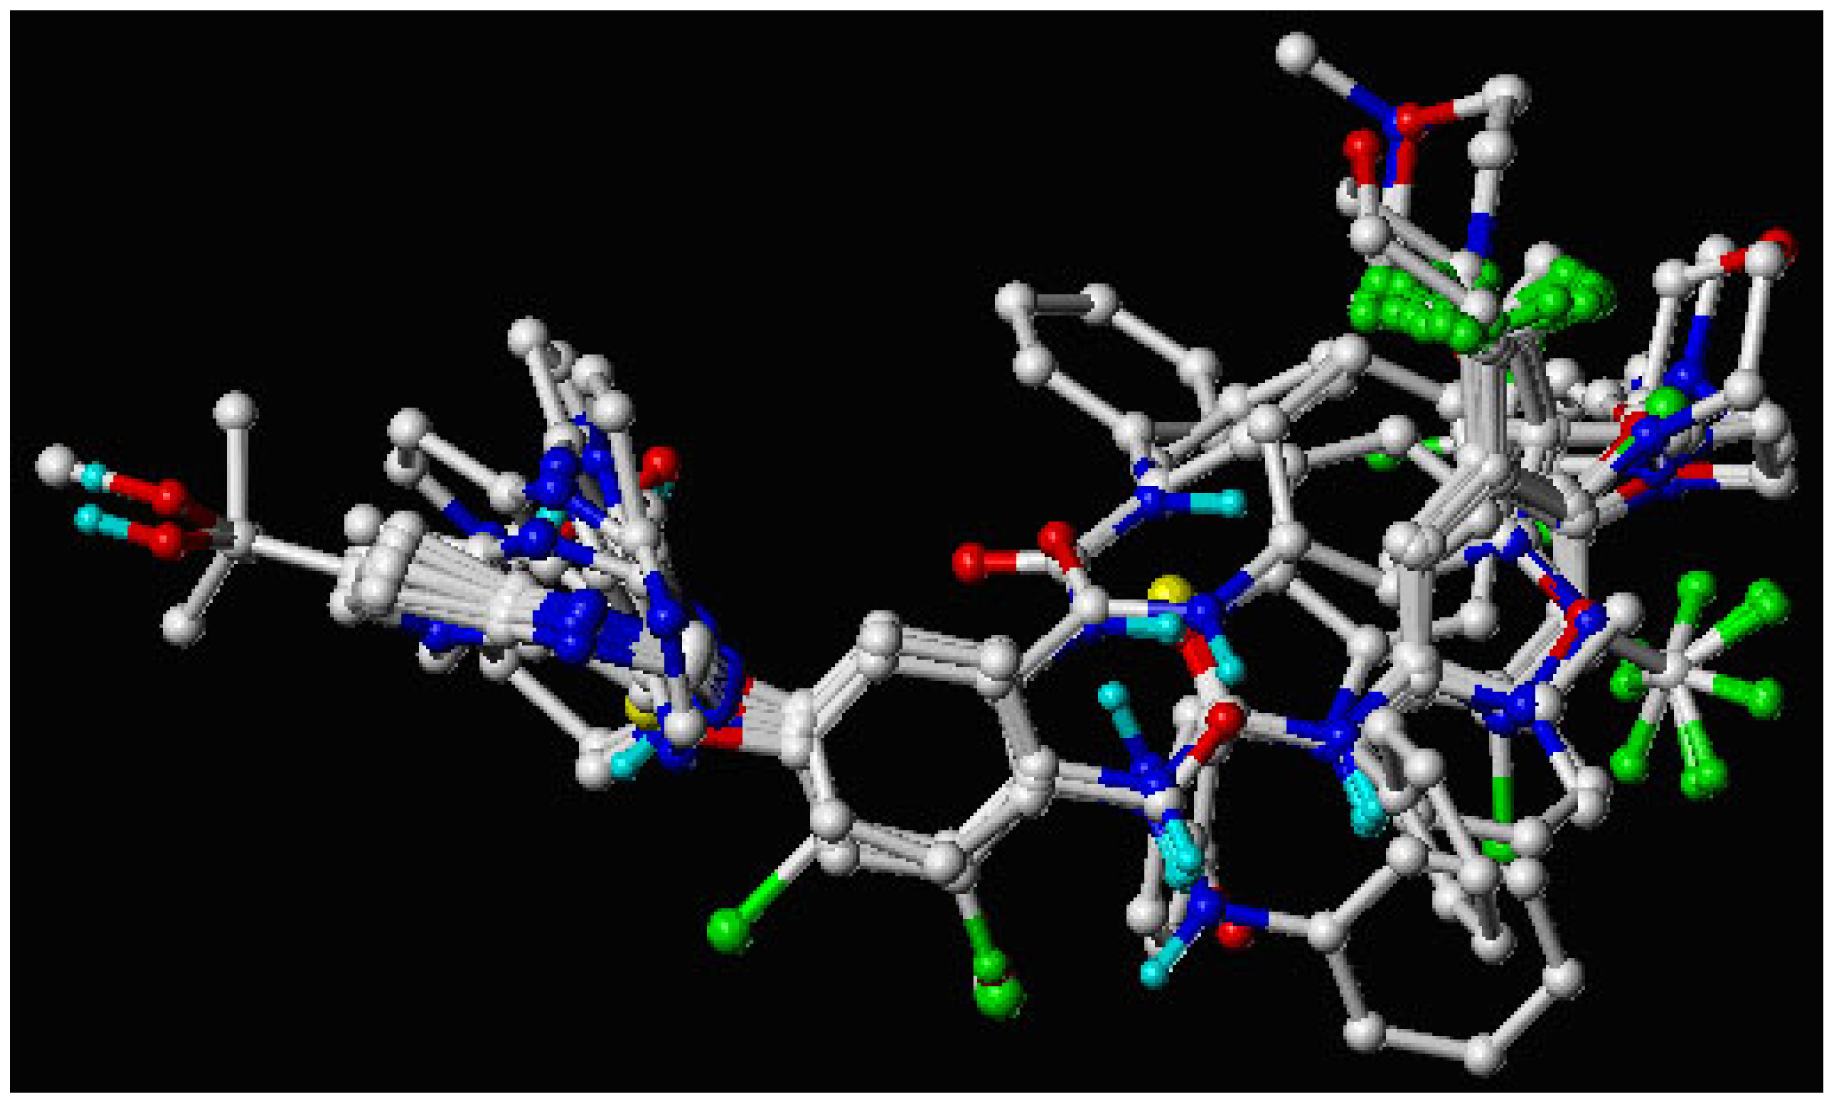
2.5. Molecular Alignment
2.6. CoMFA and CoMSIA Studies
2.7. PLS Regression Analysis and Validation of QSAR Models
3. Results and Discussion
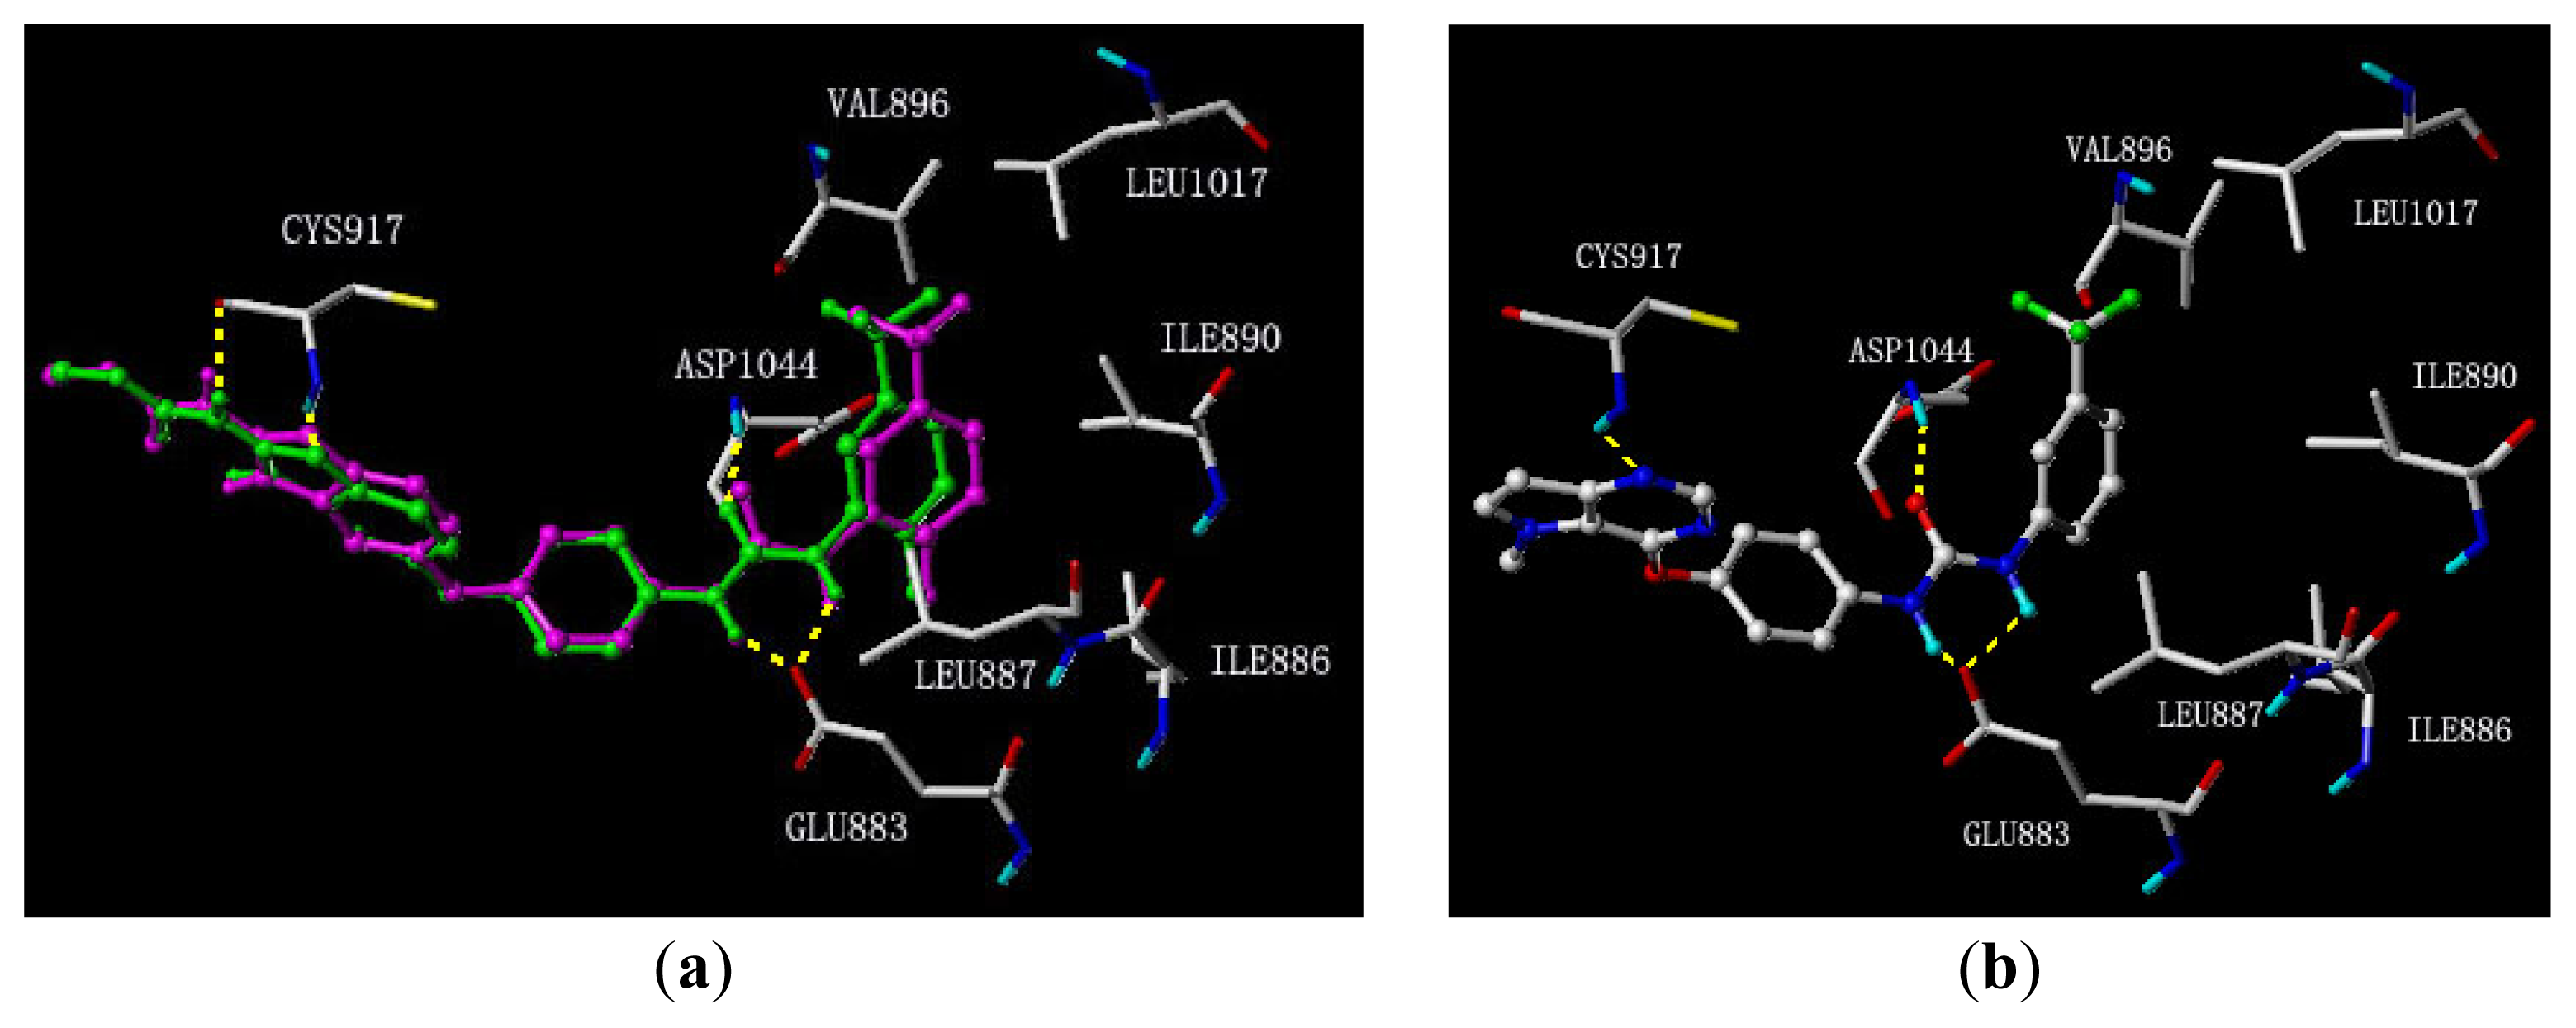
3.1. Binding Modes of Pyrrolo[3,2-d]pyrimidine Derivatives
3.2. CoMFA and CoMSIA Results
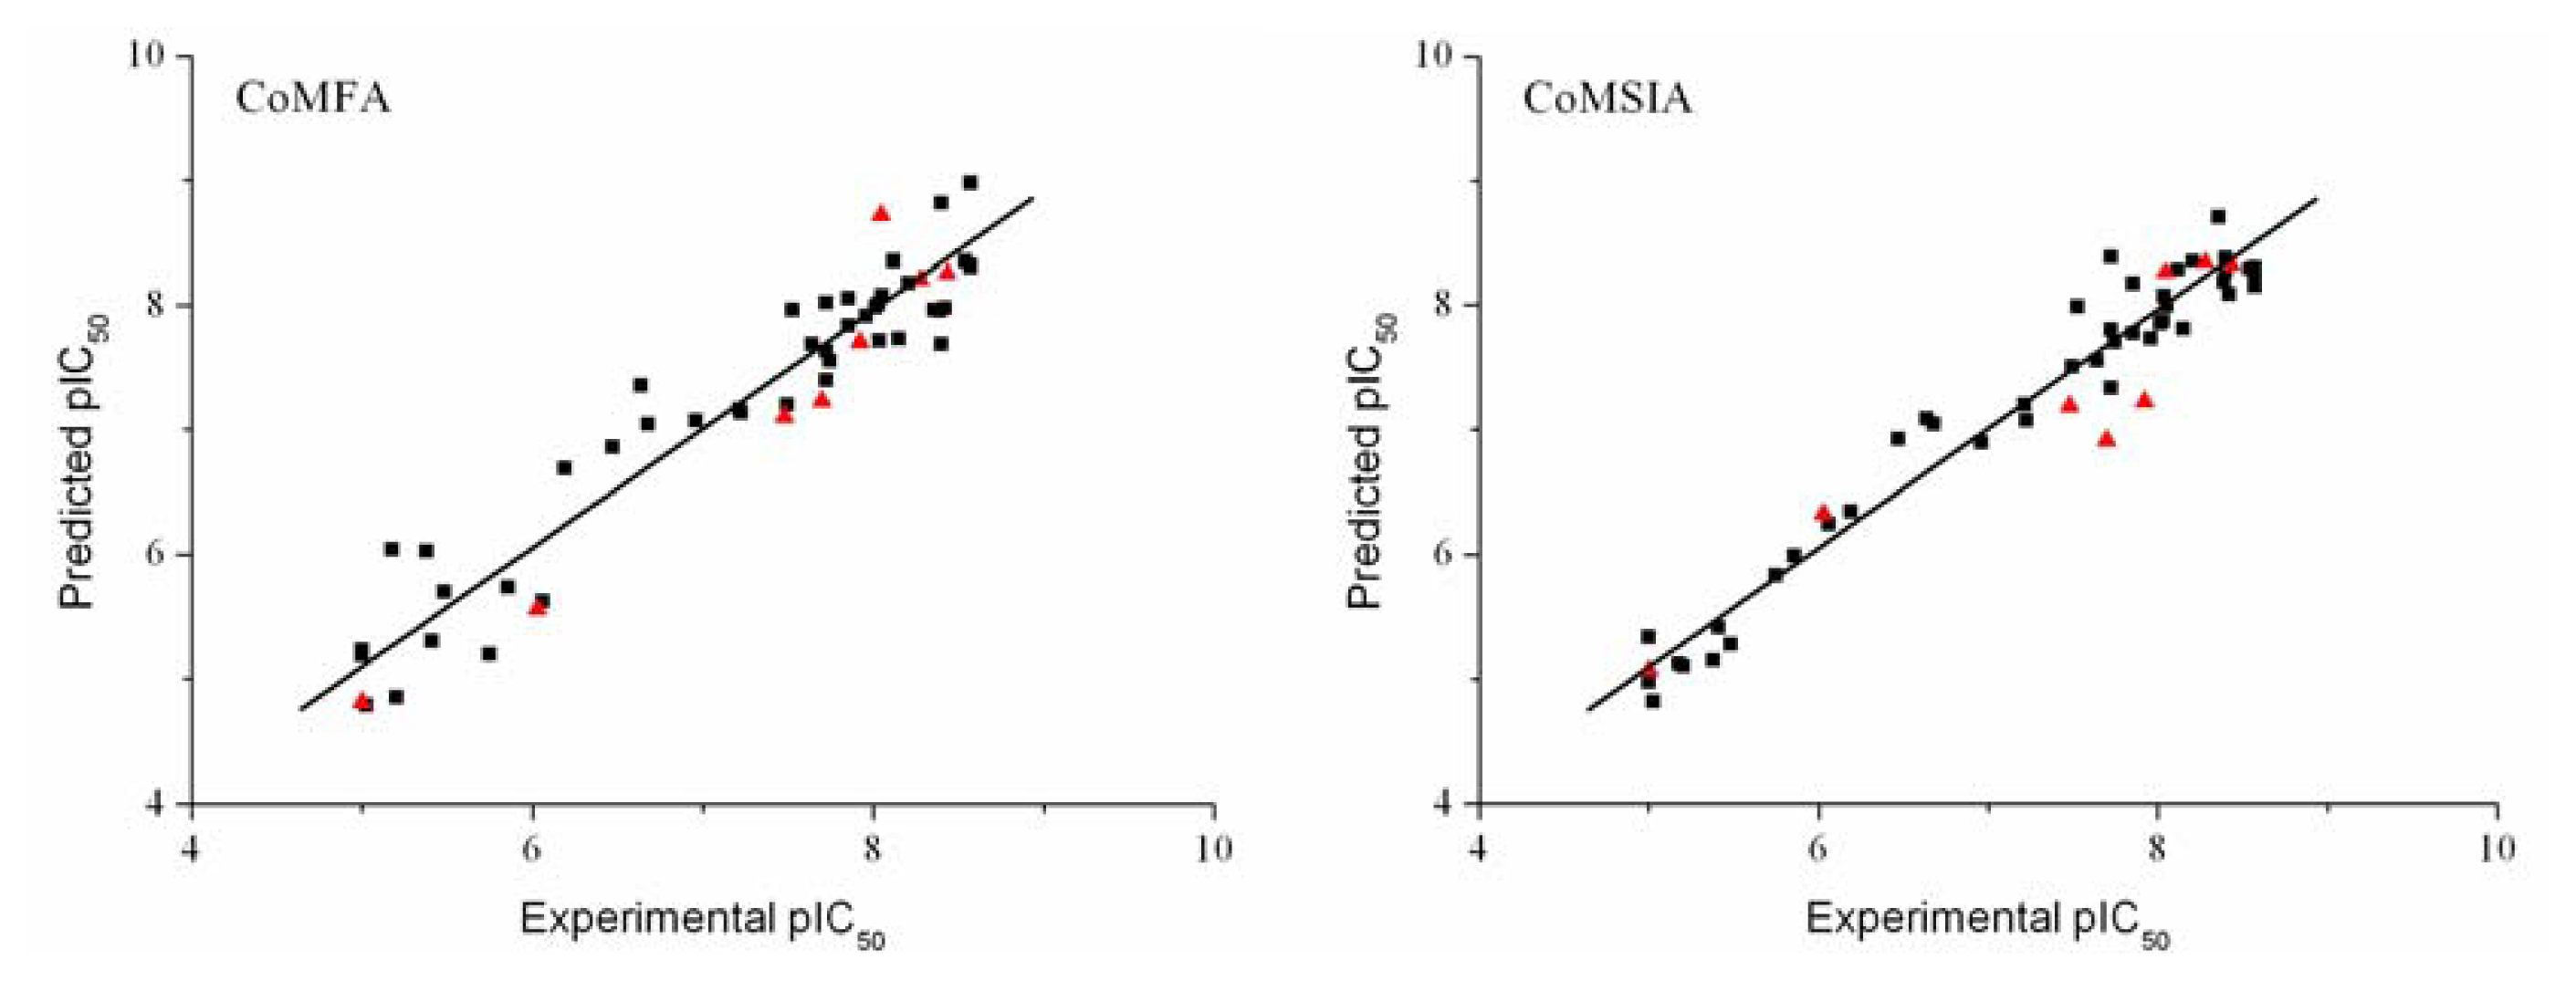
3.3. Validation of the 3D-QSAR Models
3.4. Contour Analysis
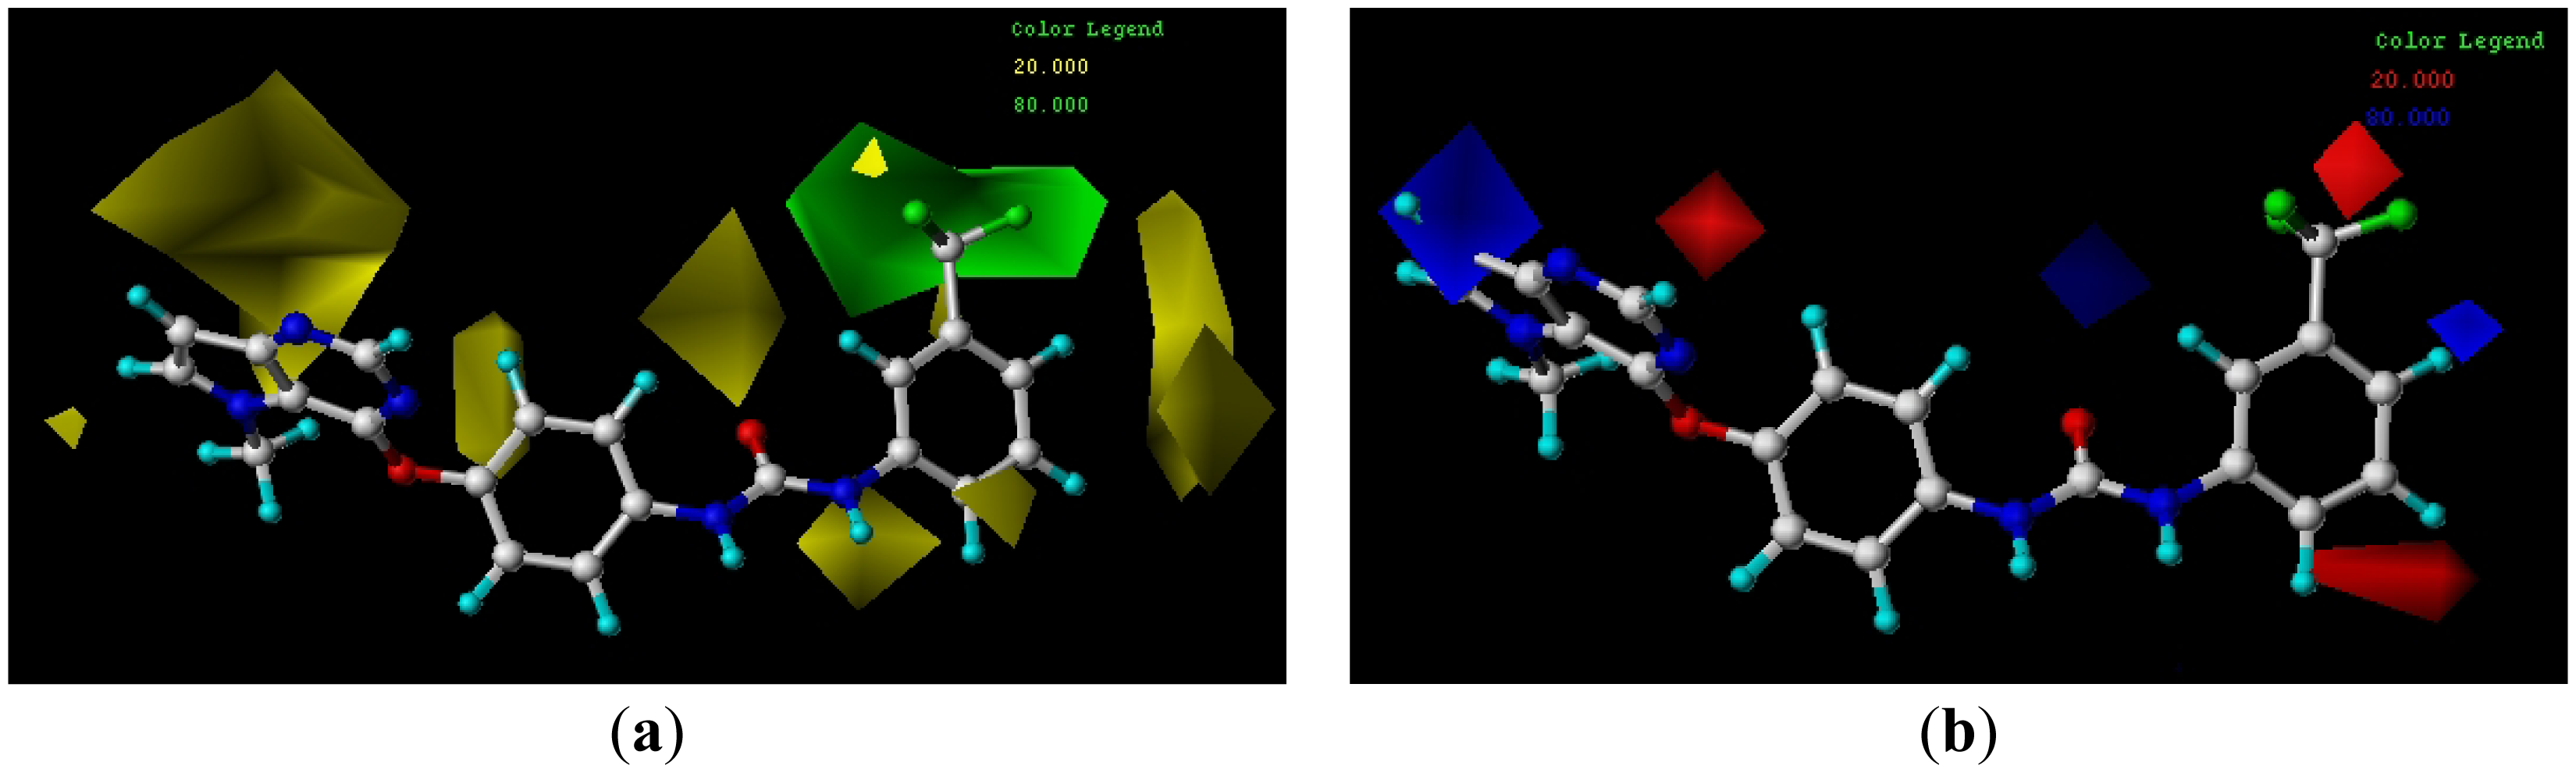
3.4.1. CoMFA Contour Maps
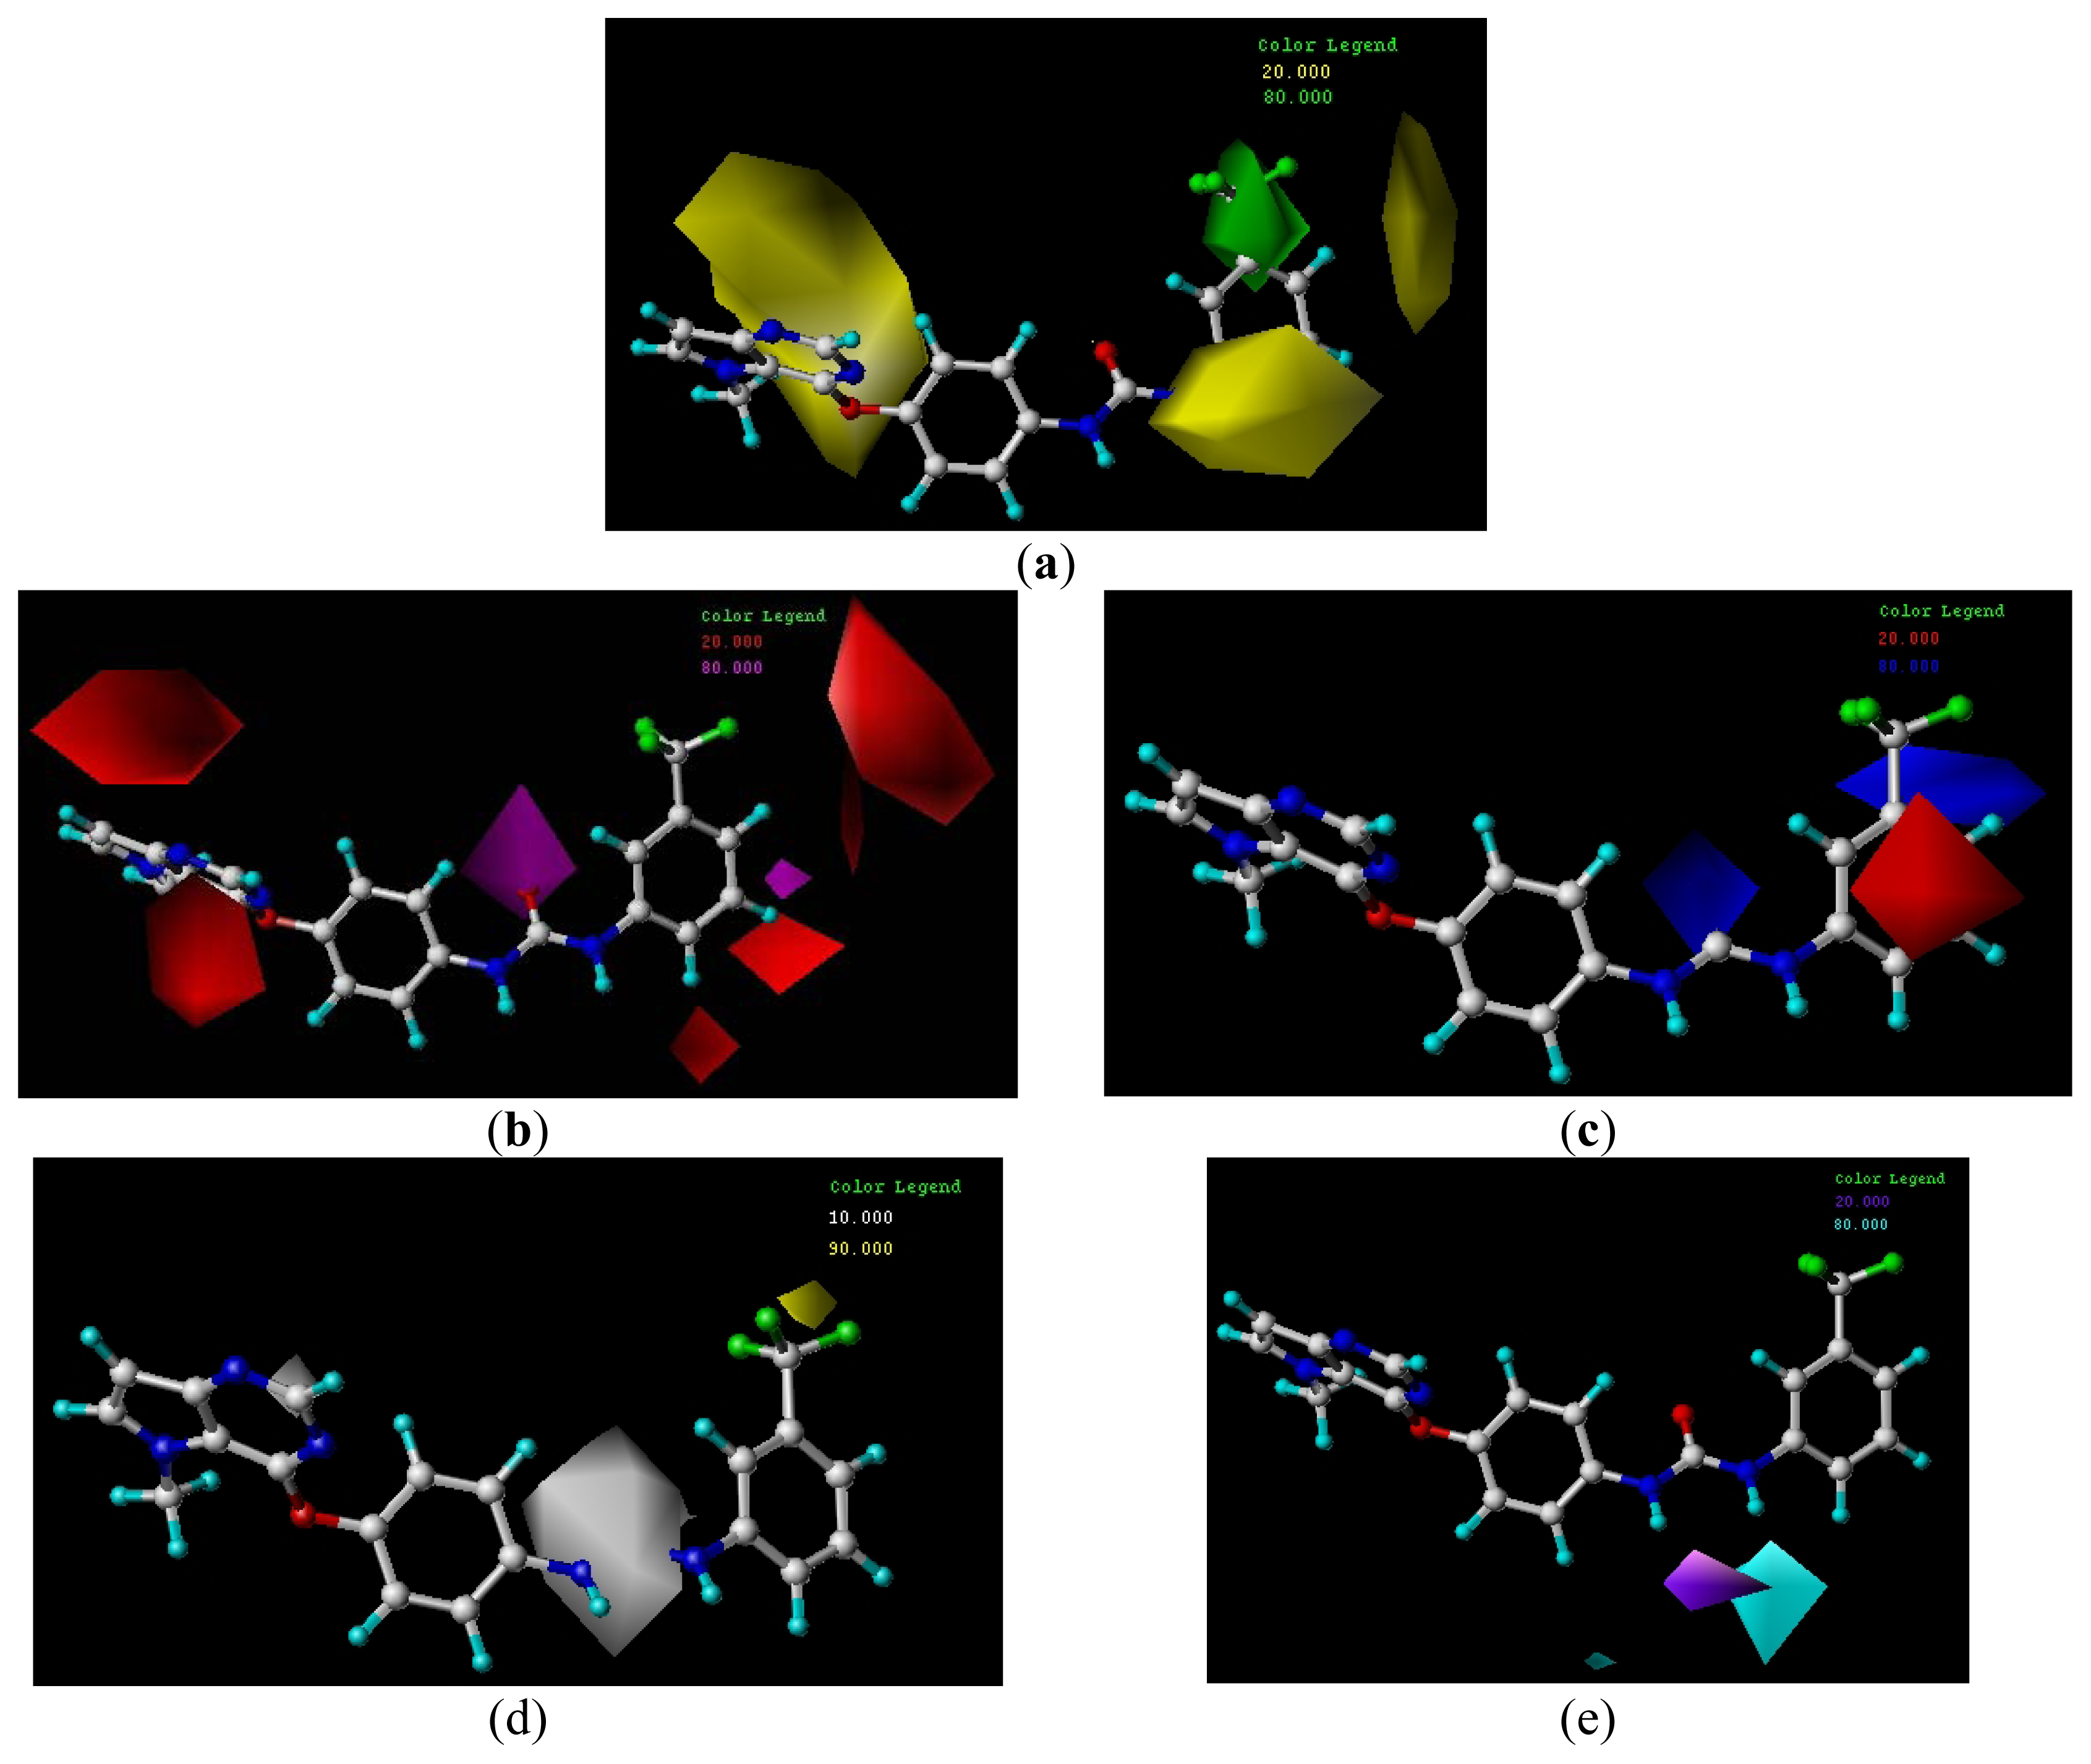
3.4.2. CoMSIA Contour Maps
3.5. Design of New Inhibitors
4. Concluding Remarks
Acknowledgments
References
- Risau, W. Mechanisms of angiogenesis. Nature 1997, 386, 671–674. [Google Scholar]
- Ribatti, D.; Vacca, A.; Nico, B.; Roncali, L.; Dammacco, F. Postnatal vasculogenesis. Mech. Dev 2001, 100, 157–163. [Google Scholar]
- Folkman, J. Anti-angiogenesis: New concept for therapy of solid tumors. Ann. Surg 1972, 175, 409–416. [Google Scholar]
- Liotta, L.A.; Steeg, P.S.; Stetler-Stevenson, W.G. Cancer metastasis and angiogenesis: An imbalance of positive and negative regulation. Cell 1991, 64, 327–336. [Google Scholar]
- Yancopoulos, G.D.; Davis, S.; Gale, N.W.; Rudge, J.S.; Wiegand, S.J.; Holash, J. Vascular-specific growth factors and blood vessel formation. Nature 2000, 407, 242–248. [Google Scholar]
- Hartman, G.D.; Fraley, M.E.; Bilodeau, M.T. Kinase insert domain-containing receptor kinase inhibitors as antiangiogenic agents. Expert. Opin. Invest. Drugs 2002, 11, 737–745. [Google Scholar]
- Hicklin, D.J.; Ellis, L.M. Role of the vascular endothelial growth factor pathway in tumor growth and angiogenesis. J. Clin. Oncol 2005, 23, 1011–1027. [Google Scholar]
- Ferrara, N. Vascular endothelial growth factor: Basic science and clinical progress. Endocr. Rev 2004, 25, 581–611. [Google Scholar]
- Carmeliet, P.; Ferreira, V.; Breier, G.; Pollefeyt, S.; Kieckens, L.; Gertsenstein, M.; Fahrig, M.; Vandenhoeck, A.; Harpal, K.; Eberhardt, C.; et al. Abnormal blood vessel development and lethality in embryos lacking a single VEGF allele. Nature 1996, 380, 435–439. [Google Scholar]
- Ferrara, N.; Davis-Smyth, T. The biology of vascular endothelial growth factor. Endocr. Rev 1997, 18, 4–25. [Google Scholar]
- Holmes, K.; Roberts, O.L.; Thomas, A.M.; Cross, M.J. Vascular endothelial growth factor receptor-2: Structure, function, intracellular signaling and therapeutic inhibition. Cell Signal 2007, 19, 2003–2012. [Google Scholar]
- Fischer, P.M. The design of drug candidate molecules as selective inhibitors of therapeutically relevant protein kinases. Curr. Med. Chem 2004, 11, 1563–1583. [Google Scholar]
- Bogoyevitch, M.A.; Fairlie, D. A new paradigm for protein kinase inhibition: Blocking phosphorylation without directly targeting ATP binding. Drug Discov. Today 2007, 12, 622–633. [Google Scholar]
- Liu, Y.; Gray, N.S. Rational design of inhibitors that bind to inactive kinase conformations. Nat. Chem. Biol 2006, 2, 358–364. [Google Scholar]
- Garuti, L.; Roberti, M.; Bottegoni, G. Non-ATP competitive protein kinase inhibitors. Curr. Med. Chem 2010, 17, 2804–2821. [Google Scholar]
- Okram, B.; Nagle, A.; Adrian, F.J.; Lee, C.; Ren, P.; Wang, X.; Sim, T.; Xie, Y.; Wang, X.; Xia, G.; et al. A general strategy for creating “inactive-conformation” Abl inhibitors. Chem. Biol 2006, 13, 779–786. [Google Scholar]
- Kirkland, L.O.; McInnes, C. Non-ATP competitive protein kinase inhibitors as anti-tumor therapeutics. Biochem. Pharmacol 2009, 77, 1561–1571. [Google Scholar]
- Kiselyov, A.; Balakin, K.V.; Tkachenko, S.E.; Savchuk, N.P. Recent progress in development of non-ATP competitive small-molecule inhibitors of protein kinesis. Mini Rev. Med. Chem 2006, 6, 711–717. [Google Scholar]
- Oguro, Y.; Miyamoto, N.; Okada, K.; Takagi, T.; Iwata, H.; Awazu, Y.; Miki, H.; Hori, A.; Kamiyama, K.; Imamura, S. Design, synthesis, and evaluation of 5-methyl-4-phenoxy-5H-pyrrolo-[ 3,2-d]pyrimidine derivatives: Novel VEGFR2 kinase inhibitors binding to inactive kinase conformation. Bioorg. Med. Chem 2010, 18, 7260–7273. [Google Scholar]
- Oguro, Y.; Miyamoto, N.; Takagi, T.; Okada, K.; Awazu, Y.; Miki, H.; Hori, A.; Kamiyama, K.; Imamura, S. N-Phenyl-N′-[4-(5H-pyrrolo[3,2-d]pyrimidin-4-yloxy) phenyl] ureas as novel inhibitors of VEGFR and FGFR kinases. Bioorg. Med. Chem 2010, 18, 7150–7163. [Google Scholar]
- Cramer, R.D., III; Patterson, D.E.; Bunce, J.D. Comparative molecular field analysis (CoMFA). 1. Effect of shape on binding of steroids to carrier proteins. J. Am. Chem. Soc 1988, 110, 5959–5967. [Google Scholar]
- Klebe, G.; Abraham, U.; Mietzner, T. Molecular similarity indices in a comparative analysis (CoMSIA) of drug molecules to correlate and predict their biological activity. J. Med. Chem 1994, 37, 4130–4146. [Google Scholar]
- Hasegawa, M.; Nishigaki, N.; Washio, Y.; Kano, K.; Harris, P.A.; Sato, H.; Mori, I.; West, R.I.; Shibahara, M.; Toyoda, H.; et al. Discovery of novel benzimidazoles as potent inhibitors of TIE-2 and VEGFR-2 tyrosine kinase receptors. J. Med. Chem 2007, 50, 4453–4470. [Google Scholar]
- Sybyl 7.3; Tripos Associates Inc.: St. Louis, MO, USA, 2009.
- Jain, A.N. Surflex: Fully automatic flexible molecular docking using a molecular similarity-based search engine. J. Med. Chem 2003, 46, 499–511. [Google Scholar]
- Jain, A.N. Surflex-Dock 2.1: Robzust performance from ligand energetic modeling, ring flexibility, and knowledge-based search. J. Comput. Aided Mol. Des 2007, 21, 281–306. [Google Scholar]
- Pan, J.; Liu, G.Y.; Cheng, J.; Chen, X.J.; Ju, X.L. CoMFA and molecular docking studies of benzoxazoles and benzothiazoles as CYP450 1A1 inhibitors. Eur. J. Med. Chem 2010, 45, 967–972. [Google Scholar]
- Sun, J.Y.; Cai, S.; Yan, N.; Mei, H. Docking and 3D-QSAR studies of influenza neuraminidase inhibitors using three-dimensional holographic vector of atomic interaction field analysis. Eur. J. Med. Chem 2010, 45, 1008–1014. [Google Scholar]
- Lan, P.; Chen, W.N.; Sun, P.H.; Chen, W.M. 3D-QSAR and molecular docking studies of azaindole derivatives as Aurora B kinase inhibitors. J. Mol. Model 2011, 17, 1191–1205. [Google Scholar]
- Ai, Y.; Wang, S.-T.; Sun, P.-H.; Song, F.-J. Molecular modeling studies of 4,5-Dihydro-1H-pyrazolo[ 4,3-h] quinazoline derivatives as potent CDK2/Cyclin a inhibitors using 3D-QSAR and docking. Int. J. Mol. Sci 2010, 11, 3705–3724. [Google Scholar]
- Ai, Y.; Wang, S.-T.; Sun, P.-H.; Song, F.-J. Combined 3D-QSAR modeling and molecular docking studies on Pyrrole-Indolin-2-ones as Aurora A Kinase inhibitors. Int. J. Mol. Sci 2011, 12, 1605–1624. [Google Scholar]
- Zhang, B.-D.; Li, Y.; Zhang, H.-X.; Ai, C.-Z. 3D-QSAR and molecular docking studies on derivatives of MK-0457, GSK1070916 and SNS-314 as inhibitors against Aurora B Kinase. Int. J. Mol. Sci 2010, 11, 4326–4347. [Google Scholar]
- Liu, J.-L.; Wang, F-F.; Ma, Z.; Wang, X.; Wang, Y.H. Structural determination of three different series of compounds as Hsp90 inhibitors using 3D-QSAR modeling, molecular docking and molecular dynamics methods. Int. J. Mol. Sci. 2011, 12, 946–970. [Google Scholar]
- Wu, X.-Y; Wu, S.-G; Chen, W.-H. Molecular docking and 3D-QSAR study on 4-(1H-indazol-4- yl)phenylamino and aminopyrazolopyridine urea derivatives as kinase insert domain receptor (KDR) inhibitors. J. Mol. Model 2011. [Google Scholar] [CrossRef]
- Sun, J.; Cai, S.; Mei, H.; Li, J.; Yan, N.; Wang, Y. Docking and 3D QSAR study of thiourea analogs as potent inhibitors of influenza virus neuraminidase. J. Mol. Model 2010, 16, 1809–1818. [Google Scholar]


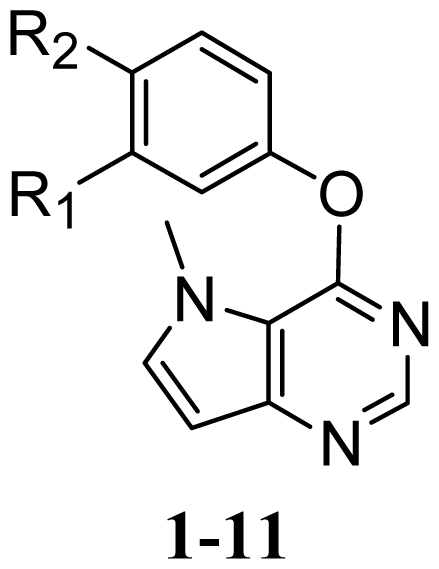
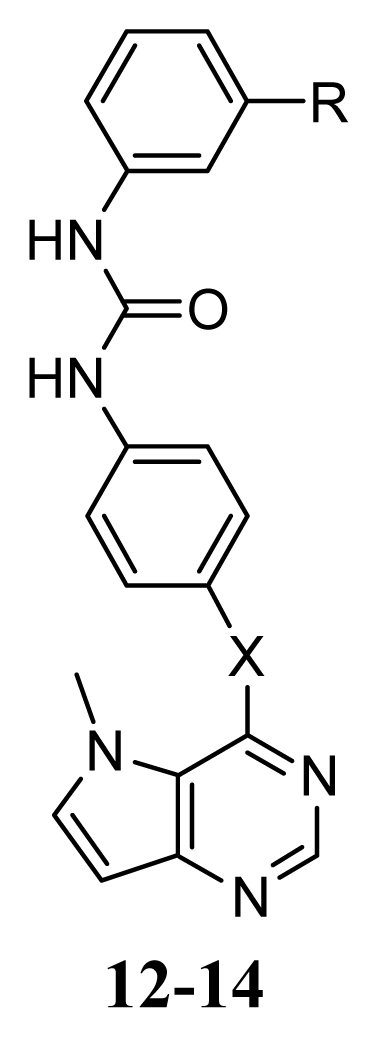
| Structure | Compound | Substituent | |
|---|---|---|---|
| R1 | R2 | ||
 | 1 | NHCONHPh | H |
| 2 * | NHCOPh | H | |
| 3 | CONHPh | H | |
| 4 | H | NHCOPh | |
| 5 | H | CONHPh | |
| 6 * | H | NHCOCH2Ph | |
| 7 | H | CH2CONHPh | |
| 8 | H | NHCSNHPh | |
| 9 | H |  | |
| 10 | H | NHCONHMe | |
| 11 | H | NHCONHPr | |
 | X | R | |
| 12 | S | H | |
| 13 | NH | H | |
| 14 | N(Me) | 3-CF3 | |
 | |||
| Structure | Compound | Substituent | ||||
|---|---|---|---|---|---|---|
| R | R1 | R2 | R3 | R4 | ||
 | 16 * | Ph | H | H | Me | H |
| 17 | 2-ClPh | H | H | Me | H | |
| 18 | 3-ClPh | H | H | Me | H | |
| 19 | 4-ClPh | H | H | Me | H | |
| 20 * | 3-CF3Ph | H | H | Me | H | |
| 21 | 3-BrPh | H | H | Me | H | |
| 22 | 3-FPh | H | H | Me | H | |
| 23 | 3-MePh | H | H | Me | H | |
| 24 * | 3-CF3Ph | Cl | H | Me | H | |
| 25 | 3-CF3Ph | H | Cl | Me | H | |
| 26 | 3-CF3Ph | OMe | H | Me | H | |
| 27 | 3-CF3Ph | F | H | Me | H | |
| 28 | 3-CF3Ph | Cl | H | (CH2)2OH | H | |
| 29 * | 3-CF3Ph | Cl | H | (CH2)2OMe | H | |
| 30 | 3-CF3Ph | Cl | H | (CH2)2O(CH2)2OH | H | |
| 31 | 3-CF3Ph | Cl | H | Me | CH2OH | |
| 32 | 3-CF3Ph | Cl | H | Me | CH2OMe | |
| 33 | 3-CF3Ph | Cl | H | Me | CMe2OH | |
| 34 | 2-C5H4N | Cl | H | Me | H | |
| 35 | 3-C5H4N | Cl | H | Me | H | |
| 36 | 4-C5H4N | Cl | H | Me | H | |
| 37 | 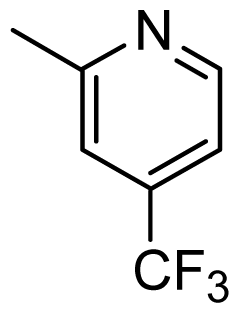 | Cl | H | Me | H | |
| 38 | 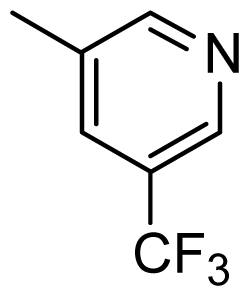 | Cl | H | Me | H | |
| 39 | 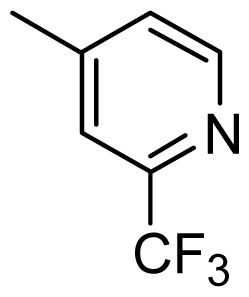 | Cl | H | Me | H | |
| 40 |  | Cl | H | Me | H | |
| 41 |  | Cl | H | Me | H | |
| 42 |  | Cl | H | Me | H | |
| 43 |  | Cl | H | Me | H | |
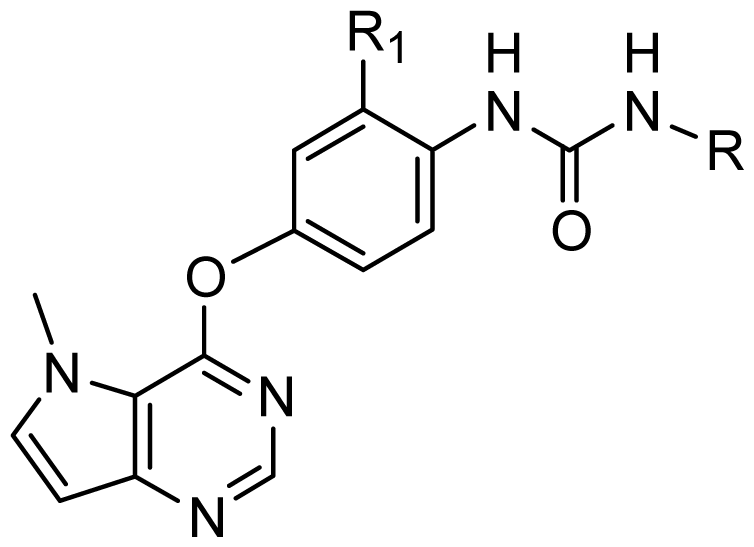
| R1 | R2 | |||||
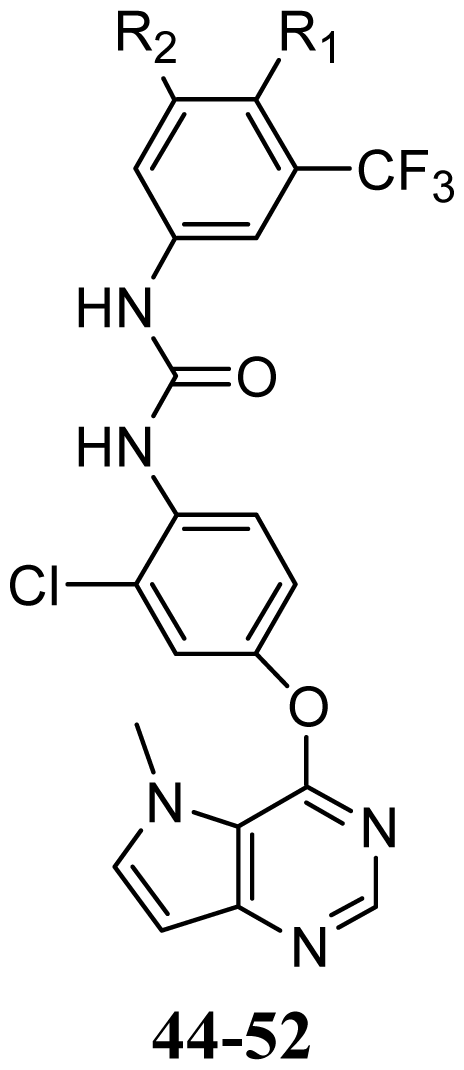 | 44 | OMe | H | |||
| 45 |  | H | ||||
| 46 |  | H | ||||
| 47 |  | H | ||||
| 48 * |  | H | ||||
| 49 * | H | OMe | ||||
| 50 | H |  | ||||
| 51 | H |  | ||||
| 52 | H |  | ||||
| Compound | Exp pIC50 | COMFA | COMSIA | ||
|---|---|---|---|---|---|
| Pred | Resid | Pred | Resid | ||
| 1 | 5.745 | 5.194 | 0.551 | 5.834 | −0.089 |
| 2 * | 6.027 | 5.563 | 0.464 | 6.327 | −0.300 |
| 3 | 6.060 | 5.621 | 0.439 | 6.246 | −0.185 |
| 4 | 5.027 | 4.788 | 0.239 | 4.821 | 0.206 |
| 5 | 5.000 | 5.192 | −0.192 | 4.980 | 0.020 |
| 6 * | 5.000 | 4.808 | 0.192 | 5.074 | −0.074 |
| 7 | 5.481 | 5.698 | −0.216 | 5.285 | 0.197 |
| 8 | 5.174 | 6.042 | −0.868 | 5.129 | 0.045 |
| 9 | 5.377 | 6.029 | −0.652 | 5.156 | 0.221 |
| 10 | 5.201 | 4.852 | 0.349 | 5.108 | 0.093 |
| 11 | 5.409 | 5.307 | 0.102 | 5.420 | −0.011 |
| 12 | 6.959 | 7.074 | −0.116 | 6.895 | 0.063 |
| 13 | 5.854 | 5.738 | 0.116 | 5.987 | −0.133 |
| 14 | 5.000 | 5.233 | −0.233 | 5.341 | −0.341 |
| 15 | 8.149 | 7.729 | 0.420 | 7.810 | 0.339 |
| 16 * | 7.481 | 7.103 | 0.379 | 7.189 | 0.293 |
| 17 | 6.469 | 6.863 | −0.394 | 6.927 | −0.458 |
| 18 | 8.387 | 7.959 | 0.428 | 8.187 | 0.200 |
| 19 | 7.495 | 7.201 | 0.293 | 7.503 | −0.008 |
| 20 * | 8.276 | 8.209 | 0.066 | 8.341 | −0.066 |
| 21 | 8.357 | 7.969 | 0.387 | 8.710 | −0.354 |
| 22 | 7.721 | 7.400 | 0.321 | 7.335 | 0.387 |
| 23 | 8.569 | 8.323 | 0.246 | 8.153 | 0.415 |
| 24 * | 8.432 | 8.255 | 0.177 | 8.324 | 0.108 |
| 25 | 7.523 | 7.966 | −0.443 | 7.987 | −0.464 |
| 26 | 7.854 | 8.056 | −0.202 | 8.171 | −0.317 |
| 27 | 8.208 | 8.176 | 0.032 | 8.357 | −0.149 |
| 28 | 8.398 | 8.812 | −0.414 | 8.386 | 0.012 |
| 29 * | 8.046 | 8.717 | −0.671 | 8.262 | −0.216 |
| 30 | 8.569 | 8.977 | −0.408 | 8.308 | 0.261 |
| 31 | 8.013 | 7.987 | 0.027 | 7.851 | 0.162 |
| 32 | 7.854 | 7.835 | 0.019 | 7.774 | 0.080 |
| 33 | 7.745 | 7.554 | 0.191 | 7.701 | 0.044 |
| 34 | 6.678 | 7.047 | −0.369 | 7.042 | −0.364 |
| 35 | 6.638 | 7.354 | −0.716 | 7.090 | −0.451 |
| 36 | 6.187 | 6.691 | −0.504 | 6.342 | −0.155 |
| 37 | 8.569 | 8.307 | 0.262 | 8.265 | 0.303 |
| 38 | 8.538 | 8.357 | 0.181 | 8.288 | 0.249 |
| 39 | 8.420 | 7.983 | 0.438 | 8.084 | 0.336 |
| 40 | 8.398 | 7.689 | 0.709 | 8.273 | 0.125 |
| 41 | 8.119 | 8.357 | −0.238 | 8.282 | −0.163 |
| 42 | 8.051 | 8.079 | −0.028 | 7.993 | 0.058 |
| 43 | 7.721 | 8.019 | −0.297 | 8.392 | −0.670 |
| 44 | 8.027 | 8.013 | 0.013 | 7.875 | 0.152 |
| 45 | 7.215 | 7.165 | 0.050 | 7.203 | 0.011 |
| 46 | 7.721 | 7.634 | 0.088 | 7.805 | −0.084 |
| 47 | 8.032 | 7.721 | 0.310 | 8.072 | −0.041 |
| 48 * | 7.921 | 7.706 | 0.215 | 7.226 | 0.695 |
| 49 * | 7.699 | 7.234 | 0.465 | 6.911 | 0.788 |
| 50 | 7.222 | 7.135 | 0.087 | 7.073 | 0.149 |
| 51 | 7.638 | 7.689 | −0.051 | 7.553 | 0.086 |
| 52 | 7.959 | 7.914 | 0.044 | 7.735 | 0.223 |
| N | q2 | r2 | SEE | F | r2pred | Field contribution | |||||
|---|---|---|---|---|---|---|---|---|---|---|---|
| S | E | H | D | A | |||||||
| CoMFA | 4 | 0.542 | 0.912 | 0.376 | 100.462 | 0.913 | 0.525 | 0.475 | - | - | - |
| CoMSIA | 5 | 0.552 | 0.955 | 0.272 | 161.245 | 0.897 | 0.184 | 0.228 | 0.343 | 0.063 | 0.182 |
 | ||||
|---|---|---|---|---|
| Compound | R | R1 | Predicted pIC50 | |
| CoMFA | CoMSIA | |||
| D1 | Cl |  | 8.162 | 8.052 |
| D2 | Cl |  | 8.463 | 8.049 |
| D3 | Cl |  | 7.972 | 7.876 |
| D4 | Cl |  | 8.373 | 9.102 |
| D5 | Cl |  | 8.124 | 8.696 |
| D6 | Cl |  | 7.797 | 8.405 |
| D7 | H | 3-EtPh | 8.216 | 8.507 |
| D8 | H | 3-CH2CF3Ph | 8.378 | 8.891 |
| D9 | H | 3,4-2CH3Ph | 8.193 | 8.609 |
| D10 | H | 3-CF3,4-CH3Ph | 8.234 | 8.837 |
| D11 | Cl | 3-CH3Ph | 7.993 | 8.096 |
| D12 | Cl | 3,4-2CH3Ph | 8.170 | 8.582 |
| D13 | Cl | 3-CF3,4-CH3Ph | 8.258 | 8.814 |
| D14 | Cl | 3-ClPh | 7.898 | 8.245 |
| D15 | Cl | 3-Cl,4-CH3Ph | 8.191 | 8.731 |
© 2012 by the authors; licensee Molecular Diversity Preservation International, Basel, Switzerland. This article is an open-access article distributed under the terms and conditions of the Creative Commons Attribution license (http://creativecommons.org/licenses/by/3.0/).
Share and Cite
Wu, X.-Y.; Chen, W.-H.; Wu, S.-G.; Tian, Y.-X.; Zhang, J.-J. Pyrrolo[3,2-d]pyrimidine Derivatives as Type II Kinase Insert Domain Receptor (KDR) Inhibitors: CoMFA and CoMSIA Studies. Int. J. Mol. Sci. 2012, 13, 2387-2404. https://doi.org/10.3390/ijms13022387
Wu X-Y, Chen W-H, Wu S-G, Tian Y-X, Zhang J-J. Pyrrolo[3,2-d]pyrimidine Derivatives as Type II Kinase Insert Domain Receptor (KDR) Inhibitors: CoMFA and CoMSIA Studies. International Journal of Molecular Sciences. 2012; 13(2):2387-2404. https://doi.org/10.3390/ijms13022387
Chicago/Turabian StyleWu, Xiao-Yun, Wen-Hua Chen, Shu-Guang Wu, Yuan-Xin Tian, and Jia-Jie Zhang. 2012. "Pyrrolo[3,2-d]pyrimidine Derivatives as Type II Kinase Insert Domain Receptor (KDR) Inhibitors: CoMFA and CoMSIA Studies" International Journal of Molecular Sciences 13, no. 2: 2387-2404. https://doi.org/10.3390/ijms13022387
APA StyleWu, X.-Y., Chen, W.-H., Wu, S.-G., Tian, Y.-X., & Zhang, J.-J. (2012). Pyrrolo[3,2-d]pyrimidine Derivatives as Type II Kinase Insert Domain Receptor (KDR) Inhibitors: CoMFA and CoMSIA Studies. International Journal of Molecular Sciences, 13(2), 2387-2404. https://doi.org/10.3390/ijms13022387