Article

Prediction of Bioluminescent Proteins Using Auto Covariance Transformation of Evolutional Profiles

1
School of Computer Science and Information Technology, Northeast Normal University, Changchun 130117, China
2
School of Life Sciences, Northeast Normal University, Changchun 130024, China
3
National Engineering Laboratory for Druggable Gene and Protein Screening, Northeast Normal University, Changchun 130024, China
*
Authors to whom correspondence should be addressed.
Int. J. Mol. Sci. 2012, 13(3), 3650-3660; https://doi.org/10.3390/ijms13033650
Submission received: 10 January 2012 / Revised: 21 February 2012 / Accepted: 5 March 2012 / Published: 19 March 2012

Abstract

:
Bioluminescent proteins are important for various cellular processes, such as gene expression analysis, drug discovery, bioluminescent imaging, toxicity determination, and DNA sequencing studies. Hence, the correct identification of bioluminescent proteins is of great importance both for helping genome annotation and providing a supplementary role to experimental research to obtain insight into bioluminescent proteins’ functions. However, few computational methods are available for identifying bioluminescent proteins. Therefore, in this paper we develop a new method to predict bioluminescent proteins using a model based on position specific scoring matrix and auto covariance. Tested by 10-fold cross-validation and independent test, the accuracy of the proposed model reaches 85.17% for the training dataset and 90.71% for the testing dataset respectively. These results indicate that our predictor is a useful tool to predict bioluminescent proteins. This is the first study in which evolutionary information and local sequence environment information have been successfully integrated for predicting bioluminescent proteins. A web server (BLPre) that implements the proposed predictor is freely available.

1. Introduction

Bioluminescence is a process in which light is produced in an organism by means of a chemical reaction [1,2]. Bioluminescence has been found in various organisms like squid, bacteria, fungi, ctenophore, algae and fish, etc. [3,4]. All bioluminescent reactions occur in the presence of oxygen. At least two chemicals are required in the bioluminescence process. The one which produces the light is genetically called a luciferin and the one that drives to catalyze the reaction is called a luciferase [5]. In the basic reaction, the luciferase catalyzes the oxidation of luciferin, resulting in light and an inactive oxyluciferin. In order to produce more luciferin, energy must be provided to the reaction system. Sometimes the luciferin and luciferase (as well as co-factor such as oxygen) are bound together in a single unit called a photoprotein. When a particular type of ion is added to the system, this molecule can be triggered to produce light.
Bioluminescence serves various functions, such as attraction of mates, attraction of prey, camouflage, finding food, signaling other members of their species and illumination of prey [35]. The application of bioluminescence can greatly promote the progress in the field of medical and commercial areas. Thus, identification of bioluminescent proteins could help to discover many still unknown functions and design new commercial and medical applications.
Until now, both experimental and computational methods [6,7] have been developed to investigate the bioluminescent proteins. But in vitro and in vivo methods are often time-consuming, expensive and have very limited scopes due to some restrictions for many enzymatic reactions. On the other hand, in silico prediction of bioluminescent proteins from computational approaches may provide fast and automatic annotations for candidate bioluminescent proteins. However, there are few studies using computational approaches to discriminate bioluminescent proteins and non-bioluminescent proteins. Kandaswamy et al. [8] have tried to solve this problem using support vector machine (SVM). To the best of our knowledge, that is the first and the only paper utilizing machine learning technique to deal with the prediction of bioluminescent proteins. With the model BLProt, they obtained 80% accuracy from training dataset and 80.06% accuracy from test dataset. A list of 544 physicochemical properties [9] was used to encode each protein sequence. The problem is worthy of further investigation because the prediction performance is not always satisfactory and there were no online web servers up until now.
In this study, we develop a new computational method to predict bioluminescent proteins. First, sequential evolution information in the form of position specific scoring matrix (PSSM) generated from the inquired sequences is obtained by PSI-BLAST. Second, the PSSM is transformed into a fixed-length feature vector by auto covariance (AC) transformation. This encoding strategy (PSSM-AC) has been successfully utilized to predict protein structural classes [10] and discriminate membrane proteins [11]. Finally, these resulting vectors are input to an SVM classifier to perform the prediction. Tested by 10-fold cross-validation and independent test, the accuracy of the proposed predictor reaches 85.17% for the training dataset and 90.71% for the testing dataset respectively, which are significantly higher than those by the existing predictors. We reckon that this efficient performance enhancement is largely due to the good discrimination capabilities of the feature extraction strategy PSSM-AC and the learning capabilities of SVM. The proposed predictor is freely accessible to the public at the web server BLPre [12].

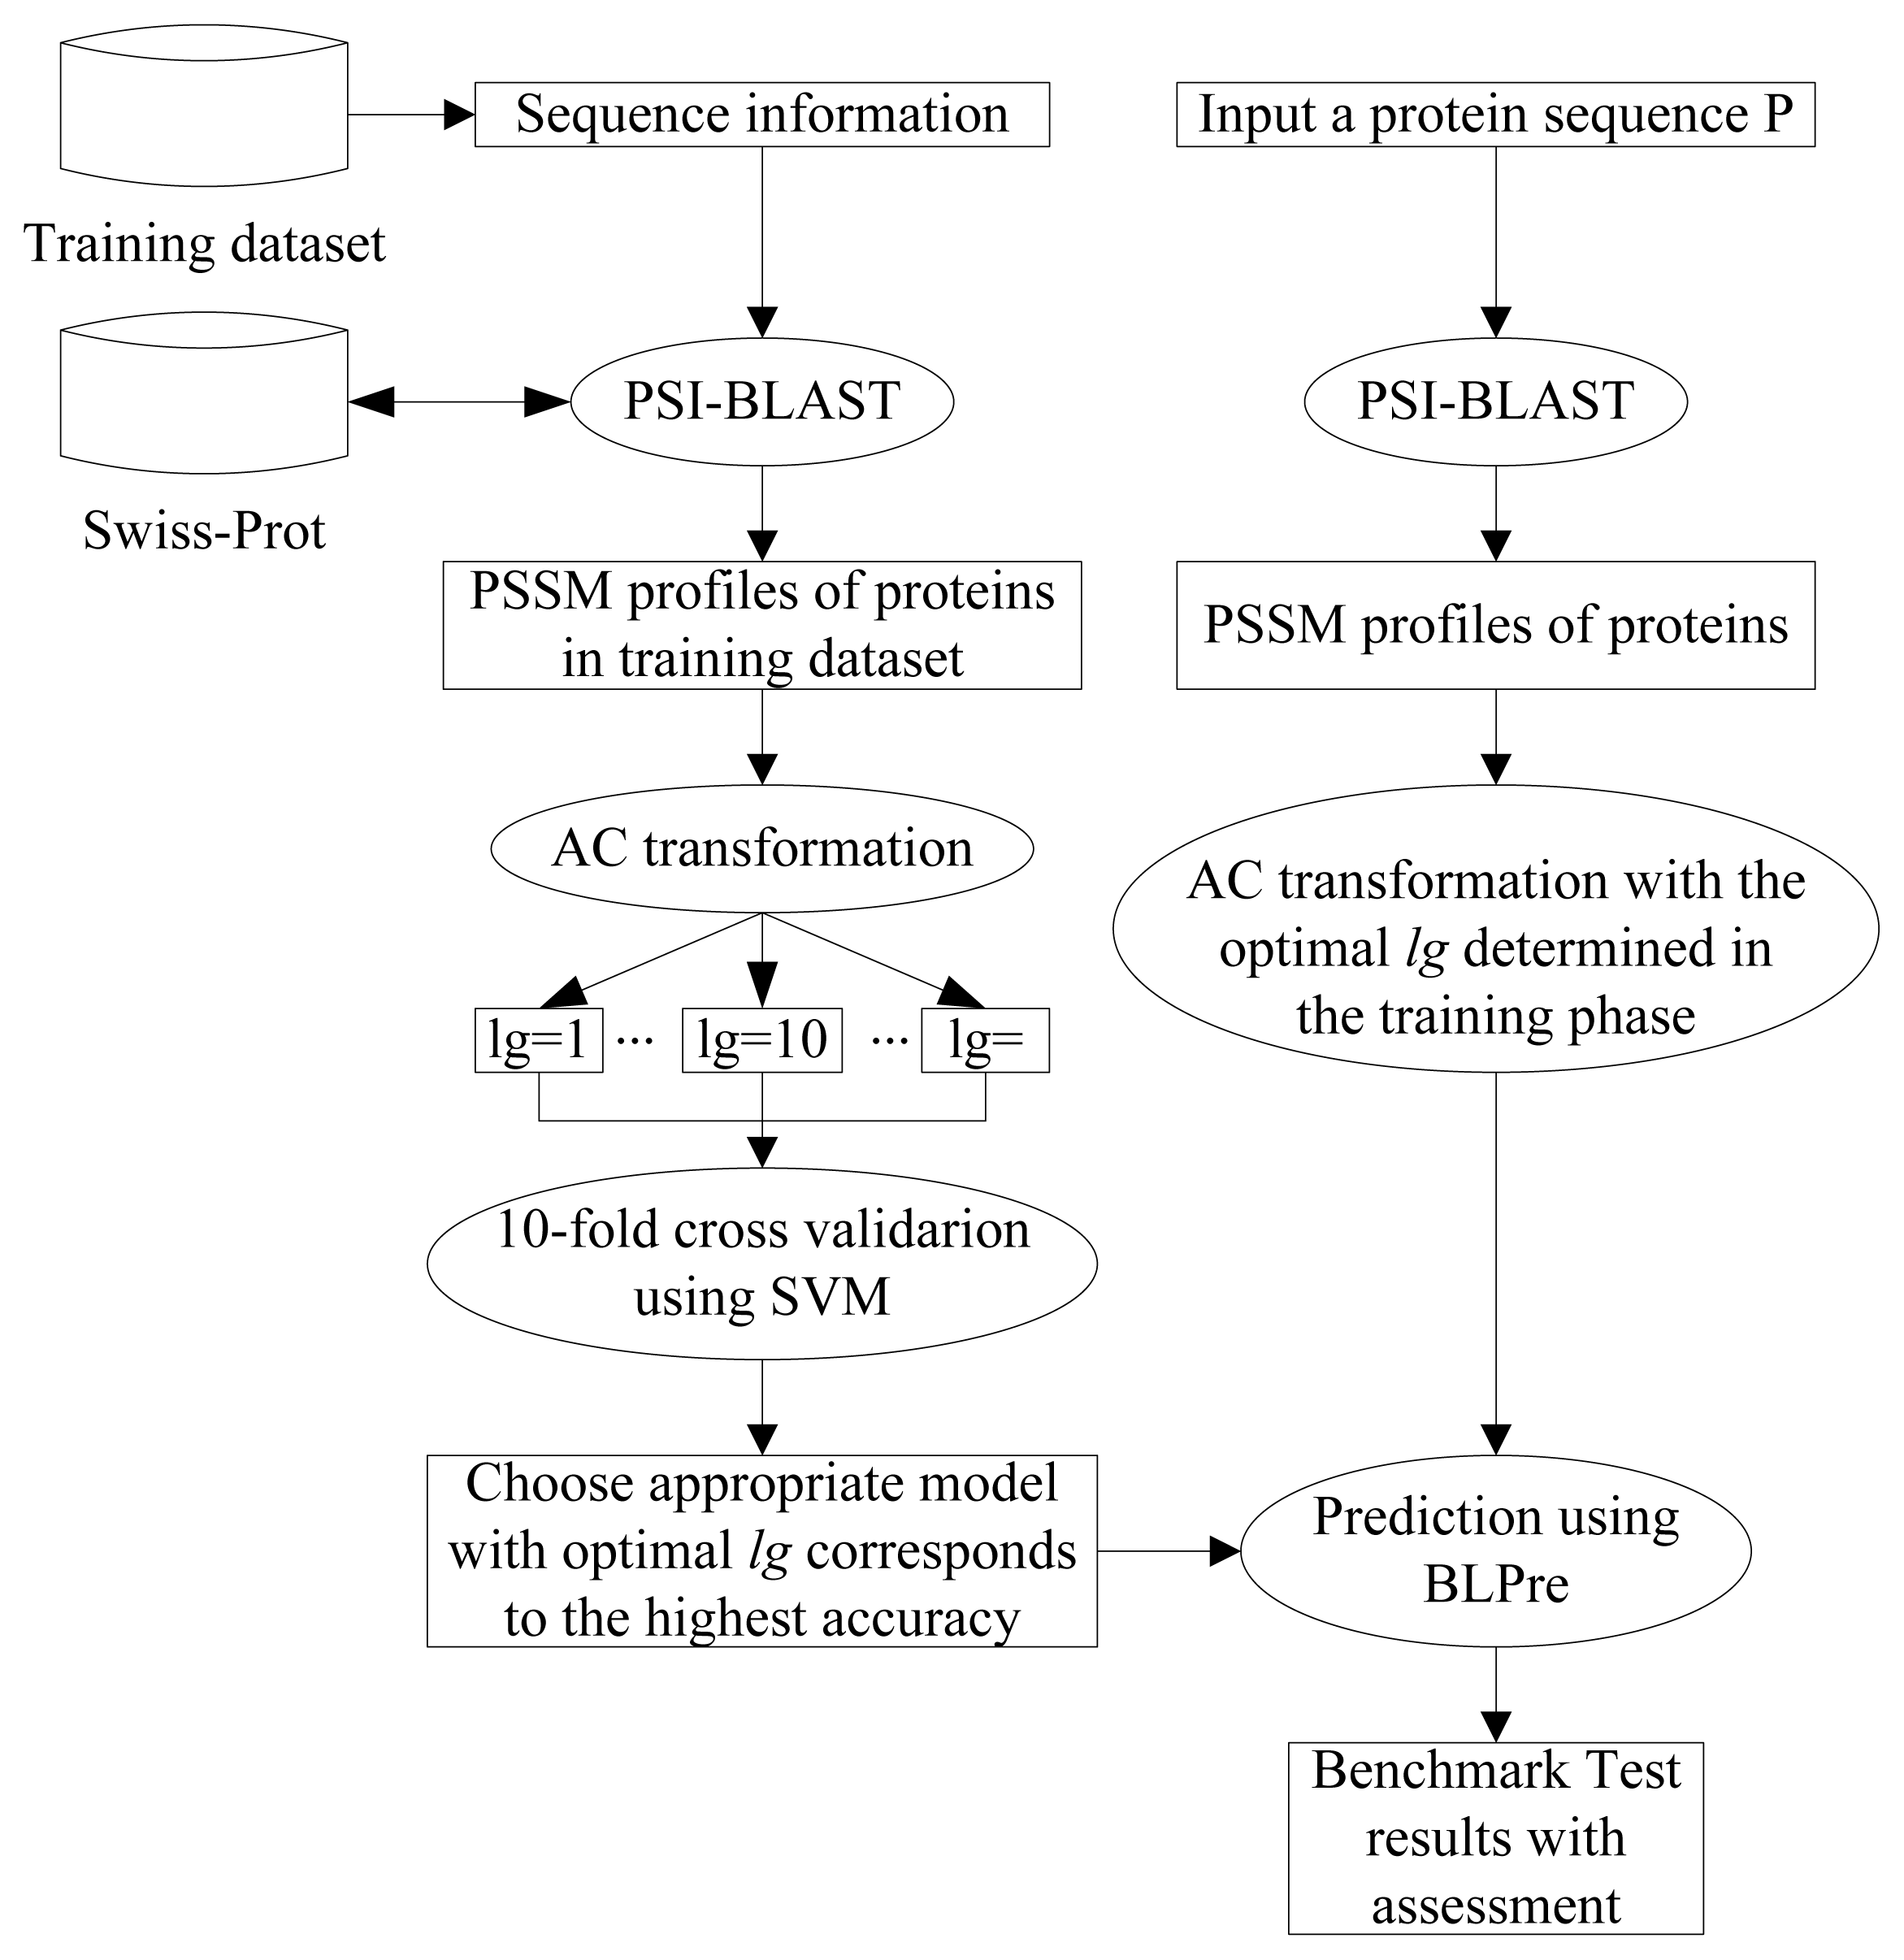
2. Materials and Methods

2.1. Datasets

To evaluate the prediction model proposed in this study and compare it with state-of-the-art methods, two publicly available datasets are used here [8]. And anyone can freely download it at [13]. The training dataset contains 300 bioluminescent proteins and 300 non-bioluminescent proteins, and the test dataset contains 139 bioluminescent proteins and 18202 non-bioluminescent proteins.
To avoid homology bias and remove the redundant sequences from the benchmark dataset, a cutoff threshold of 25% is imposed by [14,15] to remove those proteins from the benchmark dataset that have ≥ 25% sequence similarity. However, we do not use such a stringent criterion in this study because the number of available protein sequences does not allow us to do so (40% in this paper). In addition, the protein sequences containing less than 50 amino acids are also screened out.

2.2. Position Specific Scoring Matrix

Evolutionary information, one of the most important types of information in assessing functionality in biological analysis, has been widely used in many studies [1621]. To extract the evolutionary information, the profile of each protein sequence is generated by running Position Specific Iterated BLAST (PSI-BLAST) program [2224]. Then this information can be represented as a two dimensional matrix which is known as the PSSM of the protein. PSSM has been widely used to predict protein fold pattern [25], protein quaternary structural attribute [26], disulfide connectivity [27,28], half-sphere exposure [29], protein fold recognition and superfamily discrimination [30], ATP binding residues of a protein [31], and catalytic residues [32]. As a result, we also use it to predict bioluminescent proteins.
In this paper, the PSSM of each protein sequence in the constructed dataset is generated against the non-redundant Swiss-Prot database (version 56, released on 22 July 2008) using the PSI-BLAST program with three iterations (−j 3) and e-value threshold 0.0001 (−h 0.0001). This matrix is composed of L × 20 elements, where L is the total number of residues in a peptide, the rows of the matrix represent the protein residues and the columns of the matrix represent the 20 amino acids.
In view of the fact that SVM requires the fixed length feature vectors as their inputs for training [10], we generate a vector of 400 dimensions, called PSSM-400 from the PSSM. PSSM-400 is the composition of occurrences of each type of amino acid corresponding to each type of amino acids in protein sequence. Thus for each column we have a vector of dimension 20. Figure 1 shows the schematic representation of transformation of each protein sequence into PSSM-400. Besides the PSSM-AC encoding strategy, PSSM-400 is also used to encode each protein sequence in this study.

2.3. Auto Covariance

Auto covariance (AC) is a correlation factor coupling adjacent residues along the protein sequence [11]. It’s a kind of variant of auto cross covariance. As a powerful statistical tool used to analyze sequences of vectors [33], the AC transformation has been widely applied in various fields of bioinformatics [3439]. AC variables are able to avoid producing too many variants. In the PSSM-AC encoding strategy, the AC transformation is applied to each column of PSSM to incorporate the local sequence-order information. In this study, AC is employed to transform the PSSM into equal length vector. Given a protein sequence, AC variables describe the average interactions between residues with a series of lag. Here, lag is the distance between one residue and its neighbors in the protein sequence P. The AC variables can be calculated by Equation (1).
A C l a g , j = ( 1 / ( n - l a g ) ) i = 1 n - l a g ( P i , j - ( 1 / n ) i = 1 n P i , j ) × ( P ( i + l a g ) , j - ( 1 / n ) i = 1 n P i , j )
where P represents the PSSM generated by running the PSI-BLAST program, i represents the position, j represents one descriptor and n is the length of the sequence. Thus, the number of AC variables D can be calculated as D = lg × q (lg is the maximum lag (lag = 1, 2, …, lg) and q is the number of descriptors). Using Equation 1, each protein sequence can be represented by a vector of AC variables, whose length equals to the value of D. Here, the value of q is 20, which corresponds to the number of the columns of the PSSM. Ultimately, each protein sequence was characterized by the PSSM-AC model.

2.4. Support Vector Machine

Support vector machine (SVM) is a popular learning approach mainly used in pattern recognition areas [4042]. SVM [43] belongs to the family of margin-based classifier and is assumed to be a very powerful method to deal with prediction, classification, and regression problems. SVM looks for the optimal hyperplane which maximizes the distance between the hyperplane and the nearest samples from each of the two classes. Let xiRn be training instance and yi ∈ {−1, +1} be the corresponding class labels, i = 1, ..., n. The class label for a new instance x can be determined by the sign of the following function.
f ( x ) = i = 1 m y i α i K ( x i , x ) + b
where m is the number of training instances, αi are the obtained by solving a optimization problem on the input instances, and b is the bias term. In this paper, LIBSVM package [44] with radial basis kernels (RBF) is used.
K ( x i , x j ) = exp ( - γ x i - x j 2 )
Two parameters, the regularization parameter C and the kernel width parameter γ are optimized based on 10-fold cross-validation using a grid search strategy.

2.5. Model Construction

The work flow of the proposed model is described in Figure 2. For the left part of Figure 2, firstly, sequential evolution information in form of PSSM profiles on the training dataset is obtained by PSI-BLAST. Secondly, the AC transformation is applied to the obtained PSSM with optional values of lg to incorporate local sequence order information. Finally, SVM is applied with ten-fold cross validation. With different lg, we can get different prediction models. In this study, we select the one which corresponds to the highest accuracy as the final model. The right part of Figure 2 shows the process of how to predict each one protein sequence using the BLPre predictor.

2.6. Performance Evaluation

Ten-fold cross validation [45] is used in this work. The dataset is randomly divided into ten equal sets, out of which nine sets are used for training and the remaining one for testing. This procedure is repeated ten times and the final prediction result is the average accuracy of the ten testing sets. Besides the ten-fold cross validation on the training set, we also utilize independent dataset test [46] to evaluate our model.
Three parameters, sensitivity (Sn), specificity (Sp), and accuracy (AC) are used to measure the performance of our model. They are defined by the following formulas:
S n = T P T P + F N
S p = T N T N + F P
A C = T P + T N T P + T N + F P + F N
where TP, TN, FP and FN stand for true positive, true negative, false positive and false negative, respectively. Moreover, we create ROC (receiver operating curve) for all of the models in order to evaluate the performance of models using different encoding strategies.

3. Results and Discussion

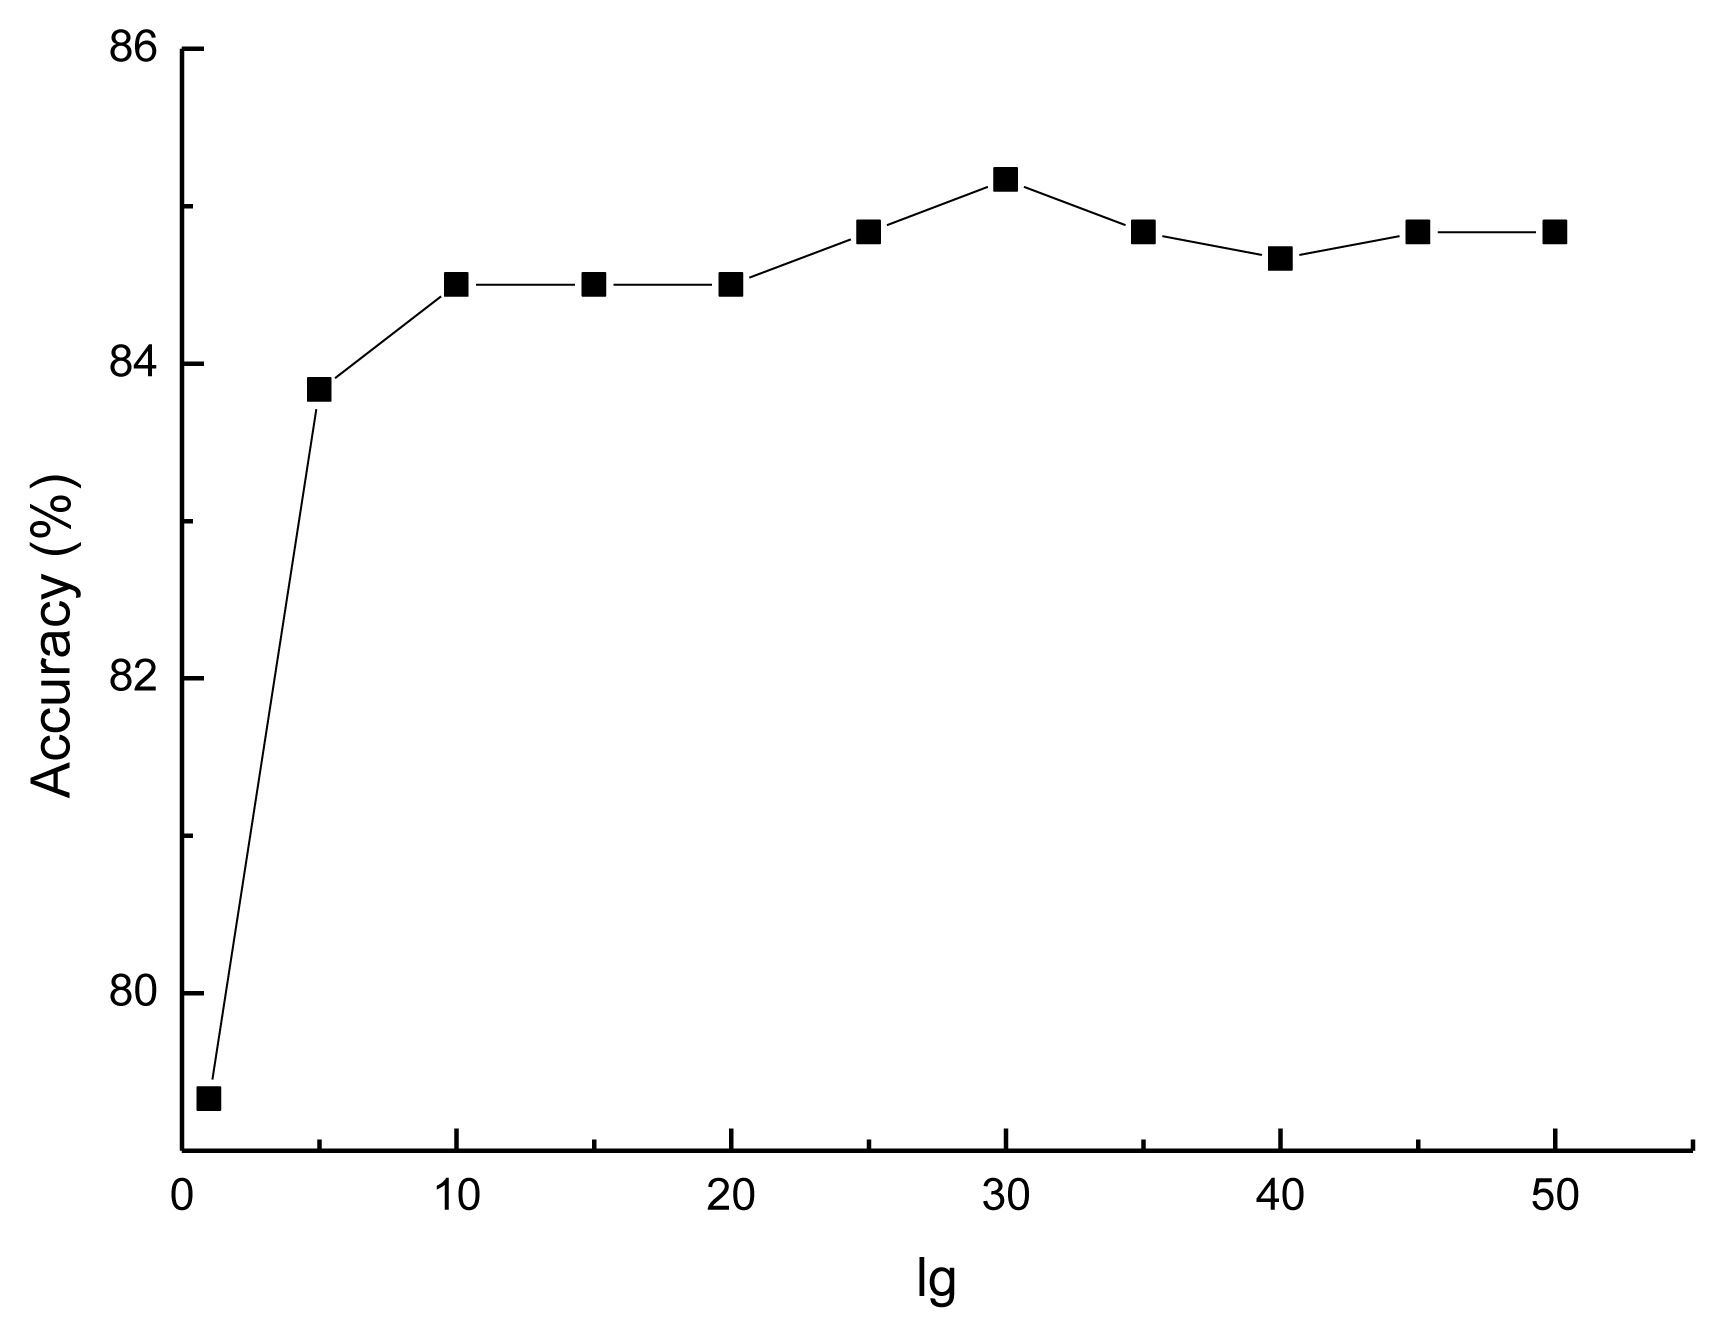
3.1. Selecting the Optimal lg for the Prediction Model

As mentioned in Section 2.5, for prediction performance, the value of lg of AC transformation is an important parameter needed to be considered. Generally, the value of lg varies in different datasets, and must be smaller than the length of the shortest protein sequence in the corresponding dataset. Since all the protein sequences collected in this paper contain more than 50 amino acids, a series value of lgs (lg = 1, 5, 10, 15, …, 50) are investigated to construct the optimal prediction model. The results on the training set constructed in this study are presented as Figure 3.
It can be seen in Figure 3, the prediction performance increases from 79.33% to 85.17% when the value of lg increases from 1 to 30 and decreases when the value of lg is larger than 30. The accuracy of the prediction model becomes stable when the value of lg equals 45. It is obvious that the best value of lg is 30 corresponding to a peak with accuracy of 85.17%, so that the value of lg is set to 30 in the rest of this study.

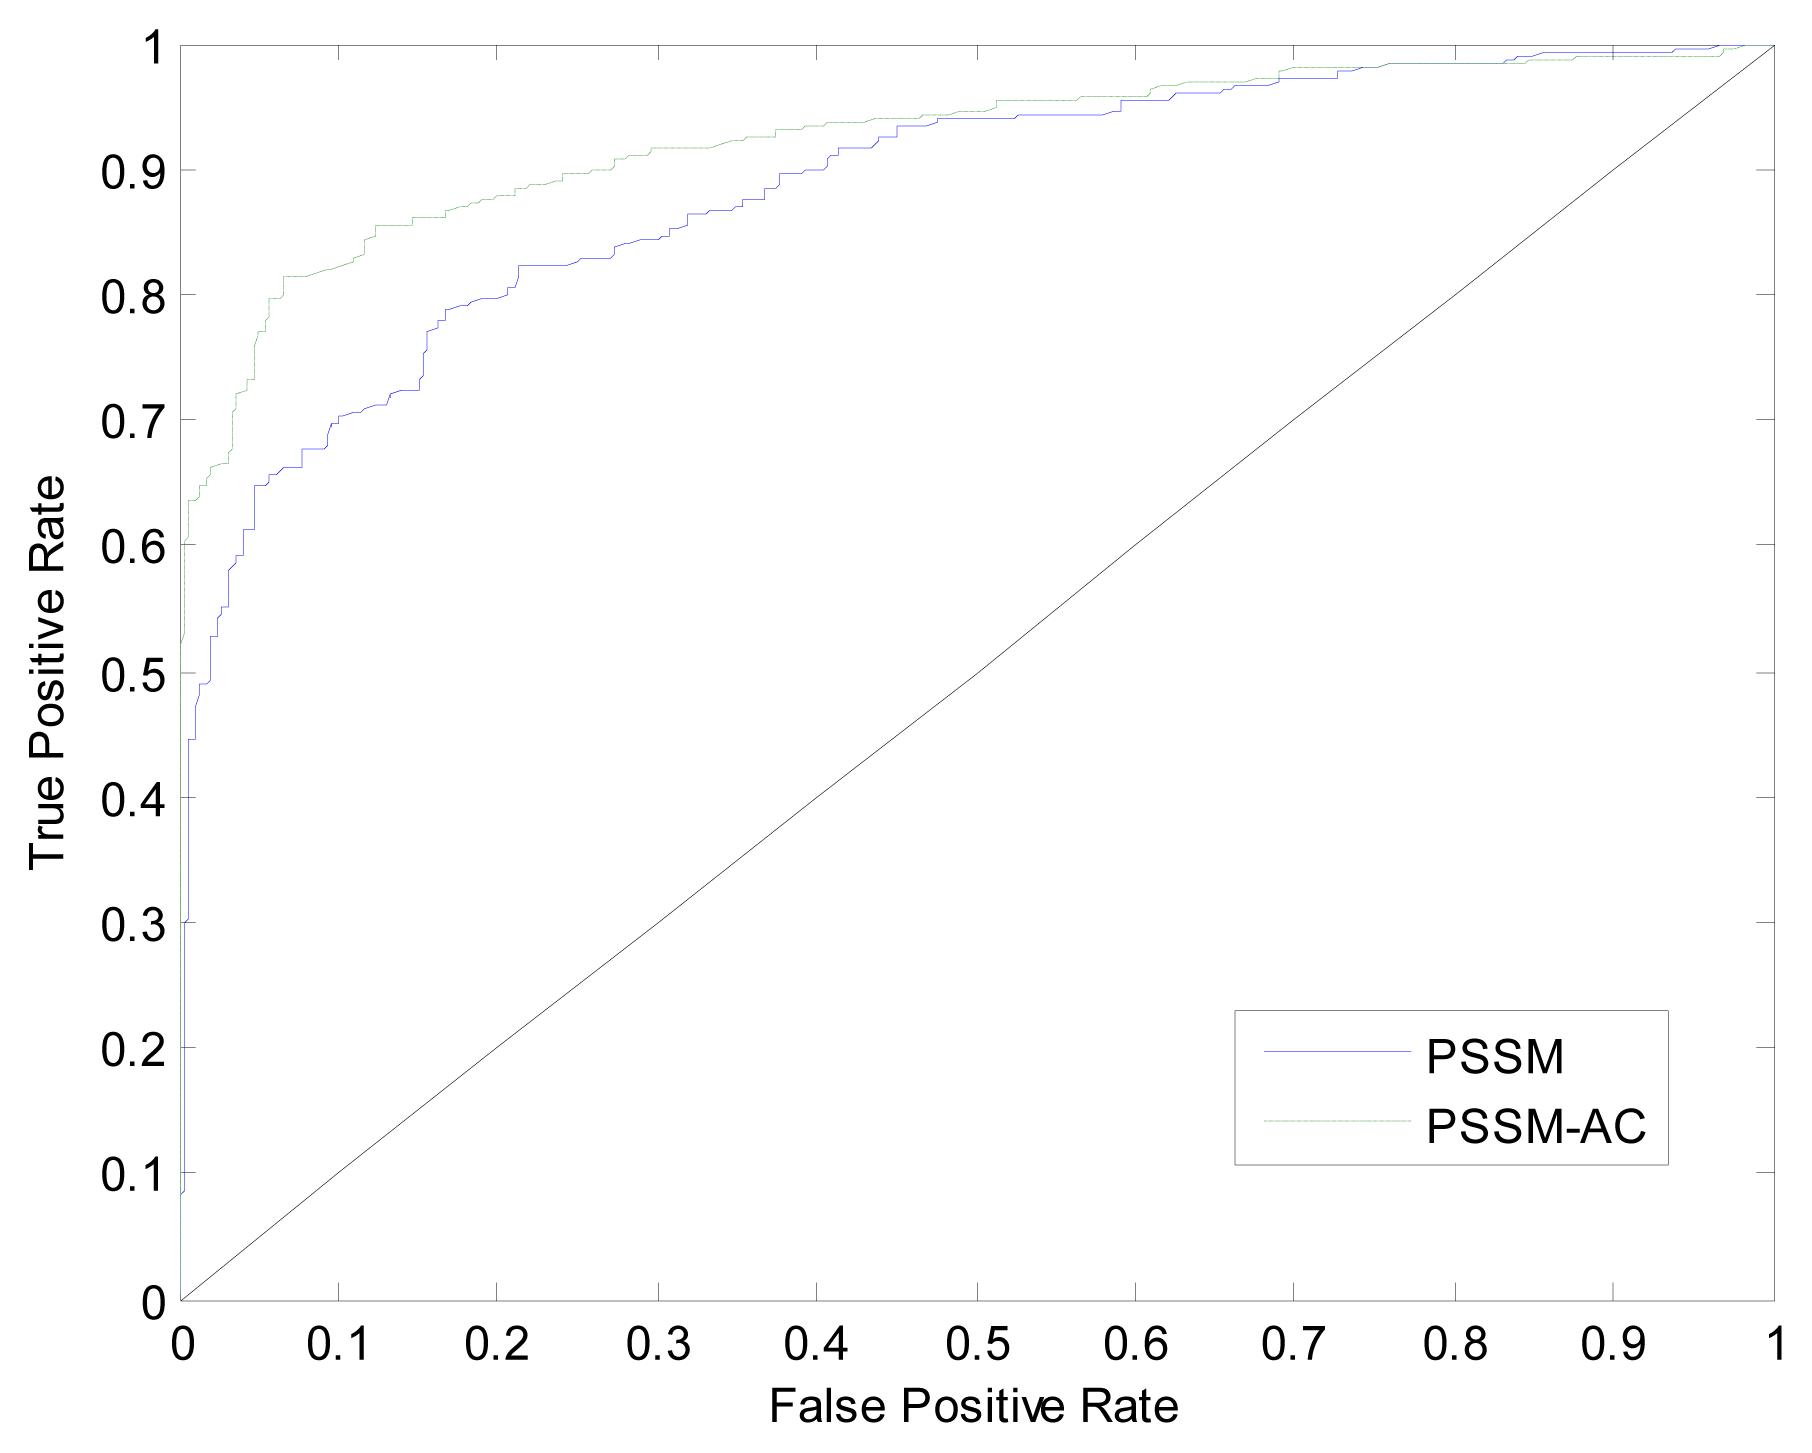
3.2. Comparison with Simple PSI-BLAST Search Method

In this section, we compare the PSSM-AC encoding strategy with the PSSM-400 encoding strategy mentioned in Section 2.2, thus to highlight the advantage of our prediction model. The results evaluated by ten-fold cross validation on the training dataset are shown in Table 1 and Figure 4. It can be seen in Table 1, compared with the accuracy of 79.32% gained by PSSM-400 method, the accuracy obtained by our method PSSM-AC is 85.17%.
As shown in Figure 4, we achieve the area under the ROC curve (AUC) of 0.92, which is significantly better than that of the PSSM-400 method with AUC of 0.88. These results indicate that the superior performance of the AC transformation encoding when being applied to the PSSM to incorporate the local sequence-order information.

3.3. Comparison with Other Methods

In this section, the proposed predictor is further compared with a recently reported predictor BLProt [8] on the training dataset and the independent test dataset. As can be seen in Table 1, our model achieves the accuracy of 85.17%, which is about 5% higher than the BLProt method. The number of bioluminescent proteins and non-bioluminescent proteins in the test dataset are highly imbalanced, and this situation is close to reality. Compared with the accuracy of 80.06% gained by Kandaswamy et al. [8], the accuracy obtained by our method is 90.71% which has been significantly improved. The better prediction performance may be credited to the appropriate protein sequence encoding strategy adopted in our prediction model.

4. Conclusions

Prediction of bioluminescent proteins could help to discover many still unknown functions and design new commercial and medical applications. Though some researchers have focused on this problem, the accuracy of prediction is still not satisfied. In this study, AC is applied to PSSM, and this encoding strategy PSSM-AC could contain both sequential evolution information and the local sequence order information which adequately reflect the local environment during the evolution. The accuracy of our prediction model is higher than those of state-of-the-art bioluminescent proteins prediction tools. Experimental results have shown that our method is very promising and may be a useful supplement tool to existing methods.

Acknowledgments

This research is partially supported by the National Natural Science Foundation of China (Nos. 61172183 and 61070084), the Natural Science Foundation of Jilin Province (Nos. 20101506 and 20101503), and the Scientific and Technical Project of Administration of Traditional Chinese Medicine of Jilin Province (Nos. 2010pt067 and 2011-zd16).

References

  1. Hastings, J.W. Bioluminescence; Academic Press: New York NY, USA, 1995. [Google Scholar]
  2. Wilson, T. Comments on the mechanisms of chemi- and bioluminescence. Photochem. Photobiol 1995, 62, 601–606. [Google Scholar]
  3. Haddock, S.H.D.; Moline, M.A.; Case, J.F. Bioluminescence in the Sea. Ann. Rev. Mar. Sci 2010, 2, 293–343. [Google Scholar]
  4. Lloyd, J.E. Insect Bioluminescence; Academic Press: New York NY, USA, 1978. [Google Scholar]
  5. White, E.H.; Rapaport, E.; Seliger, H.H.; Hopkins, T.A. The chemi- and bioluminescence of firefly luciferin: An efficient chemical production of electronically excited states. Bioorg. Chem 1971, 1, 92–122. [Google Scholar]
  6. Shimomura, O.; Johnson, F.; Saiga, Y. Extraction, purification and properties of aequorin, a bioluminescent protein from the luminous hydromedusan, aequorea. J. Cell. Phys 1962, 59, 223–239. [Google Scholar]
  7. Pierre, A.V.; Val, J.W. Fluorescent and bioluminescent protein-fragment complementation assays in the study of G protein-coupled receptor oligomerization and signaling. Mol. Pharmacol 2009, 75, 733–739. [Google Scholar]
  8. Kandaswamy, K.K.; Ganesan, P.; Mehrnaz, K.H.; Kai, K.; Martinetz, T. BLProt: Prediction of bioluminescent proteins based on Support Vector Machine and ReliefF feature selection. BMC Bioinforma 2011, 12. [Google Scholar] [CrossRef]
  9. Kawashima, S.; Ogata, H.; Kanehisa, M. AAindex: Amino acid index database. Nucleic Acids Res 1999, 27, 368–369. [Google Scholar]
  10. Liu, T.G.; Geng, X.B.; Zheng, X.Q.; Li, R.S.; Wang, J. Accurate prediction of protein structural class using auto covariance transformation of PSI-BLAST profiles. Amino Acids 2011. [Google Scholar] [CrossRef]
  11. Yang, L.; Li, Y.Z.; Xiao, R.Q.; Zeng, Y.H.; Xiao, J.M.; Tan, F.Y.; Li, M.L. Using auto covariance method for functional discrimination of membrance proteins based on evolution information. Amino Acids 2010, 38, 1497–1503. [Google Scholar]
  12. BLPre. Available online: http://59.73.198.144/AFP_PSSM/ accessed on 10 February 2012.
  13. BLProt dataset. Available online: http://www.inb.uni-luebeck.de/tools-demos/bioluminescent%20protein/BLProt accessed on 23 December 2011.
  14. Chou, K.C.; Shen, H.B. Plant-mPLoc: A top-down strategy to augment the power for predicting plant protein subcellular localization. PLoS One 2010, 5. [Google Scholar] [CrossRef]
  15. Chou, K.C.; Wu, Z.C.; Xiao, X. iLoc-Euk: A multi-lable classifier for predicting the subcellular localization of singleplex and multiplex eukaryotic proteins. PLoS One 2011, 6. [Google Scholar] [CrossRef]
  16. Kumar, M.; Gromiha, M.M.; Raghava, G.P. Identification of DNA-binding proteins using support vector machines and evolutionary profiles. BMC Bioinformatics 2007, 8. [Google Scholar] [CrossRef]
  17. Song, J.; Burrage, K.; Yuan, Z.; Huber, T. Prediction of cis/trans isomerization in proteins using PSI-BLAST profiles and secondary structure information. BMC Bioinformatics 2006, 7. [Google Scholar] [CrossRef] [Green Version]
  18. Jones, D.T. Improving the accuracy of transmembrane protein topology prediction using evolutionary information. Bioinformatics 2007, 23, 538–544. [Google Scholar]
  19. Biswas, A.K.; Noman, N.; Sikder, A.R. Machine learning approach to predict protein phosphorylation sites by incorporating evolutionary information. BMC Bioinformatics 2010, 11. [Google Scholar] [CrossRef]
  20. Ruchi, V.; Grish, C.V.; Raghava, G.P.S. Prediction of mitochondrial proteins of malaria parasite using split amino acid composition and PSSM profile. Amino Acids 2010, 39, 101–110. [Google Scholar]
  21. Zhao, X.W.; Li, X.T.; Ma, Z.Q.; Yin, M.H. Prediction of lysine ubiquitylation with ensemble classifier and feature selection. Int. J. Mol. Sci 2011, 12, 8347–8361. [Google Scholar]
  22. Altschul, S.; Wootton, J.; Gertz, E.; Agarwala, R.; Morgulis, A.; Schaffer, A.; Yu, Y. Protein database searches using compositionally adjusted substitution matrices. FEBS J 2005, 272, 5101–5109. [Google Scholar]
  23. Altschul, S.; Madden, T.; Schaffer, A.; Zhang, J.; Zhang, Z.; Miller, W.; Lipman, D. Gapped BLAST and PSI-BLAST: A new generation of protein database search programs. Nucleic Acids Res 1997, 25, 3389–3402. [Google Scholar]
  24. Schaffer, A.; Aravind, L.; Madden, T.; Shavirin, S.; Spouge, J.; Wolf, Y.; Koonin, E.; Altschul, S. Improving the accuracy of PSI-BLAST protein database searches with composition-based statistics and other refinements. Nucleic Acids Res 2001, 29, 2994–3005. [Google Scholar]
  25. Shen, H.B.; Chou, K.C. Predicting protein fold pattern with functional domain and sequential evolution information. J. Theor. Biol 2009, 256, 441–446. [Google Scholar]
  26. Shen, H.B.; Chou, K.C. Quatldent: A web server for identifying protein quaternary structural attribute by fusing functional domain and sequential evolution information. J. Proteome Res 2009, 8, 1577–1584. [Google Scholar]
  27. Song, J.; Yuan, Z.; Tan, H.; Huber, T.; Burrage, K. Predicting disulfide connectivity from protein sequence using multiple sequence feature vectors and secondary structure. Bioinformatics 2007, 23, 3147–3154. [Google Scholar]
  28. Zhu, L.; Yang, J.; Song, J.N.; Chou, K.C.; Shen, H.B. Improving the accuracy of predicting disulfide connectivity by feature selection. J. Comput. Chem 2010, 31, 1478–1485. [Google Scholar]
  29. Song, J.; Tan, H.; Takemoto, K.; Akutsu, T. HSEpred: Predict half-sphere exposure from protein sequence. Bioinformatics 2008, 24, 1489–1497. [Google Scholar]
  30. Lobley, A.; Sadowski, M.I.; Jones, D.T. pGenTHREADER and pDomTHERADER: New methods for improved protein fold recognition and superfamily discrimination. Bioinformatics 2009, 25, 1761–1767. [Google Scholar]
  31. Chauhan, J.S.; Mishra, N.K.; Raghava, G.P. Identification of ATP binding residues of a protein from its primary sequence. BMC Bioinformatics 2009, 10. [Google Scholar] [CrossRef]
  32. Zhang, T.; Zhang, H.; Chen, K.; Shen, S.; Ruan, J.; Kurgan, L. Accurate sequence-based prediction of catalytic residues. Bioinformatics 2008, 24, 2329–2338. [Google Scholar]
  33. Wold, S.; Jonsson, J.; Sjostrom, M.; Rannar, S. DNA and peptide sequences and chemical processes multivariately modeled by principal component analysis and partial least squares projection to latent structures. Anal. Chim. Acta 1993, 277, 239–253. [Google Scholar]
  34. Guo, Y.; Li, M.; Lu, M.; Wen, Z.; Huang, Z. Predicting G-protein coupled receptors-G-protein coupling specificity based on autocross-covariance transform. Proteins 2006, 65, 55–60. [Google Scholar]
  35. Guo, Y.Z.; Yu, L.Z.; Wen, Z.N.; Li, M.L. Using support vector machine combined with auto covariance to predict protein-protein interactions from protein sequences. Nucleic Acids Res 2008, 36, 3025–3030. [Google Scholar]
  36. Dong, Q.W.; Zhou, S.G.; Guan, J.H. A new taxonomy-based protein folds recognition approach based on autocross-covariance transformation. Bioinformatics 2009, 25, 2655–2662. [Google Scholar]
  37. Wu, J.; Li, M.; Yu, L.; Wang, C. An ensemble classifier of support vector machines used to predict protein structural classes by fusing auto covariance and pseudo-amino acid composition. Protein J 2010, 29, 62–67. [Google Scholar]
  38. Zeng, Y.H.; Guo, Y.Z.; Xiao, R.Q.; Yang, L.; Yu, L.Z.; Li, M.L. Using the augmented Chou’s pseudo amino acid composition for predicting protein submitochondria locations based on auto covariance approach. J. Theor. Biol 2009, 259, 366–372. [Google Scholar]
  39. Liu, T.G.; Zheng, X.Q.; Wang, C.H.; Wang, J. Prediction of subcellular location of apoptosis proteins using pseudo amino acid composition: An approach from auto covariance transformation. Protein Pept. Lett 2010, 17, 1263–1269. [Google Scholar]
  40. Khan, A.; Javed, S.J. Predicting regularities in lattice constants of GdfeO3-type perovskites. Acta Crystallogr 2008, B64, 120–122. [Google Scholar]
  41. Qiu, J.D.; Huang, J.H.; Liang, R.P.; Lu, X.Q. Prediction of G-protein-coupled receptors based on the concept of Chou’s pseudo amino acid composition: An approach from discrete wavelet transform. Anal. Biochem 2009, 390, 68–73. [Google Scholar]
  42. Zhang, S.; Ding, S.; Wang, T. High-accuracy prediction of protein structural class for low-similarity sequences based on predicted secondary structure. Biochimie 2011, 4, 710–714. [Google Scholar]
  43. Vapnik, V. Statistical Learning Theory; Wiley-Interscience: New York, NY, USA, 1998. [Google Scholar]
  44. Chang, C.C.; Lin, C.J. LIBSVM: A library for support vector machine. ACM Trans. Intell. Syst. Technol 2011, 2, 1–27. [Google Scholar]
  45. Chou, K.C.; Zhang, C.T. Review: Prediction of protein structural classes. Crit. Rev. Biochem. Mol. Biol 1995, 30, 275–349. [Google Scholar]
  46. Chou, K.C.; Shen, H.B. Cell-PLoc: A package of web-servers for predicting subcellular localization of proteins in various organisms. Nat. Protoc 2008, 3, 153–162. [Google Scholar]
Figure 1. Schematic representation of transformation of each protein sequence into PSSM-400 matrix.
Ijms 13 03650f1
Figure 2. Detailed system flow of the prediction system.
Ijms 13 03650f2
Figure 3. Accuracies of the prediction model with AC of different lgs.
Ijms 13 03650f3
Figure 4. The ROC curves calculated from the ten-fold cross validation of PSSM and PSSM-AC encoding strategies.
Ijms 13 03650f4
Table 1. The performance comparison of different encoding strategies on the training dataset.
MethodSn (%)Sp (%)AC (%)
PSSM-40072.0086.3379.32
PSSM-AC79.3391.0085.17
BLProt [8]74.4784.2180.00

