Article

Medium Optimization for Exopolysaccharide Production in Liquid Culture of Endophytic Fungus Berkleasmium sp. Dzf12

1
Department of Plant Pathology, College of Agronomy and Biotechnology, China Agricultural University, Beijing 100193, China
2
Department of Forestry Pathology, College of Forestry, Northwest A & F University, Yangling 712100, China
*
Author to whom correspondence should be addressed.
Int. J. Mol. Sci. 2012, 13(9), 11411-11426; https://doi.org/10.3390/ijms130911411
Submission received: 1 August 2012 / Revised: 24 August 2012 / Accepted: 27 August 2012 / Published: 12 September 2012
(This article belongs to the Section Biochemistry)

Abstract

:
Berkleasmium sp. Dzf12, an endophytic fungus from Dioscorea zingiberensis, is a high producer of spirobisnaphthalenes with various bioactivities. The exopolysaccharide (EPS) produced by this fungus also shows excellent antioxidant activity. In this study, the experimental designs based on statistics were employed to evaluate and optimize the medium for EPS production in liquid culture of Berkleasmium sp. Dzf12. For increasing EPS yield, the concentrations of glucose, peptone, KH2PO4, MgSO4·7H2O and FeSO4·7H2O in medium were optimized using response surface methodology (RSM). Both the fractional factorial design (FFD) and central composite design (CCD) were applied to optimize the main factors which significantly affected EPS production. The concentrations of glucose, peptone and MgSO4·7H2O were found to be the main effective factors for EPS production by FFD experimental analysis. Based on the further CCD optimization and RSM analysis, a quadratic polynomial regression equation was derived from the EPS yield and three variables. Statistical analysis showed the polynomial regression model was in good agreement with the experimental results with the determination coefficient (adj-R2) as 0.9434. By solving the quadratic regression equation, the optimal concentrations of glucose, peptone and MgSO4·7H2O for EPS production were determined as 63.80, 20.76 and 2.74 g/L, respectively. Under the optimum conditions, the predicted EPS yield reached the maximum (13.22 g/L). Verification experiment confirmed the validity with the actual EPS yield as 13.97 g/L, which was 6.29-fold in comparison with that (2.22 g/L) in the original basal medium. The results provide the support data for EPS production in large scale and also speed up the application of Berkleasmium sp. Dzf12.

1. Introduction

Recently, extensive attention and interest have been focused on the polysaccharides prepared from fungi for their various biological activities, such as immunomodulating effects of the polysaccharides from Coriolus versicolor [1] and Hericium erinaceus [2], antioxidant activities of the polysaccharides from Cordyceps sinensis [35], Fusarium oxysporum Dzf17 [6] and Aspergillus versicolor [7], antitumor effects of the polysaccharides from Ganoderma tsugae [8] and Pholiota dinghuensis [9], anti-inflammatory effect of the polysaccharide from Fomitopsis pinicola [10], antiherpectin activity of the sulfated polysaccharide from Agaricus brasiliensis [11], antiangiogenic activity of the polysaccharide from Antrodia cinnamomea [12], anticoagulant properties of the polysaccharides from Pleurotus sajor-caju [13], and enhancement of diosgenin production in cell suspension culture of Dioscorea zingiberensis by the polysaccharides from endophytic fungus Fusarium oxysporum Dzf17 [14,15]. Plant endophytic fungi are microorganisms that reside in the internal tissues of living plants without causing any immediate overt negative effects or external symptoms [16]. They have been considered as important and novel potential sources of natural bioactive compounds [1721]. These bioactive compounds could be classified as alkaloids, terpenoids, steroids, quinones, lignans, phenols, and lactones [22,23]. Most of investigations on fungal polysaccharides mainly focused on higher basidiomycetes mushrooms [24,25]. The polysaccharides from endophytic fungi have been rarely reported except for our previous studies [6,14,15,26].
Endophytic fungus Berkleasmium sp. Dzf12 was isolated from the healthy rhizomes of medicinal plant Dioscorea zingiberensis [27]. Five spirobisnaphthalenes with antimicrobial activity were isolated from this fungus [28]. It was found that Berkleasmium sp. Dzf12 was a high producer of spirobisnaphthalenes [2932]. Furthermore, three polysaccharides, namely exopolysaccharide (EPS), water-extracted mycelial polysaccharide (WPS) and sodium hydroxide-extracted mycelial polysaccharide (SPS), were prepared from Berkleasmium sp. Dzf12, of which EPS showed excellent in vitro antioxidant activities by evaluating their DPPH scavenging, reducing Fe3+, chelating Fe2+ and hydroxyl radical scavenging activities [26]. However, the yield (2.22 g/L) of EPS produced by Berkleasmium sp. Dzf12 was low in the original medium [26]. To achieve a high yield of EPS, it is a prerequisite to optimize the medium for EPS production of Berkleasmium sp. Dzf12.
Currently, a large number of studies have been reported to optimize the medium for production of desired products in the fermentation process of microorganisms by employing different kinds of statistical experimental design techniques and analytical methods [3337]. The conventional practice of one-factor-at-a-time method is extremely laborious and time-consuming, and moreover, it does not guarantee the determination of the optimal conditions, and is unable to detect the frequent interactions occurring between two or more factors although they often do occur [38]. The limitations of one-single-factor-experimental optimization process can be eliminated by statistical experimental design combined response surface methodology (RSM), such as factorial design, uniform design, central composite design (CCD) and Box-Behnek design (BBD) [3942]. In this work, the main effective components in medium for EPS production were firstly determined by a 25-1 fractional factorial design (FFD). And then, CCD experiments and RSM analyses were carried out to optimize the critical factors for realizing the maximization of EPS yield.

2. Results and Discussion

2.1. FFD Experiments and Statistical Analyses

The fractional factorial design (FFD) enables the identification of the main effect of each variable upon response, which is estimated as the difference between both averages of measurements made at the high and low levels of that factor [36,43]. The impacts of the five factors on EPS production, which were the concentrations (g/L) of glucose, peptone, KH2PO4, MgSO4·7H2O and FeSO4·7H2O, were evaluated by FFD screening experiments. The results of FFD experiments are shown in Table 1, where EPS yield varied markedly from 1.12 to 13.63 g/L. Such a wide variation of EPS yield reflected the potential of parameter optimization to reach higher productivity.
The analysis of variance (ANOVA) of the FFD experiments is summarized in Table 2. By F-test analysis of each variable, the concentrations of glucose, peptone and MgSO4·7H2O were found to have significant effects on EPS production at p = 0.01 level, for their low p-values (<0.01). While the p-values of KH2PO4 and FeSO4·7H2O were separately 0.5664 and 0.4641, higher than statistical levels 0.05 or 0.01 [38], which demonstrated the two variables producing not evident effects on EPS production. Hence, the concentrations of glucose, peptone and MgSO4·7H2O were chosen for further investigation for maximization of EPS production.

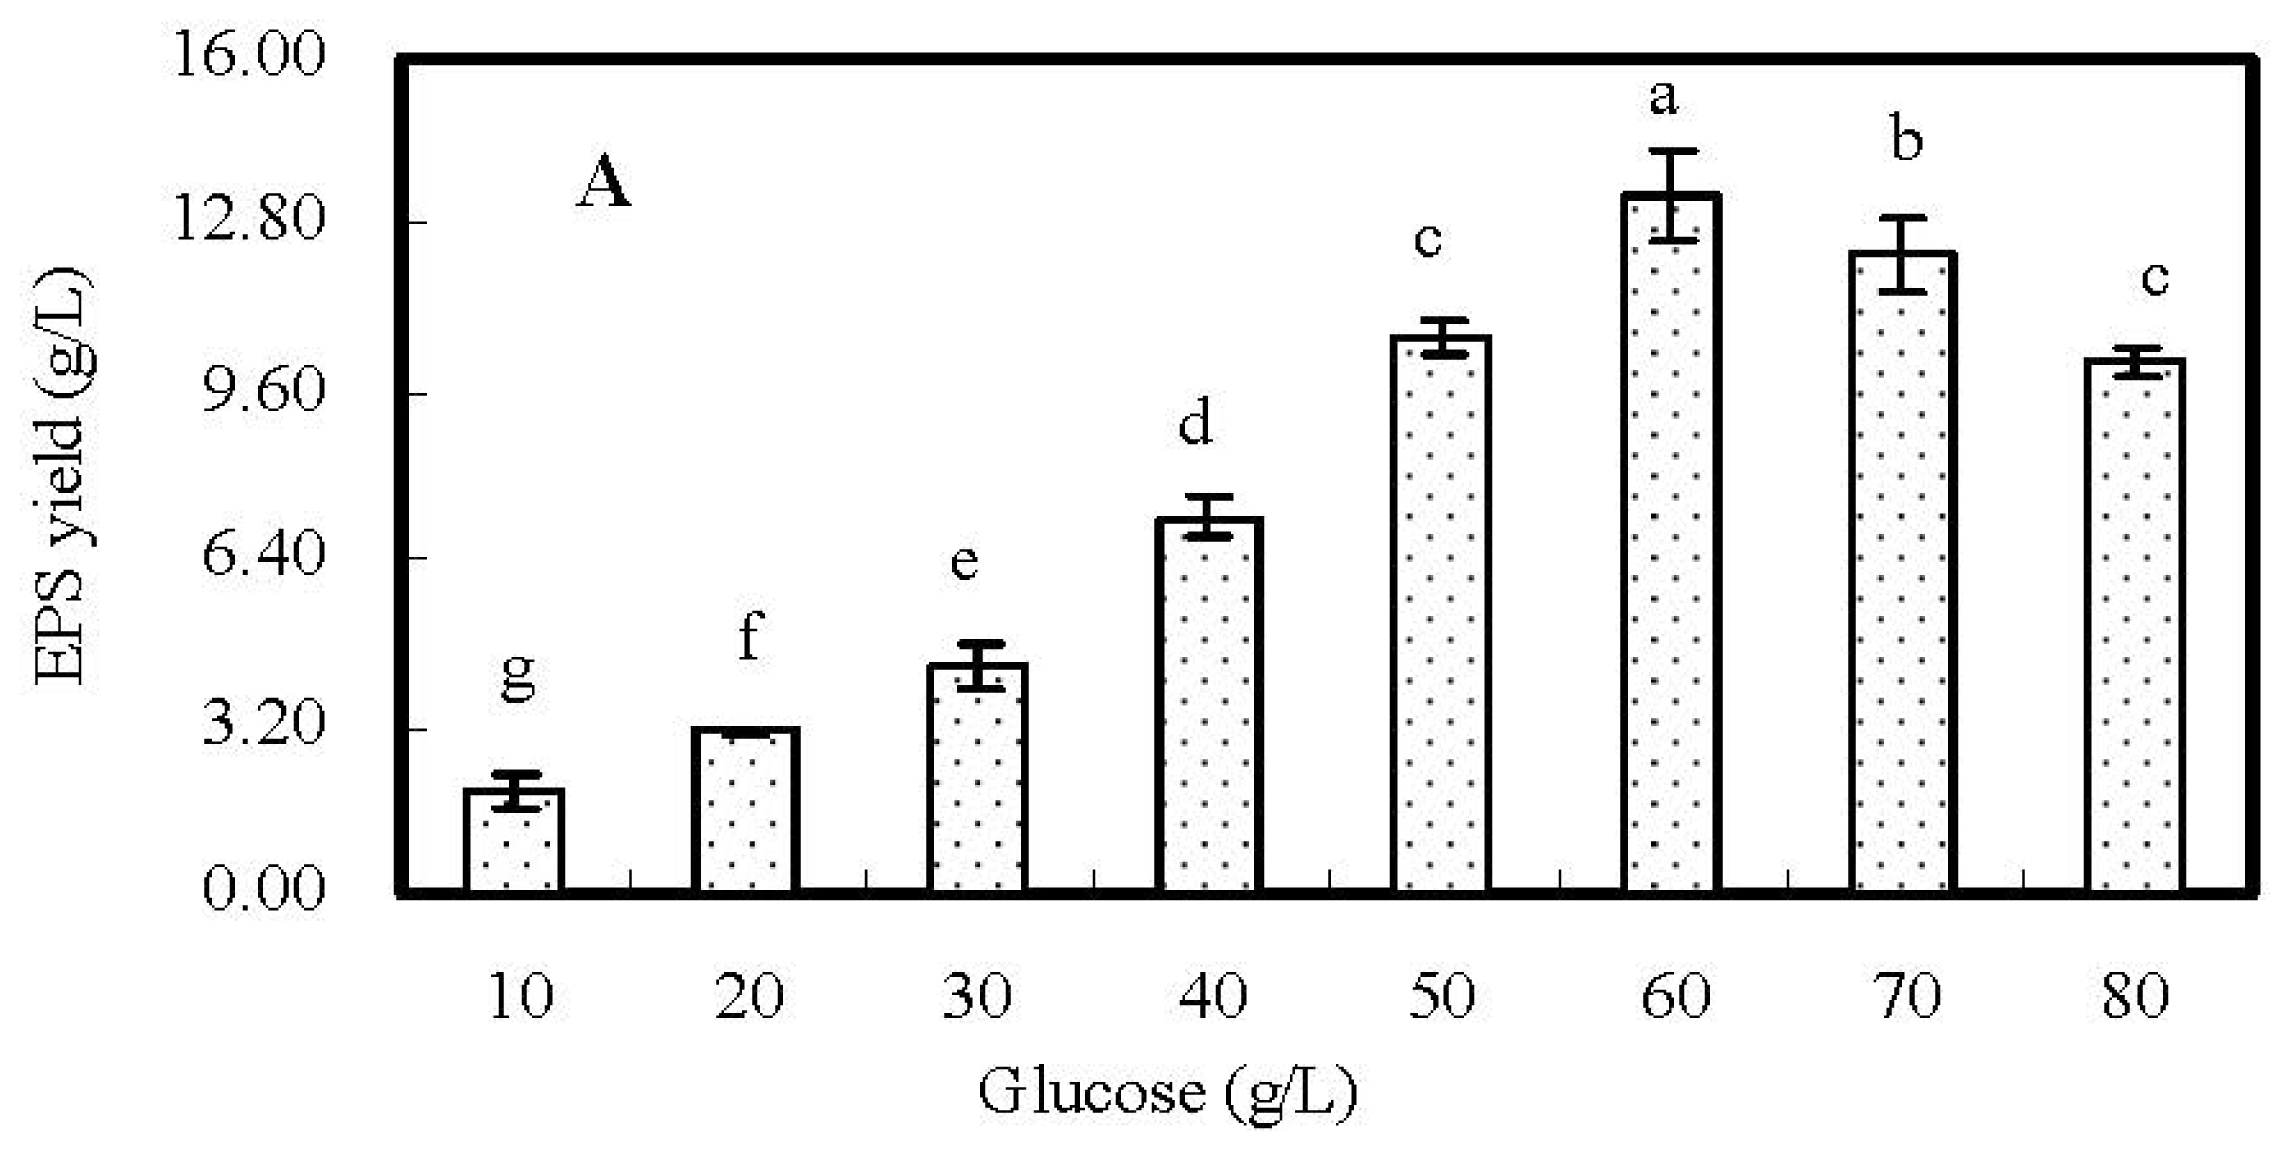
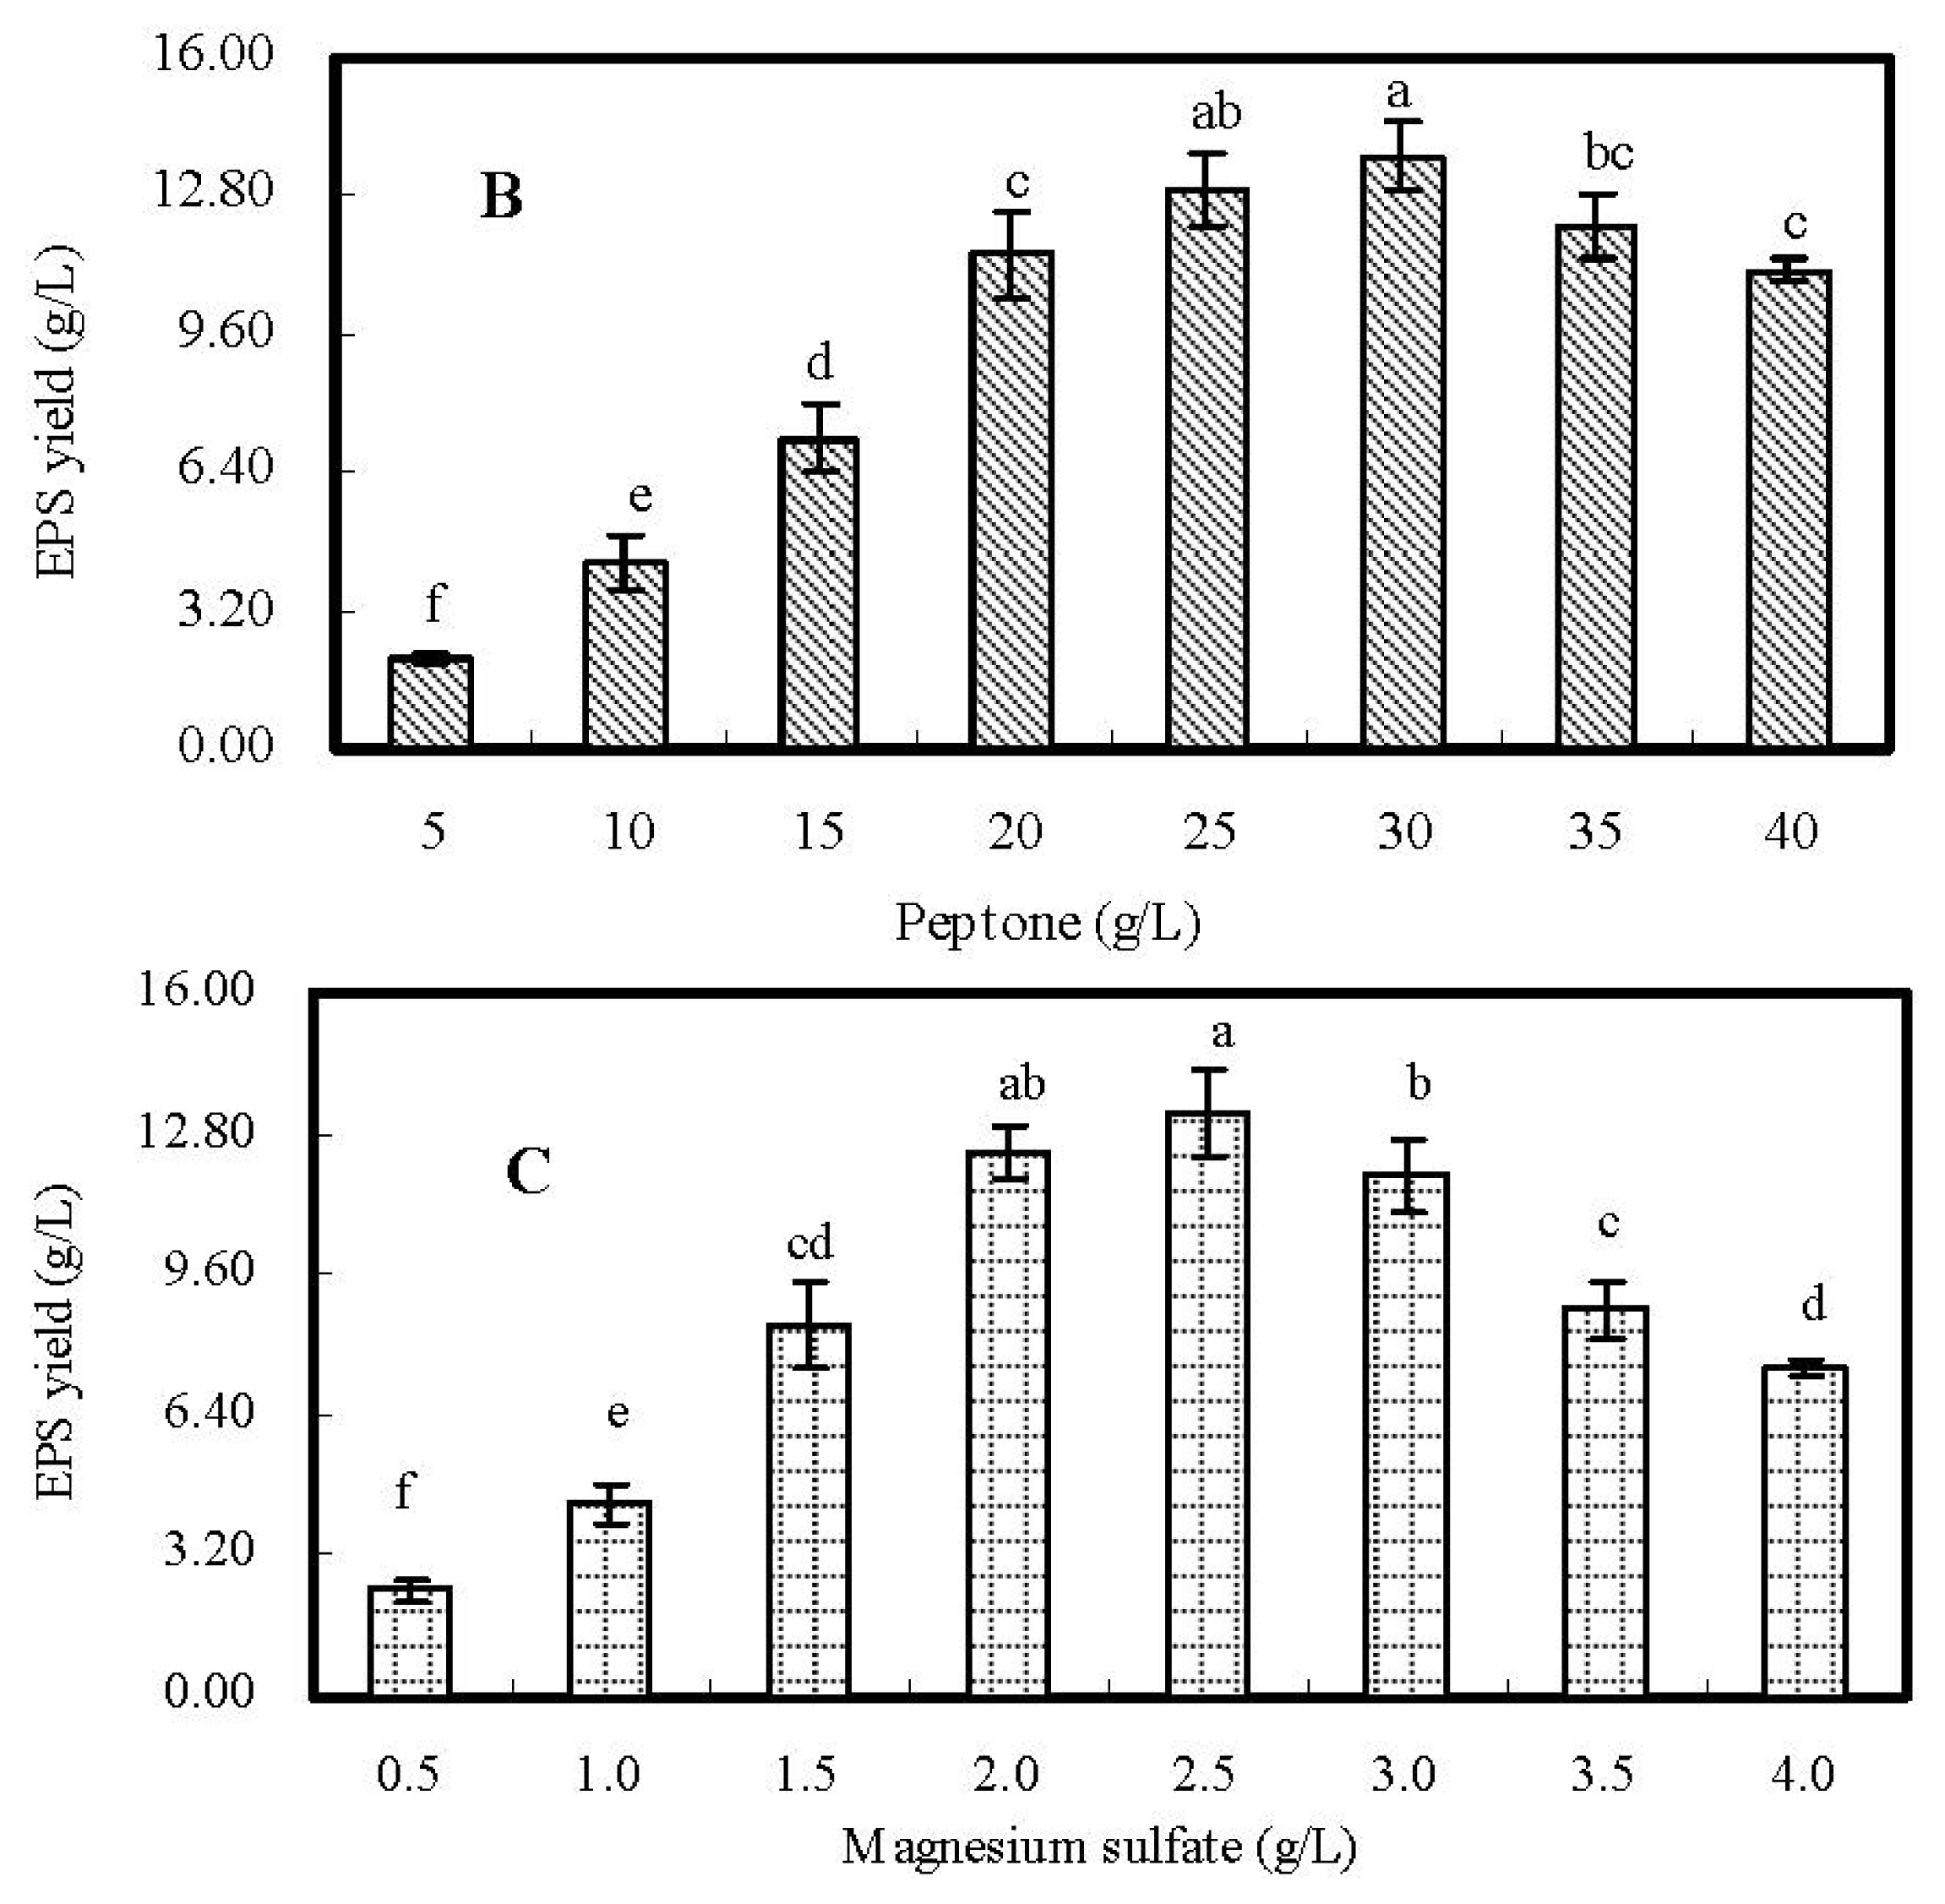
2.2. Single-Factor Experiments and Analyses

Based on the results and analyses of FFD experiments, the concentrations (g/L) of glucose, peptone and MgSO4·7H2O in medium were determined as the critical factors on EPS production. Hence, the equally spaced locations of each variable single-factor experiments were carried out to further optimize the three factors, while the concentrations of KH2PO4 and FeSO4·7H2O were fixed at 2.0 g/L and 0.05 g/L, respectively.
The effects of the concentration of glucose ranged from 10 to 80 g/L on EPS production are presented in Figure 1A. When the concentration of glucose was increased from 10 to 60 g/L, the EPS yield was obviously increased from 1.98 to 13.37 g/L. However, when the concentration of glucose was higher than 60 g/L, the EPS yield was decreased slightly. It indicated the highest amount of EPS was attained when the concentration of glucose was approximating the neighborhood of 60 g/L. Thus, 60 g/L of glucose was selected as the center point of CCD.
Figure 1B graphs the effects of the concentration of peptone on EPS production in fermentation culture. When the concentration of peptone was increased from 5 to 40 g/L, the EPS yield was significantly. The highest EPS yield (13.69 g/L) was observed when the concentration of peptone was at 30 g/L. Hence, 30 g/L of peptone in medium was chosen as the center point of CCD.
The effects of the concentration of MgSO4·7H2O on EPS production are shown in Figure 1C. When the concentration of MgSO4·7H2O varied from 0.5 to 2.5 g/L, the EPS yield was increased from 2.42 to 12.38 g/L. However, when the concentration of MgSO4·7H2O in fermentation medium was higher than 2.5 g/L, the EPS yield was decreased slightly. It demonstrated the optimal concentration of MgSO4·7H2O for EPS production was close to 2.5 g/L. Therefore, 2.5 g/L of MgSO4·7H2O was selected as the center point of CCD.

2.3. CCD Experiments, Model Building and Statistical Analysis

According to the results of FFD and single-factor experiments, the suitable concentrations of glucose, peptone and MgSO4·7H2O in medium for EPS production were determined for further CCD experiments. Five levels of each variable were set by software of Design Expert, which are presented in Table 3. And then 20 trials of CCD were carried out to optimize the production of EPS. The results of CCD experiments were summarized in Table 4. The EPS yield displayed a considerable variation from 2.71 to 13.43 g/L depending upon the changes of variables. Based on the results of CCD experiments, a second-order polynomial regression model between EPS yield and the tested independent variables was derived by software of Design Expert as follows (Equation 1):
Y = 12.52 + 1.30 x 1 + 1.12 x 2 + 1.51 x 3 - 1.06 x 1 x 2 + 1.15 x 1 x 3 - 0.50 x 2 x 3 - 2.24 x 1 2 - 1.56 x 2 2 - 1.93 x 3 2
in the Equation, Y represented the EPS yield (g/L), and x1, x2 and x3 were the coded values of the test variables, the concentrations (g/L) of glucose, peptone and MgSO4·7H2O.
In order to determine whether the quadratic regression model was significant or not, the ANOVA analysis was conducted, which is summarized in Table 5. The ANOVA of the quadratic regression model demonstrated that the model was highly significant, evident from the Fisher’s F-test with a very high model F-value (78.46) but a very low p-value (p < 0.0001). The goodness of the model was examined by the determination coefficients (R2) and the multiple correlation coefficients (R). The value of the determination coefficient adj-R2 (0.9434) demonstrated that the total variation of 94.34% for EPS yield was attributed to the tested independent variables and only about 5.66% of the total variation could not be explained by the model. The value of R was closer to 1, the fitness of the model was better [44]. In this research, the multiple correlation coefficients adj-R of the model was 0.9712, indicating a good agreement between the experimental and predicted values. As presented in Table 4, the differences between the experimental and predicted EPS yields for the 20 trials of CCD were dramatically small, nearly close to zero. The lack-of-fit measured the failure of the model to represent the data in the experimental domain at points which were not included in the regression [45]. The F-value for lack-of-fit was 0.59 and the corresponding p-value was 0.71 (>0.05), which implied the lack-of-fit was not significant relative to the pure error due to noise. Insignificant lack-of-fit confirmed the validity of the model.
The coefficients of the quadratic polynomial model, along with their corresponding p-values, are calculated and presented in Table 6. The p-value was used as a tool to check the significance of each coefficient, which also indicated the interaction strength between each independent parameter [46]. The smaller the p-value was, the bigger the significance of the corresponding coefficient should be [47]. It can be seen from Table 6 that all regression coefficients of the quadratic polynomial model were highly significant with low p-values.

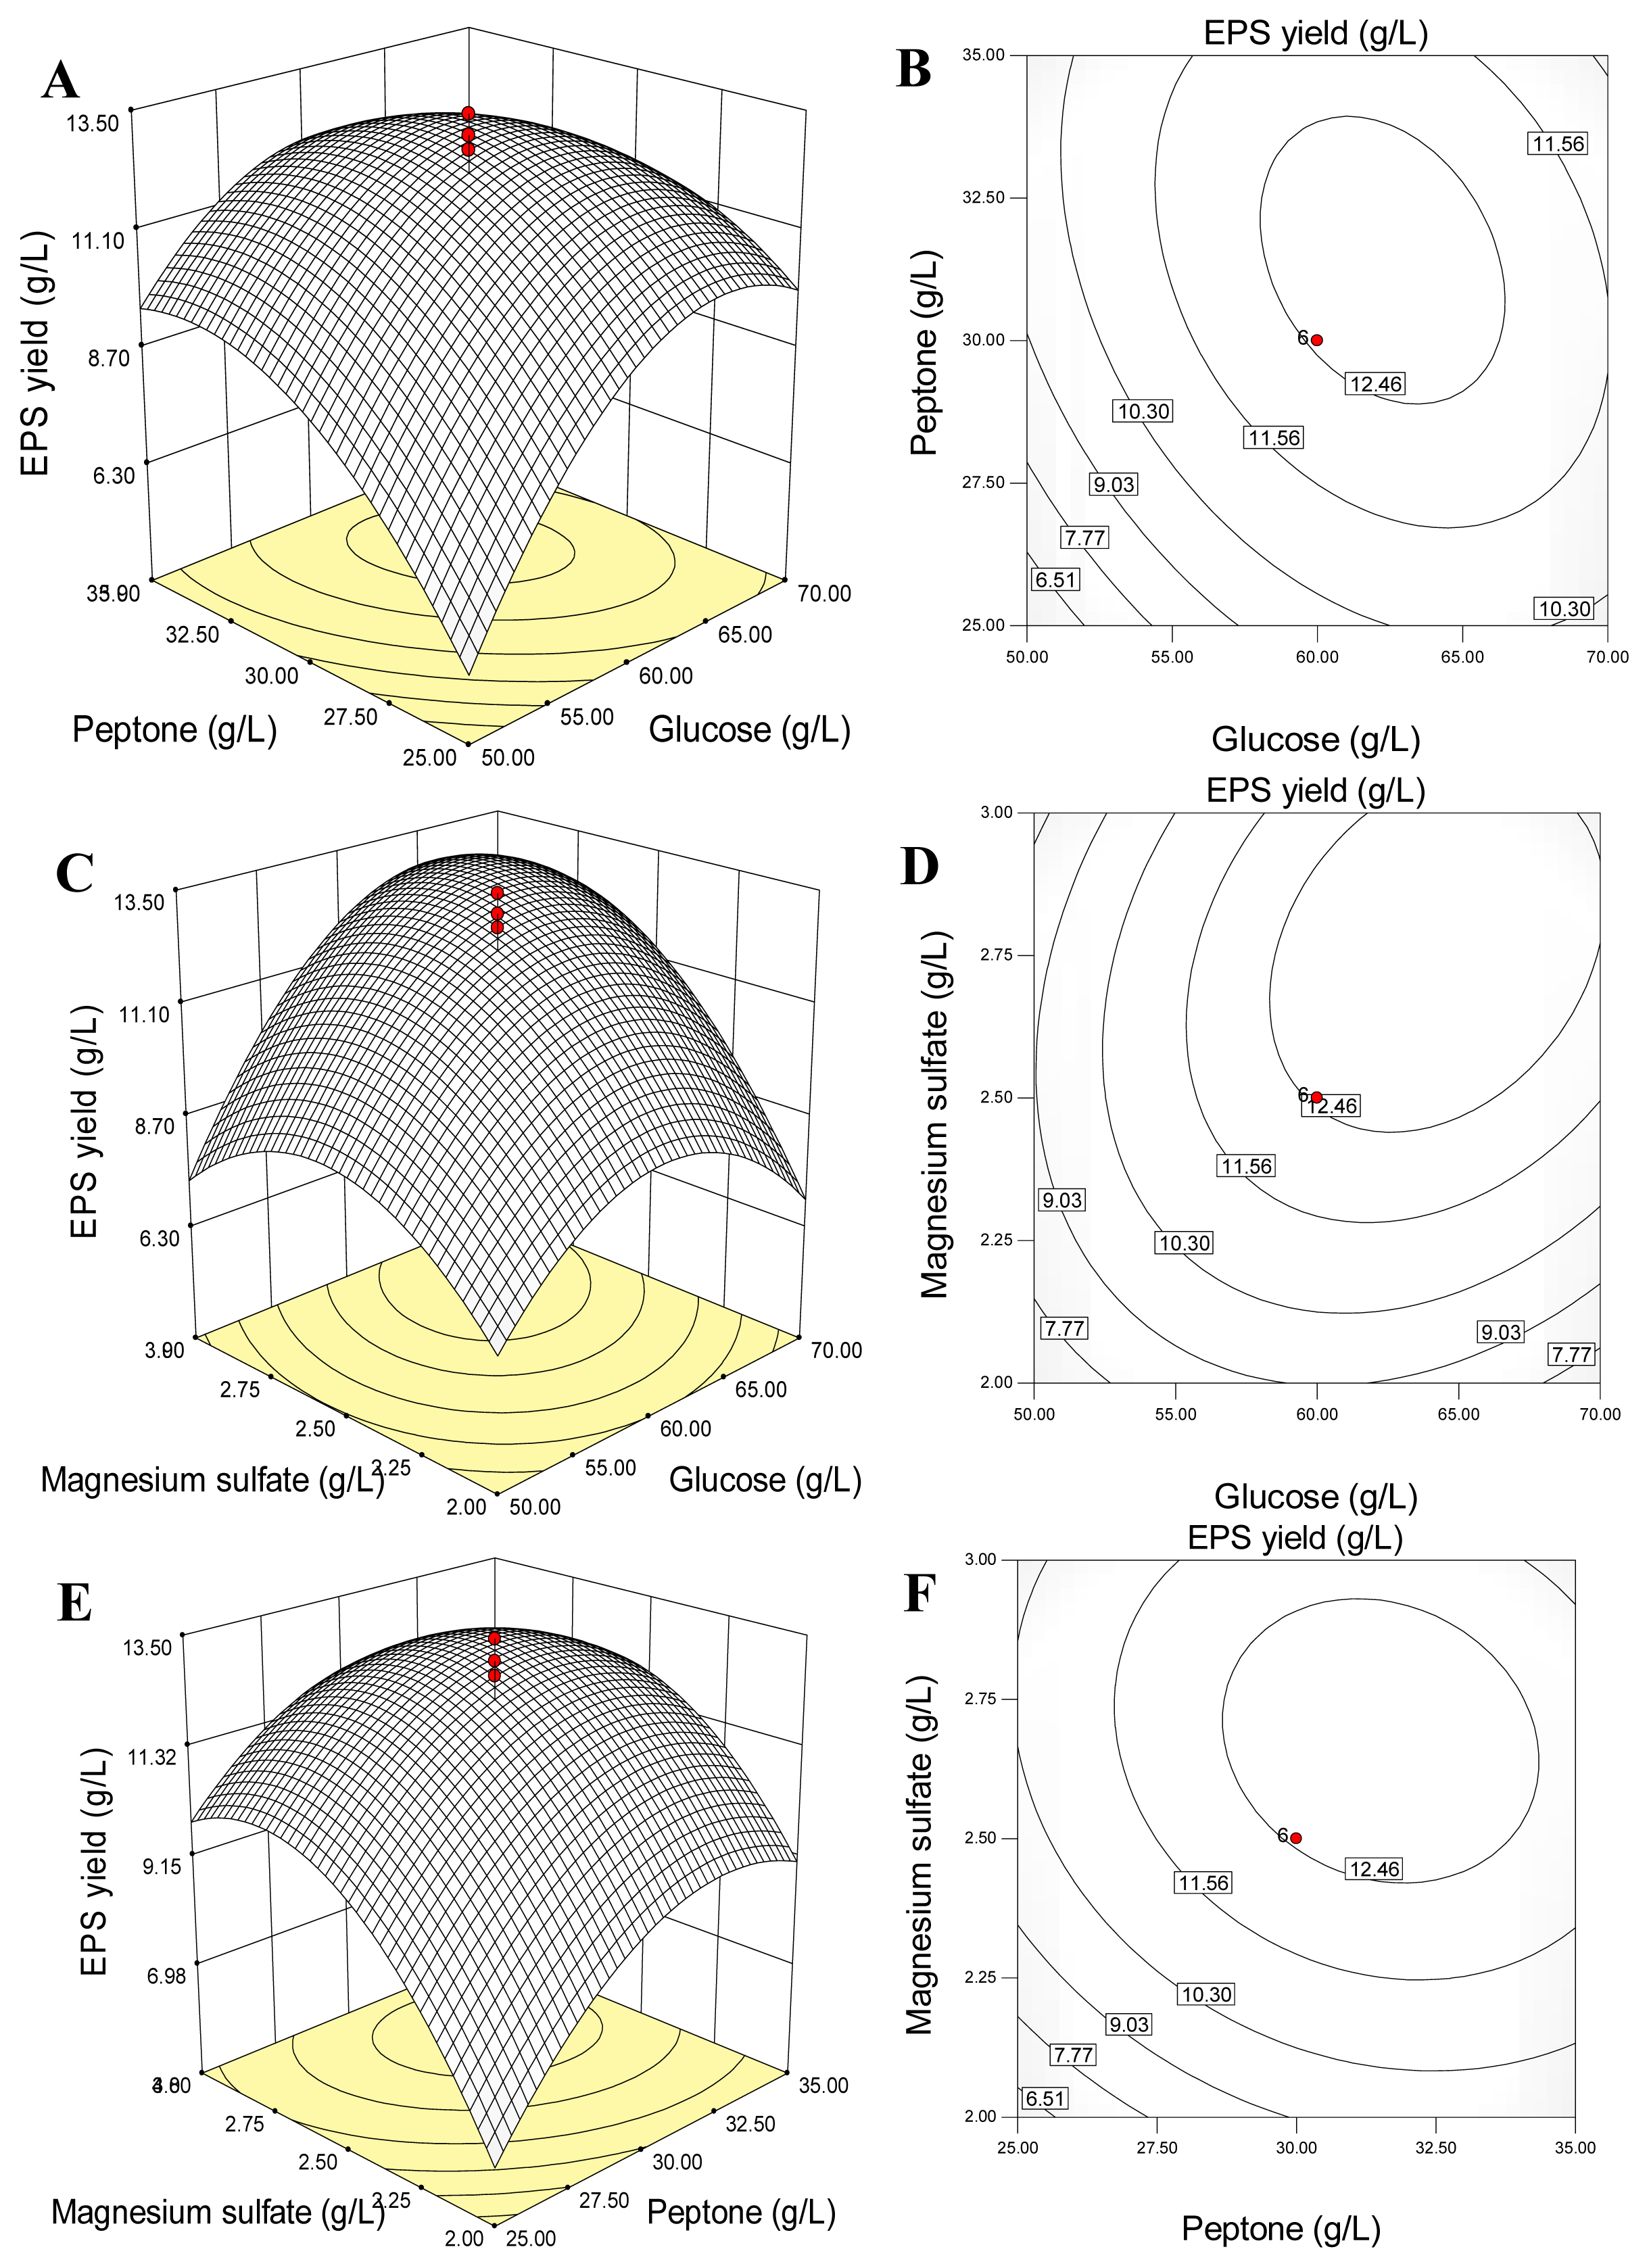
2.4. Response Surface and Contour Plots Analyses

The three-dimensional (3D) response surface and two-dimensional (2D) contour plots are the graphical representations of the quadratic polynomial regression equation [48]. They provide a method to visualize the relationship between the responses and the experimental levels of each variable, and the interactions between any two tested variables from the circular or elliptical nature of contour [49]. A circular contour plot indicates that the interactions between the corresponding variables are negligible. An elliptical nature of the contour plots indicates that the interactions between the corresponding variables are significant [50]. In the present study, the 3D response surfaces and 2D contour plots are presented in Figure 2, which were generated by employing the software of Design-Expert. Analyses of the 3D response surfaces and their corresponding 2D contour plots allowed us to conveniently investigate the interactions between any two variables, and locate the optimum ranges of the variables efficiently such that the response was maximized. The maximum predicted response was indicated by the surface confined in the smallest ellipse in the contour diagram.
The response surface plot in Figure 2A and contour plot in Figure 2B show the effects of glucose and peptone on EPS yield and their interactions when MgSO4·7H2O was fixed at zero level. EPS yield showed an increasing tendency with the increasing of the concentrations of glucose and peptone, and then decreased slightly. A full elliptic contour in Figure 2B was observed, indicating a significant interaction between glucose and peptone for EPS production. It was consistent with the analyses of coefficients of the regression equation (Table 6). Figure 2C,D graphed the effects of glucose and MgSO4·7H2O on EPS yield and their interaction when peptone was fixed at zero level. When the concentrations of glucose and MgSO4·7H2O in medium were increased from the lowest levels to the highest levels, EPS yield was increased initially and then decreased. The elliptic contour in Figure 2D indicated the significant interaction between glucose and MgSO4·7H2O for EPS production. The effects of peptone and MgSO4·7H2O, and their interactions, on EPS yields are shown in Figure 2E,F. EPS yield was firstly augmented and then decreased when the concentrations of peptone and MgSO4·7H2O varied from the lowest levels to the highest levels.
By analyzing the 3D response surface and 2D contour plots, the corresponding point to the maximum of EPS yield should locate on the peak of the response surface, which projected in the smallest ellipse in the contour diagram [51]. Hence, the optimal ranges of the concentrations of glucose, peptone and MgSO4·7H2O in medium for realizing the maximization of EPS yield were calculated by the software Design Expert as follows: 58.30 to 66.48 g/L for glucose, 28.89 to 33.93 g/L for peptone, 2.44 to 2.93 g/L for MgSO4·7H2O.

2.5. Optimization of the Variables and Verification of the Model

By solving the inverse matrix of the regression polynomial equation (Equation 1) employing the software of Design-Expert, the optimum values of the tested parameters in uncoded units were obtained as follows: glucose as 63.80 g/L, peptone as 20.76 g/L, and MgSO4·7H2O as 2.74 g/L. Under the optimum conditions, the predicted EPS yield reached to the maximum (13.22 g/L). To validate the suitability of the model equation for predicting the optimum response value, experimental rechecking was performed using the deduced optimal conditions. Under the determined conditions, a mean value of EPS yield of 13.97 g/L (n = 5) was obtained from the actual experiments, slightly higher than the predicted maximum value (13.22 g/L). However, no significant difference was observed between the predicted yield and experimental one when the Student t-test was conducted, indicating that the model was satisfactory and adequate for reflecting the expected optimization.

3. Experimental Section

3.1. Cultivation of the Endophytic Fungus Berkleasmium sp. Dzf12

The endophytic fungus Berkleasmium sp. Dzf12 (GenBank accession number EU543255) was isolated from the healthy rhizomes of D. zingiberensis in our previous study [27,28]. It was preserved on potato dextrose agar (PDA) slants at 4 °C and subcultured every six months.
Berkleasmium sp. Dzf12 was firstly cultivated in a 150-mL flask containing 30 mL modified Sabouraud broth medium consisting of glucose (40 g/L), peptone (10 g/L), KH2PO4 (1.0 g/L), MgSO4·7H2O (0.5 g/L), FeSO4·7H2O (0.05 g/L), which was incubated at 25 °C on a rotary shaker at 150 rpm for 4 days as the inoculated seed culture [29]. The initial pH of culture medium was adjusted to 6.5. The culture medium producing EPS was confected according to the experimental design based on the basic medium composed of glucose, peptone, KH2PO4, MgSO4·7H2O and FeSO4·7H2O. The medium composition (g/L) was set according to the experimental design. Each 250-mL Erlenmeyer flask containing 100 mL of fermentation medium was inoculated with 2.5% (v/v) seed culture broth, then cultivated in a rotary shaker incubator at 25 °C, 150 rpm for 12 days [29].

3.2. Preparation of the Exopolysaccharide

Exopolysaccharide (EPS) was prepared from fermentation broth of Berkleasmium sp. Dzf12 according to our previous reports [14,26]. The 12-day-old Berkleasmium sp. Dzf12 fermentation broth was harvested and centrifugated. The supernatant without mycelia was collected and concentrated to a proper volume (about 10% of the original) under vacuum at 60 °C by a rotary evaporator and mixed with three volumes of 95% ethanol. The mixture was stirred vigorously and then maintained at 4 °C for 48 h. The precipitate was collected by centrifugation at 17,418g for 15 min from the ethanol dispersion and then washed twice with absolute ethanol and acetone respectively. The final precipitate was then subjected to successive deproteination with Sevag reagent (chloroform-n-butanol at 4:1, v/v), decolorization with H2O2, and removal of small molecular impurities by dialysis. Polysaccharide mixture with molecular weight greater than 8000–14,000 Da was kept in the dialysis tube. The retentate was concentrated to a certain volume and then mixed with three volumes of 95% ethanol. The precipitate thus obtained was lyophilized and weighed, which was designated as EPS.
The carbohydrate content of EPS was measured spectrophotometrically by the method of anthrone-sulfuric acid [15,52], which involved sulfuric acid hydrolysis of the sample in the presence of anthrone agent at 100 °C. The absorbance at 620 nm was measured and calibrated to carbohydrate content using glucose as a reference. The EPS yield was calculated by the amount (g) of carbohydrate content of EPS per liter (L) culture medium.

3.3. Procedure Optimization and Experimental Design

Fractional factorial design (FFD) was initially employed to identify the major components of medium affecting the producing of EPS, which was very practical, especially when the investigator is faced with a large number of factors and is unsure which settings are likely to be close to optimum responses [33,53]. Five components of the fermentation medium (glucose, peptone, KH2PO4, MgSO4·7H2O and FeSO4·7H2O) were selected as factors to conduct the 25-1 FFD experiments using the software of Design Expert (Version 7.1; Stat-Ease, Inc.: Minneapolis, MN, USA). Each factor was set at a high level (coded + 1) and a low level (coded − 1), which are listed in Table 7. The FFD matrix is shown in Table 1 including 16 runs. All experiments were conducted in triplicate and the averages of the results were taken as response values.
By analyzing the results of factorial design experiments, three main components having significant effects on EPS production were determined as glucose, peptone and MgSO4·7H2O. Single-factor experiments of the three major factors were carried out to determine their optimal ranges for EPS production, when the concentrations of KH2PO4 and FeSO4·7H2O were fixed at 2.0 g/L and 0.05 g/L, respectively.
Based on the results of fractional factorial and single-factor experiments, central composite design (CCD) experiments and response surface methodology (RSM) were employed to optimize the concentrations of glucose, peptone and MgSO4·7H2O in the fermentation medium for realizing the maximization of EPS yield by the software of Design-Expert. In recent years, both CCD and RSM technologies have been widely applied to optimize the medium composition for production of different metabolites from fungi, which have also been proved to be efficient, practical and precise [54,55]. Each independent variable in the CCD experiments was studied at five levels (−1.682, −1, 0, +1, +1.682), which is represented in Table 3. The independent variable was expressed as Xi, which was coded as xi according to the following equation (Equation 2):
x i = ( X i - X 0 ) / Δ X , i = 1 , 2 , 3
where xi is the coded value of the variable Xi, while X0 is the value of Xi at the center point, and ΔX is the step change of an independent variable.
CCD in this experimental design consisted of 20 trials which were carried out in a random order in triplicate that was necessary to estimate the variability of measurements, which are presented in Table 4. Five replicates at the center point of the design were carried out to allow for estimation of a pure error sum of squares. The EPS yield was recorded as the mean of triplicates, which was taken as the response value.
Based on the CCD experimental data, a second-order polynomial model was established, which correlated the relationship between EPS yield and the independent variables. The relationship could be expressed by the following equation (Equation 3):
Y = a 0 + a 1 x 1 + a 2 x 2 + a 3 x 3 + a 12 x 1 x 2 + a 13 x 1 x 3 + a 23 x 2 x 3 + a 11 x 1 2 + a 22 x 2 2 + a 33 x 3 2
where Y is the predicted response value; a0 is the intercept term; x1, x2 and x3 are independent variables; a1, a2 and a3 are linear coefficients; a12, a13 and a23 are cross product coefficients; and a11, a22 and a33 are the quadratic term coefficients. All of the coefficients of the second polynomial model and the responses obtained from the experimental design were subjected to multiple nonlinear regression analyses.
The fitness of the second-order polynomial model equation was evaluated by the coefficient (R2) of determination. The analysis of variance (ANOVA) and test of significance for regression coefficients were conducted by F-test. In order to visualize the relationship between the response values and independent variables, the fitted polynomial equation was separately expressed as 3D response surfaces and 2D contour plots by the software of Design Expert [56,57].

4. Conclusions

The medium composition (i.e., the concentrations of glucose, peptone, KH2PO4, MgSO4·7H2O and FeSO4·7H2O) for EPS production of Berkleasmium sp. Dzf12 was optimized in this study by employing statistical method based on the response surface methodology (RSM). The FFD experiments were initially carried out to screen the main effective factors, and the three variables (i.e., the concentrations of glucose, peptone and MgSO4·7H2O) were found to have significant impacts on EPS production. Single-factor experiments were further conducted to define the optimal ranges of the three main variables and to provide basis for the later CCD experiments. Both CCD experiments and RSM technology were applied to optimize the concentrations of glucose, peptone and MgSO4·7H2O in medium to realize the maximization of EPS yield. By solving the quadratic regression equation between EPS yield and the three variables, the optimal concentrations of glucose, peptone and MgSO4·7H2O in medium were determined as 63.80, 20.76 and 2.74 g/L, respectively. Under the optimum conditions, the predicted EPS yield reached the maximum (13.22 g/L). The predicted EPS yield showed no significant difference from the experimental value. By optimizing the medium of Berkleasmium sp. Dzf12 for EPS production, the EPS yield was increased to 13.97 g/L, which was 6.29-fold in comparison with that (2.22 g/L) in the original basal medium. The results should be beneficial for future EPS production in fermentation culture of Berkleasmium sp. Dzf12 as well as for speeding up the EPS investigation and application. Medium optimization for spirobisnaphthalenes (i.e., palmarumycins C12 and C13) production in mycelial liquid culture of Berkleasmium sp. Dzf12 has been studied in our previous studies [2932]. As there were only five components in the medium used in this study, more components in the medium as well as other parameters like pH, temperature, oxygen supply, and ionic strength should be considered in future work. Optimization of the medium to produce both spirobisnaphthalenes and EPS with their high yields, as well as consideration of the medium viscosity and foam formation in a bioreactor are other aspects worthy of further study.

Acknowledgments

The authors wish to thank the Program for Changjiang Scholars and Innovative Research Team in University of China (IRT1042) and the National Natural Science Foundation of China (31071710) for their financial support in this research.

References

  1. Wang, H.X.; Ng, T.B.; Liu, W.K.; Ooi, V.E.C.; Chang, S.T. Polysaccharide-Peptide complexes from the cultured mycelia of the mushroom Coriolus versicolor and their culture medium activate mouse lymphocytes and macrophages. Int. J. Biochem. Cell Biol 1996, 28, 601–607. [Google Scholar]
  2. Lee, J.S.; Cho, J.Y.; Hong, E.K. Study on macrophage activation and structural characteristics of purified polysaccharides from the liquid culture broth of Hericium erinaceus. Carbohydr. Polym 2009, 78, 162–168. [Google Scholar]
  3. Li, S.P.; Zhao, K.J.; Ji, Z.N.; Song, Z.H.; Dong, T.T.X.; Lo, C.K.; Cheung, J.K.H.; Zhu, S.Q.; Tsim, K.W.K. A polysaccharide isolated from Cordyceps sinensis, a traditional Chinese medicine, protects PC12 cells against hydrogen peroxide-induced injury. Life Sci 2003, 73, 2503–2513. [Google Scholar]
  4. Chen, J.; Zhang, W.; Lu, T.; Li, J.; Zheng, Y.; Kong, L. Morphological and genetic characterization of a cultivated Cordyceps sinensis fungus and its polysaccharide component possessing antioxidant property in H22 tumor-bearing mice. Life Sci 2006, 78, 2742–2748. [Google Scholar]
  5. Leung, P.H.; Zhao, S.; Ho, K.P.; Wu, J.Y. Chemical properties and antioxidant activity of exopolysaccharides from mycelial culture of Cordyceps sinensis fungus Cs-HK1. Food Chem 2009, 114, 1251–1256. [Google Scholar]
  6. Li, P.; Luo, C.; Sun, W.; Lu, S.; Mou, Y.; Peng, Y.; Zhou, L. In vitro antioxidant activities of polysaccharides from endophytic fungus Fusarium oxysporum Dzf17. Afr. J. Microbiol. Res 2011, 5, 5990–5993. [Google Scholar]
  7. Chen, Y.; Mao, W.; Yang, Y.; Teng, X.; Zhu, W.; Qi, X.; Chen, Y.; Zhao, C.; Hou, Y.; Wang, C.; et al. Structure and antioxidant activity of an extracellular polysaccharide from coral-associated fungus, Aspergillus versicolor LCJ-5-4. Carbohydr. Polym 2012, 87, 218–226. [Google Scholar]
  8. Peng, Y.; Zhang, L.; Zeng, F.; Kennedy, J.F. Structure and antitumor activities of the water-soluble polysaccharides from Ganoderma tsugae mycelium. Carbohydr. Polym 2005, 59, 385–392. [Google Scholar]
  9. Gan, D.; Ma, L.; Jiang, C.; Xu, R.; Zeng, X. Production, preliminary characterization and antitumor activity in vitro of polysaccharides from the mycelium of Pholiota dinghuensis Bi. Carbohydr. Polym 2011, 84, 997–1003. [Google Scholar]
  10. Cheng, J.-J.; Lin, C.-Y.; Lur, H.-S.; Chen, H.-P.; Lu, M.-K. Properties and biological functions of polysaccharides and ethanolic extracts isolated from medicinal fungus, Fomitopsis pinicola. Process Biochem 2008, 43, 829–834. [Google Scholar]
  11. Cardozo, F.T.G.S.; Camelini, C.M.; Mascarello, A.; Rossi, M.J.; Nunes, R.J.; Barardi, C.R.M.; Mendonca, M.M.; Simoes, C.M.O. Antiherpetic activity of a sulfated polysaccharide from Agaricus brasiliensis mycelia. Antivir. Res 2011, 92, 108–114. [Google Scholar]
  12. Cheng, J.-J.; Lu, M.-K.; Lin, C.-Y.; Chang, C.-C. Characterization and functional elucidation of a fucosylated 1,6-α-d-mannogalactan polysaccharide from Antrodia cinnamomea. Carbohydr. Polym 2011, 83, 545–553. [Google Scholar]
  13. Telles, C.B.S.; Sabry, D.A.; Almeida-Lima, J.; Costa, M.S.S.P.; Melo-Silveira, R.F.; Trindade, E.S.; Sassaki, G.L.; Wisbeck, E.; Furlan, S.A.; Leite, E.L.; et al. Sulfation of the extracellular polysaccharide produced by the edible mushroom Pleurotus sajor-caju alters its antioxidant, anticoagulant and antiproliferative properties in vitro. Carbohydr. Polym 2011, 85, 514–521. [Google Scholar]
  14. Li, P.; Mou, Y.; Shan, T.; Xu, J.; Li, Y.; Lu, S.; Zhou, L. Effects of polysaccharide elicitors from endophytic Fusarium oxysporium Dzf17 on the growth and diosgenin production in cell suspension culture of Dioscorea zingiberensis. Molecules 2011, 16, 9003–9016. [Google Scholar]
  15. Li, P.; Lu, S.; Shan, T.; Mou, Y.; Li, Y.; Sun, W.; Zhou, L. Extraction optimization of water-extracted mycelial polysaccharide from endophytic fungus Fusarium oxysporum Dzf17 by response surface methodology. Int. J. Mol. Sci 2012, 13, 5441–5453. [Google Scholar]
  16. Backman, P.A.; Sikora, R.A. Endophytes: An emerging tool for biological control. Biol. Control 2008, 46, 1–3. [Google Scholar]
  17. Schulz, B.; Boyle, C.; Draeger, S.; Rommert, A.-K.; Krohn, K. Endophytic fungi: A source of novel biologically active secondary metabolites. Mycol. Res 2002, 106, 996–1004. [Google Scholar]
  18. Aly, A.H.; Debbab, A.; Kjer, J.; Proksch, P. Fungal endophytes from higher plants: A prolific source of phytochemicals and other bioactive natural products. Fungal Divers 2010, 41, 1–16. [Google Scholar]
  19. Zhao, J.; Shan, T.; Mou, Y.; Zhou, L. Plant-Derived bioactive compounds produced by endophytic fungi. Mini Rev. Med. Chem 2011, 11, 159–168. [Google Scholar]
  20. Zhou, L.; Zhao, J.; Shan, T.; Cai, X.; Peng, Y. Spirobisnaphthalenes from fungi and their biological activities. Mini Rev. Med. Chem 2010, 10, 977–989. [Google Scholar]
  21. Kharwar, R.N.; Mishra, A.; Gong, S.K.; Stierle, A.; Stierle, D. Anticancer compounds derived from fungal endophytes: Their importance and future challenges. Nat. Prod. Rep 2011, 28, 1208–1228. [Google Scholar]
  22. Strobel, G.; Daisy, B.; Castillo, U.; Harper, J. Natural products from endophytic microorganisms. J. Nat. Prod 2004, 67, 257–268. [Google Scholar]
  23. Zhang, H.W.; Song, Y.C.; Tan, R.X. Biology and chemistry of endophytes. Nat. Prod. Rep 2006, 23, 753–771. [Google Scholar]
  24. Wasser, S.P.; Weis, A. Therapeutic effects of substances occurring in higher basidiomycetes mushrooms, a modern perspective (review). Crit. Rev. Immunol 1999, 19, 65–96. [Google Scholar]
  25. Wasser, S.P. Medicinal mushrooms as a source of antitumor and immunomodulating polysaccharides. Appl. Microbiol. Biotechnol 2002, 60, 258–274. [Google Scholar]
  26. Li, P.; Sun, W.; Luo, C.; Shan, T.; Mou, Y.; Mao, Z.; Zhou, L. In vitro evaluation of antioxidant activities of polysaccharides from the endophytic fungus Berkleasmium sp. Dzf12. Afr. J. Microbiol. Res 2012, 6, 471–477. [Google Scholar]
  27. Zhang, R.; Li, P.; Zhao, J.; Yin, C.; Zhou, L. Endophytic fungi from Dioscorea zingiberensis and their effects on the growth and diosgenin production of the host plant cultures. Nat. Prod. Res. Dev 2010, 22, 11–15. [Google Scholar]
  28. Cai, X.; Shan, T.; Li, P.; Huang, Y.; Xu, L.; Zhou, L.; Wang, M.; Jiang, W. Spirobisnaphthalenes from the endophytic fungus Dzf12 of Dioscorea zingiberensis and their antimicrobial activities. Nat. Prod. Commun 2009, 4, 1469–1472. [Google Scholar]
  29. Zhao, J.; Zheng, B.; Li, Y.; Shan, T.; Mou, Y.; Lu, S.; Li, P.; Zhou, L. Enhancement of diepoxin ζ production by yeast extract and its fractions in liquid culture of Berkleasmium-like endophytic fungus Dzf12 from Dioscorea zingiberensis. Molecules 2011, 16, 847–856. [Google Scholar]
  30. Zhao, J.; Li, Y.; Shan, T.; Mou, Y.; Zhou, L. Enhancement of diepoxin ζ production with in situ resin adsorption in mycelial liquid culture of the endophytic fungus Berkleasmium sp. Dzf12 from Dioscorea zingiberensis. World J. Microbiol. Biotechnol 2011, 27, 2753–2758. [Google Scholar]
  31. Li, Y.; Li, P.; Mou, Y.; Zhao, J.; Shan, T.; Ding, C.; Zhou, L. Enhancement of diepoxin ζ production in liquid culture of endophytic fungus Berkleasmium sp. Dzf12 by polysaccharides from its host plant Dioscorea zingiberensis. World J. Microbiol. Biotechnol 2012, 28, 1407–1413. [Google Scholar]
  32. Li, Y.; Shan, T.; Mou, Y.; Li, P.; Zhao, J.; Zhao, W.; Peng, Y.; Zhou, L.; Ding, C. Enhancement of palmarumycin C12 and C13 production in liquid culture of endophytic fungus Berkleasmium sp. Dzf12 by oligosaccharides from its host plant Dioscorea zingiberensis. Molecules 2012, 17, 3761–3773. [Google Scholar]
  33. Zhu, Y.; Knol, W.; Smits, J.P.; Bol, J. Medium optimization for nuclease Pl production by Penicillium citrinum in solid-state fermentation using polyurethane foam as inert carrier. Enzyme Microb. Technol 1996, 18, 108–112. [Google Scholar]
  34. Vaidya, R.; Vyas, P.; Chhatpar, H.S. Statistical optimization of medium components for the production of chitinase by Alcaligenes xylosoxydans. Enzyme Microb. Technol 2003, 33, 92–96. [Google Scholar]
  35. Wang, Y.-H.; Yang, B.; Dong, M.-L.; Liang, D.; Xu, A.-L. Optimization of medium composition for the production of clavulanic acid by Streptomyces clavuligerus. Process Biochem 2005, 40, 1161–1166. [Google Scholar]
  36. Luo, J.; Liu, J.; Ke, C.; Qiao, D.; Ye, H.; Sun, Y.; Zeng, X. Optimization of medium composition for the production of exopolysaccharides from Phellinus baumii Pilát in submerged culture and the immuno-stimulating activity of exopolysaccharides. Carbohydr. Polym 2009, 78, 409–415. [Google Scholar]
  37. Yin, Y.; Gao, Q.; Zhang, F.; Li, Z. Medium optimization for the high yield production of single (+)-terrein by Aspergillus terreus strain PF26 derived from marine sponge Phakellia fusca. Process Biochem 2012, 47, 887–891. [Google Scholar]
  38. Rao, K.J.; Kim, C.-H.; Rhee, S.-K. Statistical optimization of medium for the production of recombinant hirudin from Saccharomyces cerevisiae using response surface methodology. Process Biochem 2000, 35, 639–647. [Google Scholar]
  39. Box, G.E.P.; Hunter, W.G.; Hunter, J.S. Statistics for Experimenters; John Wiley & Sons, Inc: Hoboken, NJ, USA, 1978; pp. 510–539. [Google Scholar]
  40. Ibrahim, H.M.; Yusoff, W.M.W.; Hamid, A.A.; Illias, R.M.; Hassan, O.; Omar, O. Optimization of medium for the production of β-cyclodextrin glucanotransferase using central composite design (CCD). Process Biochem 2005, 40, 753–758. [Google Scholar]
  41. Nikerel, I.E.; Oner, E.; Kirdar, B.; Yildirim, R. Optimization of medium composition for biomass production of recombinant Escherichia coli cells using response surface methodology. Biochem. Eng. J 2006, 32, 1–6. [Google Scholar]
  42. Zhang, T.; Wen, S.; Tan, T. Optimization of the medium for glutathione production in Saccharomyces cerevisiae. Process Biochem 2007, 42, 454–458. [Google Scholar]
  43. Liu, J.; Luo, J.; Ye, H.; Sun, Y.; Lu, Z.; Zeng, X. Medium optimization and structural characterization of exopolysaccharides from endophytic bacterium Paenibacillus polymyxa EJS-3. Carbohydr. Polym 2010, 79, 206–213. [Google Scholar]
  44. Pujari, V.; Chandra, T.S. Statistical optimization of medium components for enhanced riboflavin production by a UV-mutant of Eremothecium ashbyii. Process Biochem 2000, 36, 31–37. [Google Scholar]
  45. Gao, H.; Gu, W.-Y. Optimization of polysaccharide and ergosterol production from Agaricus brasiliensis by fermentation process. Biochem. Eng. J 2007, 33, 202–210. [Google Scholar]
  46. Liu, J.-Z.; Weng, L.-P.; Zhan, Q.-L.; Xu, H.; Ji, L.N. Optimization of glucose oxidase production by Aspergillus niger in a benchtop bioreactor using response surface methodology. World J. Microbiol. Biotechnol 2003, 19, 317–323. [Google Scholar]
  47. Murthy, M.S.R.C.; Swaminathan, T.; Rakshit, S.K.; Kosugi, Y. Statistical optimization of lipase catalyzed hydrolysis of methyloleate by response surface methodology. Bioprocess Eng 2000, 22, 35–39. [Google Scholar]
  48. Box, G.E.P.; Wilson, K.B. On the experimental attainment of optimum conditions. J. Roy. Stat. Soc. B 1951, 13, 1–45. [Google Scholar]
  49. Kiran, B.; Kaushik, A.; Kaushik, C.P. Response surface methodological approach for optimizing removal of Cr (VI) from aqueous solution using immobilized cyanobacterium. Chem. Eng. J 2007, 126, 147–153. [Google Scholar]
  50. Muralidhar, R.V.; Chirumamila, R.R.; Marchant, R.; Nigam, P. A response surface approach for the comparison of lipase production by Candida cylindracea using two different carbon sources. Biochem. Eng. J 2001, 9, 17–23. [Google Scholar]
  51. Wu, Y.; Cui, S.W.; Tang, J.; Gu, X. Optimization of extraction process of crude polysaccharides from boat-fruited sterculia seeds by response surface methodology. Food Chem 2007, 105, 1599–1605. [Google Scholar]
  52. Wang, Z.J.; Luo, D.H.; Ena, C. Optimization of polysaccharides extraction from Gynostemma pentaphyllum Makino using uniform design. Carbohydr. Polym 2007, 69, 311–317. [Google Scholar]
  53. Jiao, Y.; Chen, Q.; Zhou, J.; Zhang, H.; Chen, H. Improvement of exo-polysaccharides production and modeling kinetics by Armillaria luteo-virens Sacc. In submerged cultivation. LWT Food Sci. Technol 2008, 41, 1694–1700. [Google Scholar]
  54. Zhuang, Y.P.; Chen, B.; Chu, J.; Zhang, S. Medium optimization for meilingmycin production by Streptomyces nanchangensis using response surface methodology. Process Biochem 2006, 41, 405–409. [Google Scholar]
  55. Yatsyshyn, V.Y.; Fedorovych, D.V.; Sibirny, A.A. Medium optimization for production of flavin mononucleotide by the recombinant strain of the yeast Candida famata using statistical designs. Biochem. Eng. J 2010, 49, 52–60. [Google Scholar]
  56. Soto-Cruz, O.; Saucedo-Castaneda, G.; Pablos-Hach, J.L.; Gutierrez-Rojas, M.; Favela-Torres, E. Effect of substrate composition on the mycelial growth of Pleurotus ostreatus. an analysis by mixture and response surface methodologies. Process Biochem 1999, 35, 127–133. [Google Scholar]
  57. Triveni, R.; Shamala, T.R.; Rastogi, N.K. Optimized production and utilization of exopolysaccharide from Agrobacterium radiobacter. Process Biochem 2001, 36, 787–795. [Google Scholar]
Figure 1. Effects of the concentrations (g/L) of glucose (A); peptone (B); and MgSO4·7H2O (C) in medium on exopolysaccharide (EPS) production in fermentation culture of Berkleasmium sp. Dzf12. The error bars represent standard deviations from three independent samples. Different letters indicate significant differences among the treatments at p = 0.05 level.
Ijms 13 11411f1aIjms 13 11411f1b
Figure 2. The 3D-response surface and 2D-contour plots of EPS yield (g/L) versus the tested variables (g/L): glucose and peptone (A,B); glucose and MgSO4·7H2O (C,D); peptone and MgSO4·7H2O (E,F).
Ijms 13 11411f2
Table 1. The matrix of fractional factorial design (FFD) and the experimental results.
RunGlucose (g/L)Peptone (g/L)KH2PO4 (g/L)MgSO4·7H2O (g/L)FeSO4·7H2O (g/L)EPS Yield (g/L)
130100.50.50.051.20
260100.50.50.011.42
330200.50.50.012.80
460200.50.50.053.67
530102.00.50.011.12
660102.00.50.052.36
730202.00.50.053.85
860202.00.50.016.62
930100.52.00.052.82
1060100.52.00.015.37
1130200.52.00.015.08
1260200.52.00.0513.63
1330102.02.00.012.97
1460102.02.00.056.84
1530202.02.00.055.57
1660202.02.00.0110.89
Table 2. Analysis of variance (ANOVA) of the fractional factorial design (FFD) experiments.
SourceSum of squaresd.f.F Valuep-Value p > FSignificance
Glucose40.29112.670.0052**
Peptone49.04115.420.0028**
KH2PO41.1210.350.5664
MgSO4·7H2O56.74117.840.0018**
FeSO4·7H2O1.8410.580.4641
**significance of the variable: p = 0.01.
Table 3. Coded values (x) and uncoded values (X) of variables in the central composite design (CCD) experiments.
Variable (g/L)SymbolCoded level


UncodedCoded−1.682−101+1.682
GlucoseX1x143.1850607076.82
PeptoneX2x221.5925303538.41
MgSO4·7H2OX3x31.6622.533.34
Table 4. CCD experimental matrix and the results.
EPS Yield (g/L)

Runx1x2x3Experimental YePredicted YpYeYp
10−1.68206.076.23−0.17
2001.6829.309.59−0.29
301.682010.229.990.23
4−1−1−12.712.450.26
5−1117.897.520.36
6−11−17.327.81−0.49
711110.0110.31−0.30
800013.4312.520.91
900011.9512.52−0.57
101−1−14.474.88−0.41
1111−16.016.000.01
1200−14.874.520.35
131.682008.518.390.13
14−1−114.124.18−0.06
1500012.0912.52−0.43
1600012.7312.520.21
17−1.682003.944.00−0.06
181−1111.6411.200.44
1900013.0212.520.50
2000011.8912.52−0.43
Table 5. Analysis of variance (ANOVA) for the fitted quadratic polynomial model.
SourceSum of squaresd.f.Mean squareF ValueProbability p > F
Model228.02925.3478.46<0.0001
Lack of fit1.2050.240.590.71
Pure error2.0350.41
Corrected total231.2519
R2 = 0.9735; adj-R2 = 0.9434; R = 0.9867; adj-R = 0.9712; CV (%) = 6.60.
Table 6. Regression coefficient and their significance test of the quadratic polynomial model.
Model termCoefficient estimateStandard errorSum of squaresd.f.Mean squareF ValueProbability p > F
Intercept12.520.23
x11.300.1523.18123.1871.79<0.0001
x21.120.1517.06117.0652.83<0.0001
x31.510.1531.12131.1296.36<0.0001
x1x2−1.060.208.9618.9627.75<0.0001
x1x31.150.2010.58110.5832.760.0004
x2x3−0.500.202.0112.016.240.0002
x12−2.240.1572.04172.04223.090.0316
x22−1.560.1534.99134.99108.36<0.0001
x32−1.930.1553.80153.80166.61<0.0001
Table 7. The coded and actual values in the 25-1 FFD experiments.
Variable (g/L)Level

−1+1
Glucose3060
Peptone1020
KH2PO40.52.0
MgSO4·7H2O0.52.0
FeSO4·7H2O0.010.05

