1. Introduction
Endometrial cancer (EC) is the most common gynecologic malignancy and the fourth most common cancer in females, ranking behind breast, lung and colorectal cancers in the United States. While early stage EC has a favorable prognosis, late stage EC is associated with a relatively high rate of post-treatment recurrence and mortality. The importance of early diagnosis is underscored by the dramatic reduction of five-year survival rates from 96% to 67% and further to 17% for localized, regional, and metastatic disease, respectively [
1]. Several studies have evaluated the efficacy of various tumor markers, including CA125, for EC early detection and management, but only limited specificities and sensitivities was observed [
2–
4].
HE4 was first cloned as one of four proteins highly expressed in human epididymis [
5]. Amino acid sequence analysis suggested that HE4 belongs to a whey-acidic-protein (WAP) family and contains two four-disulfide core domains (WFDC2).
HE4 gene is located on chromosome 20q13.12, a region harboring a cluster of genes for WAP domain proteins [
6–
8]. Although it is well known that at least some members of this family serve as endogenous peptide protease inhibitors, the function of HE4 remains obscure. Using the cDNA microarray technique Schummer
et al. found that
HE4 is overexpressed in ovarian cancer (OC) [
9]. Bingle
et al. used Northern blot hybridization in order to characterize its tissue-specific expression and found that HE4 mRNA is abundant in lung, kidney, and the salivary gland [
8]. Lu
et al. performed oligo-array analysis and observed that
HE4 is overexpressed in OC in comparison to normal ovarian epithelium [
10]. Drs. Drapkin and Galgano
et al. analyzed the expression of
HE4 in a series of normal and malignant tissues and observed high levels of HE4 mRNA in the trachea and salivary gland [
11,
12]. Tissue microarray studies indicate that HE4 protein is present in both normal and malignant ovarian and endometrial cells [
10–
13].
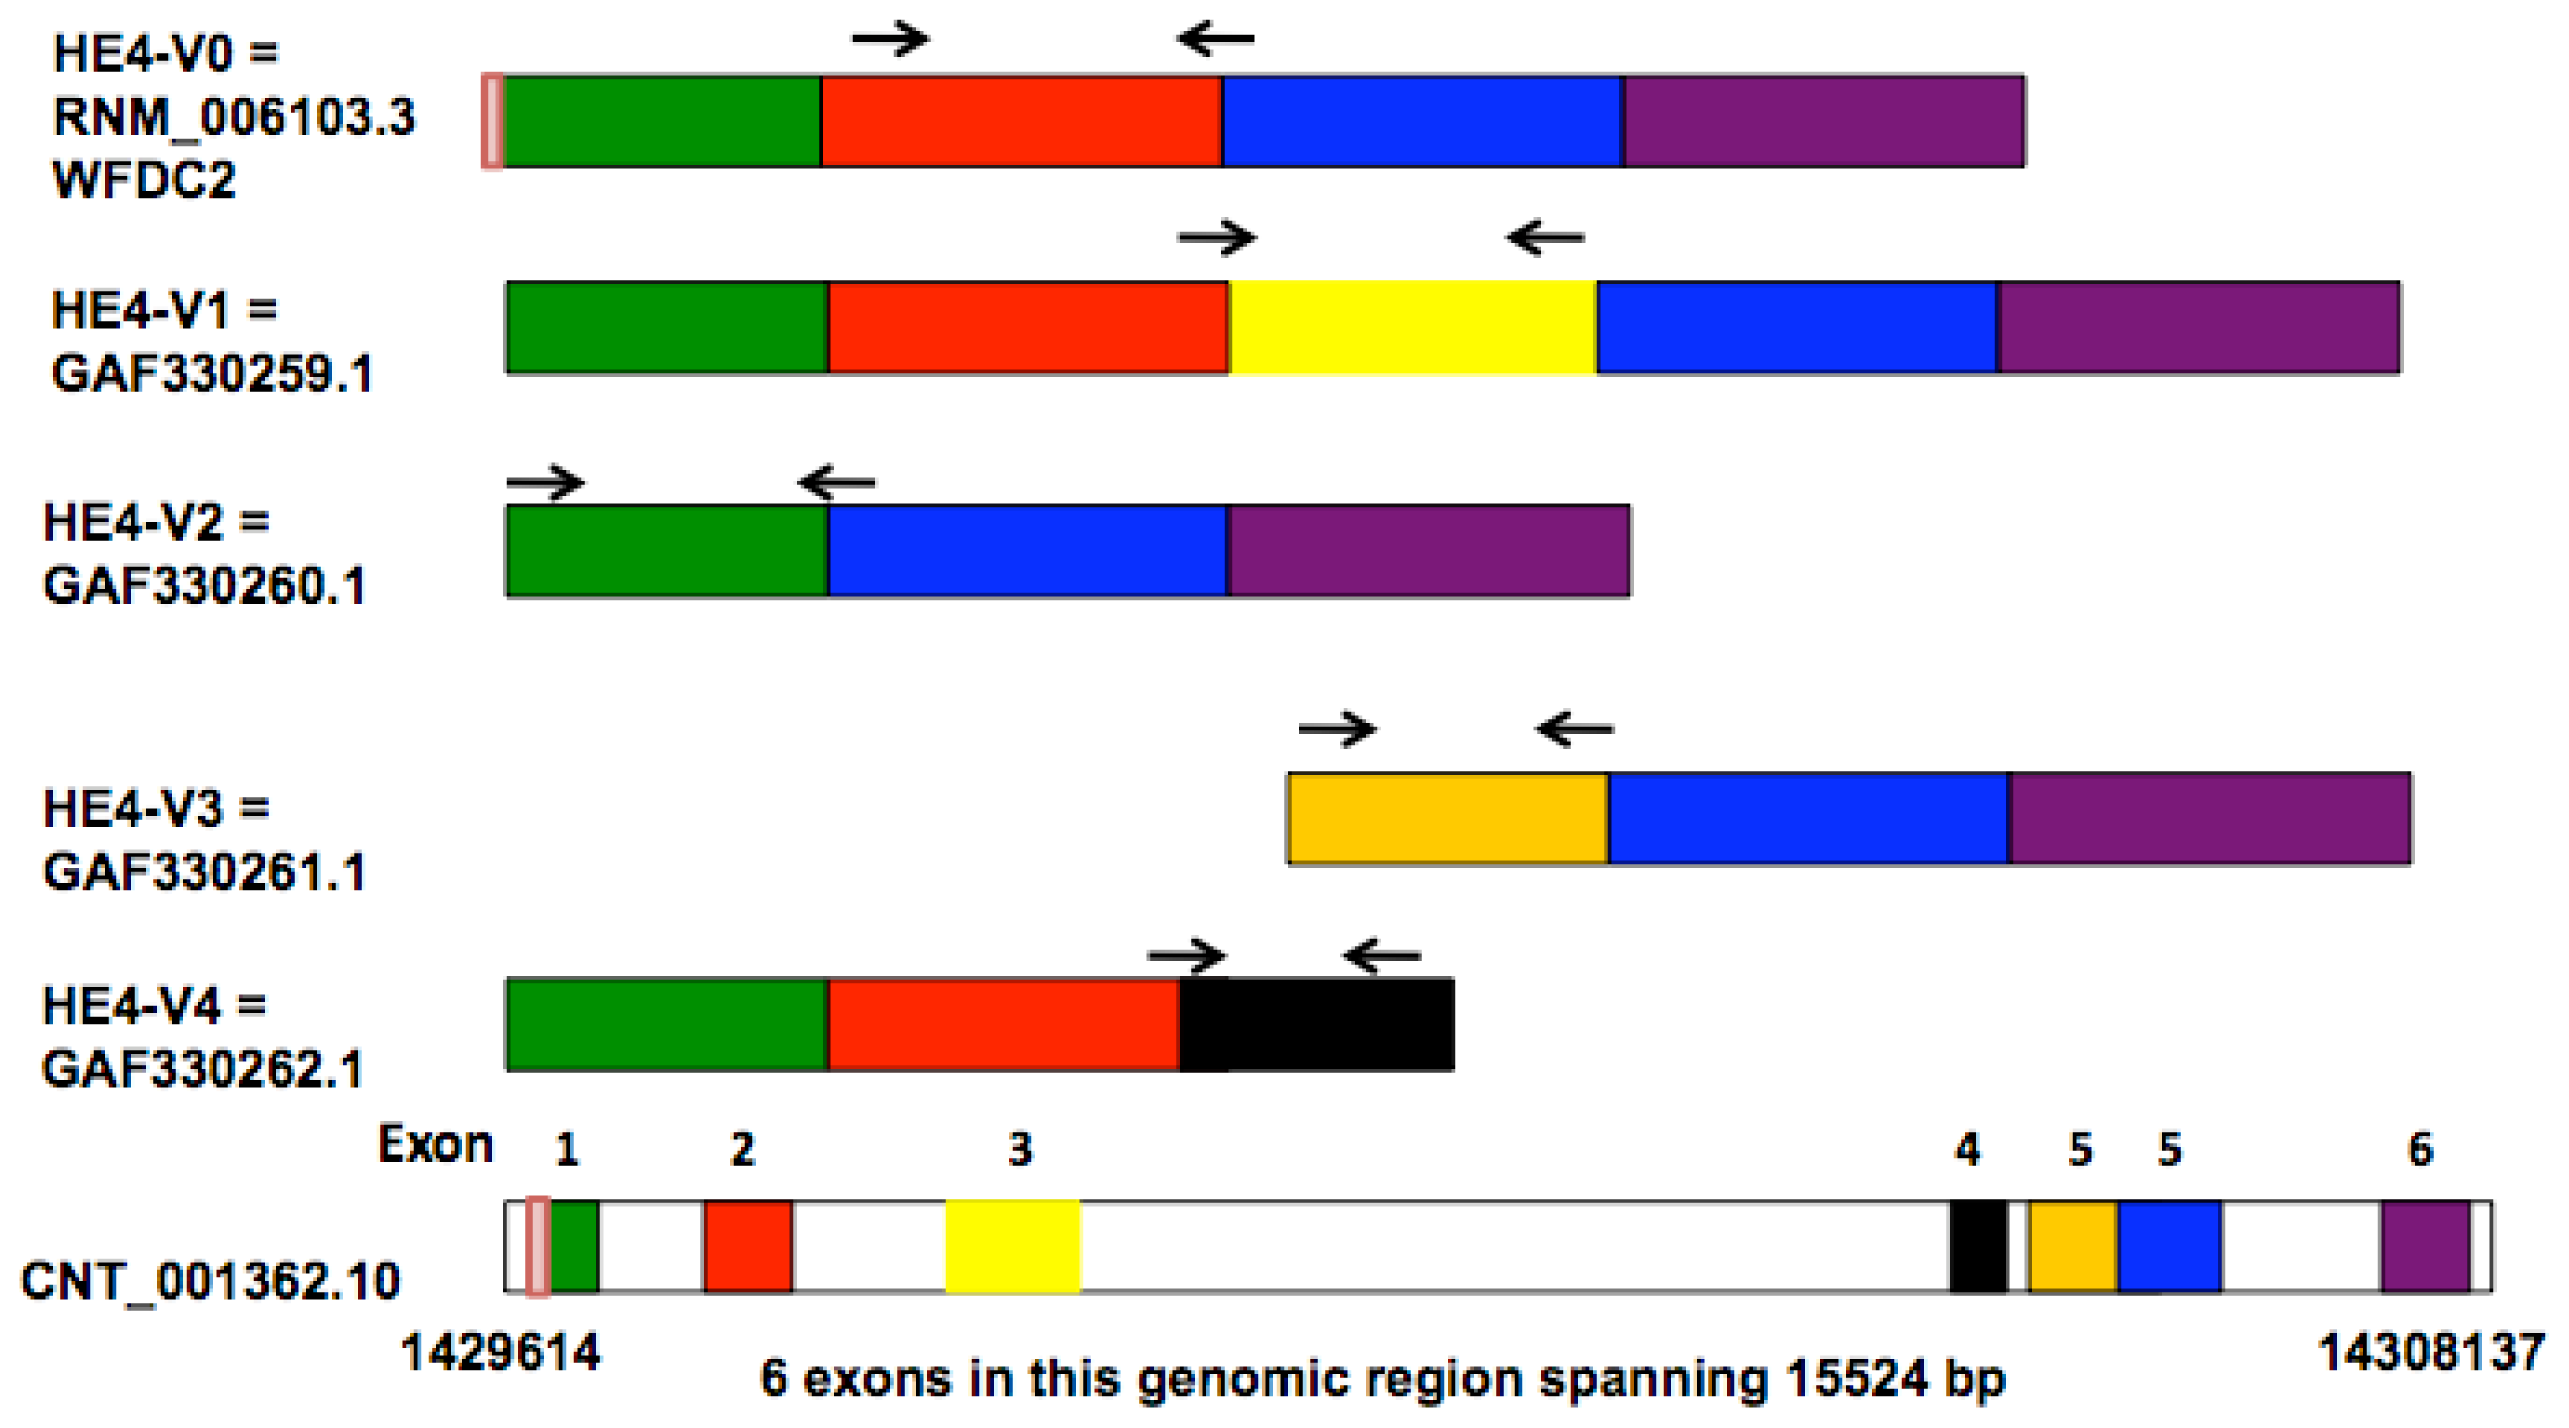
Bingle
et al. compared the sequences of two lung-derived
HE4 ESTs (expressed sequence tags) with those of the prototypic HE4 cDNA, leading to the identification of five distinct HE4 mRNA variants [
8]. Four of these variants (
HE4-V0, -V1, -V2, -V4) are generated by differential splicing mechanisms whereas one (
HE4-V3) utilizes an alternative promoter as suggested by the presence of an extended 5′ prime region. The disparate structures and domain arrangements among the
HE4 variants raised questions on their tissue-specific expression and potentially distinct cellular functions.
Being a small, secretory glycoprotein [
11], HE4 is readily detectable in plasma and the serum levels of HE4 are considered a potential biomarker for ovarian cancer diagnosis and management [
13–
16]. An antibody-based ELISA has been developed to measure HE4 serum levels in various clinical settings [
17–
19]. It has been reported that HE4 alone or in combination with CA125 has higher sensitivity than any other single marker or combination of markers, in early detection [
20–
22], diagnosis [
15,
23–
26], risk stratification [
27] and prediction of postsurgical outcome [
10,
20,
24,
28] for patients with OC. With regards to EC, Moore
et al. found that HE4 serum levels are consistently elevated in all stages of EC and that it is more sensitive in detecting early-stage disease than CA125 [
29]. Bignotti
et al. assessed the diagnostic and prognostic value of HE4 in EC. In their study, a significant correlation was found between increased HE4 serum levels and aggressive EC phenotype [
30]. Based on these findings, HE4 test has been proposed as a valuable tool for the triage of patients presenting with a pelvic mass [
31–
33]. It is noteworthy that, despite the data in favor of HE4 protein levels as a useful biomarker, negative results from several studies challenged the predictive value of the ROMA algorithm when HE4 was used alone or in combination with CA125 [
34,
35].
While most studies suggest that HE4 is a clinically useful biomarker in EC and OC, the assays used to measure mRNA or protein levels were designed based on the structure of the prototype HE4, designated as HE4-V0 in this report. In previous studies, no distinction was made among the multiple structurally and potentially functionally diverged HE4 variants. The goal of this study is to compare HE4 mRNA variants-specific expression in normal and malignant endometrial tissues, and to analyze the relationship between HE4 variant-specific mRNA levels and clinical features including age, surgical stage and survival.
3. Discussion
Utilization of alternative splicing or alternative promoters allows a single gene to encode multiple structurally and functionally related proteins. These processes have greatly increased the diversity of proteome, and may constitute an effective and economical mechanism for fine-tuned regulations of cell functions. Indeed, complex posttranscriptional regulatory mechanisms appear to be a common feature of the WAP domain genes.
Elafin and
SLPI genes, the two best-studied WAP domain family members, are both able to generate multiple splicing products [
38–
41]. Eppin, another recently identified WAP protein, is encoded by a single-copy gene as evidenced by the presence of single band on the Southern blotting of human genomic DNA [
42]. Computer-aided analysis of
Eppin sequence predicts the existence of three splice variants, all of which conform to the AG/GT splicing rule [
42].
HE4 gene generates five mRNA variants as a result of alternative splicing and utilization of alternative promoters [
8]. Amino acid sequence and domain analysis of the deduced peptides predicts that the
HE4 N-terminal and
C-terminal WAP domains are encoded by exon 2 and exon 5, respectively. Based on the arrangement of WAP domains, the five
HE4 transcript variants can be categorized into three groups: Group 1 (
HE4-V0 and -V1) contains both the
N-terminal and
C-terminal WAP domains; Group 2 (
HE4-V4) contains only the
N-terminal WAP domain; Group 3
(HE4-V2 and -V3) contains only the C-terminal WAP domain. In addition,
HE4-V0, -V1, and -V4 share the same secretory signal peptide and are therefore likely to be present in the plasma. For the rest of
HE4 variants, HE4-V2 signal peptide is homologous to that of HE4-V0 with the exception of a deletion in the last 10 amino acids, suggesting differential regulation of secretion; HE4-V3 does not contain a consensus signal sequence, raising questions regarding its cellular location and secretory potential [
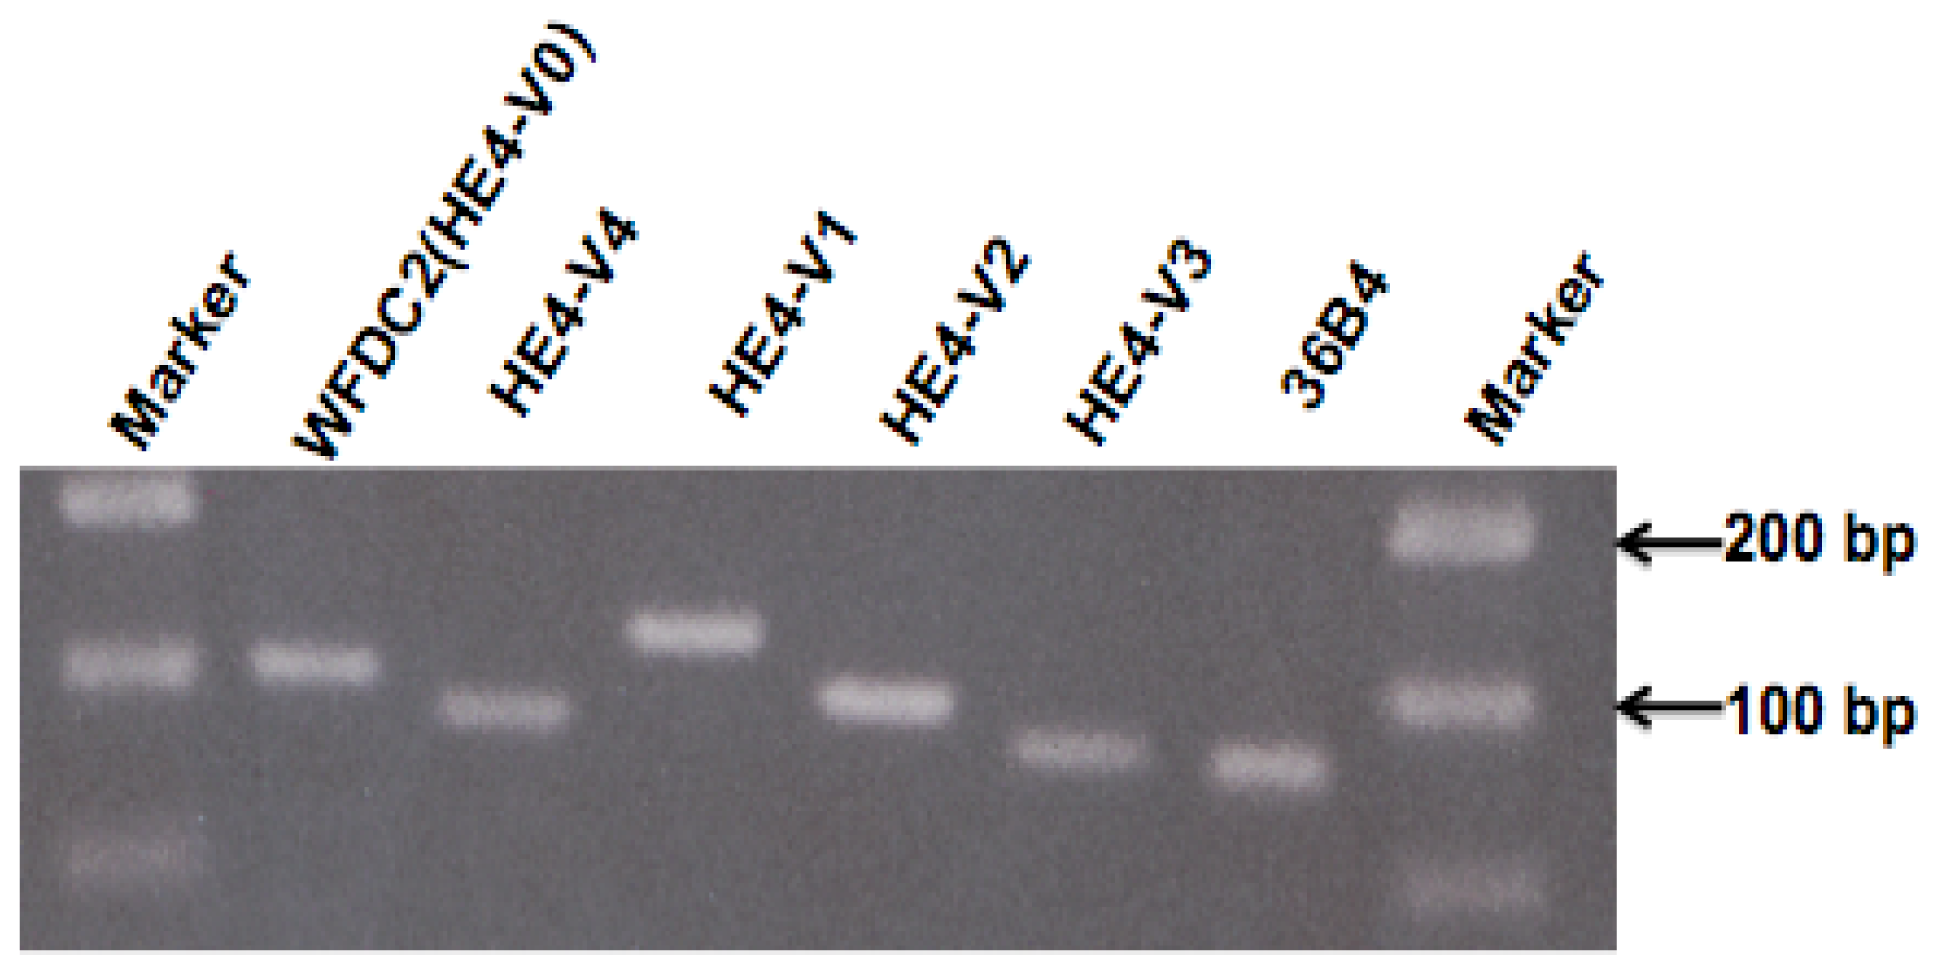
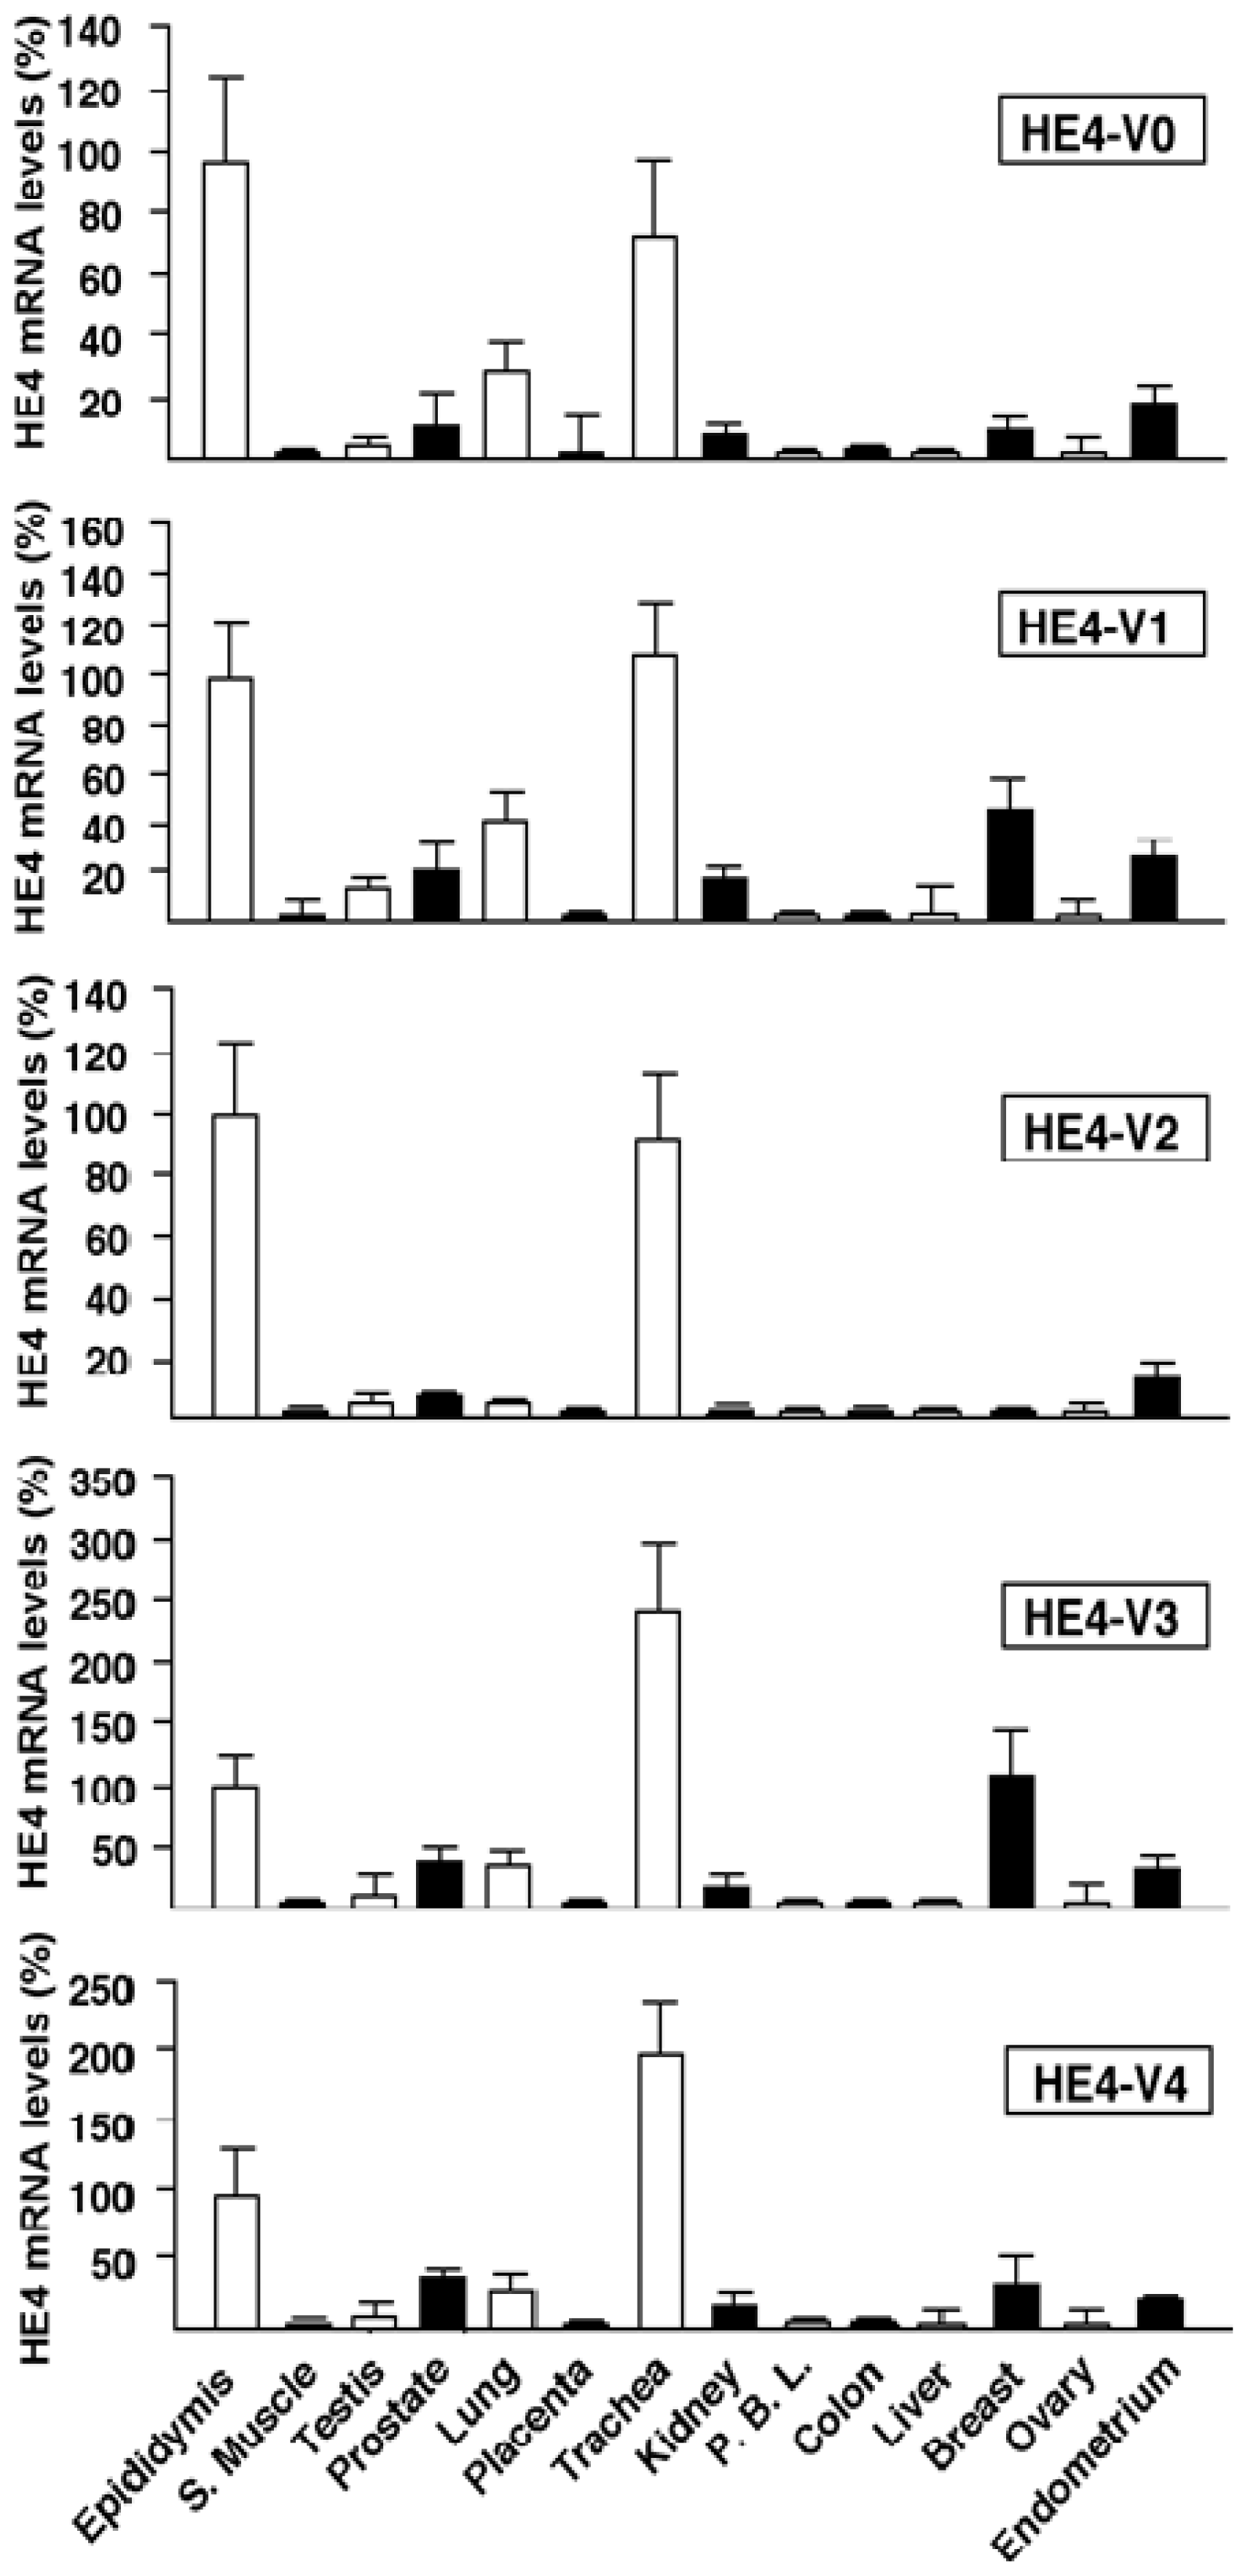
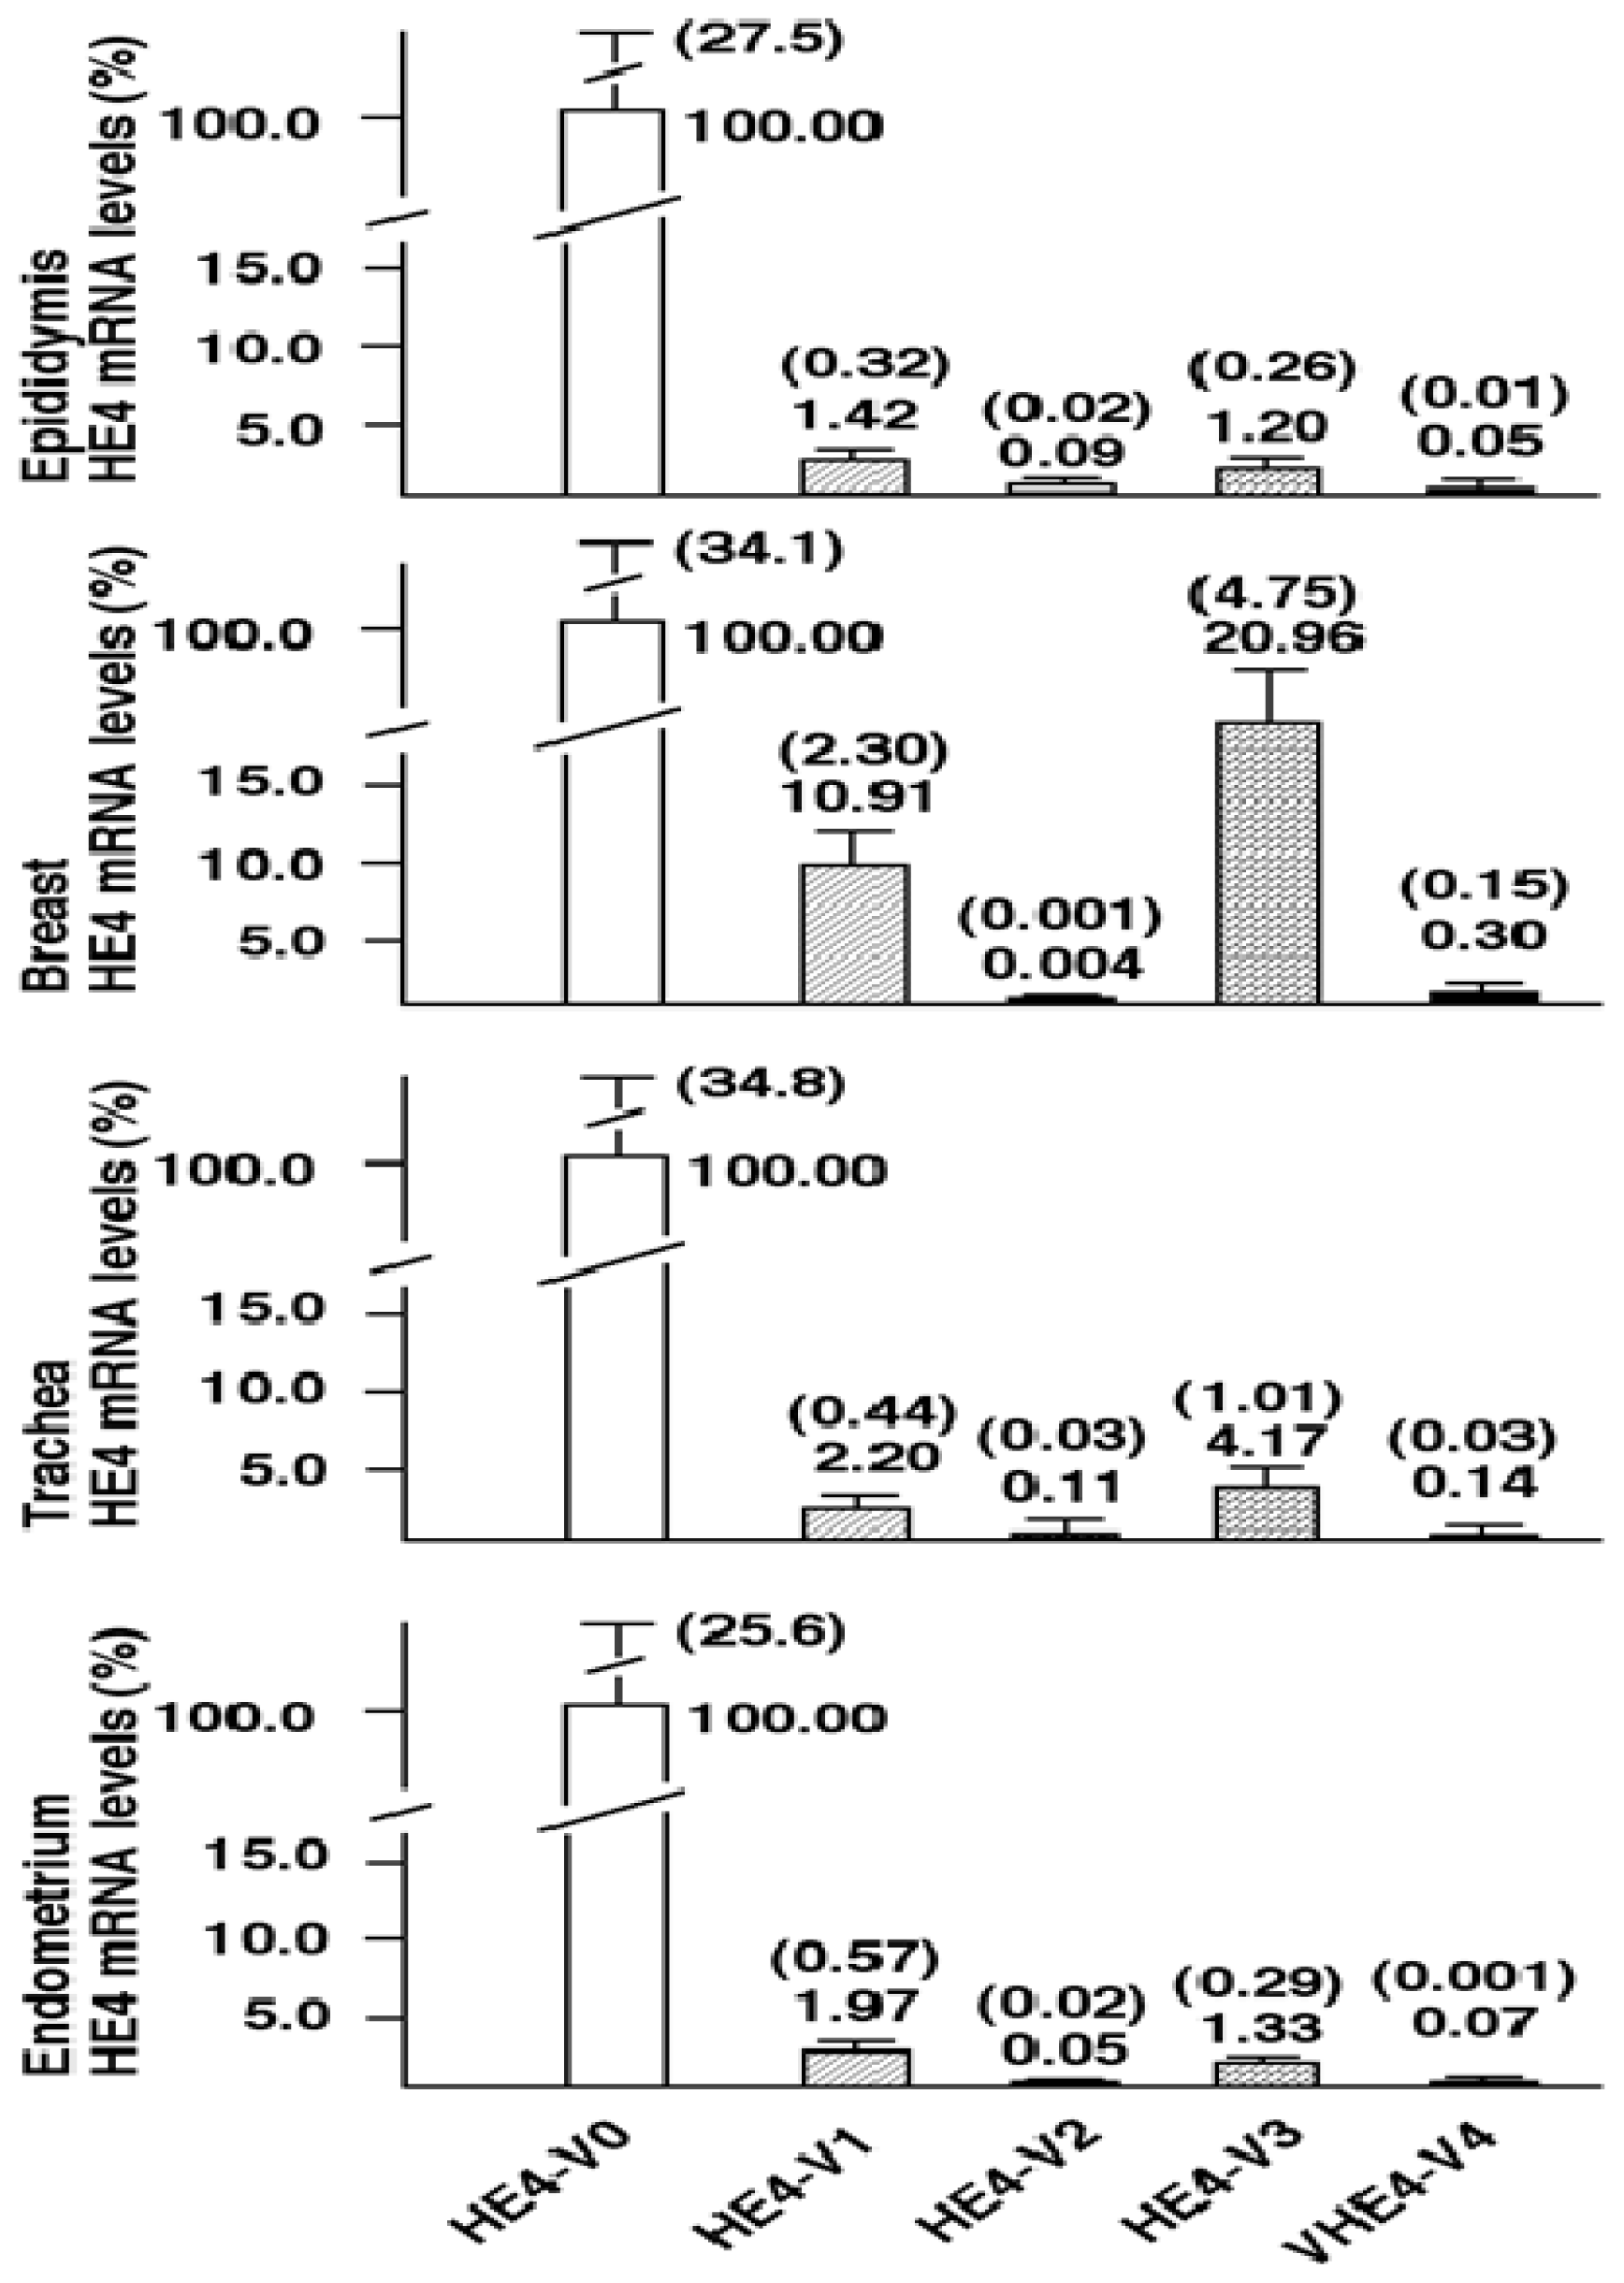
8]. In this study, we provide experimental data showing that these structurally unique
HE4 variants are concurrently expressed in various human tissues. Although all variants were readily detectable by real-time PCR, their expression levels differ dramatically, by as many as 10,000 fold. Taken together, these data suggest that the production of
HE4 variants, either through differential splicing or use of alternative promoters, are subject to tight and distinct regulation. Furthermore, the structural divergence, differential locations, e.g., secreted form verses intracellular form, and markedly different expression patterns suggest that they may be implicated in tissue-specific functions.
Although total HE4 expressions have been characterized in a variety of normal and cancerous tissues by many laboratories [
8,
11,
12],
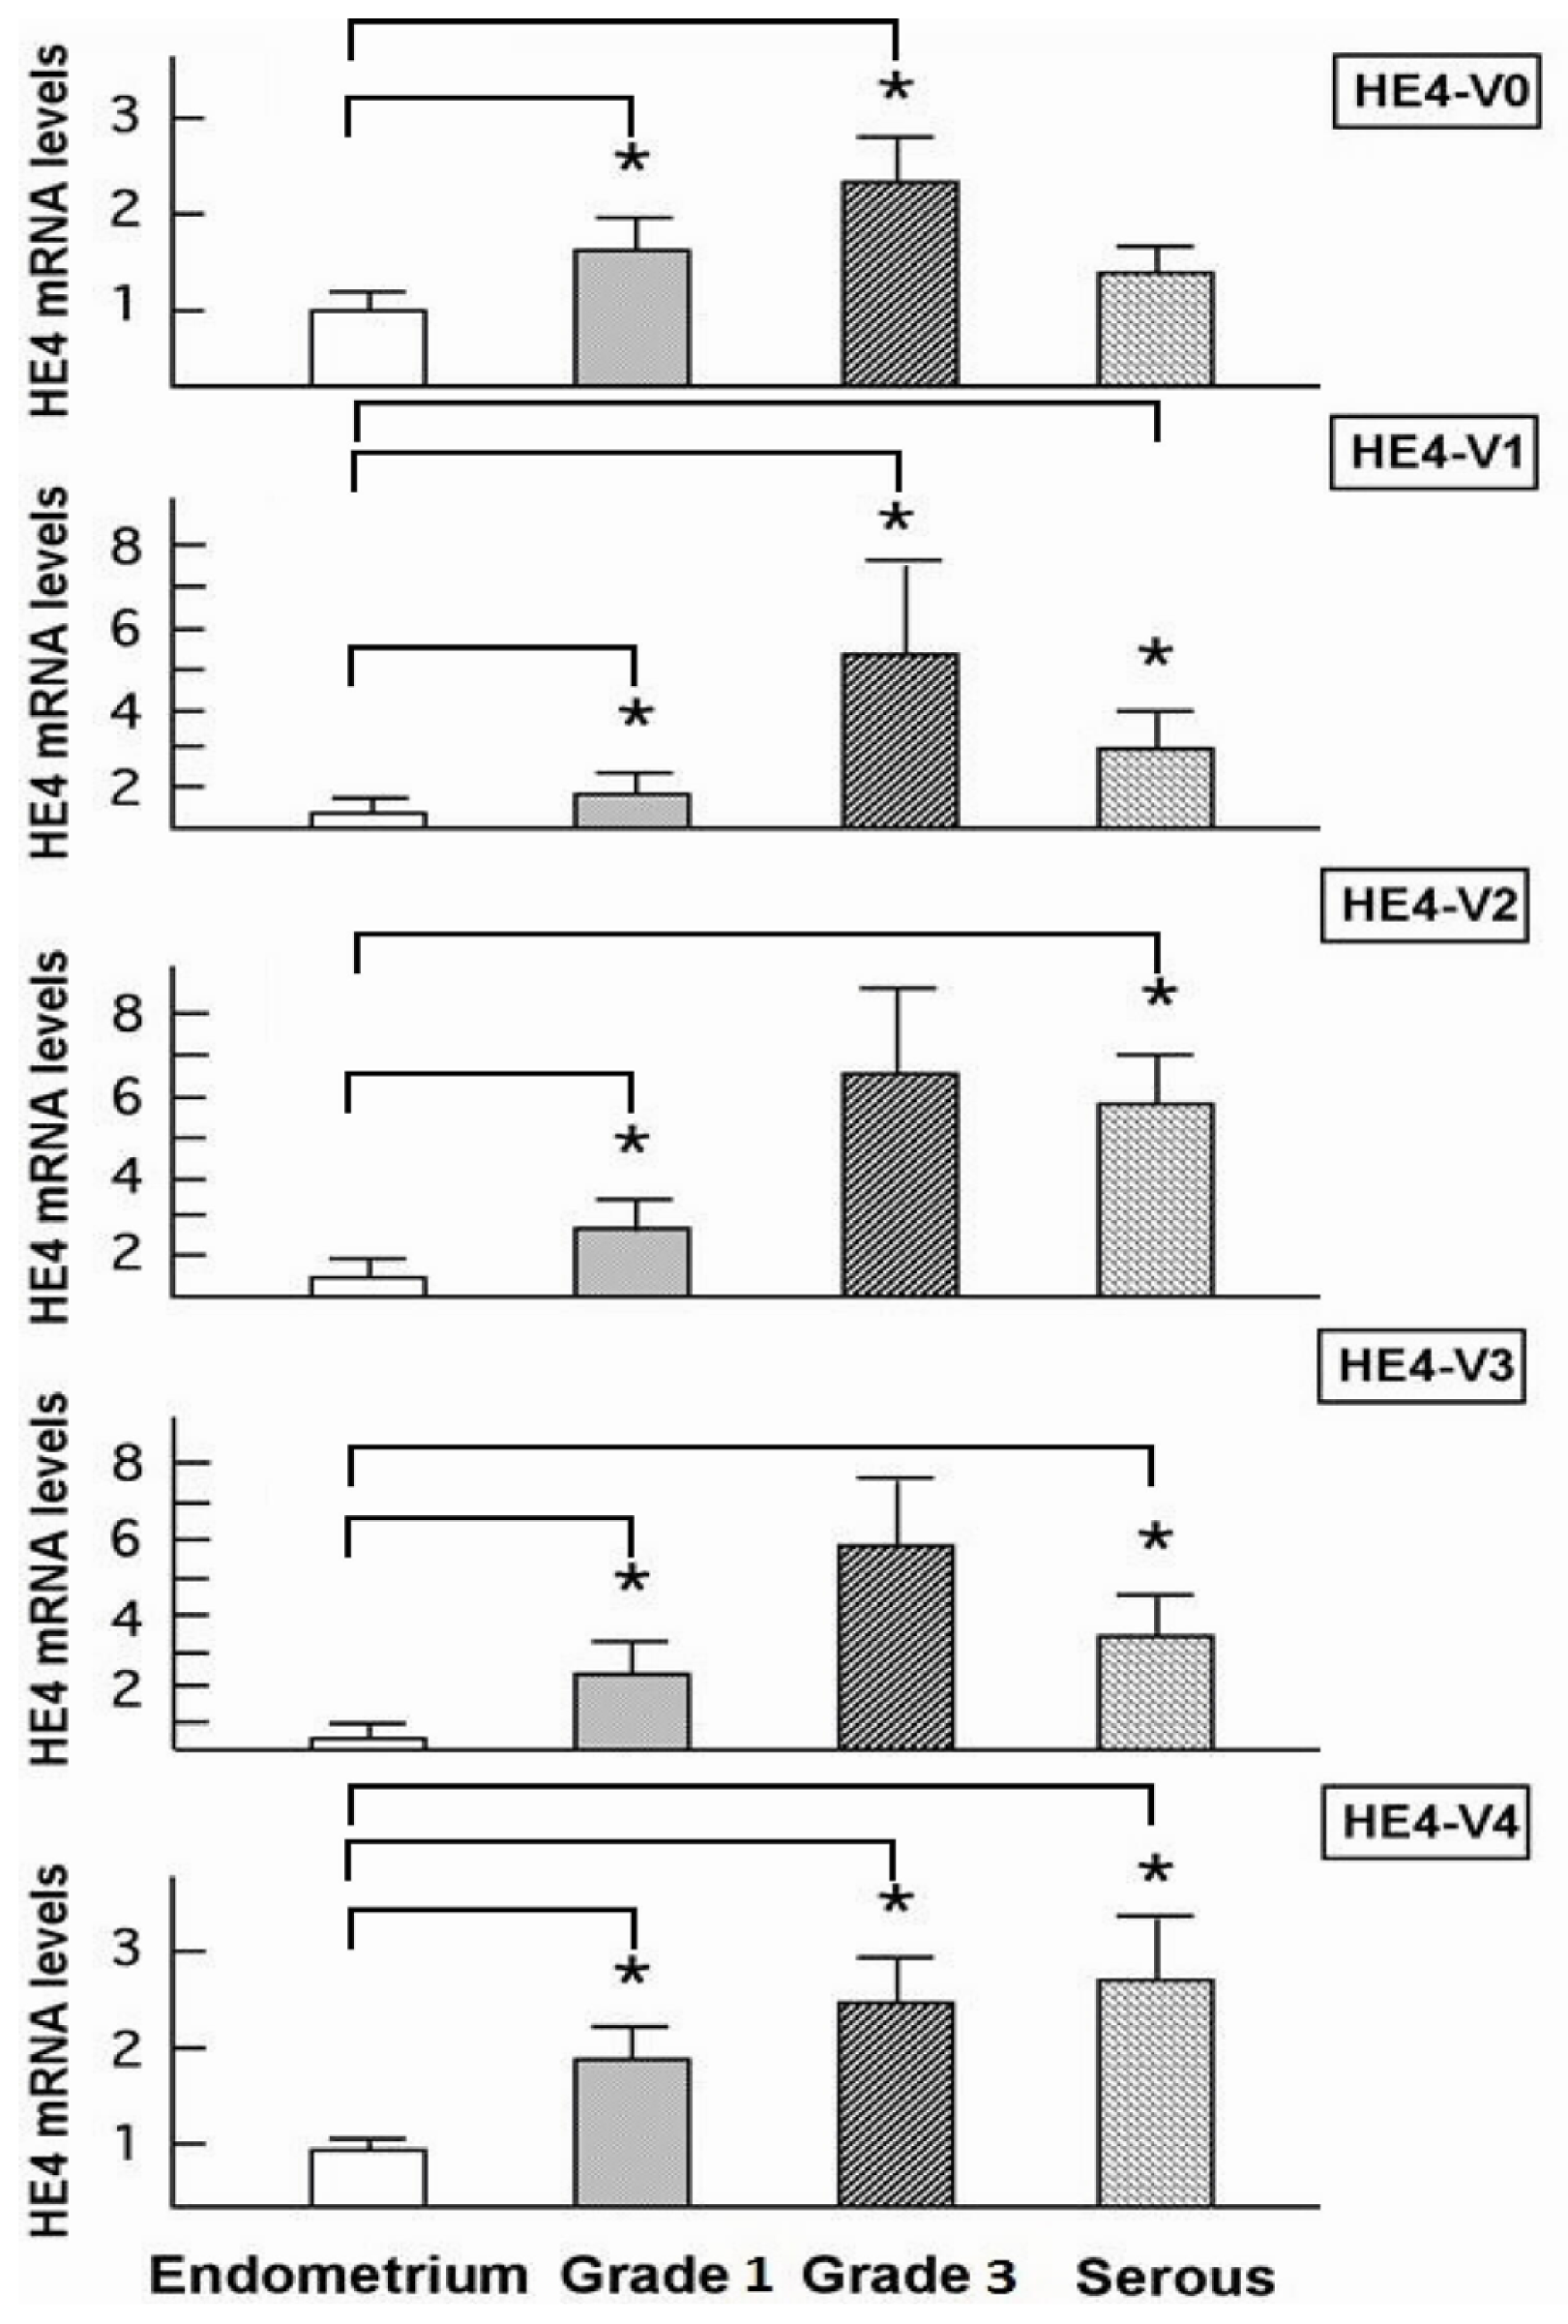
HE4 variant-specific expression patterns has not been comprehensively investigated. We showed that the expression patterns of the five
HE4 variants share certain similarity among normal tissues. On the contrary,
HE4 variant expression patterns diverge significantly between malignant and normal endometrial tissues. This observation in conjunction with the fact that these variants are significantly overexpressed in endometrial cancer cells points to a potential role(s) for HE4 in EC tumorigenesis or progression. In a parallel study, we have tested this hypothesis. We demonstrated that at least the prototype HE4-V0 exhibits a potent tumor-promoting activity both
in vitro and
in vivo [
43]. Given the fact that the deduced peptides from these mRNA variants contain a different number of WAP domains, and that the
N- and
C-terminal WAP domains share low homology, it is unlikely that these peptides carry out the same functions. Comparative variant-specific functional studies are required to delineate the roles of each variant in EC development.
In addition to its potential pathological role(s), HE4 levels may also reflect the status of EC progression from a clinical point of view. Yamashita
et al. performed immunohistochemistry on lung adenocarcinoma tissue samples to investigate the predictive value of HE4 for patient outcome and found that the five-year disease-free survival in the HE4-positive group (44.6%) was significantly lower than that in the HE4-negative group (82.3%,
p = 0.001). Moreover, HE4 expression and the nodal status were noted to be independent prognostic factors for disease-free and overall survival [
44]. Kamei
et al. examined the HE4 expression in breast cancer tissues and confirmed that HE4 protein level was associated with lymph node invasion. Furthermore, the five-year survival in the HE4-positive group (58.6%) was significantly worse than that in the HE4-negative group (85.6%,
p = 0.04) [
45]. Bignotti,
et al. found that high serum HE4 levels correlated with reduced survival in the poorly differentiated EC cohort [
30]. A study from our group recently indicated a correlation between the high serum HE4 levels and high surgical stage, increased myometrial invasion, and large primary tumor diameters in EC patients [
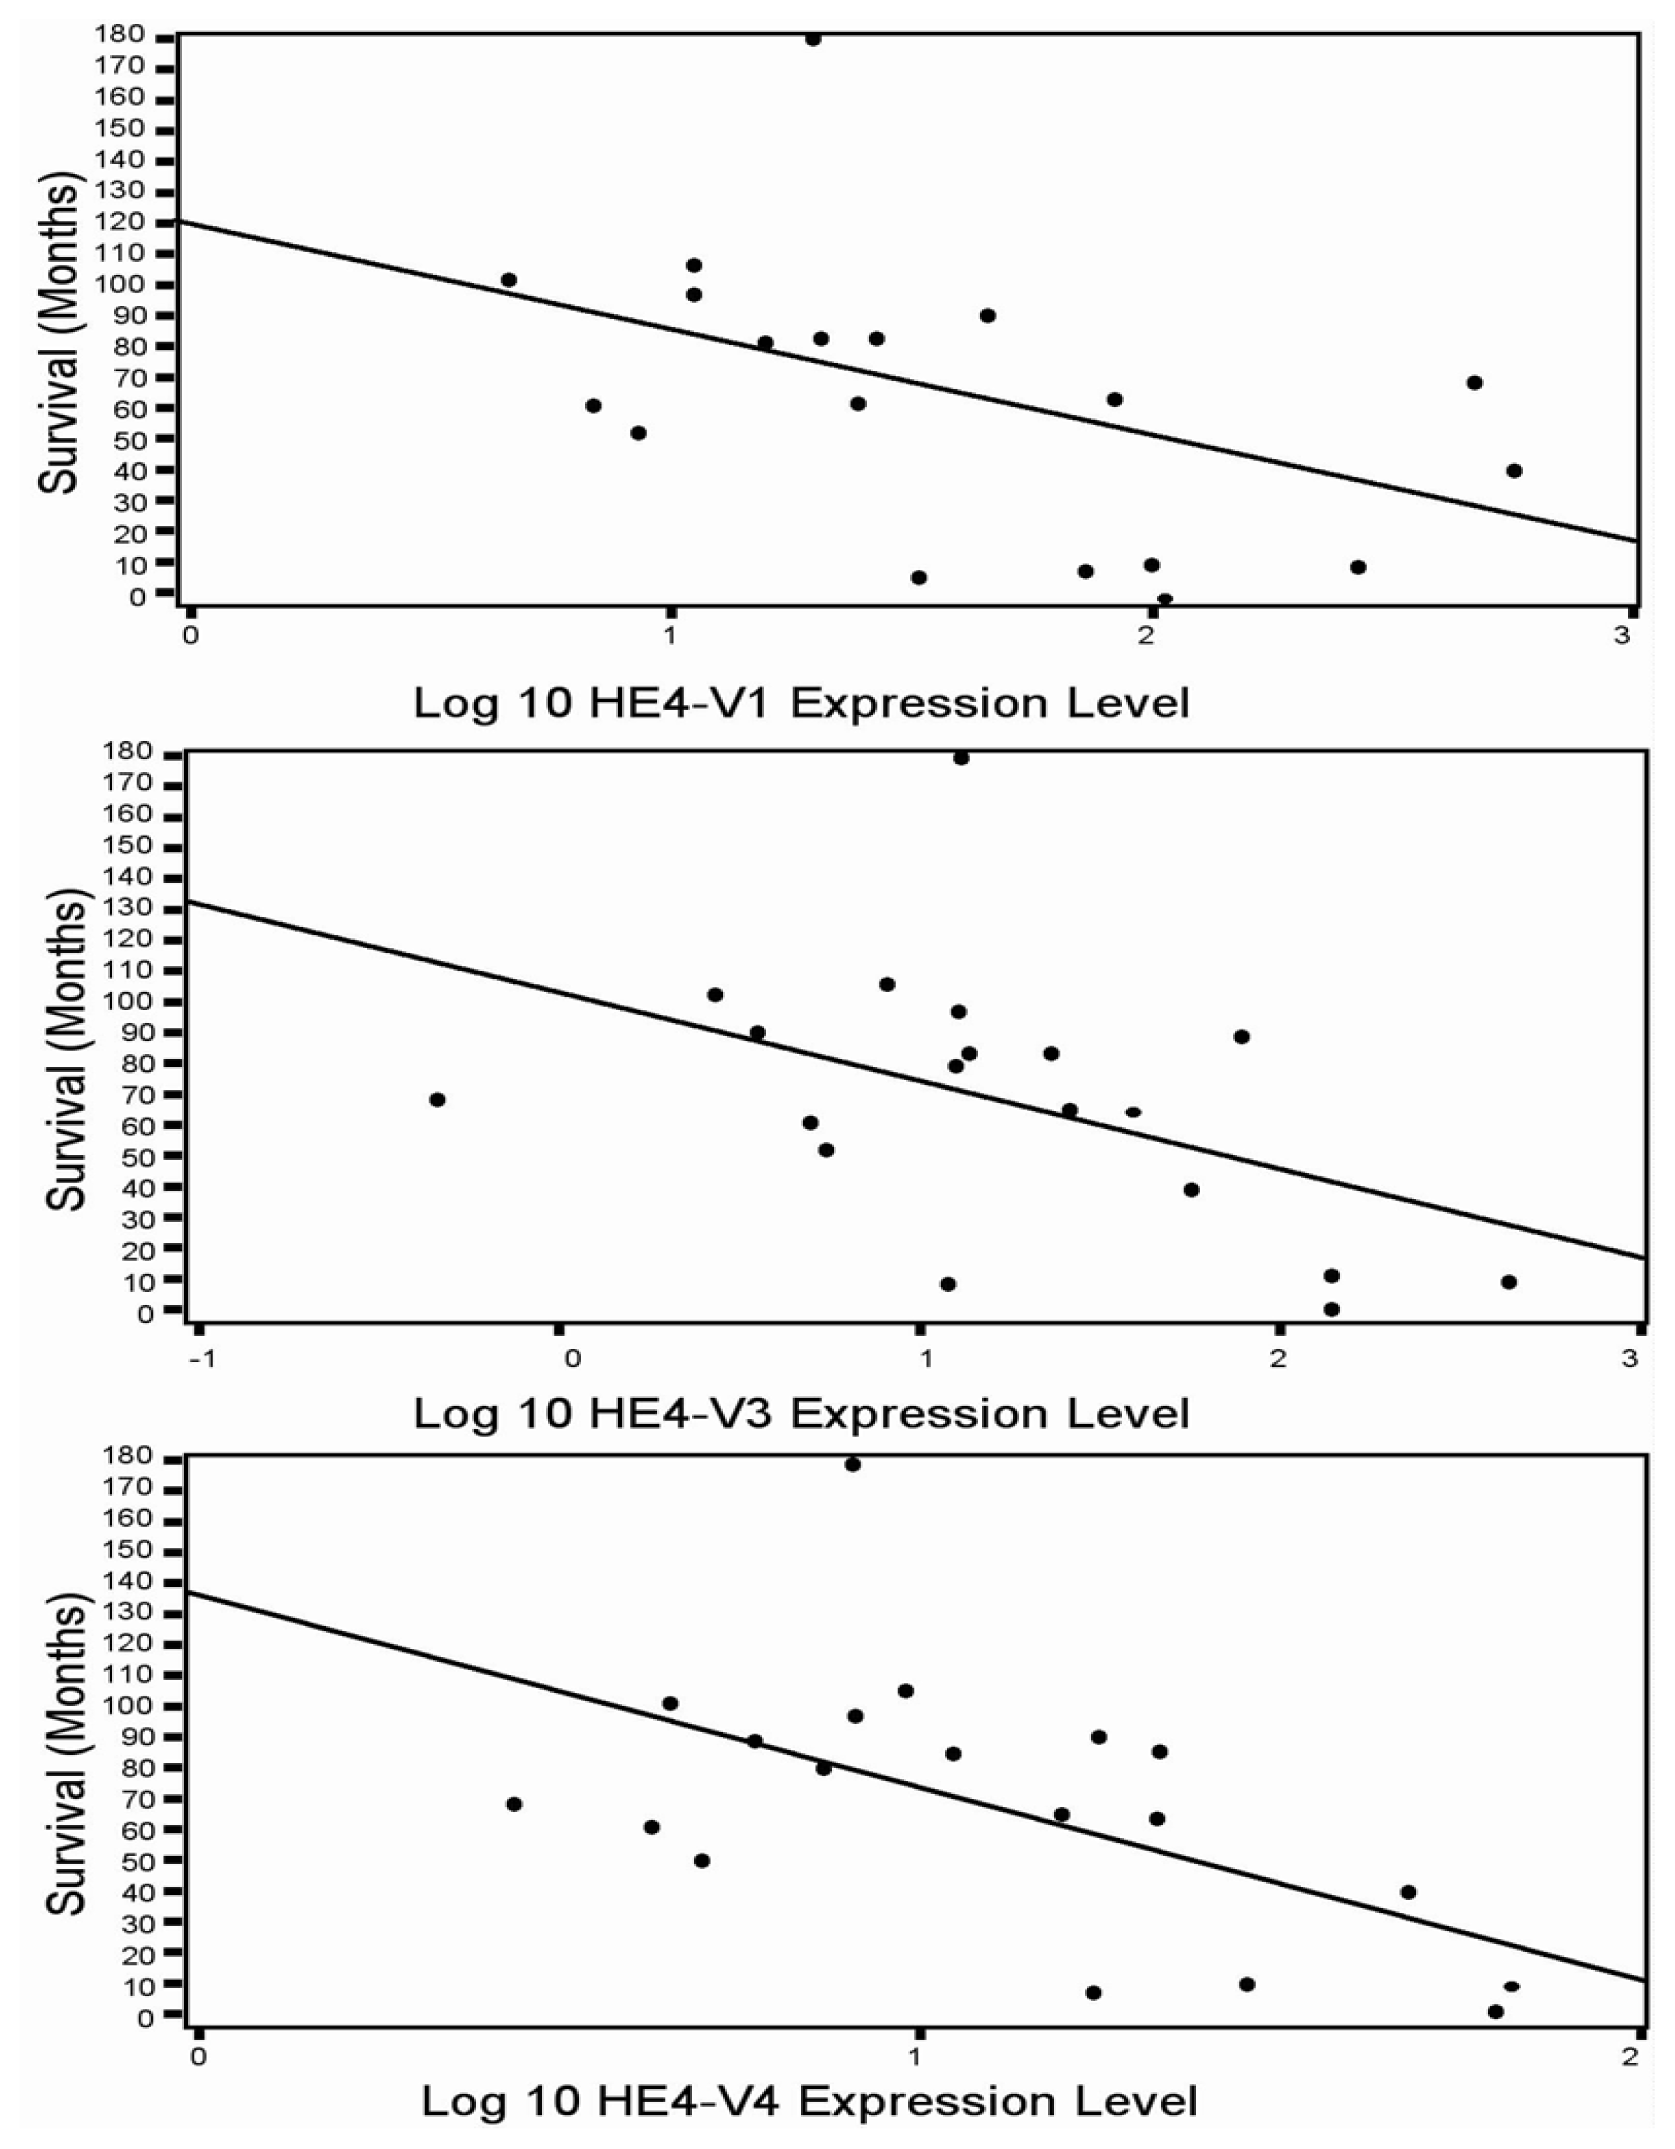
46]. In the current study although all five HE4 mRNA variants were significantly increased in malignant compared to normal endometrium, only the levels of three variants (
HE4-V1, -V3, and -V4) were found to be correlated with the patient survival data. This finding suggests that not all
HE4 variants are predictive of patient outcomes, which underscores the importance of a variant-specific approach in the measurement of
HE4 levels. It is noteworthy that the variants associated with survival (
HE4-V1, -V3, and -V4) are those expressed at the highest level in the trachea but not the ones (
HE4-V0 and -V2) expressed at the highest levels in the epididymis. Neither the interpretation nor the significance of this observation is clear at this time.
Despite the ambiguity regarding each variant’s distinct function, correlation between the expression of certain
HE4 variants and patient survival may prove important from a clinical perspective. Numerous studies have shown that mRNA detection in serum as well as in other body fluids may provide a promising approach to cancer assessment and management. Tumor cell mRNA in plasma may originate from necrosis or apoptosis of circulating cancer cells, or as the result of an active release mechanism in which mRNA transportation occurs through vesicle-like structures [
47,
48]. Based on the high expression levels of the HE4 mRNA variants in EC tissue samples, the same mRNA variants may be detectable in patients’ serum as well. Thus, the variant-specific approach may offer insights into EC detection, prognostication, and disease monitoring. The optimal technical parameters we outline here could serve as a foundation for future studies along this direction.
Because both ovary and endometrium develop from the Müllerian system [
49–
51], carcinomas arising from these sites tend to have similar etiological factors, gene expression profiles, and tumorigenic mechanisms. Consequently, defining the expression patterns of
HE4 variants in normal and malignant ovarian tissues may demonstrate similar findings. However, early detection of
HE4 variants is more convenient in EC compared to ovarian or other types of cancer given that tumor cells can be collected non-invasively in menses or vaginal secretions by the use of pap smear-like devices or tampons [
52]. RNA samples extracted from pap smear specimens have been successfully utilized for transcriptome profiling in the past [
53]. The currently available HE4 ELISA assay measures the total HE4 levels and does not distinguish the HE4 protein species produced by different HE4 mRNA variants. One could envision using either antibody-based ELISA or mRNA-based PCR assays to detect HE4 mRNA variants in these body fluids for the purpose of early EC detection.
Anastasi
et al. observed that serum HE4 levels vary substantially among the follicular, ovulatory and luteal phases in healthy young women, suggesting hormonal regulation of HE4 production in the ovary and other somatic tissues [
28]; recently, Levanon
et al. have also shown that normal fallopian tube secretes HE4, these data indicate the characteristic of the HE4 origin from the Mullerian epithelium [
54]. Malignant endometrial cells express varied levels of steroid hormone receptors due to differential epigenetic modification. This may have a significant effect on HE4 variant expression patterns and at the same time, cancers’ response to hormonal therapy. Since most of the patients included in our study were postmenopausal women, we could not assess the influence of menstrual cycle on HE4 expression. Interestingly,
HE4-V0, the most abundant
HE4 variant, was found to be correlated with age in the endometrioid cancer cohort. This result is consistent with another study showing that serum HE4 levels are closely correlated with age in EC patients [
46]. Given the fact that the relationship between HE4 mRNA levels and age is not evident in the normal control group, this age-related change of
HE4 levels may reflect tumor characteristics rather than varying hormonal status. This hypothesis is further supported by the data from our recent study in which HE4 serum levels positively correlated with high-risk tumor characteristics in EC [
46]. The association between
HE4/HE4 levels and age also suggest that the age-adjusted HE4 levels may be more accurate criteria for cancer diagnosis and prognostication. We should point out that this observation is in agreement with the data recently published by Bolstad
et al. [
55]. In that study, it was found that higher HE4 levels are associated with age and smoking status, as well as creatinine levels and BMI in healthy subjects, while the two later factors are also associated with age. These new findings are very important in the way that when
HE4 variants are applied as a biomarker for EC diagnosis, these factors need to be taken into account to rule out the possibility that the elevated
HE4 levels may be caused by the patients’ age, smoking status and BMI in addition to the tumor itself. As the higher creatinine levels and smoking status are associated with age, the relationship between HE4 levels and creatinine levels would be an interesting issue for future studies.
This study is to our knowledge the first one to demonstrate a tissue-specific distribution of HE4 variants and establish an HE4 variant-specific correlation with survival in EC. Furthermore, we suggest that a variant-specific approach may prove useful for improving the current use of HE4 assays in the diagnosis, triage and postsurgical surveillance for the patient with EC.
4. Experimental Section
4.1. Collection of Tissue Samples
Both normal and malignant endometrial tissue samples were collected randomly from patients treated at Mayo Clinic for a variety of gynecologic conditions. Central pathology review was conducted to verify institutional diagnoses and eliminate variability among experts. Samples obtained from patients undergoing hysterectomy for benign indications were used as normal endometrium controls. Endometrial tissue specimens were obtained from 14 patients with grade 1 EC, 14 patients with grade 3 endometrioid EC, and 15 patients with papillary serous EC, and 16 patients with normal endometrium. For the six pairs of tissues analyzed by mass spectrometry study, EC and normal samples were selected based on match criteria of age (±5 years), body weight (±10 kg) and menopausal status, which is a separate pool of the above described cohort. Clinical data on survival, BMI and age were retrieved and confirmed for most of the patients. All samples were snap frozen, stored at −80 °C. For total RNA extraction, tissues were cut into 10 μm-thick series sections; one section was used for H&E staining to define the tumor tissues (circled with marker) vs. myometrium. 10 series sections were matched with H&E stained one, only tumor tissues were macro-dissected to ensure that at least 50% of the samples were tumor tissue. These studies were approved by the Institutional Review Board of Mayo Foundation (IRB# 07-004290). In accordance with the Helsinki Declaration and Minnesota Statute for Use of Medical Information in Research, only patients who consented to the use of their medical records were included in the study.
4.2. Tissue Preparation and ICAT Labeling Procedure
Specimens were mixed with 0.5 ml of lysis buffer (0.5 mM pH 8.3 Tris plus 0.1% SDS), and a glass grinder was used to homogenize the tissues. After separating the supernatant from the tissue debris by centrifugation at 13523 RCF (or 12,000 rpm), the supernatant was used for Isotope-Coded Affinity Tag (ICAT) labeling for a high throughput comparison of normal and malignant endometrial tissues. Protein concentrations were measured using the Bio-Rad Protein Assay Kit (Bio-Rad, Hercule, CA, USA). 100 μg of protein was labeled with Cleavable ICAT (cICAT) purchased from Applied Biosystems (Applied Biosystems, Foster City, CA, USA). We labeled the control samples with light isotopes (containing 8 hydrogens, D0) and the EC samples with heavy isotopes (containing 8 deuteriums, D8). Briefly, protein extracts were mixed with 2 μL of reducing agent. After boiling for 10 min, the labeling reaction was carried out overnight at 37 °C. Each labeled EC sample was combined with its labeled control sample and the mixture was incubated overnight at 37 °C in digestion buffer solution containing 2 μL of CaCl2 and 1 vial of trypsin as provided in the kit. Following digestion, the peptide mixture was subject to cation ion exchange purification and affinity purification using an Avidin column to collect peptides containing ICAT-labeled cysteine. 100 μL of cleavage reagent was added and the mixture was kept at 37 °C for 2 h to cleave the biotin portion. Cleavage mixture was dried under vacuum and stored at −80 °C until mass spectrometric analysis.
4.3. Multidimensional Liquid Chromatography Coupled to Tandem Mass Spectrometry (LC/MS/MS)
The cleaved samples were separated into 8 fractions on a cation exchange column (Biox SCX 300 mm × 5 cm, Dionex, Sunnyvale, CA, USA) using an off-line Agilent 1100 series capillary liquid chromatography system (Wilmington, DE, USA). The API QSTAR Pulsar I, a hybrid quadrupole time-of-flight mass spectrometer (Applied Biosystems, Foster City, CA, USA) was used to perform the LC/MS/MS analysis of the peptides from each fraction with the help of the Analyst QS 1.0 software (Applied Biosystems, Foster City, CA, USA). The QSTAR was configured with the Protana Nanospray Source (Proxeon, Denmark), and coupled to an Ultimate Nano liquid chromatography system (Dionex, Sunnyvale, CA, USA) equipped with a Zorbax C18 100 mm × 150 mm microbore column (Agilents, Wilmington, DE, USA). Mass spectrometry analysis consists of a one-second survey scan from 400 to 1600 mass-to-charge ratio (m/z) followed by two-second MS/MS fragmentation ion scan with a threshold of 10 counts per second. Once the three most intense ions were fragmented in each survey scan, they were excluded from repeated fragmentation for 60 s. The collision energy applied varied automatically depending on the precursor m/z and charge state. The peptide mass tolerance was set at 0.2 Da.
4.4. Data Analysis of LC/ICAT
Acquired data were searched against the CDS FASTA database and quantified using ProICAT 1.0 SP3 software (Applied Biosystems, Foster City, CA, USA). Relative quantification of proteins was performed on the TOF (time of flight) MS scan by calculating the ratio between the areas representing the light- and heavy-labeled peptide peaks. Two different search engines were used for protein identification, the ProICAT and the Mascot (Matrix Science, Boston, MA, USA) from the human non-redundant database. Only the proteins with a confidence level of 90% were used for further identification and quantification. The protein function annotation was supplemented using an online bioinformatics program, the Bioinformatics Harvester [
56]. All proteins identified (
Table 1) were individually verified by manually inspecting its precursor on chromatogram and mass spectrum. The protein accession numbers (GI number) are from NCBI protein database.
4.5. RNA Isolation, cDNA Synthesis, and Quantitative PCR
Total RNA of endometrial tissues was isolated from 20 μm-thick sections of frozen tissue using TRIzol
® reagent (Invitrogen, Carlsbad, CA, USA) followed the protocol described previously [
57]. All the RNA samples were treated with DNase (RNase-Free DNase Set, cat No. 79254, Qiagen, Valencia, CA, USA) before reverse transcription. The purity of RNA has been determined by OD260/280 ratio. The quality of RNA and cDNA was ensured by the results of pilot PCR in which clear specific DNA band of the target gene was observed in agarose gel electrophoresis. Poly-A RNA from human epididymis, skeletal muscle (s. muscle), testis, prostate, lung, placenta, trachea, kidney, peripheral blood lymphocyte (PBL), colon, liver, breast, and ovary were purchased from Clontech Laboratories (Clontech Laboratories, Inc., Mountain View, CA, USA). cDNA was synthesized from 1 μg of total RNA using the SuperScript™ kit (Invitrogen, Carlsbad, CA, USA). 20 μL of reverse transcription product was diluted to 100 μL and 2 μL used for each real-time PCR reaction. The cDNA sequences for human
HE4 transcript variants (
HE4-V0 to -V4) and human
36B4 (internal control) and
GAPDH (internal control) were obtained from the PubMed gene bank and primers were designed by using primer 3 software [
58]. All the primers were synthesized from IDT (Integrated DNA Technology).
36B4 is a ribosomal RNA and ubiquitously expressed in all the cells. Owing to its housekeeping function, and the fact that CT value of
36B4 is lower than the CT value of
GAPDH, and
36B4 has lower variance,
36B4 was used as a control experiment for real-time PCR. We have also used
36B4 as housekeeping gene in previously works [
59–
61]. Negative control has been performed on the same 96-well PCR plate to test the PCR specificity. Real-time PCR was performed following previously described protocols [
57,
61] in a 25 μL reaction containing 2 μL of cDNA, 12.5 μL of SYBR
® Green PCR Master Mix (Stratagene, Cedar Creek, TX, USA) and 50 nM of forward and reverse primers, respectively. The ABI 7900HT Fast Real-time PCR
® System (Applied Biosystems, Foster City, CA, USA) was used with the following regimen of thermal cycling: Stage 1: 1 cycle, 2 min at 50 °C; Stage 2: 1 cycle, 5 min at 95 °C; Stage 3: 40 cycles, 15 s at 95 °C, 1 min at 60 °C.
Relative mRNA concentrations were calculated as the following: The threshold cycle number (CT) at which PCR products reached a preset threshold value, which was defined as the value where all products were undergoing exponential amplification, was determined by the florescence detector. Real-time PCR for the housekeeping gene 36B4 was performed in the same plates as for HE4 experiments. The HE4 real-time PCR results were standardized by those of 36B4 using the formula ΔCT = CTHE4 − CT36B4 (CTHE4 and CT36B4, threshold values for HE4 and 36B4, respectively). Relative HE4 mRNA levels were expressed as fold over 36B4 mRNA levels (F = 2ΔCT). The experiments were repeated at least twice and the CT for each sample was determined in duplicate or triplicate. For practical reasons, relatively HE4 mRNA levels were arbitrarily amplified by a factor of 100 or 10,000 as indicated in figure legends. All the real-time PCR data were normalized with housekeeping gene.
4.6. Statistical Analysis
Mean values among different groups were compared (grade 1 or grade 3 endometrioid EC or papillary serous EC versus normal endometrium) using a post-hoc Bonferroni t test with the assumption that HE4 mRNA levels exhibited bimodal distribution and that the variances of the two samples were equal. Pearson’s correlation coefficient test was used to examine the relationship between the expression patterns of the five HE4 variants among normal tissues as well as normal and malignant endometrium. Pearson’s correlation coefficient test was also applied to study the relationship between HE4 mRNA levels and patient characteristics including age, surgical stage, and disease free survival. To avoid overly influential observations, our data were log-transformed before statistical analysis. Correlations with a p value smaller than 0.05 and a coefficient close to 1.0 were considered statistically significant.


