Identification and Validation of a New Set of Five Genes for Prediction of Risk in Early Breast Cancer

Abstract
:1. Introduction
2. Results and Discussion
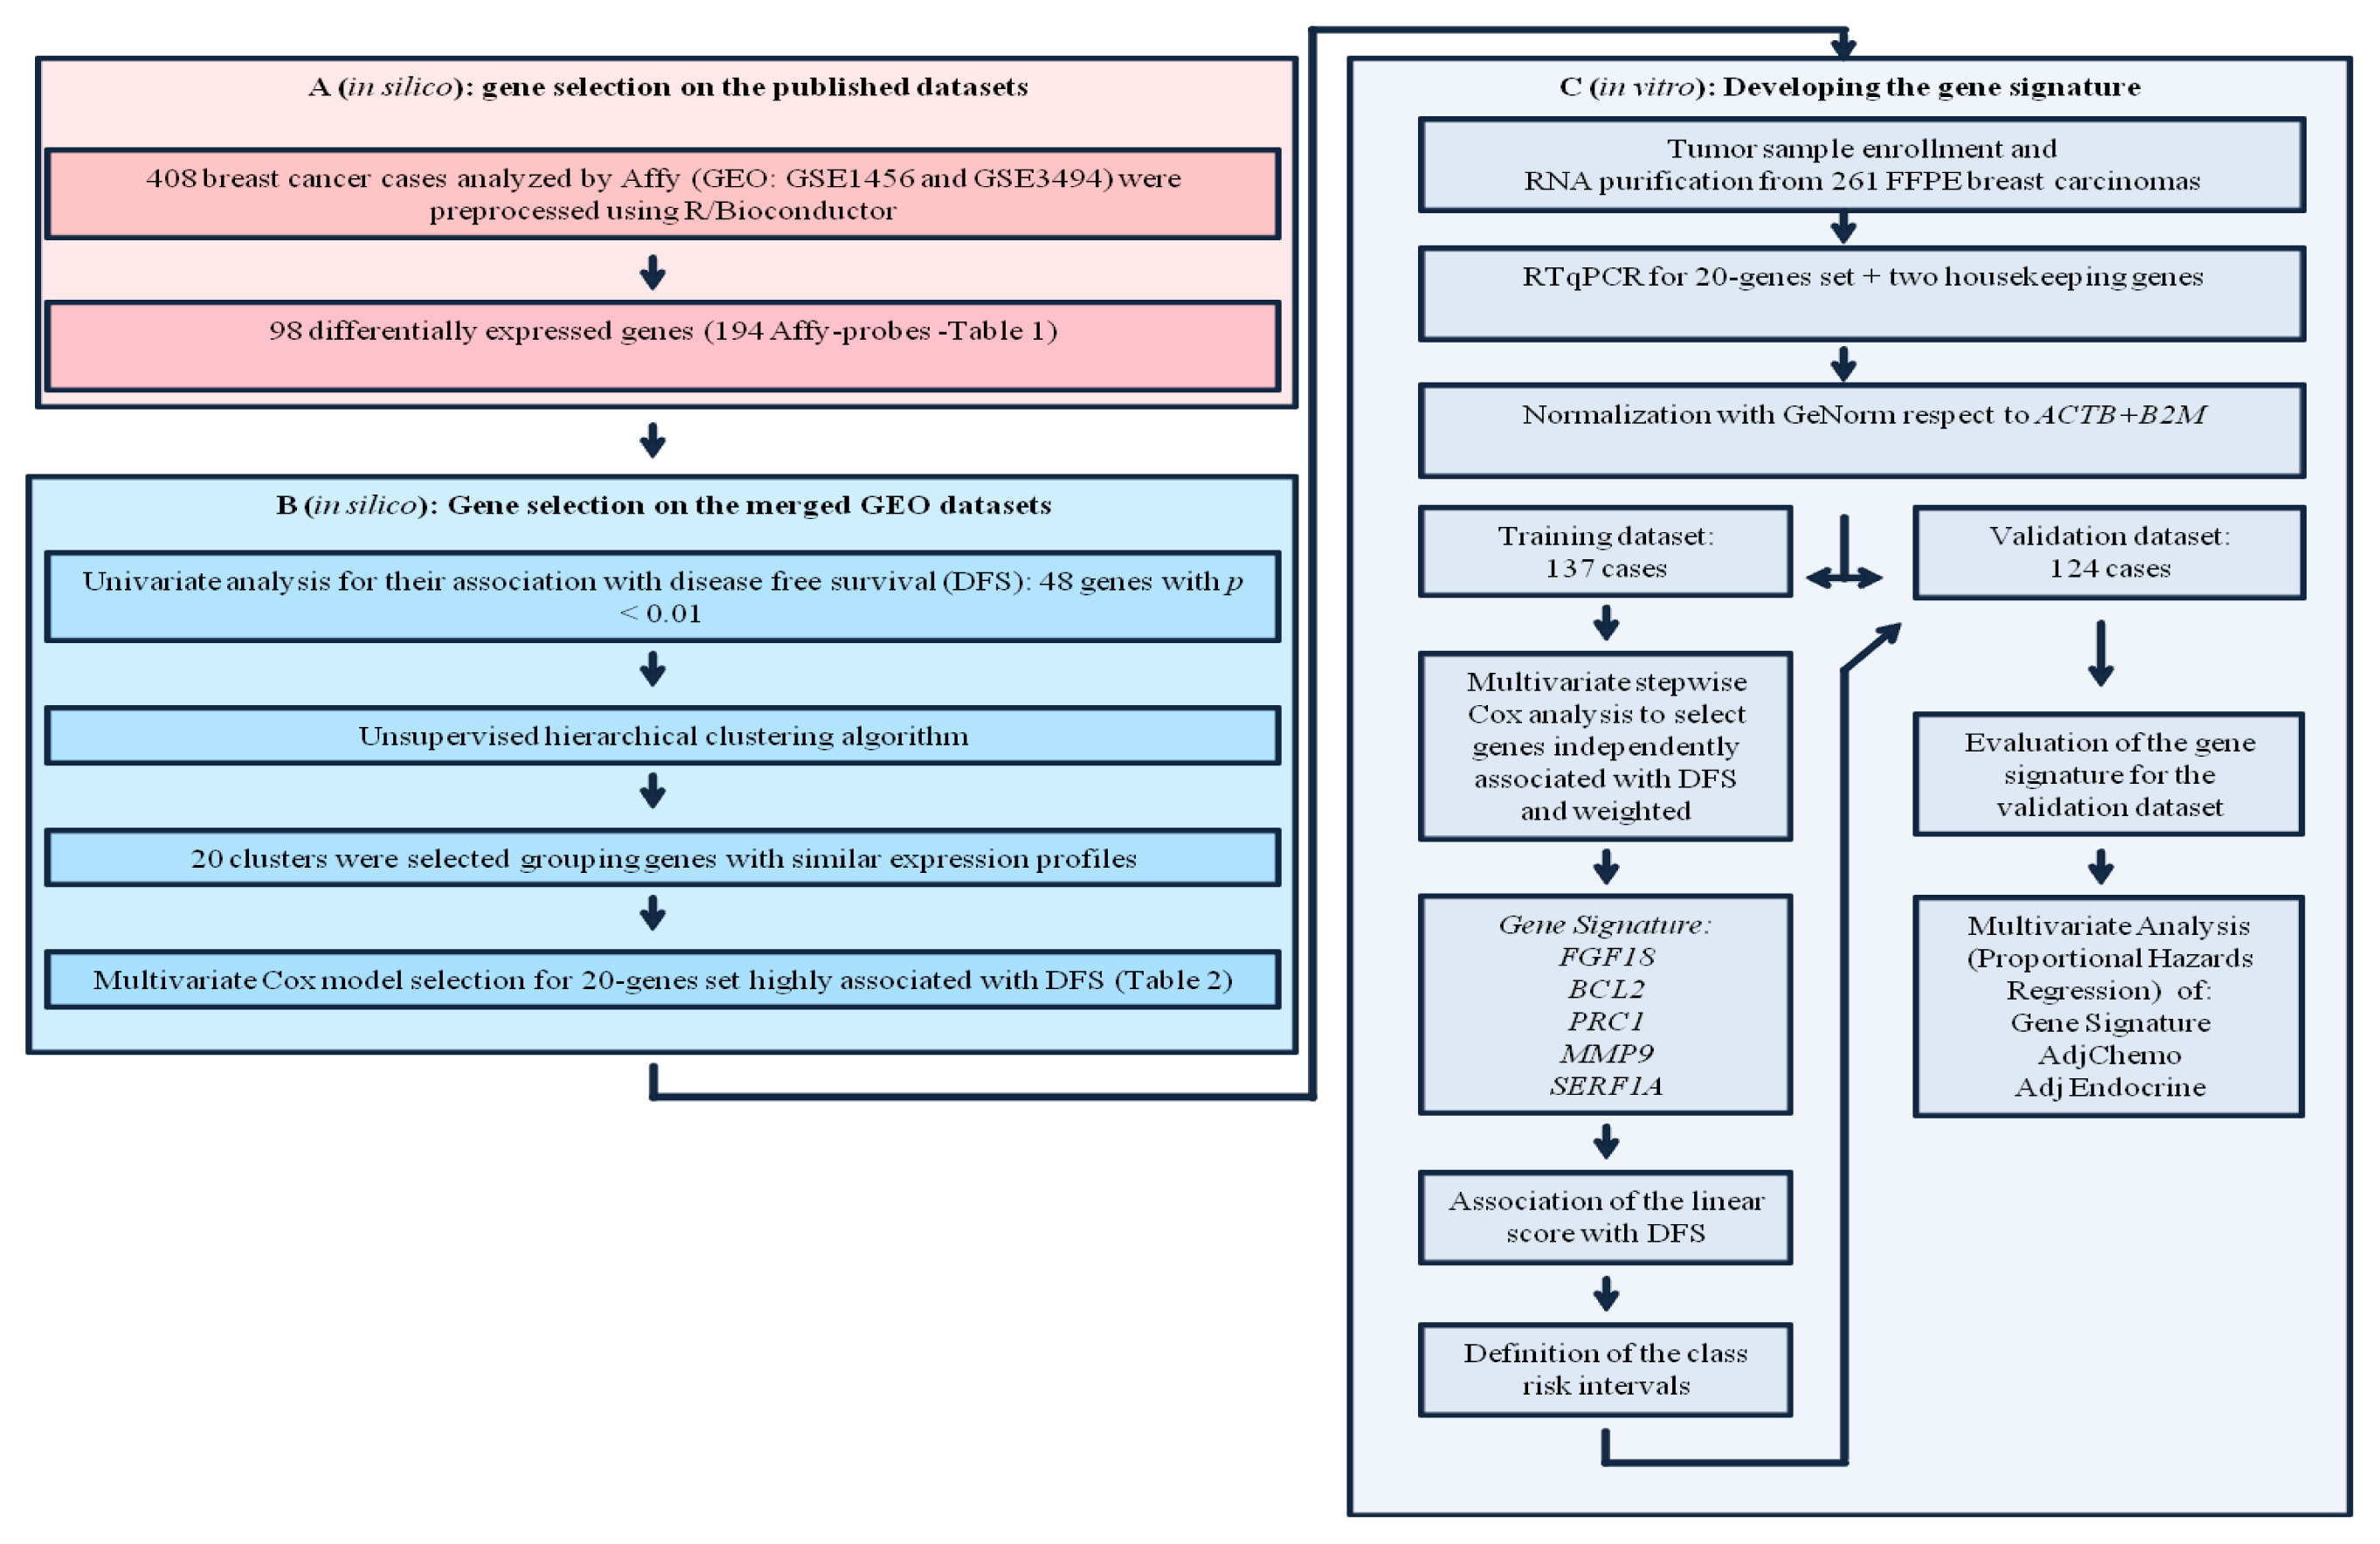
2.1. Gene Selection on the Published Datasets
2.2. Gene Selection on the Merged GEO Datasets
2.3. Tumor Samples
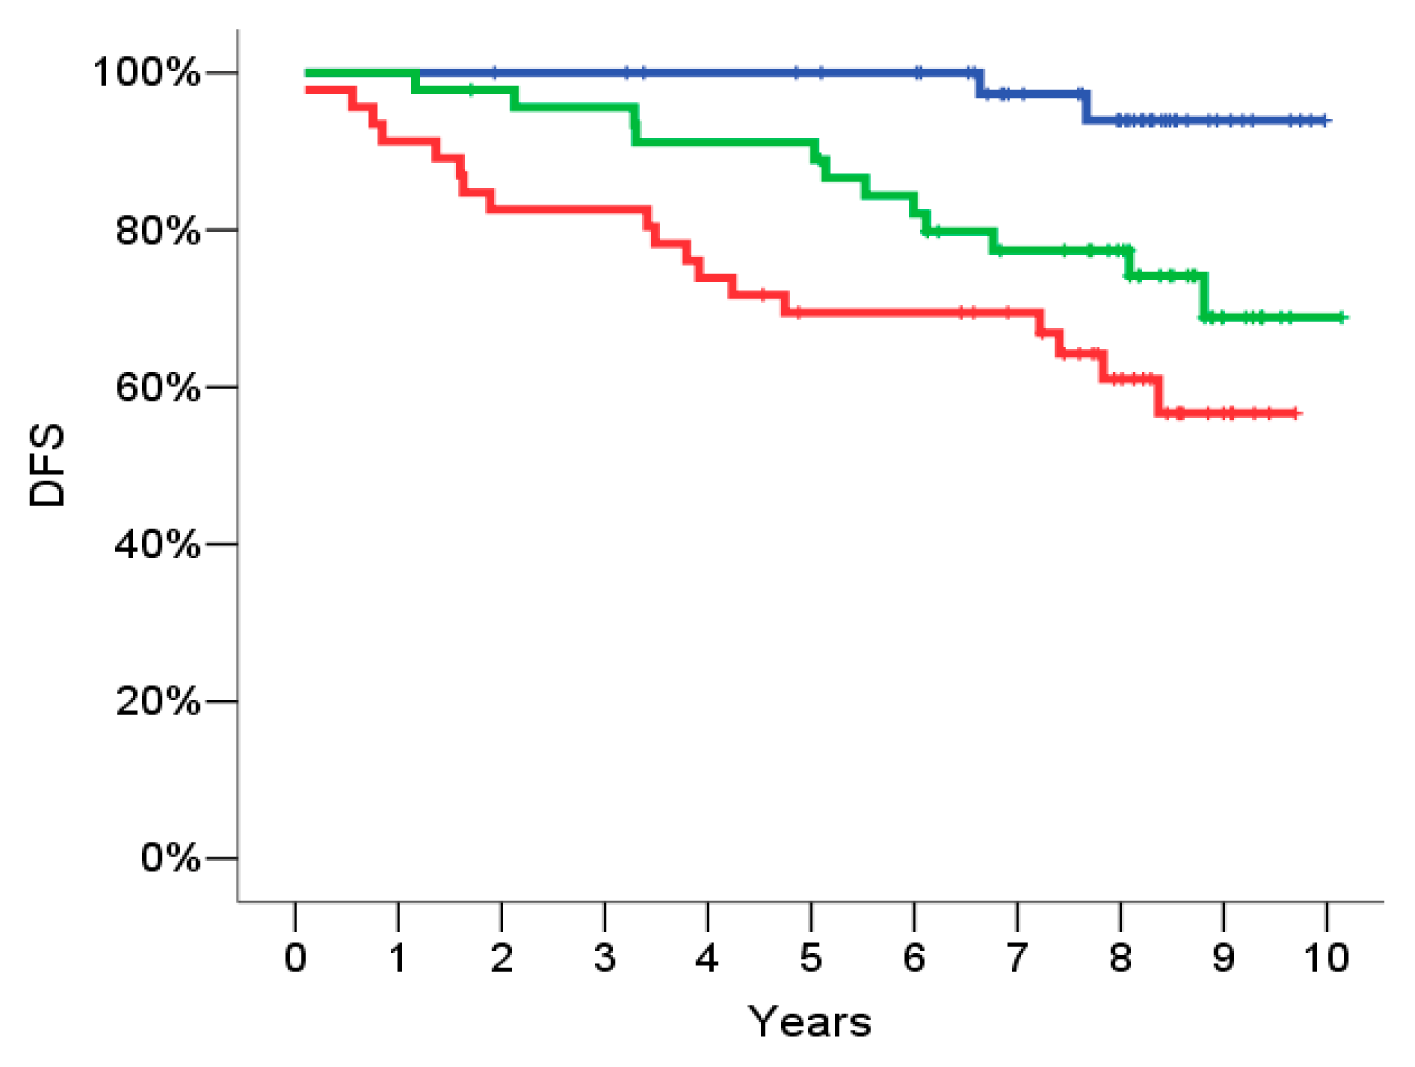
2.4. Signature Definition on the Training Set
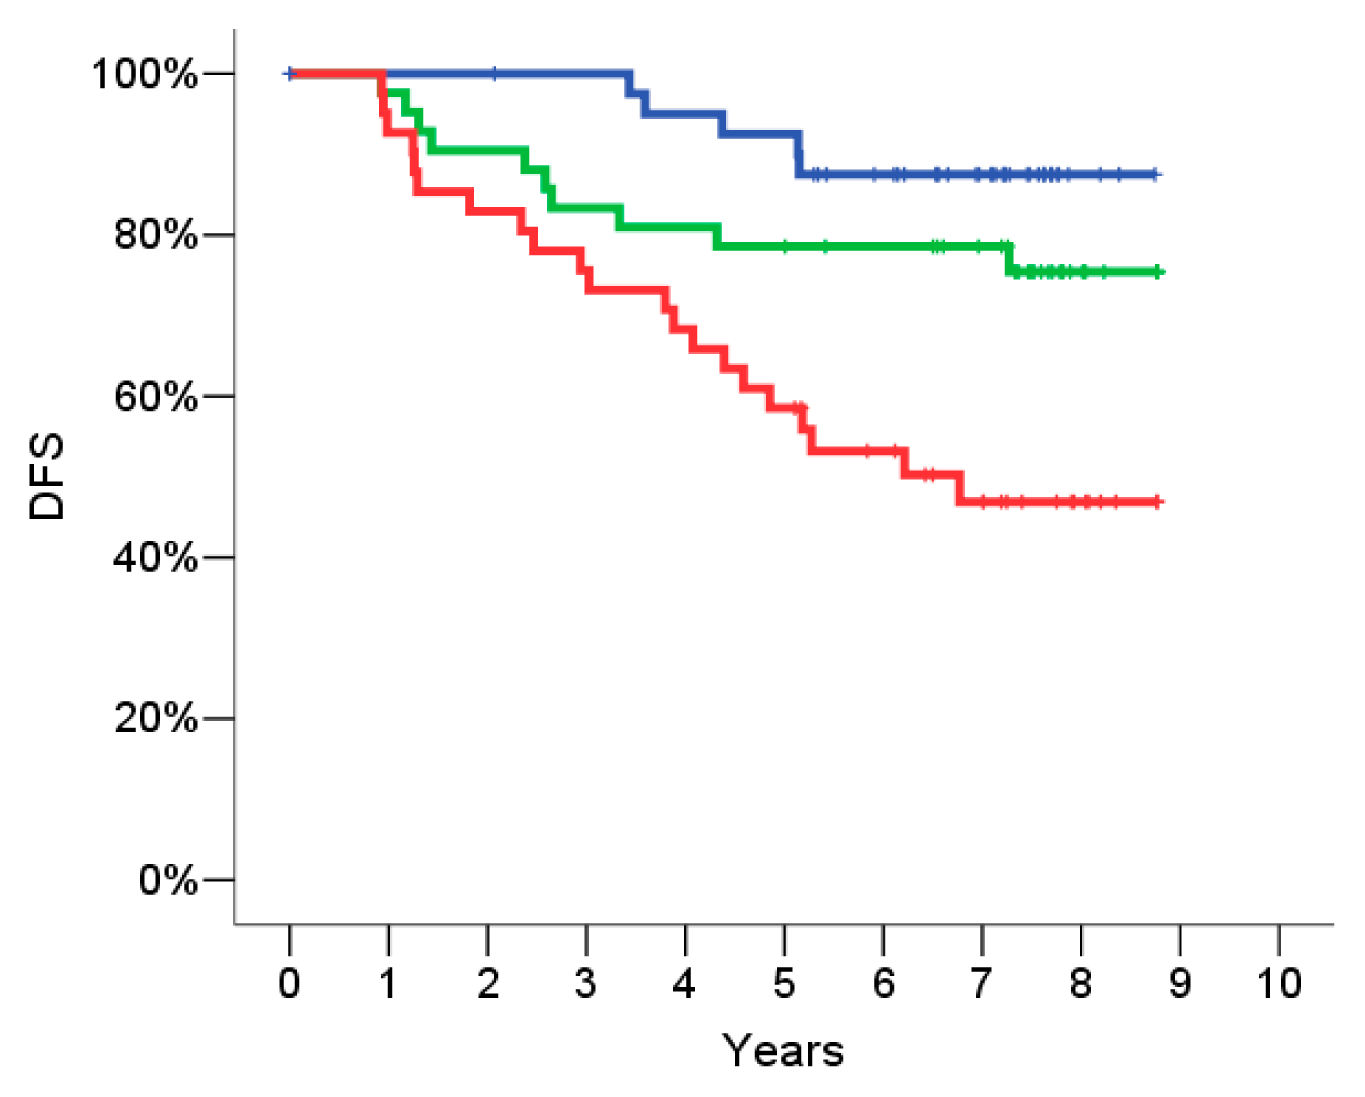
2.5. Signature Evaluation on the Validation Set
2.6. Inter and Intra Assay Reproducibility
2.7. Univariate Analysis
2.8. Multivariate Analysis
2.9. Discussion
- (a)
- FGF18: Its over-expression in tumors has also been demonstrated [21,22]. FGF18 expression is up-regulated through the constitutive activation of the Wnt pathway observed in most colorectal carcinomas [23]. As a secreted protein, FGF18 can thus affect both the tumor and the connective tissue cells of the tumor microenvironment.
- (b)
- (c)
- (d)
- MMP9: Metalloproteases are frequently up-regulated in the tumor microenvironment [27]. MMP9 influence many aspects of tissue function by cleaving a diverse range of extracellular matrix, cell adhesion, and cell surface receptors, and regulate the bioavailability of many growth factors and chemokines [28].
- (e)
- SERF1a: The function of SERF1a is not already known.
3. Experimental Section
3.1. Tumor Samples Enrolled in This Study
3.2. Ethics Statement
3.3. Gene Expression Analysis on Breast Cancer Samples
3.3.1. RNA Isolation
3.3.2. Primers Design
3.3.3. Two Step RTqPCR Analysis
3.4. Training and Validation Dataset
3.5. Univariate and Multivariate Analysis
4. Conclusions
Acknowledgements
Conflict of Interest
Abbreviation
| H & E | Hematoxylin and eosin |
| DFS | disease free survival |
| FFPE | Formalin-fixed and paraffin-embedded |
| ESMO | European Society for Medical Oncology. |
References
- Albain, K.S.; Paik, S.; van’t Veer, L. Prediction of adjuvant chemotherapy benefit in endocrine responsive, early breast cancer using multigene assays. Breast 2009, 18, S141–S145. [Google Scholar]
- Van’t Veer, L.J.; Dai, H.; van de Vijver, M.J.; He, Y.D.; Hart, A.A.; Mao, M.; Peterse, H.L.; van der Kooy, K.; Marton, M.J.; Witteveen, A.T.; et al. Gene expression profiling predicts clinical outcome of breast cancer. Nature 2002, 415, 530–536. [Google Scholar]
- Van de Vijver, M.J.; He, Y.D.; van’t Veer, L.J.; Dai, H.; Hart, A.A.; Voskuil, D.W.; Schreiber, G.J.; Peterse, J.L.; Roberts, C.; Marton, M.J.; et al. A gene-expression signature as a predictor of survival in breast cancer. N. Engl. J. Med 2002, 347, 1999–2009. [Google Scholar]
- Buyse, M.; Loi, S.; van’t Veer, L.; Viale, G.; Delorenzi, M.; Glas, A.M.; d’Assignies, M.S.; Bergh, J.; Lidereau, R.; Ellis, P.; et al. Validation and clinical utility of a 70-gene prognostic signature for women with node-negative breast cancer. J. Natl. Cancer Inst 2006, 98, 1183–1192. [Google Scholar]
- Mook, S.; Schmidt, M.K.; Viale, G.; Pruneri, G.; Eekhout, I.; Floore, A.; Glas, A.M.; Bogaerts, J.; Cardoso, F.; Piccart-Gebhart, M.J.; et al. The 70-gene prognosis-signature predicts disease outcome in breast cancer patients with 1–3 positive lymph nodes in an independent validation study. Breast Cancer Res. Treat 2009, 116, 295–302. [Google Scholar]
- Knauer, M.; Mook, S.; Rutgers, E.J.; Bender, R.A.; Hauptmann, M.; van de Vijver, M.J.; Koornstra, R.H.; Bueno-de-Mesquita, J.M.; Linn, S.C.; van’t Veer, L.J. The predictive value of the 70-gene signature for adjuvant chemotherapy in early breast cancer. Breast Cancer Res. Treat 2010, 120, 655–661. [Google Scholar]
- Mook, S.; Schmidt, M.K.; Weigelt, B.; Kreike, B.; Eekhout, I.; van de Vijver, M.J.; Glas, A.M.; Floore, A.; Rutgers, E.J.; van’t Veer, L.J. The 70-gene prognosis signature predicts early metastasis in breast cancer patients between 55 and 70 years of age. Ann. Oncol 2010, 21, 717–722. [Google Scholar]
- Mook, S.; Knauer, M.; Bueno-de-Mesquita, J.M.; Retel, V.P.; Wesseling, J.; Linn, S.C.; van’t Veer, L.J.; Rutgers, E.J. Metastatic potential of T1 breast cancer can be predicted by the 70-gene MammaPrint signature. Ann. Surg. Oncol 2010, 17, 1406–1413. [Google Scholar]
- Paik, S.; Shak, S.; Tang, G.; Kim, C.; Baker, J.; Cronin, M.; Baehner, F.L.; Walker, M.G.; Watson, D.; Park, T.; et al. A multigene assay to predict recurrence of tamoxifen-treated, node-negative breast cancer. N. Engl. J. Med 2004, 351, 2817–2826. [Google Scholar]
- Paik, S.; Tang, G.; Shak, S.; Kim, C.; Baker, J.; Kim, W.; Cronin, M.; Baehner, F.L.; Watson, D.; Bryant, J.; et al. Gene expression and benefit of chemotherapy in women with node-negative, estrogen receptor-positive breast cancer. J. Clin. Oncol 2006, 24, 3726–3734. [Google Scholar]
- Albain, K.S.; Barlow, W.E.; Shak, S.; Hortobagyi, G.N.; Livingston, R.B.; Yeh, I.T.; Ravdin, P.; Bugarini, R.; Baehner, F.L.; Davidson, N.E.; et al. Prognostic and predictive value of the 21-gene recurrence score assay in postmenopausal women with node-positive, oestrogen-receptor-positive breast cancer on chemotherapy: A retrospective analysis of a randomised trial. Lancet Oncol 2010, 11, 55–65. [Google Scholar]
- Ma, X.J.; Wang, Z.; Ryan, P.D.; Isakoff, S.J.; Barmettler, A.; Fuller, A.; Muir, B.; Mohapatra, G.; Salunga, R.; Tuggle, J.T.; et al. A two-gene expression ratio predicts clinical outcome in breast cancer patients treated with tamoxifen. Cancer Cell 2004, 5, 607–616. [Google Scholar]
- Fan, C.; Oh, D.S.; Wessels, L.; Weigelt, B.; Nuyten, D.S.; Nobel, A.B.; van’t Veer, L.J.; Perou, C.M. Concordance among gene-expression-based predictors for breast cancer. N. Engl. J. Med 2006, 355, 560–569. [Google Scholar]
- Loi, S.; Haibe-Kains, B.; Desmedt, C.; Lallemand, F.; Tutt, A.M.; Gillet, C.; Ellis, P.; Harris, A.; Bergh, J.; Foekens, J.A.; et al. Definition of clinically distinct molecular subtypes in estrogen receptor-positive breast carcinomas through genomic grade. J. Clin. Oncol 2007, 25, 1239–1246. [Google Scholar]
- Ma, X.J.; Salunga, R.; Dahiya, S.; Wang, W.; Carney, E.; Durbecq, V.; Harris, A.; Goss, P.; Sotiriou, C.; Erlander, M.; et al. A five-gene molecular grade index and HOXB13:IL17BR are complementary prognostic factors in early stage breast cancer. Clin. Cancer Res 2008, 14, 2601–2608. [Google Scholar]
- Harris, L.; Fritsche, H.; Mennel, R.; Norton, L.; Ravdin, P.; Taube, S.; Somerfield, M.R.; Hayes, D.F.; Bast, R.C., Jr. American Society of Clinical Oncology 2007 update of recommendations for the use of tumor markers in breast cancer. J. Clin. Oncol 2007, 25, 5287–5312. [Google Scholar]
- Goldhirsch, A.; Ingle, J.N.; Gelber, R.D.; Coates, A.S.; Thurlimann, B.; Senn, H.J. Thresholds for therapies: Highlights of the St gallen international expert consensus on the primary therapy of early breast cancer 2009. Ann. Oncol 2009, 20, 1319–1329. [Google Scholar]
- Finke, J.; Fritzen, R.; Ternes, P.; Lange, W.; Dolken, G. An improved strategy and a useful housekeeping gene for RNA analysis from formalin-fixed, paraffin-embedded tissues by PCR. Biotechniques 1993, 14, 448–453. [Google Scholar]
- Bussolati, G.; Annaratone, L.; Medico, E.; D’Armento, G.; Sapino, A. Formalin fixation at low temperature better preserves nucleic acid integrity. PLoS One 2011, 6, e21043. [Google Scholar]
- Gennari, A.; Sormani, M.; Pronzato, P.; Bruzzi, P.; Ferrannini, E.; Iozzo, P.; Roncella, M.; Ghilli, M.; Mirisola, V.; Pfeffer, U. Association between expression of insulin resistance (IR) related genes and breast cancer outcome. J. Clin. Oncol 2007, 25, 10597. [Google Scholar]
- Ohbayashi, N.; Shibayama, M.; Kurotaki, Y.; Imanishi, M.; Fujimori, T.; Itoh, N.; Takada, S. FGF18 is required for normal cell proliferation and differentiation during osteogenesis and chondrogenesis. Genes Dev 2002, 16, 870–879. [Google Scholar]
- Shimokawa, T.; Furukawa, Y.; Sakai, M.; Li, M.; Miwa, N.; Lin, Y.M.; Nakamura, Y. Involvement of the FGF18 gene in colorectal carcinogenesis, as a novel downstream target of the beta-catenin/T-cell factor complex. Cancer Res 2003, 63, 6116–6120. [Google Scholar]
- Katoh, Y.; Katoh, M. FGF signaling inhibitor, SPRY4, is evolutionarily conserved target of WNT signaling pathway in progenitor cells. Int. J. Mol. Med 2006, 17, 529–532. [Google Scholar]
- Jiang, W.; Jimenez, G.; Wells, N.J.; Hope, T.J.; Wahl, G.M.; Hunter, T.; Fukunaga, R. PRC1: A human mitotic spindle-associated CDK substrate protein required for cytokinesis. Mol. Cell 1998, 2, 877–885. [Google Scholar]
- Mollinari, C.; Kleman, J.P.; Jiang, W.; Schoehn, G.; Hunter, T.; Margolis, R.L. PRC1 is a microtubule binding and bundling protein essential to maintain the mitotic spindle midzone. J. Cell Biol 2002, 157, 1175–1186. [Google Scholar]
- Li, C.; Lin, M.; Liu, J. Identification of PRC1 as the p53 target gene uncovers a novel function of p53 in the regulation of cytokinesis. Oncogene 2004, 23, 9336–9347. [Google Scholar]
- Deryugina, E.I.; Quigley, J.P. Matrix metalloproteinases and tumor metastasis. Cancer Metastasis Rev 2006, 25, 9–34. [Google Scholar]
- Page-McCaw, A.; Ewald, A.J.; Werb, Z. Matrix metalloproteinases and the regulation of tissue remodelling. Natl. Rev. Mol. Cell Biol 2007, 8, 221–233. [Google Scholar]
- Hanahan, D.; Weinberg, R.A. The hallmarks of cancer. Cell 2000, 100, 57–70. [Google Scholar]
- Hanahan, D.; Weinberg, R.A. Hallmarks of cancer: The next generation. Cell 2011, 144, 646–674. [Google Scholar]
- Pronzato, P.M.G.; Generali, D.G.; Bottini, A. Complementary role of Ki67 index and “70-gene signature (MammaPrint©) high risk patients” in the St Gallen risk group with uncertain chemotherapy suggestion. J. Clin. Oncol. 2012, 30. Abstract No 579. [Google Scholar]
- Sotiriou, C.; Ignatiadis, M.; Desmedt, C.; Azim, H.A., Jr.; Veys, I.; Larsimont, D.; Lyng, M.; Viale, G.; Leyland-Jones, B.; Ditzel, H.; et al. Independent validation of the genomic grade index in BIG 1–98 study. Proc. Sant’Antonio Breast Cancer Symposium 2012, 72. [Google Scholar] [CrossRef]
- Byk, C. World Medical Association Declaration of Helsinki: Ethical principles for medical research involving human subjects. J. Int. Bioethique 2004, 15, 124–129. [Google Scholar]
- Devilee, P. World Health OrganizationInternational Agency for Research on Cancer. In Pathology and Genetics Tumours of the Breast and Female Genital Organs, 5th; Tavassoli, F.A., Devilee, P., Eds.; World Health OrganizationIARC Press: Lyon, France, 2003. [Google Scholar]
- Vandesompele, J.; de Preter, K.; Pattyn, F.; Poppe, B.; van Roy, N.; de Paepe, A.; Speleman, F. Accurate normalization of real-time quantitative RT-PCR data by geometric averaging of multiple internal control genes. Genome Biol. 2002, 3. RESEARCH0034. [Google Scholar] [Green Version]


| Symbol | AffyID | Group | Affychip | Symbol | AffyID | Group | Affychip | Symbol | AffyID | Group | Affychip |
|---|---|---|---|---|---|---|---|---|---|---|---|
| ALDH4A1 | 203722_at | 1.00 | A | MKI67 | 212021_s_at | 2.00 | A | MCM6 | 201930_at | 1.00 | A |
| AP2B1 | 200612_s_at | 1.00 | A | MKI67 | 212022_s_at | 2.00 | A | MELK | 204825_at | 1.00 | A |
| AP2B1 | 200615_s_at | 1.00 | A | MKI67 | 212023_s_at | 2.00 | A | MKI67 | 212020_s_at | 2.00 | A |
| AURKA | 204092_s_at | 2.00 | A | MMP11 | 203876_s_at | 2.00 | A | SLC2A3 | 240055_at | 1.00 | |
| AURKA | 208079_s_at | 2.00 | A | MMP11 | 203878_s_at | 2.00 | A | ZNF533 | 229019_at | 1.00 | |
| AURKA | 208080_at | 2.00 | A | MMP9 | 203936_s_at | 1.00 | A | ZNF533 | 243929_at | 1.00 | |
| AYTL2 | 201818_at | 1.00 | A | MYBL2 | 201710_at | 2.00 | A | IGF1 | 209540_at | 3.00 | A |
| BAG1 | 202387_at | 2.00 | A | NDC80 | 204162_at | 1.00 | A | IGF1R | 203628_at | 3.00 | A |
| BAG1 | 211475_s_at | 2.00 | A | NUSAP1 | 218039_at | 1.00 | A | IGF2 | 202410_x_at | 3.00 | A |
| BBC3 | 211692_s_at | 1.00 | A | ORC6L | 219105_x_at | 1.00 | A | IGFBP4 | 201508_at | 3.00 | A |
| BC045642 | 212248_at | 1.00 | A | OXCT1 | 202780_at | 1.00 | A | IGFBP5 | 203424_s_at | 1.00 | A |
| BC045642 | 212250_at | 1.00 | A | PALM2-AKAP2 | 202759_s_at | 1.00 | A | IGFBP5 | 203425_s_at | 1.00 | A |
| BC045642 | 212251_at | 1.00 | A | PALM2-AKAP2 | 202760_s_at | 1.00 | A | IGFBP5 | 203426_s_at | 1.00 | A |
| BCL2 | 203684_s_at | 2.00 | A | PECI | 218025_s_at | 1.00 | A | IGFBP5 | 211958_at | 1.00 | A |
| BCL2 | 203685_at | 2.00 | A | PGR | 208305_at | 2.00 | A | IGFBP5 | 211959_at | 1.00 | A |
| BCL2 | 207004_at | 2.00 | A | PITRM1 | 205273_s_at | 1.00 | A | IGFBP6 | 203851_at | 3.00 | A |
| BCL2 | 207005_s_at | 2.00 | A | PQLC2 | 220453_at | 1.00 | A | IGFBP7 | 201163_s_at | 3.00 | A |
| BF034907 | 206023_at | 1.00 | A | PRC1 | 218009_s_at | 1.00 | A | IL17RB | 219255_x_at | 4.00 | A |
| BIRC5 | 202094_at | 2.00 | A | RAB6A | 201045_s_at | 1.00 | A | IL6ST | 204863_s_at | 3.00 | A |
| BIRC5 | 202095_s_at | 2.00 | A | RAB6A | 201047_x_at | 1.00 | A | INSIG1 | 201627_s_at | 3.00 | A |
| BIRC5 | 210334_x_at | 2.00 | A | RAB6A | 201048_x_at | 1.00 | A | IRS1 | 204686_at | 3.00 | A |
| C16orf61 | 218447_at | 1.00 | A | RAB6A | 210406_s_at | 1.00 | A | IRS2 | 209184_s_at | 3.00 | A |
| C20orf46 | 219958_at | 1.00 | A | RFC4 | 204023_at | 1.00 | A | LGP2 | 219364_at | 1.00 | A |
| C9orf30 | 205122_at | 1.00 | A | SCUBE2 | 219197_s_at | 1.50 | A | LOC643008 | 229740_at | 1.00 | B |
| C9orf30 | 205123_s_at | 1.00 | A | SERF1A | 219982_s_at | 1.00 | A | MCM6 | 238977_at | 1.00 | B |
| CCNB1 | 214710_s_at | 2.00 | A | SLC2A3 | 202497_x_at | 1.00 | A | MS4A7 | 223343_at | 1.00 | B |
| CCNE2 | 205034_at | 1.00 | A | SLC2A3 | 202498_s_at | 1.00 | A | MS4A7 | 223344_s_at | 1.00 | B |
| CCNE2 | 211814_s_at | 1.00 | A | SLC2A3 | 202499_s_at | 1.00 | A | MS4A7 | 224358_s_at | 1.00 | B |
| CD68 | 203507_at | 2.00 | A | SLC2A3 | 216236_s_at | 1.00 | A | PALM2-AKAP2 | 226694_at | 1.00 | B |
| CDC42BPA | 214464_at | 1.00 | A | SLC2A3 | 222088_s_at | 1.00 | A | QSOX2 | 227146_at | 1.00 | B |
| CENPA | 204962_s_at | 1.00 | A | STK32B | 219686_at | 1.00 | A | QSOX2 | 235239_at | 1.00 | B |
| CENPA | 210821_x_at | 1.00 | A | TGFB3 | 209747_at | 1.00 | A | RTN4RL1 | 229097_at | 1.00 | B |
| COL4A2 | 211964_at | 1.00 | A | TNFRSF10B | 209295_at | 3.00 | A | RTN4RL1 | 232596_at | 1.00 | B |
| COL4A2 | 211966_at | 1.00 | A | TNFRSF12A | 218368_s_at | 3.00 | A | RTN4RL1 | 242102_at | 1.00 | B |
| CTSL2 | 210074_at | 2.00 | A | TNFRSF21 | 214581_x_at | 3.00 | A | RUNDC1 | 226298_at | 1.00 | B |
| DCK | 203302_at | 1.00 | A | TNFSF10 | 214329_x_at | 3.00 | A | RUNDC1 | 235040_at | 1.00 | B |
| DIAPH3 | 220997_s_at | 1.00 | A | TSPYL5 | 213122_at | 1.00 | A | SERF1A | 223538_at | 1.00 | B |
| DTL | 218585_s_at | 1.00 | A | UCHL5 | 219960_s_at | 1.00 | A | SERF1A | 223539_s_at | 1.00 | B |
| ECT2 | 219787_s_at | 1.00 | A | WISP1 | 206796_at | 1.00 | A | SLC2A3 | 236180_at | 1.00 | B |
| EGLN1 | 221497_x_at | 1.00 | A | WISP1 | 211312_s_at | 1.00 | A | SLC2A3 | 236571_at | 1.00 | B |
| ESM1 | 208394_x_at | 1.00 | A | AA834945 | 230365_at | 1.00 | B | GRB7 | 210761_s_at | 2.00 | A |
| ESR1 | 205225_at | 2.00 | A | AA834945 | 235039_x_at | 1.00 | B | GSTM1 | 204418_x_at | 2.00 | A |
| ESR1 | 207672_at | 2.00 | A | AI224578 | 235247_at | 1.00 | B | GSTM1 | 204550_x_at | 2.00 | A |
| ESR1 | 211233_x_at | 2.00 | A | AI283268 | 232579_at | 1.00 | B | GSTM1 | 215333_x_at | 2.00 | A |
| ESR1 | 211234_x_at | 2.00 | A | AP2B1 | 234064_at | 1.00 | B | GSTM3 | 202554_s_at | 1.00 | A |
| ESR1 | 211235_s_at | 2.00 | A | AW014921 | 230710_at | 1.00 | B | HER2 | 210930_s_at | 2.00 | A |
| ESR1 | 211627_x_at | 2.00 | A | AW014921 | 236480_at | 1.00 | B | HER2 | 216836_s_at | 2.00 | A |
| ESR1 | 215552_s_at | 2.00 | A | AYTL2 | 241511_at | 1.00 | B | HOXB13 | 209844_at | 4.00 | A |
| ESR1 | 217163_at | 2.00 | A | CDCA7 | 224428_s_at | 1.00 | B | HRASLS | 219983_at | 1.00 | A |
| ESR1 | 217190_x_at | 2.00 | A | CDCA7 | 230060_at | 1.00 | B | HRASLS | 219984_s_at | 1.00 | A |
| EXT1 | 201995_at | 1.00 | A | COL4A2 | 237624_at | 1.00 | B | IDE | 203328_x_at | 3.00 | A |
| EXT1 | 215206_at | 1.00 | A | DCK | 224115_at | 1.00 | B | FBXO31 | 223745_at | 1.00 | B |
| FBXO31 | 219784_at | 1.00 | A | DTL | 222680_s_at | 1.00 | B | FBXO31 | 224162_s_at | 1.00 | B |
| FBXO31 | 219785_s_at | 1.00 | A | EBF4 | 233032_x_at | 1.00 | B | FBXO31 | 236873_at | 1.00 | B |
| FBXO31 | 222352_at | 1.00 | A | EBF4 | 233850_s_at | 1.00 | B | FGF18 | 231382_at | 1.00 | B |
| FGF18 | 206986_at | 1.00 | A | ECT2 | 234992_x_at | 1.00 | B | FLT1 | 226497_s_at | 1.00 | B |
| FGF18 | 206987_x_at | 1.00 | A | ECT2 | 237241_at | 1.00 | B | FLT1 | 226498_at | 1.00 | B |
| FGF18 | 211029_x_at | 1.00 | A | EGLN1 | 223045_at | 1.00 | B | FLT1 | 232809_s_at | 1.00 | B |
| FGF18 | 211485_s_at | 1.00 | A | EGLN1 | 223046_at | 1.00 | B | GPR180 | 231871_at | 1.00 | B |
| FGF18 | 214284_s_at | 1.00 | A | EGLN1 | 224314_s_at | 1.00 | B | GPR180 | 232912_at | 1.00 | B |
| FLT1 | 204406_at | 1.00 | A | EXT1 | 232174_at | 1.00 | B | GSTM3 | 235867_at | 1.00 | B |
| FLT1 | 210287_s_at | 1.00 | A | EXT1 | 234634_at | 1.00 | B | LOC286052 | 241370_at | 1.00 | B |
| FLT1 | 222033_s_at | 1.00 | A | EXT1 | 237310_at | 1.00 | B | ||||
| GMPS | 214431_at | 1.00 | A | EXT1 | 239227_at | 1.00 | B | ||||
| GNAZ | 204993_at | 1.00 | A | EXT1 | 239414_at | 1.00 | B | ||||
| GPR126 | 213094_at | 1.00 | A | EXT1 | 242126_at | 1.00 | B |
| Index | Symbol | Cluster | AffyID | Group | Chip | logHR | HR | p value |
|---|---|---|---|---|---|---|---|---|
| 114 | PRC1 | 1 | 218009_s_at | 1 | A | 0.26 | 1.29 | <0.00001 |
| 120 | ORC6L | 16 | 219105_x_at | 1 | A | 0.36 | 1.44 | 0.000201 |
| 38 | MMP9 | 14 | 203936_s_at | 1 | A | 0.14 | 1.15 | 0.000607 |
| 11 | AYTL2 | 5 | 201818_at | 1 | A | 0.38 | 1.46 | 0.000828 |
| 69 | TGFB3 | 3 | 209747_at | 1 | A | −0.23 | 0.79 | 0.000860 |
| 145 | SERF1A | 19 | 223539_s_at | 1 | B | 0.36 | 1.44 | 0.001192 |
| 163 | FGF18 | 8 | 231382_at | 1 | B | −0.41 | 0.67 | 0.003375 |
| 156 | QSOX2 | 18 | 227146_at | 1 | B | 0.51 | 1.66 | 0.003409 |
| 143 | MS4A7 | 15 | 223344_s_at | 1 | B | −0.16 | 0.85 | 0.004351 |
| 126 | FBXO31 | 7 | 219785_s_at | 1 | A | 0.31 | 1.36 | 0.004459 |
| 164 | GPR180 | 9 | 231871_at | 1 | B | 0.33 | 1.39 | 0.005603 |
| 54 | PITRM1 | 17 | 205273_s_at | 1 | A | 0.26 | 1.30 | 0.007143 |
| 33 | BCL2 | 6 | 203685_at | 2 | A | −0.16 | 0.85 | 0.003310 |
| 68 | IGF1 | 2 | 209540_at | 3 | A | −0.22 | 0.80 | 0.000001 |
| 35 | IGFBP6 | 2 | 203851_at | 3 | A | −0.40 | 0,67 | 0.000002 |
| 47 | IL6ST | 12 | 204863_s_at | 3 | A | −0.19 | 0.83 | 0.000028 |
| 45 | IRS1 | 13 | 204686_at | 3 | A | −0.19 | 0.82 | 0.001258 |
| 7 | IGFBP7 | 4 | 201163_s_at | 3 | A | −0.41 | 0.66 | 0.001529 |
| 102 | TNFSF10 | 20 | 214329_x_at | 3 | A | −0.20 | 0.82 | 0.004448 |
| 26 | IDE | 11 | 203328_x_at | 3 | A | 0.52 | 1.68 | 0.005188 |
| Training Set | Validation Set | p value | |||
|---|---|---|---|---|---|
| Nr of Patients | 137 | 124 | ns | ||
| Mean Age (range) | 62.3 (35–87) | 61.1 (33–87) | ns | ||
| Mean Follow up (months) | 100.7 (59–123) | 89.2 (61–121) | ns | ||
| Histology | n | % | n | % | p value |
| Ductal | 86 | 62.8 | 83 | 66.9 | ns |
| Lobular | 26 | 19 | 16 | 12.9 | ns |
| Tubular-Lobular | 12 | 8.8 | 10 | 8.5 | ns |
| Medullary/Apocrine | 2 | 1.4 | 3 | 2.4 | ns |
| Other | 11 | 8.02 | 12 | 9.6 | ns |
| T Size | |||||
| T1 | 78 | 56.9 | 82 | 66.1 | ns |
| T2 | 53 | 38.7 | 37 | 29.8 | ns |
| T3 | 3 | 2.2 | 3 | 2.4 | ns |
| Tx | 3 | 2.2 | 2 | 1.6 | ns |
| N Status | |||||
| pN0 | 89 | 65 | 75 | 60.5 | ns |
| pN1a | 26 | 19 | 26 | 21 | ns |
| pN+ 4–10 | 11 | 8.1 | 7 | 5.6 | ns |
| pN+ >10 | 10 | 7.3 | 14 | 11.3 | ns |
| NX | 0 | ||||
| ER/PgR pos | 123 | 85.4 | 97 | 76.38 | ns |
| HER2 NA | 125 | 91.2 | 79 | 73.7 | p = 0.05* |
| Grading | |||||
| G1 | 33 | 24.1 | 20 | 16.1 | ns |
| G2 | 51 | 37.2 | 57 | 46 | ns |
| G3 | 27 | 19.7 | 38 | 30.6 | p = 0.04 |
| G NA | 26 | 19 | 9 | 7.3 | ns |
| Ki67 | |||||
| High (>14%) | 60 | 43.8 | 60 | 48.4 | Ns |
| Low (<15%) | 77 | 56.2 | 60 | 48.4 | ns |
| Adjuvant Chemo | 49 | 35.8 | 57 | 46 | ns |
| Anthracycline-based | 22 | 16 | 40 | 32.2 | p = 0.01 |
| Adjuvant endocrine (any) | 110 | 80.3 | 96 | 77.4 | p = 0.01 |
| Relapses | 33 | 24 | 38 | 30.6 | ns |
| Mean DFS, months | 51.4 | 47.2 | ns | ||
| Deaths | 33 | 24 | 39 | 31.4 | ns |
| 95.0% CI for Exp(B) | ||||||||
|---|---|---|---|---|---|---|---|---|
| gene | B | SE | Wald | df | Sig. | Exp(B) | Lower | Upper |
| FGF18 | 0.125 | 0.064 | 3.736 | 1 | 0.053 | 1.133 | 0.998 | 1.285 |
| BCL2 | −0.56 | 0.173 | 10.4444 | 1 | 0.001 | 0.571 | 0.407 | 0.802 |
| PRC1 | 0.409 | 0.12 | 11.712 | 1 | 0.001 | 1.506 | 1.191 | 1.903 |
| MMP9 | 0.104 | 0.06 | 3.031 | 1 | 0.082 | 1.109 | 0.987 | 1.247 |
| SERF1A | −0.188 | 0.069 | 7.375 | 1 | 0.007 | 0.828 | 0.723 | 0.949 |
| Variable | Regression coefficient (B) | SE | Exp (B) | Mean | Z-value | Probability level |
|---|---|---|---|---|---|---|
| Nodal Status (pN0/pN1a/pN2) | 0.591 | 0.100 | 1.806 | 0.062 | 5.1 | 0.0000001 |
| T Size (pT1/pT2/pT3) | 3.647 | 7.639 | 1.037 | 20.195 | 4.77 | 0.000002 |
| 5 gene Signature (High/Intermediate/Low) | 0.646 | 0.158 | 1.909 | 1.984 | 4.09 | 0.000043 |
| Ki67 (High/Low) | 0.427 | 0.126 | 1.533 | 1.933 | 3.38 | 0.0007 |
| Grading (G1/G2/G3) | 0.298 | 0.135 | 1.348 | 1.798 | 2.2 | 0.027 |
| Variable | Regression coefficient (B) (95% CI) | SE | Exp (B) | Mean | Z-value | Probability level |
|---|---|---|---|---|---|---|
| Nodal Status (pN0/pN1a/pN2) | 0.551 (0.350–0.752) | 0.102 | 1.736 | 0.655 | 5.379 | 0.00001 |
| T Size (pT1/pT2/pT3) | 0.562 (0.269–0.854) | 0.149 | 1.754 | 1.449 | 3.762 | 0.0002 |
| 5 gene Signature (High/Intermediate/Low) | 0.666 (0.298–1.034) | 0.187 | 1.947 | 1.9767 | 3.549 | 0.0004 |
| Ki67 (High/Low) | 0.27 (−0.028–0.569) | 0.152 | 1.31 | 1.748 | 1.77 | 0.076 |
| Grading (G1/G2/G3) | −0.111 (−0.387–0.164) | 0.14 | 0.894 | 1.798 | −0.792 | 0.428 |
| AdjChemo (Yes/No) | 0.061 (−0.479–0.601) | 0.275 | 1.063 | 1.604 | 0.221 | 0.824 |
| Adj Endocrine (Yes/No) | 0.032 (−0.556–0.622) | 0.3 | 1.033 | 1.209 | 0.109 | 0.912 |
| Chemo or endocrine adjuvant treatment | ||||||
|---|---|---|---|---|---|---|
| YES | NO | |||||
| 5 Gene Score | HR | 95% CI | p value | HR | 95% CI | p value |
| Low vs. High | 0.35 | 0.20–0.60 | 0.0006 | 0.16 | 0.08–0.32 | 0.0001 |
| Low vs. Intermediate | 0.98 | 0.45–2.11 | 0.9 | 0.29 | 0.11–0.77 | 0.0224 |
| Intermediate vs. High | 0.4 | 0.23–0.69 | 0.002 | 0.56 | 0.29–1.06 | 0.089 |
| Primer forward | Primer reverse | Slope | Efficiency | RSq | |
|---|---|---|---|---|---|
| B2M | ATGAGTATGCCTGCCGTGTGA | GGCATCTTCAAACCTCCATG | −3.051 | 112.7% | 0.992 |
| ACTB | TTGCCGACAGGATGCAGAAGGA | AGGTGGACAGCGAGGCCAGGAT | −3.116 | 109.4% | 0.998 |
| FBX031 | GAGGACATCTTCCACGAGCAC | AGGTAGATGCGGCGGTAGGT | −3.293 | 101.2% | 0.995 |
| FGF18 | GGTAGTCAAGTCCGGATCAAGG | TCCAGAACCTTCTCGATGAACA | −3.217 | 104.6% | 0.952 |
| BCL2 | AGTACCTGAACCGGCACCTG | CAGAGACAGCCAGGAGAAATCA | −3.787 | 83.7% | 0.999 |
| IGFBP7 | ATGAAGTAACTGGCTGGGTGCT | TGAAGCCTGTCCTTGGGAAT | −3.043 | 113.1% | 0.997 |
| IDE | AGCCCTTCTCCATGGAAACATA | CAGCTGACTTGGAAGGAGAGGT | −3.149 | 107.8% | 0.998 |
| AYTL2 | GTTGCCCTGTCTGTCGTCTG | CTTGAGGATGCAGGACAGGT | −3.057 | 112.4% | 0.989 |
| ORC6L | TGAAGTGCCCCTTGGACAG | CAGGCCCAGTAAACACTCAAAAG | −3.093 | 110.5% | 0.996 |
| MS4A7 | CCCTCAAAGAGAGAAACCTGGA | ATCAACAGGCAACACAGGATCT | −3.162 | 107.1% | 0.964 |
| OSOX2 | CGTGTTCTCTCTGGAAACTGTTC | GAACGTACCTCCTCATTGTCTGC | −3.236 | 103.7% | 0.998 |
| PITRM1 | GGAAAATTCACACAGCAAGACA | AGAGGCCGTACAAGAAGTGGT | −3.192 | 105.7% | 0.997 |
| TGFb3 | AACTTCTGCTCAGGCCCTTG | AGGCAGATGCTTCAGGGTTC | −3.216 | 104.6% | 0.998 |
| PRC-1-201 | CCGTGTCTCGACTTCCTCCT | CGTTGAGCTCCAGGTTCTCC | −3.092 | 110.6% | 0.991 |
| GPR180 | GATTCTACGCCTGCATCCACT | CCCTGCTAAGTTGTGGTGTGAA | −3.076 | 111.4% | 0.996 |
| MMP9 | GCAAGCTGGACTCGGTCTT | CCTGTGTACACCCACACCTG | −2.198 | 185.1% | 0.953 |
| IGFBP6 | GAATCCAGGCACCTCTACCAC | AGTCCAGATGTCTACGGCATGG | −2.821 | 126.2% | 0.998 |
| IRS1 | CAGTTTCCAGAAGCAGCCAGAG | GAGGATTTGCTGAGGTCATTTA | −3.136 | 108.4% | 0.990 |
| IL6ST210 | CAGTGGTCACCTCACACTCCTC | TTTGTCATTTGCTTCTATTTCCA | −3.071 | 111.7% | 0.972 |
| IGF1 | TATCAGCCCCCATCTACCAAC | TCTTGTTTCCTGCACTCCCTCT | −3.012 | 102.3% | 0.998 |
| TNSF | TCCTCAGAGAGTAGCAGCTCACA | CCTTGATGATTCCCAGGAGTT | −2.628 | 140.2% | 0.759 |
| SERF1A | CCAGGAAATTAGCAAGGGAAAG | CTTGTCTGCATAGACTTCTTCTCA | −2.927 | 119.6% | 0.974 |
© 2013 by the authors; licensee MDPI, Basel, Switzerland This article is an open access article distributed under the terms and conditions of the Creative Commons Attribution license (http://creativecommons.org/licenses/by/3.0/).
Share and Cite
Mustacchi, G.; Sormani, M.P.; Bruzzi, P.; Gennari, A.; Zanconati, F.; Bonifacio, D.; Monzoni, A.; Morandi, L. Identification and Validation of a New Set of Five Genes for Prediction of Risk in Early Breast Cancer. Int. J. Mol. Sci. 2013, 14, 9686-9702. https://doi.org/10.3390/ijms14059686
Mustacchi G, Sormani MP, Bruzzi P, Gennari A, Zanconati F, Bonifacio D, Monzoni A, Morandi L. Identification and Validation of a New Set of Five Genes for Prediction of Risk in Early Breast Cancer. International Journal of Molecular Sciences. 2013; 14(5):9686-9702. https://doi.org/10.3390/ijms14059686
Chicago/Turabian StyleMustacchi, Giorgio, Maria Pia Sormani, Paolo Bruzzi, Alessandra Gennari, Fabrizio Zanconati, Daniela Bonifacio, Adriana Monzoni, and Luca Morandi. 2013. "Identification and Validation of a New Set of Five Genes for Prediction of Risk in Early Breast Cancer" International Journal of Molecular Sciences 14, no. 5: 9686-9702. https://doi.org/10.3390/ijms14059686