Analysis of Gln223Agr Polymorphism of Leptin Receptor Gene in Type II Diabetic Mellitus Subjects among Malaysians

Abstract
:1. Introduction
2. Results and Discussion
2.1. Genotypic and Allelic Frequency
3. Methodology
3.1. Study Population
3.2. Sampling Method
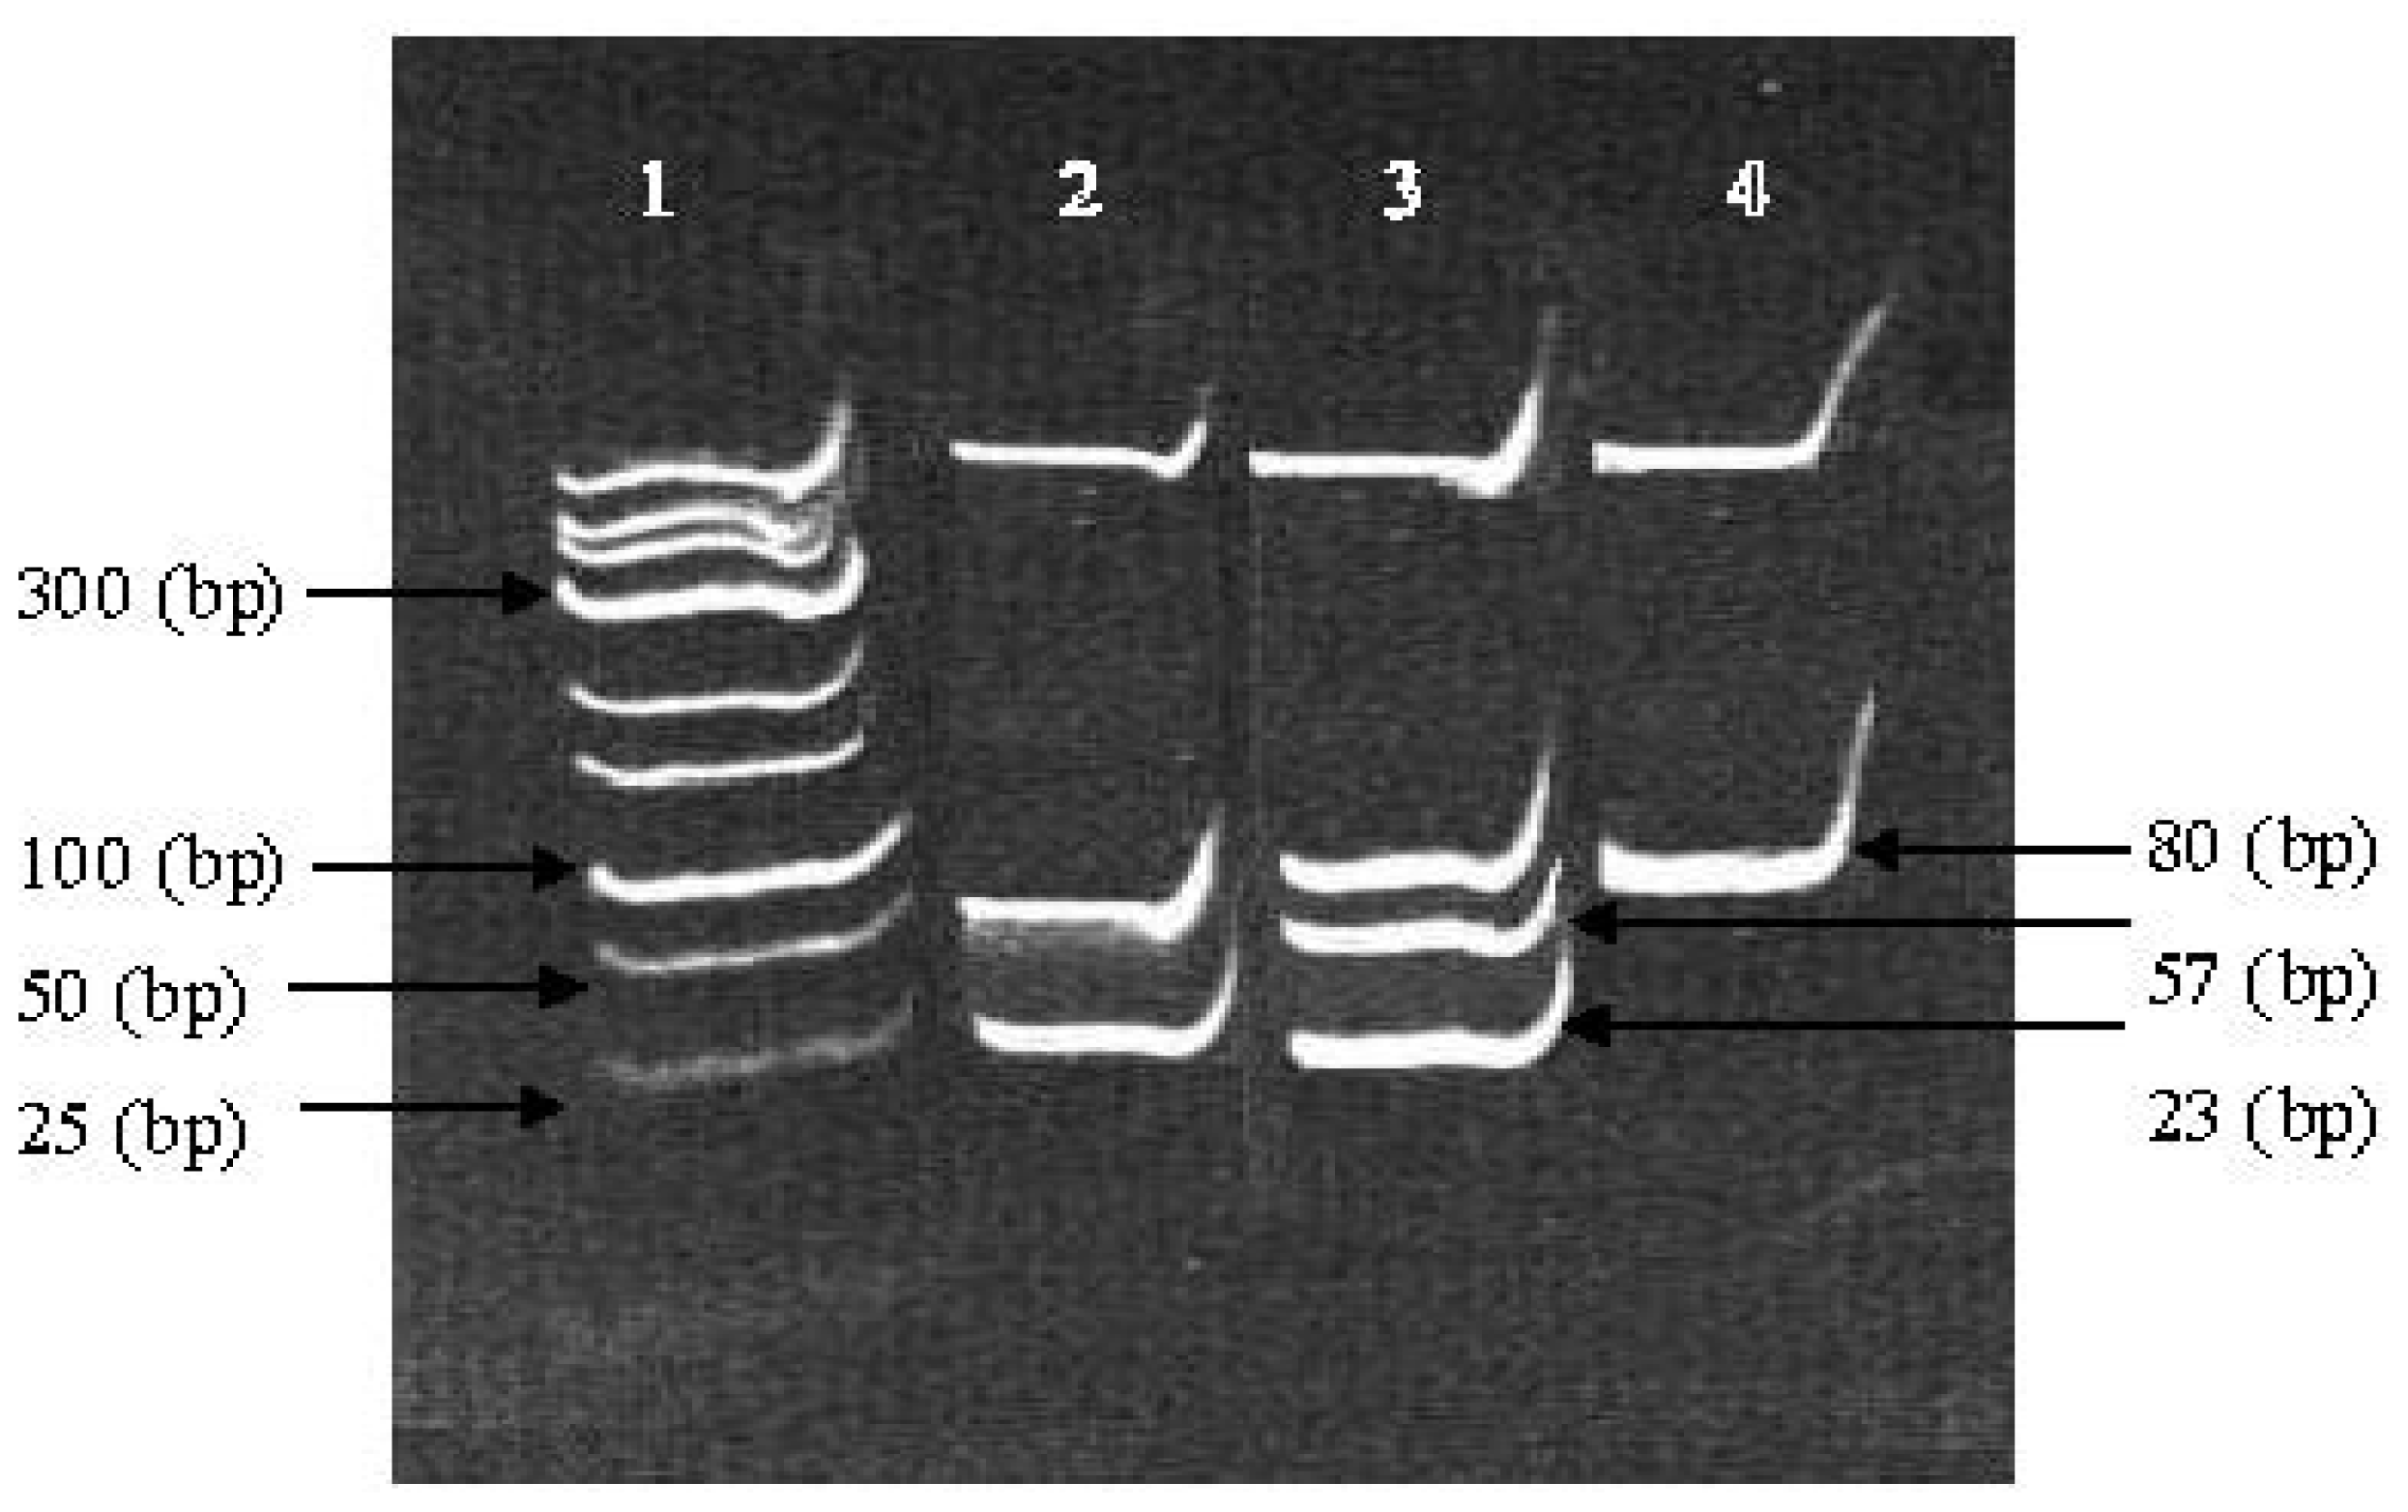
3.3. Genotyping
3.4. Enzymatic Digestion
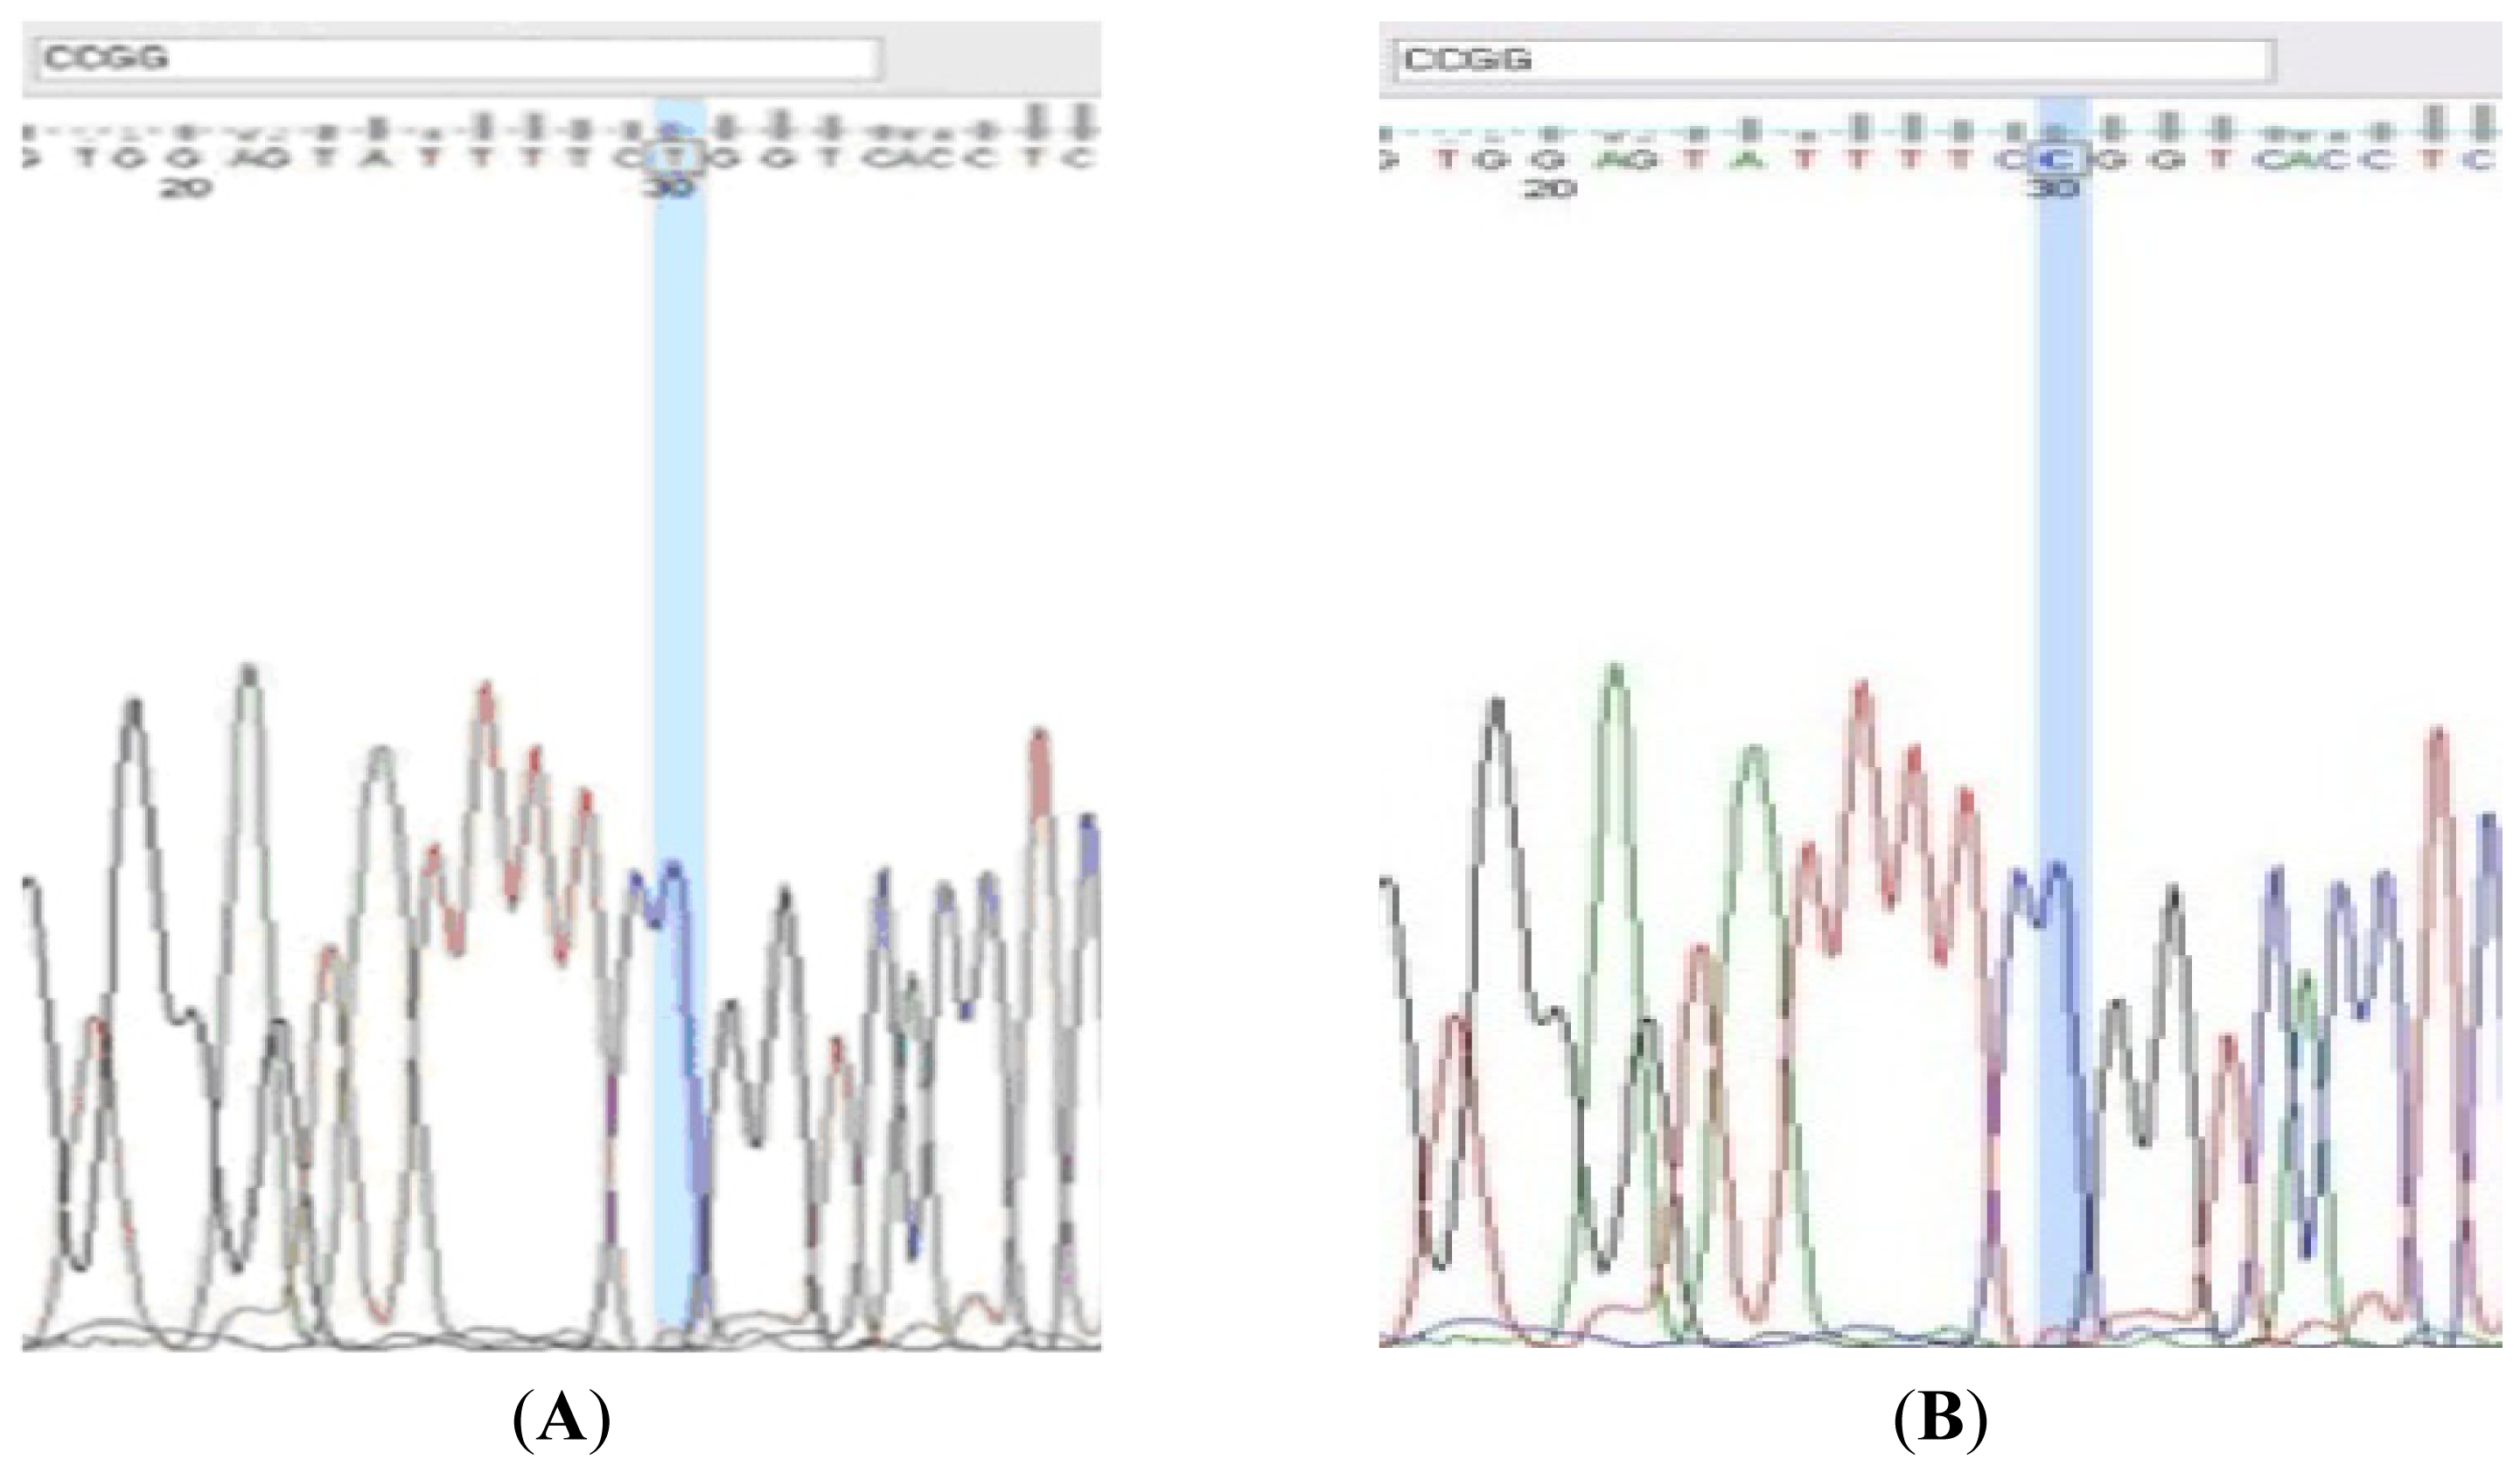
3.5. DNA Sequencing
3.6. Data Validation
3.7. Statistical Methods
4. Conclusions
Acknowledgments
Conflicts of Interest
References
- Nor, M.; Safiza, N.; Khor, G.L.; Shahar, S.; Kee, C.C.; Haniff, J.; Appannah, G.; Rasat, R.; Wong, N.F.; Zainuddin, A.A. The Third National Health and Morbidity Survey (NHMS III) 2006, nutritional status of adults aged 18 years and above. Malays. J. Nutr 2008, 14, 1–87. [Google Scholar]
- Almdal, T.; Scharling, H.; Jensen, J.S.; Vestergaard, H. Higher prevalence of risk factors for type 2 diabetes mellitus and subsequent higher incidence in men. Eur. J. Intern. Med 2008, 19, 40–45. [Google Scholar]
- Kumari, M.; Head, J.; Marmot, M. Prospective study of social and other risk factors for incidence of type 2 diabetes in the Whitehall II study. Arch. Intern. Med 2004, 164, 1873–1880. [Google Scholar]
- Meisinger, C.; Thorand, B.; Schneider, A.; Stieber, J.; Doring, A.; Lowel, H. Sex differences in risk factors for incident type 2 diabetes mellitus: The MONICA Augsburg cohort study. Arch. Intern. Med 2002, 162, 82–89. [Google Scholar]
- Njølstad, I.; Amesen, E.; Lund-Larsen, P.G. Sex differences in risk factors for clinical diabetes mellitus in a general population: A 12-year follow-up of the Finnmark Study. Am. J. Epidemiol 1998, 147, 49–58. [Google Scholar]
- Hebebrand, J.; Hinney, A. Environmental and genetic risk factors in obesity. Child Adolesc. Psychiatr. Clin. N. Am 2009, 18, 83–94. [Google Scholar]
- Morrish, N.J.; Wang, S.L.; Stevens, L.K.; Fuller, J.H.; Keen, H. Mortality and causes of death in the WHO multinational study of vascular disease in diabetes. Diabetologia 2001, 44, S14–S21. [Google Scholar]
- Haffner, S.M.; Miettinen, H.; Stern, M.P. Relatively more atherogenic coronary heart disease risk factors in prediabetic women than in prediabetic men. Diabetologia 1997, 40, 711–717. [Google Scholar]
- Booth, G.L.; Kapral, M.K.; Fung, K.; Tu, J.V. Recent trends in cardiovascular complications among men and women with and without diabetes. Diabetes Care 2006, 29, 32–37. [Google Scholar]
- Alexander, C.M.; Landsman, P.B.; Teutsch, S.M.; Haffner, S.M. NCEP-defined metabolic syndrome, diabetes, and prevalence of coronary heart disease among NHANES III participants age 50 years and older. Diabetes 2003, 52, 1210–1214. [Google Scholar]
- Clément, K.; Vaisse, C.; Lahlou, N.; Cabrol, S.; Pelloux, V.; Cassuto, D.; Gourmelen, M.; Dina, C.; Chambaz, J.; Lacorte, J.M.; et al. A mutation in the human leptin receptor gene causes obesity and pituitary dysfunction. Nature 1998, 392, 398–401. [Google Scholar]
- Davies, L.; Marks, J.L. Role of hypothalamic neuropeptide Y gene expression in body weight regulation. Am. J. Physiol 1994, 266, R1687–R1691. [Google Scholar]
- Mantzoros, C.S.; Moschos, S.J. Leptin: In search of role(s) in human physiology and pathophysiology. Clin. Endocrinol 1998, 49, 551–567. [Google Scholar]
- Garcia-Mayor, R.V.; Andrade, M.A.; Rios, M.; Lage, M.; Dieguez, C.; Casanueva, F.F. Serum leptin levels in normal children: Relationship to age, gender, body mass index, pituitary-gonadal hormones, and pubertal stage. J. Clin. Endocrinol. Metab 1997, 82, 2849–2855. [Google Scholar]
- Oksanen, L.; Mustajoki, P.; Kaprio, J.; Kainulainen, K.; Jaenne, L.; Peltonen, L.; Kontula, K. Polymorphism of the β3-adrenergic receptor gene in morbid obesity. Int. J. Obes 1996, 20, 1055–1061. [Google Scholar]
- Myers, M.G., Jr; Leibel, R.L.; Seeley, R.J.; Schwartz, M.W. Obesity and leptin resistance: Distinguishing cause from effect. Trends Endocrinol. Metab. 2010, 21, 643–651. [Google Scholar]
- Lahlou, N.; Clement, K.; Carel, J.C.; Vaisse, C.; Lotton, C.; Le Bihan, Y.; Lotton, C.; Basdevant, A.; Lebouc, Y.; Froguel, P.; et al. Soluble leptin receptor in serum of subjects with complete resistance to leptin: Relation to fat mass. Diabetes 2000, 49, 1347–1352. [Google Scholar]
- Burguera, B.; Couce, M.E.; Curran, G.L.; Jensen, M.D.; Lloyd, R.V.; Cleary, M.P.; Poduslo, J.F. Obesity is associated with a decreased leptin transport across the blood-brain barrier in rats. Diabetes 2000, 49, 1219–1223. [Google Scholar]
- Bougneres, P. Genetics of obesity and type 2 diabetes: Tracking pathogenic traits during the predisease period. Diabetes 2002, 51, 295–303. [Google Scholar]
- O’Rourke, L.; Yeaman, S.J.; Shepherd, P.R. Insulin and leptin acutely regulate cholesterol ester metabolism in macrophages by novel signaling pathways. Diabetes 2001, 50, 955–961. [Google Scholar]
- Mayes, P.A. Lipids of Physiologic Significance. In Harper’s Biochemistry, 21st ed; Murray, R.K., Granner, D.K., Mayers, P.A., Rodwell, V.W., Eds.; Appleton and Lange: Norwalk, CT, USA, 1988; pp. 130–141. [Google Scholar]
- Mendez-Sanchez, N.; Gonzalez, V.; King-Martinez, A.C.; Sanchez, H.; Uribe, M. Plasma leptin and the cholesterol saturation of bile are correlated in obese women after weight loss. J. Nutr 2002, 132, 2195–2198. [Google Scholar]
- Szapary, P.O.; Hark, L.A.; Burke, F.M. The metabolic syndrome: A new focus for lifestyle modification. (CHD prevention). Patient Care 2002, 13, 75–88. [Google Scholar]
- Shimabukuro, M.; Koyama, K.; Chen, G.; Wang, M.Y.; Trieu, F.; Lee, Y.; Newgard, C.B.; Unger, R.H. Direct antidiabetic effect of leptin through triglyceride depletion of tissues. Proc. Natl. Acad. Sci. USA 1997, 94, 4637–4641. [Google Scholar]
- Fairbrother, U.L.; Tankó, L.B.; Walley, A.J.; Christiansen, C.; Froguel, P.; Blakemore, A.I. Leptin receptor genotype at Gln223Arg is associated with body composition, BMD, and vertebral fracture in postmenopausal Danish women. J. Bone Miner. Res 2007, 22, 544–550. [Google Scholar]
- Wauters, M.; Mertens, I.; Rankinen, T.; Chagnon, M.; Bouchard, C.; van Gaal, L. Leptin receptor gene polymorphisms are associated with insulin in obese women with impaired glucose tolerance. J. Clin. Endocrinol. Metab 2001, 86, 3227–3232. [Google Scholar]
- Salopuro, T.; Pulkkinen, L.; Lindström, J.; Eriksson, J.G.; Valle, T.T.; Hämäläinen, H.; Ilanne-Parikka, P.; Keinänen-Kiukaanniemi, S.; Tuomilehto, J.; Laakso, M.; et al. Genetic variation in leptin receptor gene is associated with type 2 diabetes and body weight: The Finnish Diabetes Prevention Study. Int. J. Obes 2005, 29, 1245–1251. [Google Scholar]
- Liew, S.F.; Chuah, H.S.; Lau, C.L.; Lee, C.H.; Say, Y.H. Prevalence of the leptin and leptin receptor gene variants and obesity risk factors among Malaysian University students of Setapak, Kuala Lumpur. Asian J. Epidemiol 2009, 2, 49–58. [Google Scholar]
- Heo, M.; Leibel, R.L.; Fontaine, K.R.; Boyer, B.B.; Chung, W.K.; Koulu, M.; Karvonen, M.K.; Pesonen, U.; Rissanen, A.; Laakso, M.; et al. A meta-analytic investigation of linkage and association of common leptin receptor (LEPR) polymorphisms with body mass index and waist circumference. Int. J. Obes. Relat. Metab. Disord 2002, 26, 640–646. [Google Scholar]
- Constantin, A.; Costache, G.; Sima, A.V.; Glavce, C.S.; Vladica, M.; Popov, D.L. Leptin G-2548A and leptin receptor Q223R gene polymorphisms are not associated with obesity in Romanian subjects. Biochem. Biophys. Res. Commun 2010, 391, 282–286. [Google Scholar]
- Paracchini, V.; Pedotti, P.; Taioli, E. Genetics of leptin and obesity: A HuGE review. Am. J. Epidemiol 2005, 162, 101–114. [Google Scholar]
- Bender, N.; Allemann, N.; Marek, D.; Vollenweider, P.; Waeber, G.; Mooser, V.; Egger, M.; Bochud, M. Association between variants of the leptin receptor gene (LEPR) and overweight: A systematic review and an analysis of the CoLaus study. PLoS One 2011, 6, e26157. [Google Scholar]
- Pluzhnikov, A.; Di Rienzo, A.; Hudson, R.R. Inferences about human demography based on multilocus analyses of noncoding sequences. Genetics 2002, 161, 1209–1218. [Google Scholar]
- Coelho, M.; Luiselli, D.; Bertorelle, G.; Lopes, A.I.; Seixas, S.; Destro-Bisol, G.; Rocha, J. Microsatellite variation and evolution of human lactase persistence. Hum. Genet 2005, 117, 329–339. [Google Scholar]
- Voight, B.F.; Kudaravalli, S.; Wen, X.; Pritchard, J.K. A map of recent positive selection in the human genome. PLoS Biol 2006, 4, e72. [Google Scholar]
- Grundy, S.M. Metabolic syndrome pandemic. Arterioscler. Thromb. Vasc. Biol 2008, 28, 629–636. [Google Scholar]
- Guizar-Mendoza, J.M.; Amador-Licona, N.; Flores-Martinez, S.E.; Lopez-Cardona, M.G.; Ahuatzin-Tremary, R.; Sanchez-Corona, J. Association analysis of the Gln223Arg polymorphism in the human leptin receptor gene, and traits related to obesity in Mexican adolescents. J. Hum. Hypertens 2005, 19, 341–346. [Google Scholar]
- Zeggini, E.; Scott, L.J.; Saxena, R.; Voight, B.F.; Marchini, J.L.; Hu, T.; de Bakker, P.I.; Abecasis, G.R.; Almgren, P.; Andersen, G.; et al. Meta-analysis of genome-wide association data and large-scale replication identifies additional susceptibility loci for type 2 diabetes. Nat. Genet 2008, 40, 638–645. [Google Scholar]


| Characteristics | T2DM | Lower/Upper | Control | Lower/Upper | p-value | ||||
|---|---|---|---|---|---|---|---|---|---|
| Male | Female | Total | CI 95% | Male | Female | Total | CI 95% | ||
| Age (years) | 60.7 ± 10.2 | 61.4 ± 8.8 | 61 ± 9.8 | 59.9–62.2 | 56.1 ± 11.2 | 49.7 ± 13 | 53.3 ± 12.4 | 51.8–54.8 | 0.000 ** |
| BMI (Kg/m2) | 27.47 ± 4.38 | 28.29 ± 5.66 | 27.73 ± 4.83 | 27.1–28.3 | 26.42 ± 4.32 | 26.07 ± 4.94 | 26.27 ± 4.59 | 26.8–26.1 | 0.014 * |
| WHR | 0.95 ± 0.05 | 0.93 ± 0.07 | 0.94 ± 0.06 | 0.94–0.95 | 0.92 ± 0.05 | 0.86 ± 0.07 | 0.9 ± 0.06 | 0.89–0.91 | 0.000 ** |
| SBP (mm Hg) | 140.59 ± 22.55 | 144.37 ± 22.63 | 141.83 ± 22.6 | 139.1–144.56 | 138.34 ± 20.69 | 134.21 ± 18.75 | 136.64 ± 19.98 | 134.24–139.05 | 0.048 * |
| DBP (mm Hg) | 80.05 ± 9.89 | 78.25 ± 9.79 | 79.45 ± 9.88 | 78.26–80.65 | 79.47 ± 9.47 | 78.03 ± 9.4 | 78.87 ± 9.45 | 77.73–80.02 | 0.170 |
| FPG (mmol/L) | 8.29 ± 3.17 | 8.67 ± 3.4 | 8.41 ± 3.24 | 8.02–8.81 | 5.49 ± 0.98 | 4.79 ± 0.81 | 5.19 ± 0.97 | 5.07–5.31 | 0.000 ** |
| HbA1C | 8.22 ± 1.94 | 8.27 ± 1.64 | 8.24 ± 1.84 | 8.02–8.45 | 5.85 ± 0.51 | 5.7 ± 0.38 | 5.79 ± 0.46 | 5.73–5.86 | 0.000 ** |
| LDL (mmol/L) | 2.31 ± 0.78 | 2.46 ± 0.89 | 2.36 ± 0.82 | 2.26–2.46 | 2.74 ± 0.97 | 2.71 ± 0.97 | 2.73 ± 0.97 | 2.61–2.84 | 0.060 |
| HDL (mmol/L) | 1.11 ± 0.28 | 1.31 ± 0.36 | 1.17 ± 0.32 | 1.13–121 | 1.16 ± 0.33 | 1.34 ± 0.42 | 1.23 ± 0.38 | 1.19–1.28 | 0.000 ** |
| TG (mmol/L) | 1.61 ± 0.81 | 1.62 ± 0.75 | 1.61 ± 0.79 | 1.52–1.71 | 1.5 ± 0.83 | 1.04 ± 0.49 | 1.3 ± 0.74 | 1.28–1.38 | 0.001 ** |
| Chol (mmol/L) | 4.17 ± 0.96 | 4.59 ± 1.04 | 4.3 ± 1.01 | 4.18–4.43 | 4.56 ± 1.03 | 4.67 ± 1.25 | 4.61 ± 1.13 | 4.47–4.74 | 0.003 ** |
| CVD Risk% | 3.97 ± 1.25 | 3.78 ± 1.31 | 3.9 ± 1.27 | 3.75–4.06 | 4.15 ± 1.28 | 3.67 ± 1.17 | 3.94 ± 1.26 | 3.79–4.09 | 0.014 ** |
| Family History | |||||||||
| No | 97 (51.1) | 45 (49.5) | 142 (50.5) | 104 (66.2) | 69 (56.1) | 173 (61.8) | 0.007 **,† | ||
| Yes | 93 (48.9) | 46 (50.5) | 139 (49.5) | 53 (38.8) | 54 (43.9) | 107 (38.2) | |||
| Duration (years) | 10 ± 8 | 10.6 ± 8.2 | 10.2 ± 8.1 | - | - | - | - | ||
| T2DM (n-284) | Controls (n-281) | ||||||
|---|---|---|---|---|---|---|---|
| Genotypes and Alleles | Malay (n = 145) | Chinese (n = 49) | Indians (n = 90) | Malay (n = 133) | Chinese (n = 71) | Indians (n = 77) | p value |
| WT (GG) | 28.7 | 26.1 | 41.2 | 16.4 | 8.8 | 30.1 | 0.057 |
| HOM (AA) | 59.6 | 73.9 | 50.6 | 68.8 | 83.8 | 50.7 | 0.011 * |
| HET (GA) | 11.8 | - | 8.2 | 14.8 | 7.4 | 19.2 | 0.095 |
| Alleles | |||||||
| G | 0.346 | 0.261 | 0.453 | 0.238 | 0.125 | 0.397 | NS |
| A | 0.654 | 0.739 | 0.547 | 0.762 | 0.875 | 0.603 | |
| Post-Hoc Test | p value | (95% Confidence interval(lower bound-upper bound) | |||||
| Chinese alone | |||||||
| GG vs. AA | 0.019 * | 0.50–0.54 | |||||
| GG vs. GA | 0.007 * | 0.19–1.14 | |||||
| AA vs. GA | 0.091 | −0.05–0.81 | |||||
| Three Ethnics | |||||||
| GG vs. AA | 0.001 * | 0.80–0.27 | |||||
| GG vs. GA | 0.001 * | 0.11–0.41 | |||||
| AA vs. GA | 0.001 * | −0.41–−0.11 | |||||
| Factors | T2DM | Control | p-value | ||||
|---|---|---|---|---|---|---|---|
| WT (GG) | HOM (AA) | HET (GA) | WT (GG) | HOM (AA) | HET (GA) | ||
| Age (years) | 61.8 ± 9.8 | 60.5 ± 9.5 | 60.2 ± 9.9 | 56.4 ± 11.2 | 53.8 ± 12.0 | 52.3 ± 14.9 | 0.007 ** |
| BMI (Kg/cm2) | 27.87 ± 5.26 | 27.67 ± 4.73 | 27.4 ± 4.31 | 26.43 ± 4.67 | 26.31 ± 4.67 | 26.35 ± 4.13 | 0.423 |
| WHR | 0.94 ± 0.06 | 0.94 ± 0.06 | 0.93 ± 0.03 | 0.91 ± 0.05 | 0.89 ± 0.06 | 0.9 ± 0.1 | 0.022 ** |
| SBP (mm Hg) | 145.6 ± 19.9 | 139.2 ± 23.1 | 144.3 ± 22.7 | 135.36 ± 18.65 | 137.8 ± 20.4 | 134.5 ± 19.6 | 0.334 |
| DBP (mm Hg) | 80.27 ± 8.7 | 78.97 ± 10.1 | 79.34 ± 7.8 | 77.48 ± 8.17 | 79.32 ± 9.82 | 78.52 ± 9.16 | 0.385 |
| FPG (mmol/L) | 8.28 ± 3.2 | 8.55 ± 3.27 | 7.58 ± 3.1 | 5.59 ± 0.75 | 5.17 ± 0.99 | 5.03 ± 0.91 | 0.000 ** |
| HbA1C | 8.13 ± 1.7 | 8.26 ± 1.8 | 8.43 ± 2.2 | 5.83 ± 0.46 | 5.79 ± 0.47 | 5.76 ± 0.54 | 0.000 ** |
| LDL (mmol/L) | 2.41 ± 0.88 | 2.32 ± 0.74 | 2.55 ± 1.22 | 2.57 ± 0.9 | 2.82 ± 0.97 | 2.59 ± 1.09 | 0.000 ** |
| HDL (mmol/L) | 1.16 ± 0.25 | 1.17 ± 0.35 | 1.12 ± 0.29 | 1.25 ± 0.33 | 1.24 ± 0.38 | 1.22 ± 0.42 | 0.003 ** |
| TG (mmol/L) | 1.54 ± 0.61 | 1.65 ± 0.88 | 1.36 ± 0.64 | 1.43 ± 0.71 | 1.31 ± 0.78 | 1.14 ± 0.54 | 0.139 |
| Chol (mmol/L) | 4.44 ± 1.13 | 4.25 ± 0.92 | 4.18 ± 1.15 | 4.47 ± 0.97 | 4.7 ± 1.15 | 4.43 ± 1.28 | 0.010 ** |
| CVD Risk% | 3.99 ± 1.23 | 3.9 ± 1.29 | 3.67 ± 0.89 | 3.79 ± 1.06 | 3.98 ± 1.28 | 3.82 ± 1.2 | 0.216 |
| Family History | |||||||
| No | 37 (43.5) | 86 (54.8) | 11 (50) | 31 (63.3) | 108 (59.3) | 27 (71.1) | 0.000 **,† |
| Yes | 48 (56.5) | 71 (45.2) | 11 (50) | 18 (36.7) | 74 (40.7) | 11 (28.9) | |
| Duration (years) | 10.9 ± 8.4 | 9.9 ± 7.9 | 8.6 ± 6.3 | - | |||
| SNP ID | Amino acid changing region | Enzymatic digestion time temperature and volume | Cutting position | Forward and reverse primer | PCR product size (bp) | PCR cycling condition (time and temperature) | Reference |
|---|---|---|---|---|---|---|---|
| rs1137101 | Gln223Arg | Msp I 45 min 37 °C 4 Unit | 5′...C^C G G...3′ 3′...G G C^C...5′ | 5′-CAAACTCAACGACACTCTCCTT-3′ 5′-CTGAACTGACATTAGAGGTGAC-3′ | 80 | 5 min 95 °C 45 s 95 °C 30 s 57 °C 45 s 72 °C 30 cycle 10 min 72 °C 4 °C ∞ | [37] |
© 2013 by the authors; licensee MDPI, Basel, Switzerland This article is an open access article distributed under the terms and conditions of the Creative Commons Attribution license (http://creativecommons.org/licenses/by/3.0/).
Share and Cite
Etemad, A.; Ramachandran, V.; Pishva, S.R.; Heidari, F.; Aziz, A.F.A.; Yusof, A.K.M.; Pei, C.P.; Ismail, P. Analysis of Gln223Agr Polymorphism of Leptin Receptor Gene in Type II Diabetic Mellitus Subjects among Malaysians. Int. J. Mol. Sci. 2013, 14, 19230-19244. https://doi.org/10.3390/ijms140919230
Etemad A, Ramachandran V, Pishva SR, Heidari F, Aziz AFA, Yusof AKM, Pei CP, Ismail P. Analysis of Gln223Agr Polymorphism of Leptin Receptor Gene in Type II Diabetic Mellitus Subjects among Malaysians. International Journal of Molecular Sciences. 2013; 14(9):19230-19244. https://doi.org/10.3390/ijms140919230
Chicago/Turabian StyleEtemad, Ali, Vasudevan Ramachandran, Seyyed Reza Pishva, Farzad Heidari, Ahmad Fazli Abdul Aziz, Ahmad Khairuddin Mohamed Yusof, Chong Pei Pei, and Patimah Ismail. 2013. "Analysis of Gln223Agr Polymorphism of Leptin Receptor Gene in Type II Diabetic Mellitus Subjects among Malaysians" International Journal of Molecular Sciences 14, no. 9: 19230-19244. https://doi.org/10.3390/ijms140919230