Evaluation of Hepatic Tissue Blood Flow Using Xenon Computed Tomography with Fibrosis Progression in Nonalcoholic Fatty Liver Disease: Comparison with Chronic Hepatitis C

 , ,
, ,
Abstract
:Aims
Methods
Results
Conclusions
1. Introduction
2. Results
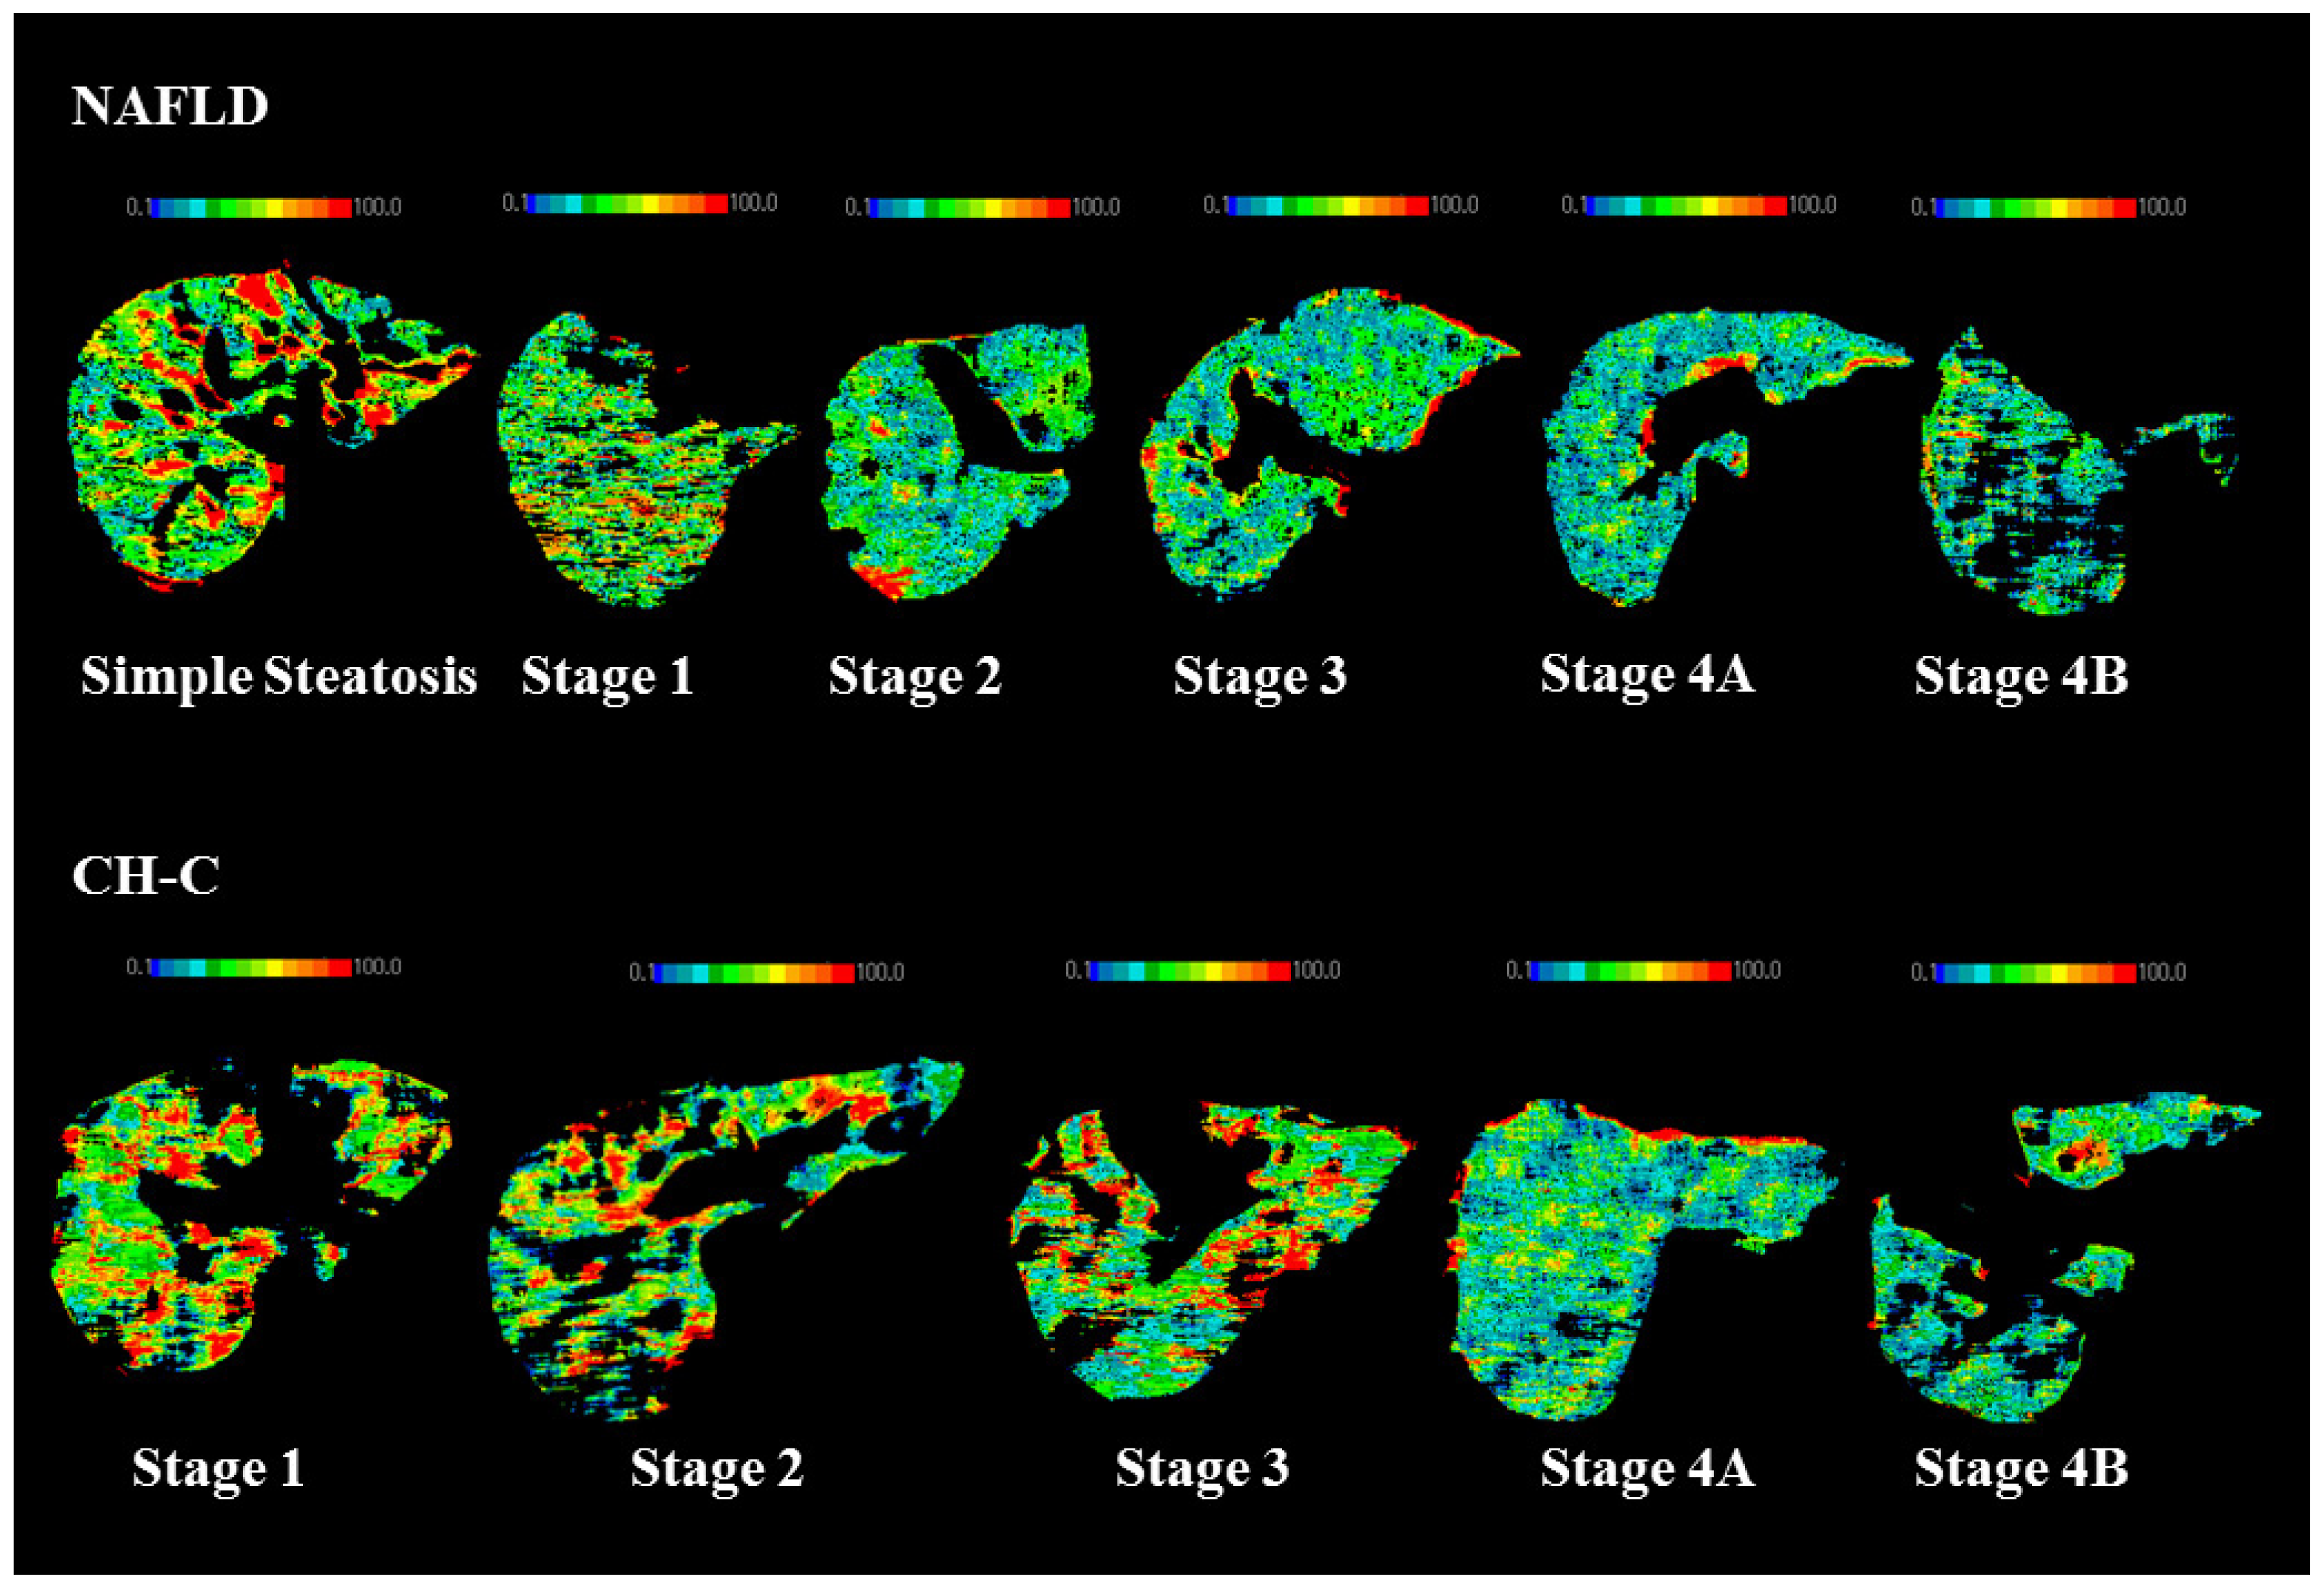
2.1. Hepatic TBF in NAFLD Patients
2.2. Hepatic TBF in CH-C Patients
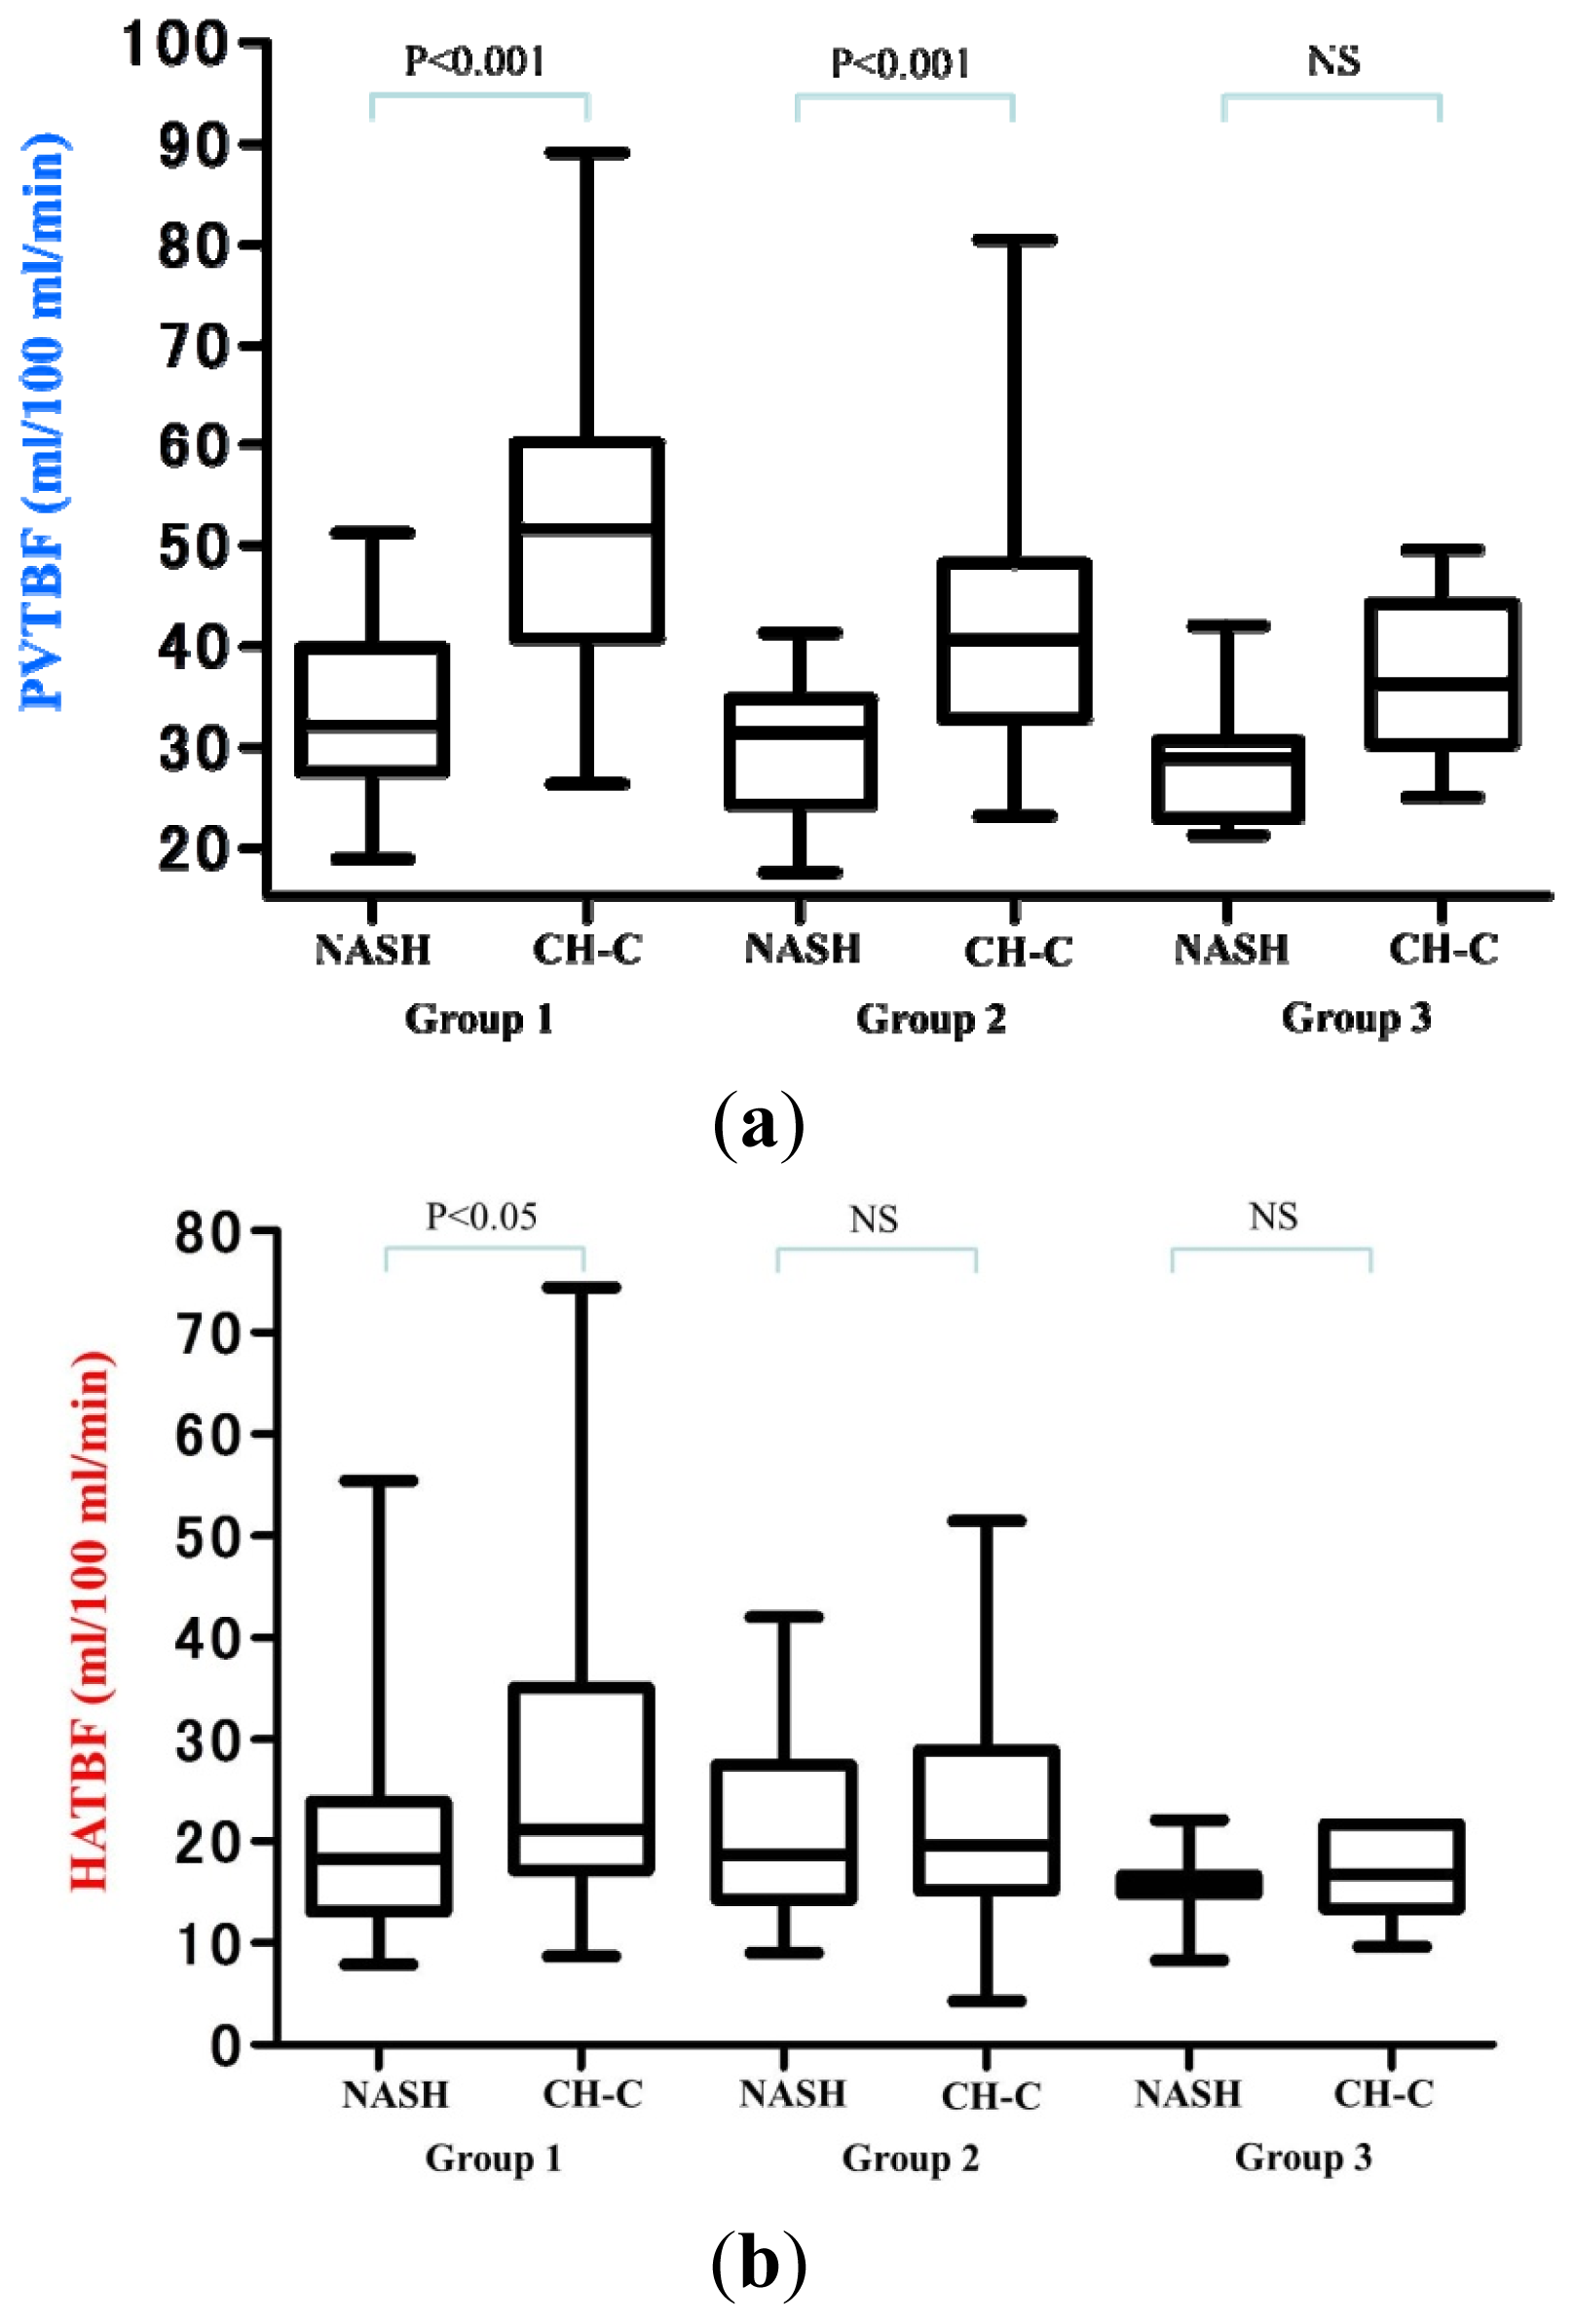
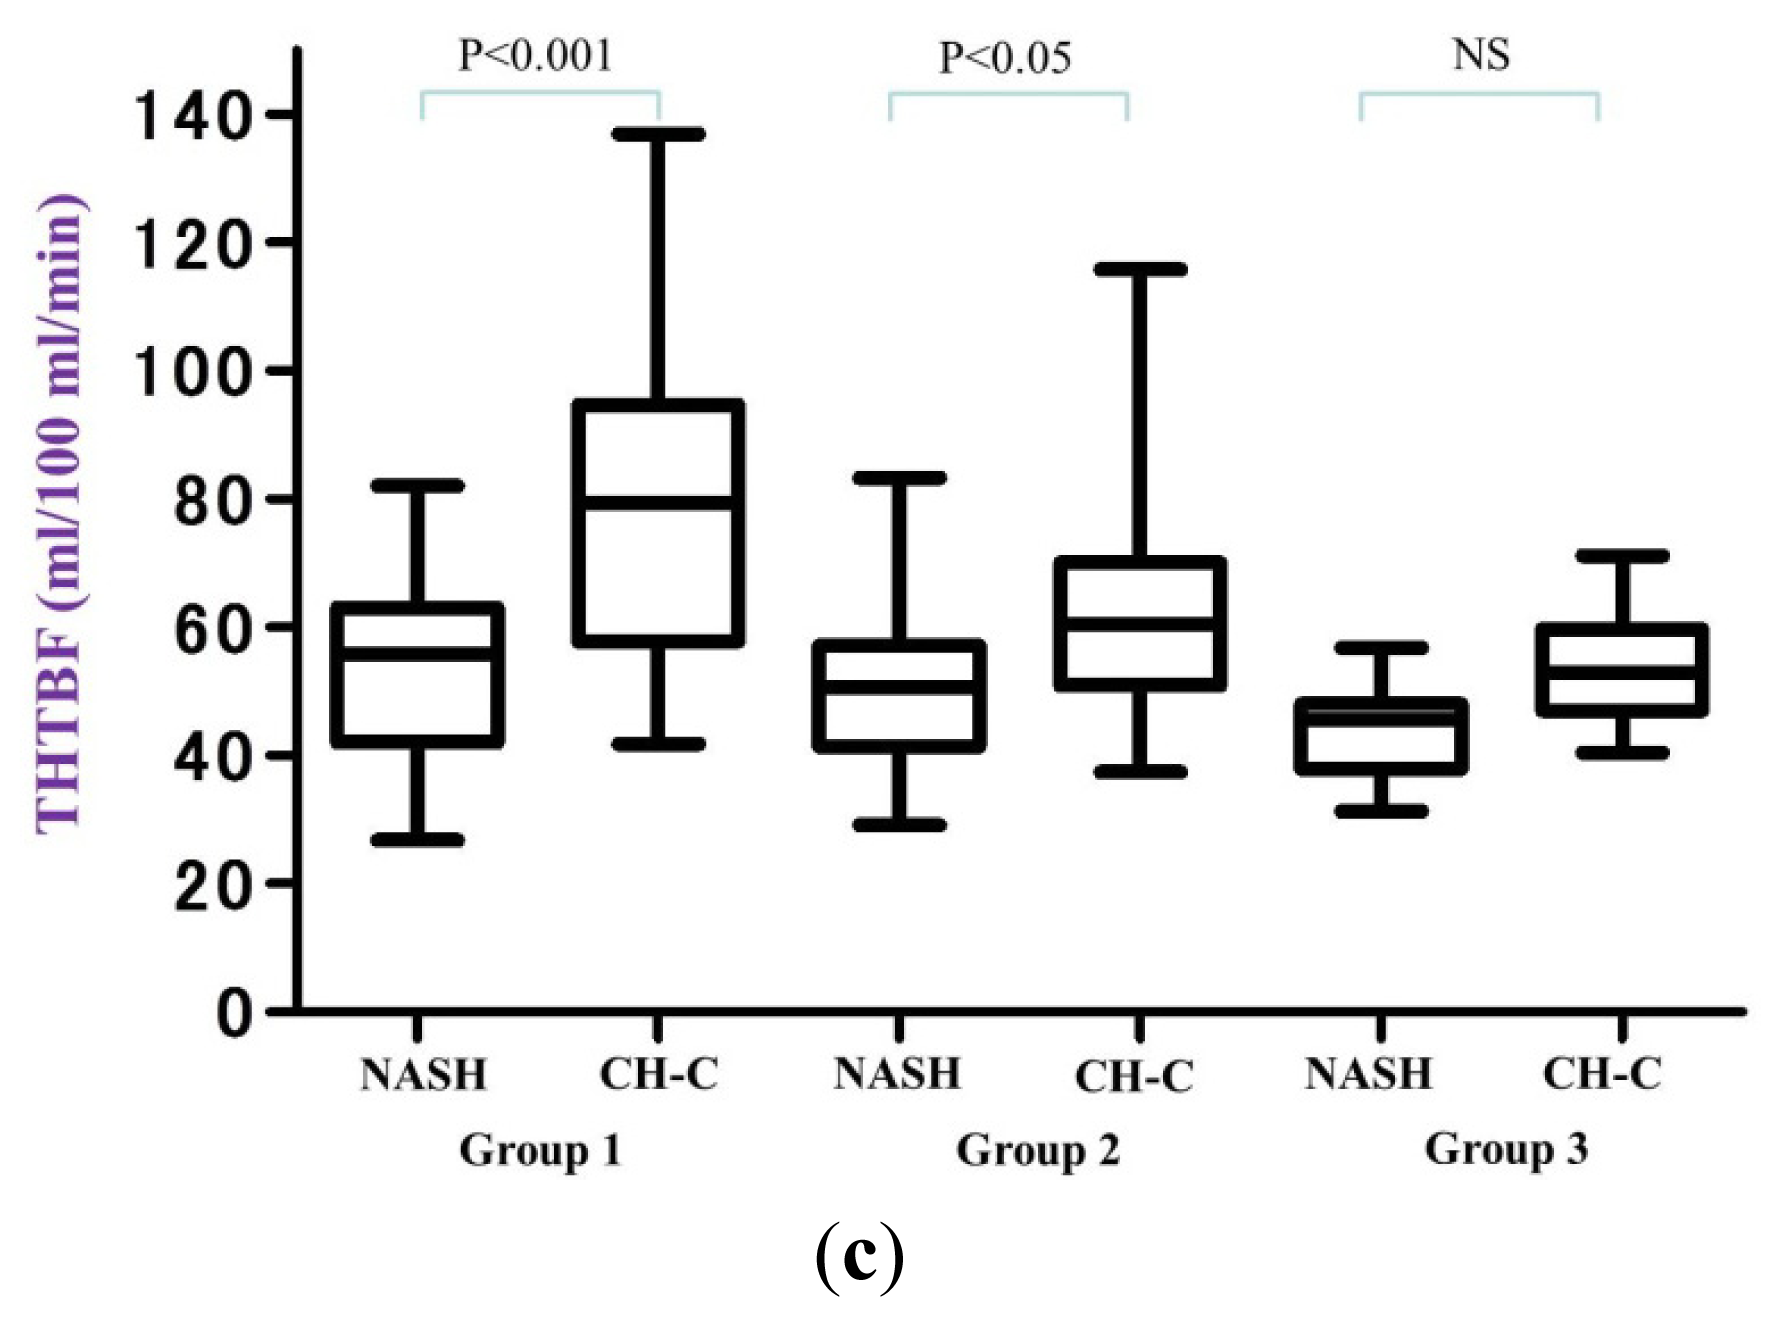
2.3. Hepatic TBF in Each Group
3. Discussion
4. Material and Methods
4.1. Patients
4.2. Imaging
4.3. Statistical Analysis
5. Conclusions
Acknowledgments
Conflicts of Interest
Abbreviations
| Xe-CT | Xenon computed tomography |
| TBF | Tissue blood flow |
| NAFLD | Nonalcoholic fatty liver disease |
| SS | Simple Steatosis |
| CH-C | Chronic hepatitis C |
| US | Ultrasonography |
| CT | Computed tomography |
| HATBF | Hepatic arterial tissue blood flow |
| PVTBF | Portal venous tissue blood flow |
| THTBF | Total hepatic tissue blood flow |
| LC | Liver cirrhosis |
| NASH | Nonalcoholic steatohepatitis |
References
- Annet, L.; Materne, R.; Danse, E.; Jamart, J.; Horsmans, Y.; van Beers, B.E. Hepatic flow parameters measured with MR imaging and Doppler US: Correlations with degree of cirrhosis and portal hypertension. Radiology 2003, 229, 409–414. [Google Scholar]
- Alpay, H.; Birsen, S.C.; Çetin, C.; Sener, C. Value of Doppler sonography in assessing the progression of chronic viral hepatitis and in the diagnosis and grading of cirrhosis. J. Ultrasound Med 2005, 24, 311–321. [Google Scholar]
- Ulusan, S.; Yakar, T.; Koc, Z. Evaluation of portal venous velocity with doppler ultrasound in patients with nonalcoholic fatty liver disease. Korean J. Radiol 2011, 12, 450–455. [Google Scholar]
- Ridolfi, F.; Abbattista, T.; Busilacchi, P.; Brunelli, E. Contrast-enhanced ultrasound evaluation of hepatic microvascular changes in liver diseases. World J. Gastroenterol 2012, 18, 5225–5230. [Google Scholar]
- Ronot, M.; Asselah, T.; Paradis, V.; Michoux, N.; Dorvillius, M.; Baron, G.; Marcellin, P.; van Beers, B.E.; Vilgrain, V. Liver fibrosis in chronic hepatitis C virus infection: Differentiating minimal from intermediate fibrosis with perfusion CT. Radiology 2010, 256, 135–142. [Google Scholar]
- Rold an-Alzate, A.; Frydrychowicz, A.; Niespodzany, E.; Landgraf, B.; Johnson, M.K.; Wieben, O.; Reeder, S.B. In vivo validation of 4D flow MRI for assessing the hemodynamics of portal hypertension. Magn. Reson. Imaging 2013, 37, 1100–1108. [Google Scholar]
- Chiandussi, L.; Greco, F.; Sardi, G.; Vaccarino, A.; Ferraris, C.M.; Curti, B. Estimation of hepatic arterial and portal venous blood flow by direct catheterization of the vena porta through the umbilical cord in man. Preliminary results. Acta Hepatosplenol 1968, 15, 166–171. [Google Scholar]
- Polasek, M.; Fuchs, C.B.; Uppal, R.; Schühle, T.D.; Alford, J.K.; Loving, S.G.; Yamada, S.; Wei, L.; Lauwers, G.Y.; Guimaraes, A.R.; et al. Molecular MR imaging of liver fibrosis: A feasibility study using rat and mouse models. J. Hepatol 2012, 57, 549–555. [Google Scholar]
- Ehling, J.; Bartneck, M.; Fech, V.; Butzbach, B.; Cesati, R.; Botnar, R.; Lammers, T.; Tacke, F. Elastin-based molecular MRI of liver fibrosis. Hepatology 2013, 58, 1517–1518. [Google Scholar]
- Johnson, D.W.; Stringer, W.A.; Marks, M.P.; Yonas, H.; Good, W.F.; Gur, D. Stable xenon CT cerebral blood flow imaging: Rationale for and role in clinical decision making. Am. J. Neuroradiol 1991, 12, 201–213. [Google Scholar]
- Gur, D.; Good, W.F.; Wolfson, S.K., Jr.; Yonas, H.; Shabason, L. In vivo mapping of local cerebral blood flow by xenonenhanced computed tomography. Science 1982, 215, 1267–1268. [Google Scholar]
- McCuskey, R.S.; Ito, Y.; Robertson, G.R.; McCuskey, M.K.; Perry, M.; Farrell, G.C. Hepatic microvascular dysfunction during evolution of dietary steatohepatitis in mice. Hepatology 2004, 40, 386–393. [Google Scholar]
- Schneider, A.R.J.; Teuber, G.; Kriener, S.; Caspary, W.F. Noninvasive assessment of liver steatosis, fibrosis and inflammation in chronic hepatitis C virus infection. Liver Int 2005, 25, 1150–1155. [Google Scholar]
- Lutz, H.H.; Gassler, N.; Tischendorf, F.W.; Trautwein, C.; Tischendorf, J.J. Doppler ultrasound of hepatic blood flow for noninvasive evaluation of liver fibrosis compared with liver biopsy and transient elastography. Dig. Dis. Sci 2012, 57, 2222–2230. [Google Scholar]
- Ikeda, H.; Suzuki, M.; Kobayashi, M.; Takahashi, H.; Matsumoto, N.; Maeyama, S.; Iino, S.; Sase, S.; Itoh, F. Xenon computed tomography shows hemodynamic change during the progression of chronic hepatitis C. Hepatol. Res 2007, 37, 104–112. [Google Scholar]
- Kobayashi, M.; Suzuki, M.; Ikeda, H.; Takahashi, H.; Matsumoto, N.; Maeyama, S.; Sase, S.; Iino, S.; Itoh, F. Assessment of hepatic steatosis and hepatic tissue blood flow by xenon computed tomography in nonalcoholic steatohepatitis. Hepatol. Res 2009, 39, 31–39. [Google Scholar]
- Shigefuku, R.; Takahashi, H.; Kobayashi, M.; Ikeda, H.; Matsunaga, K.; Okuse, C.; Matsumoto, N.; Maeyama, S.; Sase, S.; Suzuki, M.; et al. Pathophysiological analysis of nonalcoholic fatty liver disease by evaluation of fatty liver changes and blood flow using xenon computed tomography: Can early-stage nonalcoholic steatohepatitis be distinguished from simple steatosis? J. Gastroenterol 2012, 47, 1238–1247. [Google Scholar]
- Takahashi, H.; Suzuki, M.; Ikeda, H.; Kobayashi, M.; Sase, S.; Yotsuyanagi, H.; Maeyama, S.; Iino, S.; Itoh, F. Evaluation of quantitative portal venous, hepatic arterial, and total hepatic tissue blood flow using xenon CT in alcoholic liver cirrhosis—Comparison with liver cirrhosis related to hepatitis C virus and nonalcoholic steatohepatitis. Alcohol. Clin. Exp. Res 2010, 34, S7–S13. [Google Scholar]
- Takahashi, H.; Suzuki, M.; Ikeda, H.; Kobayashi, M.; Sase, S.; Yotsuyanagi, H.; Maeyama, S.; Iino, S.; Itoh, F. Evaluation of quantitative portal venous, hepatic arterial, and total hepatic tissue blood flow using xenon CT in alcoholic liver cirrhosis: Comparison with liver cirrhosis C. Alcohol. Clin. Exp. Res 2007, 31, S43–S48. [Google Scholar]
- Takahashi, H.; Suzuki, M.; Shigefuku, R.; Okano, M.; Hiraishi, T.; Takagi, R.; Noguchi, Y.; Hattori, N.; Hatsugai, M.; Nakahara, K.; et al. Xenon computed tomography can evaluate the improvement of hepatic hemodynamics before and after endoscopic injection sclerotherapy. J. Gastroenterol 2013, 48, 1353–1361. [Google Scholar]
- Flavia, D.M.; Suzuki, A.; Sanderson, S.O.; Lindor, K.D.; Angulo, P. Prevalence and indicators of portal hypertension in patients with nonalcoholic fatty liver disease. Clin. Gastroenterol. Hepatol 2012, 10, 1028–1033. [Google Scholar]
- Seifalian, A.M.; Mallet, S.V.; Rolles, K.; Davidson, B.R. Hepatic microcirculation during human orthotopic liver transplantation. Br. J. Surg 1997, 84, 1391–1395. [Google Scholar]
- Seifalian, A.M.; Chidambaram, V.; Rolles, K.; Davidson, B.R. In vivo demonstration of impaired microcirculation in steatotic human liver grafts. Liver Transpl. Surg 1998, 4, 71–77. [Google Scholar]
- Seifalian, A.M.; Piasecki, C.; Agarwal, A.; Davidson, B.R. The effect of graded steatosis on flow in the hepatic parenchymal microcirculation. Transplantation 1999, 68, 780–784. [Google Scholar]
- Samia, I.; Wenxuan, Y.; Winslet, M.C.; Alexander, M.; Seifalian, A.M. Impairment of hepatic microcirculation in fatty liver. Microcirculation 2003, 10, 447–456. [Google Scholar]
- Hayashi, N.; Kasahara, A.; Kurosawa, K.; Sasaki, Y.; Fusamoto, H.; Sato, N.; Kamada, T. Oxygen supply to the liver in patients with alcoholic liver disease assessed by organ-reflectance spectrophotometry. Gastroenterology 1985, 88, 881–886. [Google Scholar]
- Andersen, A.M.; Ladefoged, J. Partition coefficient of 133-xenon between various tissues and blood in vivo. Scand. J. Clin. Lab. Investig. 1967, 19, 72–78. [Google Scholar]
- Steward, A.; Allott, P.R.; Cowles, A.L.; Mapleson, W.W. Solubility coefficients for inhaled anaesthetics for water, oil and biological media. Br. J. Anaesth 1973, 45, 282–293. [Google Scholar]
- Gulberg, V.; Haag, K.; Rossle, M.; Gerbes, A.L. Hepatic arterial buffer response in patients with advanced cirrhosis. Hepatology 2002, 35, 630–634. [Google Scholar]
- Richter, S.; Mucke, I.; Menger, M.D.; Vollmar, B. Impact of intrinsic blood flow regulation in cirrhosis: Maintenance of hepatic arterial buffer response. Am. J. Physiol. Gastrointest. Liver Physiol 2000, 279, G454–G462. [Google Scholar]
- Pasarin, M.; Abraldes, J.G.; Rodriguez-Vilarrupla, A.; La Mura, V.; Garcia-Pagan, J.C.; Bosch, J. Insulin resistance and liver microcirculation in a rat model of early NAFLD. J. Hepatol 2011, 55, 1095–1102. [Google Scholar]
- Mitsuoka, H.; Suzuki, S.; Sakaguchi, T.; Baba, S.; Miwa, M.; Konno, H.; Nakamura, S. Contribution of endothelin-1 to microcirculatory impairment in total hepatic ischemia and reperfusion injury. Transplantation 1999, 67, 514–520. [Google Scholar]
- Katagiri, H.; Ito, Y.; Ito, S.; Murata, T.; Yukihiko, S.; Narumiya, S.; Watanabe, M.; Majima, M. TNF-alpha induces thromboxane receptor signaling-dependent microcirculatory dysfunction in mouse liver. Shock 2008, 30, 463–467. [Google Scholar]
- Vollmar, B.; Menger, M.D. The hepatic microcirculation: Mechanistic contributions and therapeutic targets in liver injury and repair. Physiol. Rev 2009, 89, 1269–1339. [Google Scholar]
- Brunt, E.M.; Janney, C.G.; di Bisceglie, A.M.; Neuschwander-Tetri, B.A.; Bacon, B.R. Non-alcoholic steatohepatitis: A proposal for grading and staging the histological lesions. Am. J. Gastroenterol 1999, 94, 2467–2474. [Google Scholar]
- Desmet, V.J.; Gerber, M.; Hoofnagle, J.H.; Manns, M.; Scheuer, P.J. Classification of chronic hepatitis: Diagnosis, grading and staging. Hepatology 1994, 19, 1513–1520. [Google Scholar]
- Sase, S.; Monden, M.; Oka, H.; Dono, K.; Fukuta, T.; Shibata, I. Hepatic blood flow measurements with arterial and portal blood flow mapping in the human liver by means of xenon CT. J. Comput. Assist. Tomogr 2002, 26, 243–249. [Google Scholar]
- Sase, S.; Takahashi, H.; Ikeda, H.; Kobayashi, M.; Matsumoto, N.; Suzuki, M. Determination of time-course change rate for arterial xenon using the time course of tissue xenon concentration in xenonenhanced computed tomography. Med. Phys 2008, 35, 2331–2338. [Google Scholar]


| SS (n = 12) | Stage 1 (n = 27) | Stage 2 (n = 24) | Stage 3 (n = 14) | Stage 4A (n = 11) | Stage 4B (n = 5) | |
|---|---|---|---|---|---|---|
| PVTBF | 41.83 ± 6.33 | 34.54 ± 7.57 | 33.57 ± 7.57 | 29.99 ± 6.91 | 28.88 ± 5.73 | 22.36 ± 4.44 |
| HATBF | 25.48 ± 8.97 | 23.10 ± 11.14 | 17.47 ± 7.28 | 20.58 ± 8.61 | 18.99 ± 7.26 | 14.02 ± 4.88 |
| THTBF | 67.31 ± 13.03 | 57.64 ± 14.11 | 51.04 ± 12.57 | 50.56 ± 13.86 | 47.87 ± 9.75 | 36.38 ± 8.85 |
| Stage 1 (n = 34) | Stage 2 (n = 29) | Stage 3 (n = 21) | Stage 4A (n = 14) | Stage 4B (n = 11) | |
|---|---|---|---|---|---|
| PVTBF | 52.56 ± 13.55 | 41.70 ± 12.91 | 39.61 ± 8.79 | 34.39 ± 9.33 | 29.86 ± 6.46 |
| HATBF | 26.82 ± 15.65 | 22.36 ± 8.14 | 19.84 ± 11.89 | 18.67 ± 9.57 | 20.26 ± 17.79 |
| THTBF | 79.38 ± 22.88 | 64.07 ± 16.14 | 59.45 ± 13.22 | 53.06 ± 11.89 | 50.12 ± 17.00 |
| NASH (n = 72) | CH-C (n = 90) | p value | ||
|---|---|---|---|---|
| n = 51 | Group 1 | n = 34 | ||
| PVTBF | 34.08 ± 7.51 | 52.56 ± 13.55 | p < 0.001 | |
| HATBF | 20.45 ± 9.85 | 26.82 ± 15.65 | 0.024 | |
| THTBF | 54.53 ± 13.69 | 79.38 ± 22.88 | p < 0.001 | |
| n = 14 | Group 2 | n = 50 | ||
| PVTBF | 29.99 ± 6.91 | 40.85 ± 11.35 | p < 0.001 | |
| HATBF | 20.58 ± 8.61 | 21.33 ± 9.81 | 0.796 | |
| THTBF | 50.56 ± 13.86 | 62.18 ± 15.05 | 0.012 | |
| n = 7 | Group 3 | n = 6 | ||
| PVTBF | 28.74 ± 6.78 | 36.93 ± 8.50 | 0.079 | |
| HATBF | 15.63 ± 4.04 | 16.83 ± 4.65 | 0.627 | |
| THTBF | 44.37 ± 8.01 | 53.77 ± 10.10 | 0.088 | |
| NAFLD | CH-C | |
|---|---|---|
| Number of cases | 93 | 109 |
| Gender (Male/Female) | 58/35 | 55/54 |
| Age (years) | 52.3 ± 16.0 | 58.9 ± 10.9 |
| BMI (kg/m2) | 28.7 ± 4.5 ※ | 23.7 ± 3.6 |
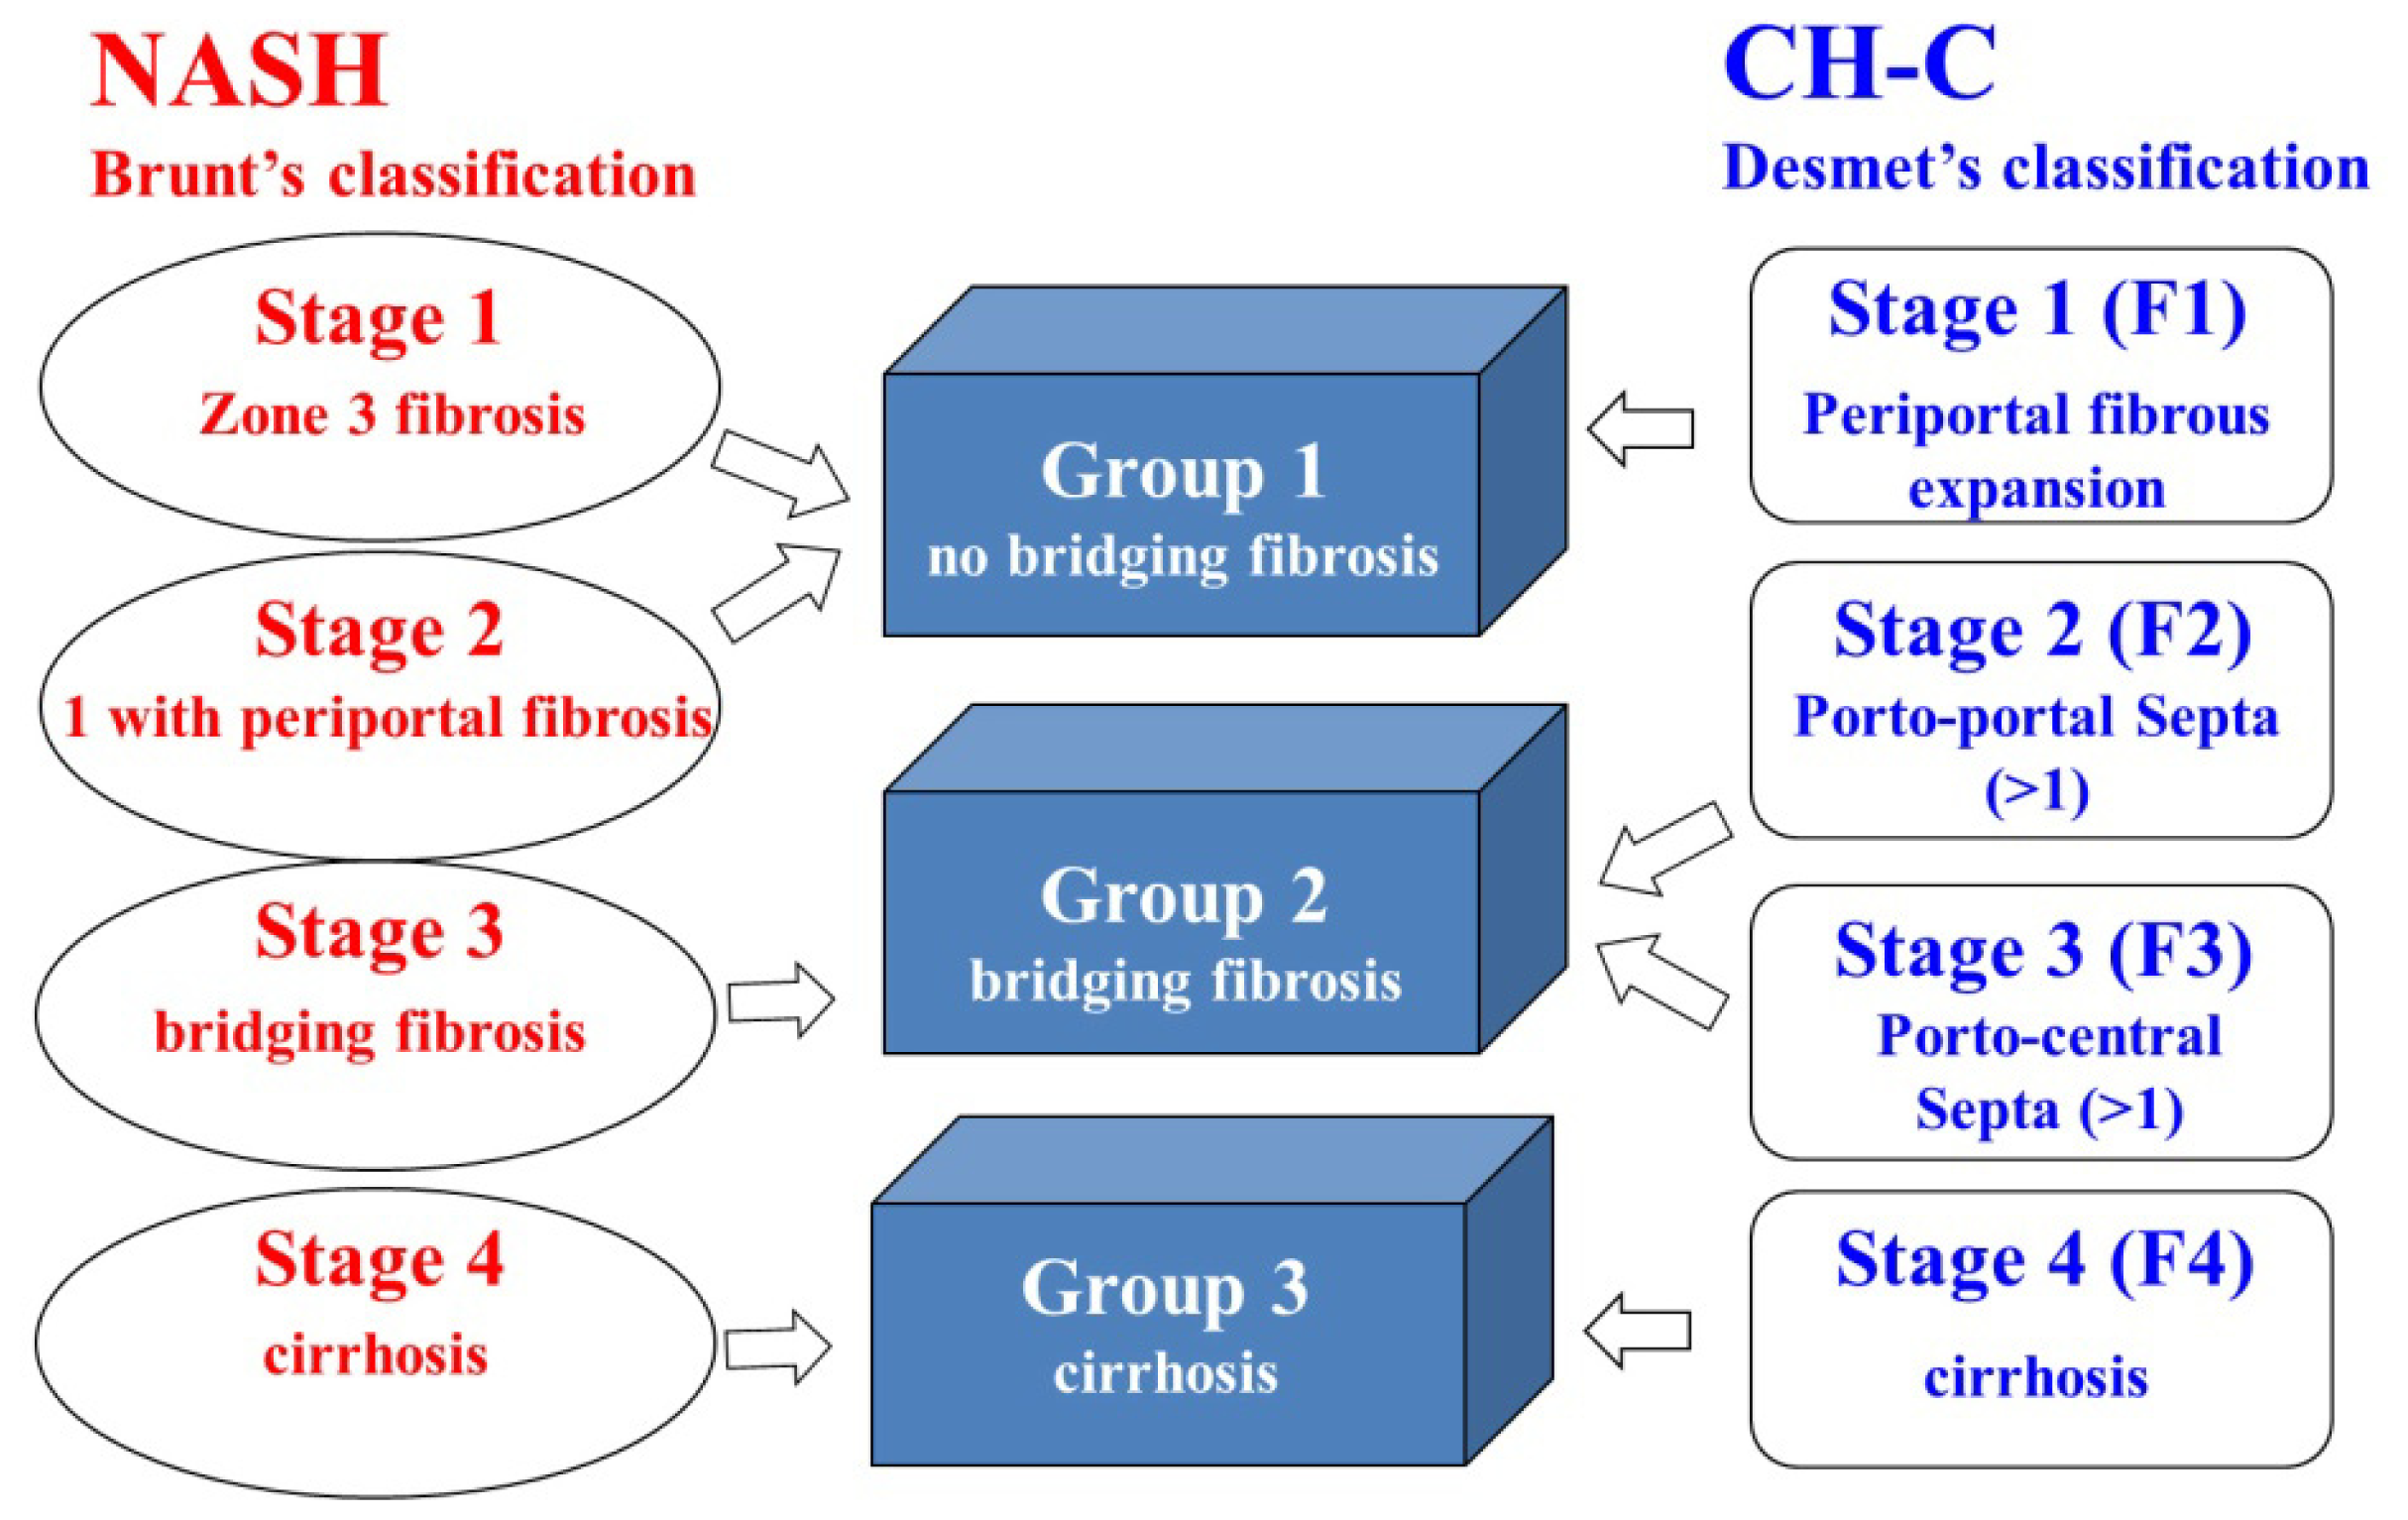
| Staging for fibrosis | 12/27/24/14/11/5 | 34/29/21/14/11 |
| SS/Stage 1/2/3/4A/4B (Brunt’s classification ) | Stage 1/2/3/4A/4B (Desmet’s classification ) |
© 2014 by the authors; licensee MDPI, Basel, Switzerland This article is an open access article distributed under the terms and conditions of the Creative Commons Attribution license (http://creativecommons.org/licenses/by/3.0/).
Share and Cite
Shigefuku, R.; Takahashi, H.; Kato, M.; Yoshida, Y.; Suetani, K.; Noguchi, Y.; Hatsugai, M.; Nakahara, K.; Ikeda, H.; Kobayashi, M.; et al. Evaluation of Hepatic Tissue Blood Flow Using Xenon Computed Tomography with Fibrosis Progression in Nonalcoholic Fatty Liver Disease: Comparison with Chronic Hepatitis C. Int. J. Mol. Sci. 2014, 15, 1026-1039. https://doi.org/10.3390/ijms15011026
Shigefuku R, Takahashi H, Kato M, Yoshida Y, Suetani K, Noguchi Y, Hatsugai M, Nakahara K, Ikeda H, Kobayashi M, et al. Evaluation of Hepatic Tissue Blood Flow Using Xenon Computed Tomography with Fibrosis Progression in Nonalcoholic Fatty Liver Disease: Comparison with Chronic Hepatitis C. International Journal of Molecular Sciences. 2014; 15(1):1026-1039. https://doi.org/10.3390/ijms15011026
Chicago/Turabian StyleShigefuku, Ryuta, Hideaki Takahashi, Masaki Kato, Yoshihito Yoshida, Keigo Suetani, Yohei Noguchi, Moriaki Hatsugai, Kazunari Nakahara, Hiroki Ikeda, Minoru Kobayashi, and et al. 2014. "Evaluation of Hepatic Tissue Blood Flow Using Xenon Computed Tomography with Fibrosis Progression in Nonalcoholic Fatty Liver Disease: Comparison with Chronic Hepatitis C" International Journal of Molecular Sciences 15, no. 1: 1026-1039. https://doi.org/10.3390/ijms15011026
APA StyleShigefuku, R., Takahashi, H., Kato, M., Yoshida, Y., Suetani, K., Noguchi, Y., Hatsugai, M., Nakahara, K., Ikeda, H., Kobayashi, M., Matsunaga, K., Matsumoto, N., Okuse, C., Itoh, F., Maeyama, S., Sase, S., & Suzuki, M. (2014). Evaluation of Hepatic Tissue Blood Flow Using Xenon Computed Tomography with Fibrosis Progression in Nonalcoholic Fatty Liver Disease: Comparison with Chronic Hepatitis C. International Journal of Molecular Sciences, 15(1), 1026-1039. https://doi.org/10.3390/ijms15011026