Article

GPC1 Regulated by miR-96-5p, Rather than miR-182-5p, in Inhibition of Pancreatic Carcinoma Cell Proliferation

1
Department of Hepatopancreatobiliary Surgery, Second Affiliated Hospital of Harbin Medical University, Harbin 150081, China
2
Department of Laboratory Diagnostics, Fourth Affiliated Hospital of Harbin Medical University, Harbin 150001, China
3
Department of Hepatopancreatobiliary Surgery, Second Affiliated Hospital of Zhejiang University School of Medicine, Hangzhou 310009, China
*
Author to whom correspondence should be addressed.
Int. J. Mol. Sci. 2014, 15(4), 6314-6327; https://doi.org/10.3390/ijms15046314
Submission received: 24 December 2013 / Revised: 9 March 2014 / Accepted: 18 March 2014 / Published: 14 April 2014
(This article belongs to the Section Biochemistry)

Abstract

:
To determine the relationships between miR-96-5p/-182-5p and GPC1 in pancreatic cancer (PC), we conducted the population and in vitro studies. We followed 38 pancreatic cancer patients, measured and compared the expression of miR-96-5p/-182-5p, GPC1, characteristics and patients’ survival time of different miR-96-5p/-182-5p expression levels in PC tissues. In an in vitro study, we investigated the proliferation, cycle and apotosis in cells transfected with mimics/inhibitors of the two miRNAs, and determine their effects on GPC1 by dual-luciferase assay. In the follow-up study, we found that the expressions of miR-96-5p/-182-5p were lower/higher in PC tissues; patients with lower/higher levels of miR-96-5p/-182-5p suffered poorer characteristics and decreased survival time. In the in vitro study, the expressions of miR-96-5p/-182-5p were different in cells. Proliferation of cells transfected with miR-96-5p mimics/inhibitors was lower/higher in Panc-1/BxPC-3; when transfected with miR-182-5p mimics/inhibitors, proliferation of cells were higher/lower in AsPC-1/Panc-1. In a cell cycle study, panc-1 cells transfected with miR-96-5p mimics was arrested at G0/G1; BxPC-3 cells transfected with miR-96-5p inhibitors showed a significantly decrease at G0/G1; AsPC-1 cells transfected with miR-182-5p mimics was arrested at S; Panc-1 cells transfected with miR-182-5p inhibitors showed a decrease at S. MiR-96-5p mimics increased the apoptosis rate in Panc-1 cells, and its inhibitors decreased the apoptosis rate in BxPC-3. Dual luciferase assay revealed that GPC1 was regulated by miR-96-5p, not -182-5p. We found that miR-96-5p/-182-5p as good markers for PC; miR-96-5p, rather than -182-5p, inhibits GPC1 to suppress proliferation of PC cells.

1. Introduction

Pancreatic cancer (PC) usually refers to the pancreatic ductal adenocarcinoma, with high incidences of tumor recurrence and metastasis. PC is currently the fourth most common cause of cancer-related mortality in Western societies, and an overall five-year survival rate among patients with PC is less than 5% [1,2].
Heparan sulfate proteoglycan glypican-1 (GPC1) and GPC3 are members of heparan sulfate proteoglycans (HSPG) family, which are ubiquitous proteins attached to the extracytoplasmic surface of the cell membrane. Recently, GPC1 and GPC3 were found to be predictor and target for some cancers [3,4], including PC [58]. It has been verified that miRNAs, miR-96-5p and -182-5p, could regulate expression of GPC3 [9,10]. However, the regulators of GPC1 are still unknown.
Recently, a new batch of endogenous small non-coding regulatory RNAs, the microRNAs (miRNAs), has been paid attention to the cancer development. In human carcinoma tissue, emerging evidence has shown that miRNA-induced regulation contributes to maintain a biological process of the proliferation, differentiation, and apoptosis [11]. MiRNAs are key negative regulators of gene expression by binding to the 3′-untranslated region (3′-UTR) of corresponding target messenger RNAs (mRNAs) [12]. Recently, miR-96-5p and -182-5p, were found as the upstream regulators for some cancers, such as prostate cancer [13], breast cancer [14], bladder cancer [15], and medulloblastoma [16]. Specifically, miR-96-5p was found down regulated in PC [17,18], but miR-182-5p has not been studied in PC yet. In addition, it is still unknown with whether these miRNAs could also regulate the expression of GPC1.
Based on the close relationships between GPC3, miR-96-5p, -182-5p, and cancers, we made a hypothesis that miR-96-5p and/or -182-5p might regulate GPC1 expression in the development of PC.
Therefore, in this study we aim to clarify three issues: (1) whether miR-96-5p and/or -182-5p could regulate GPC1 in PC; (2) whether miR-182-5p plays a role in PC; and (3) to validate the effect of miR-96-5p in PC.

2. Results and Discussion

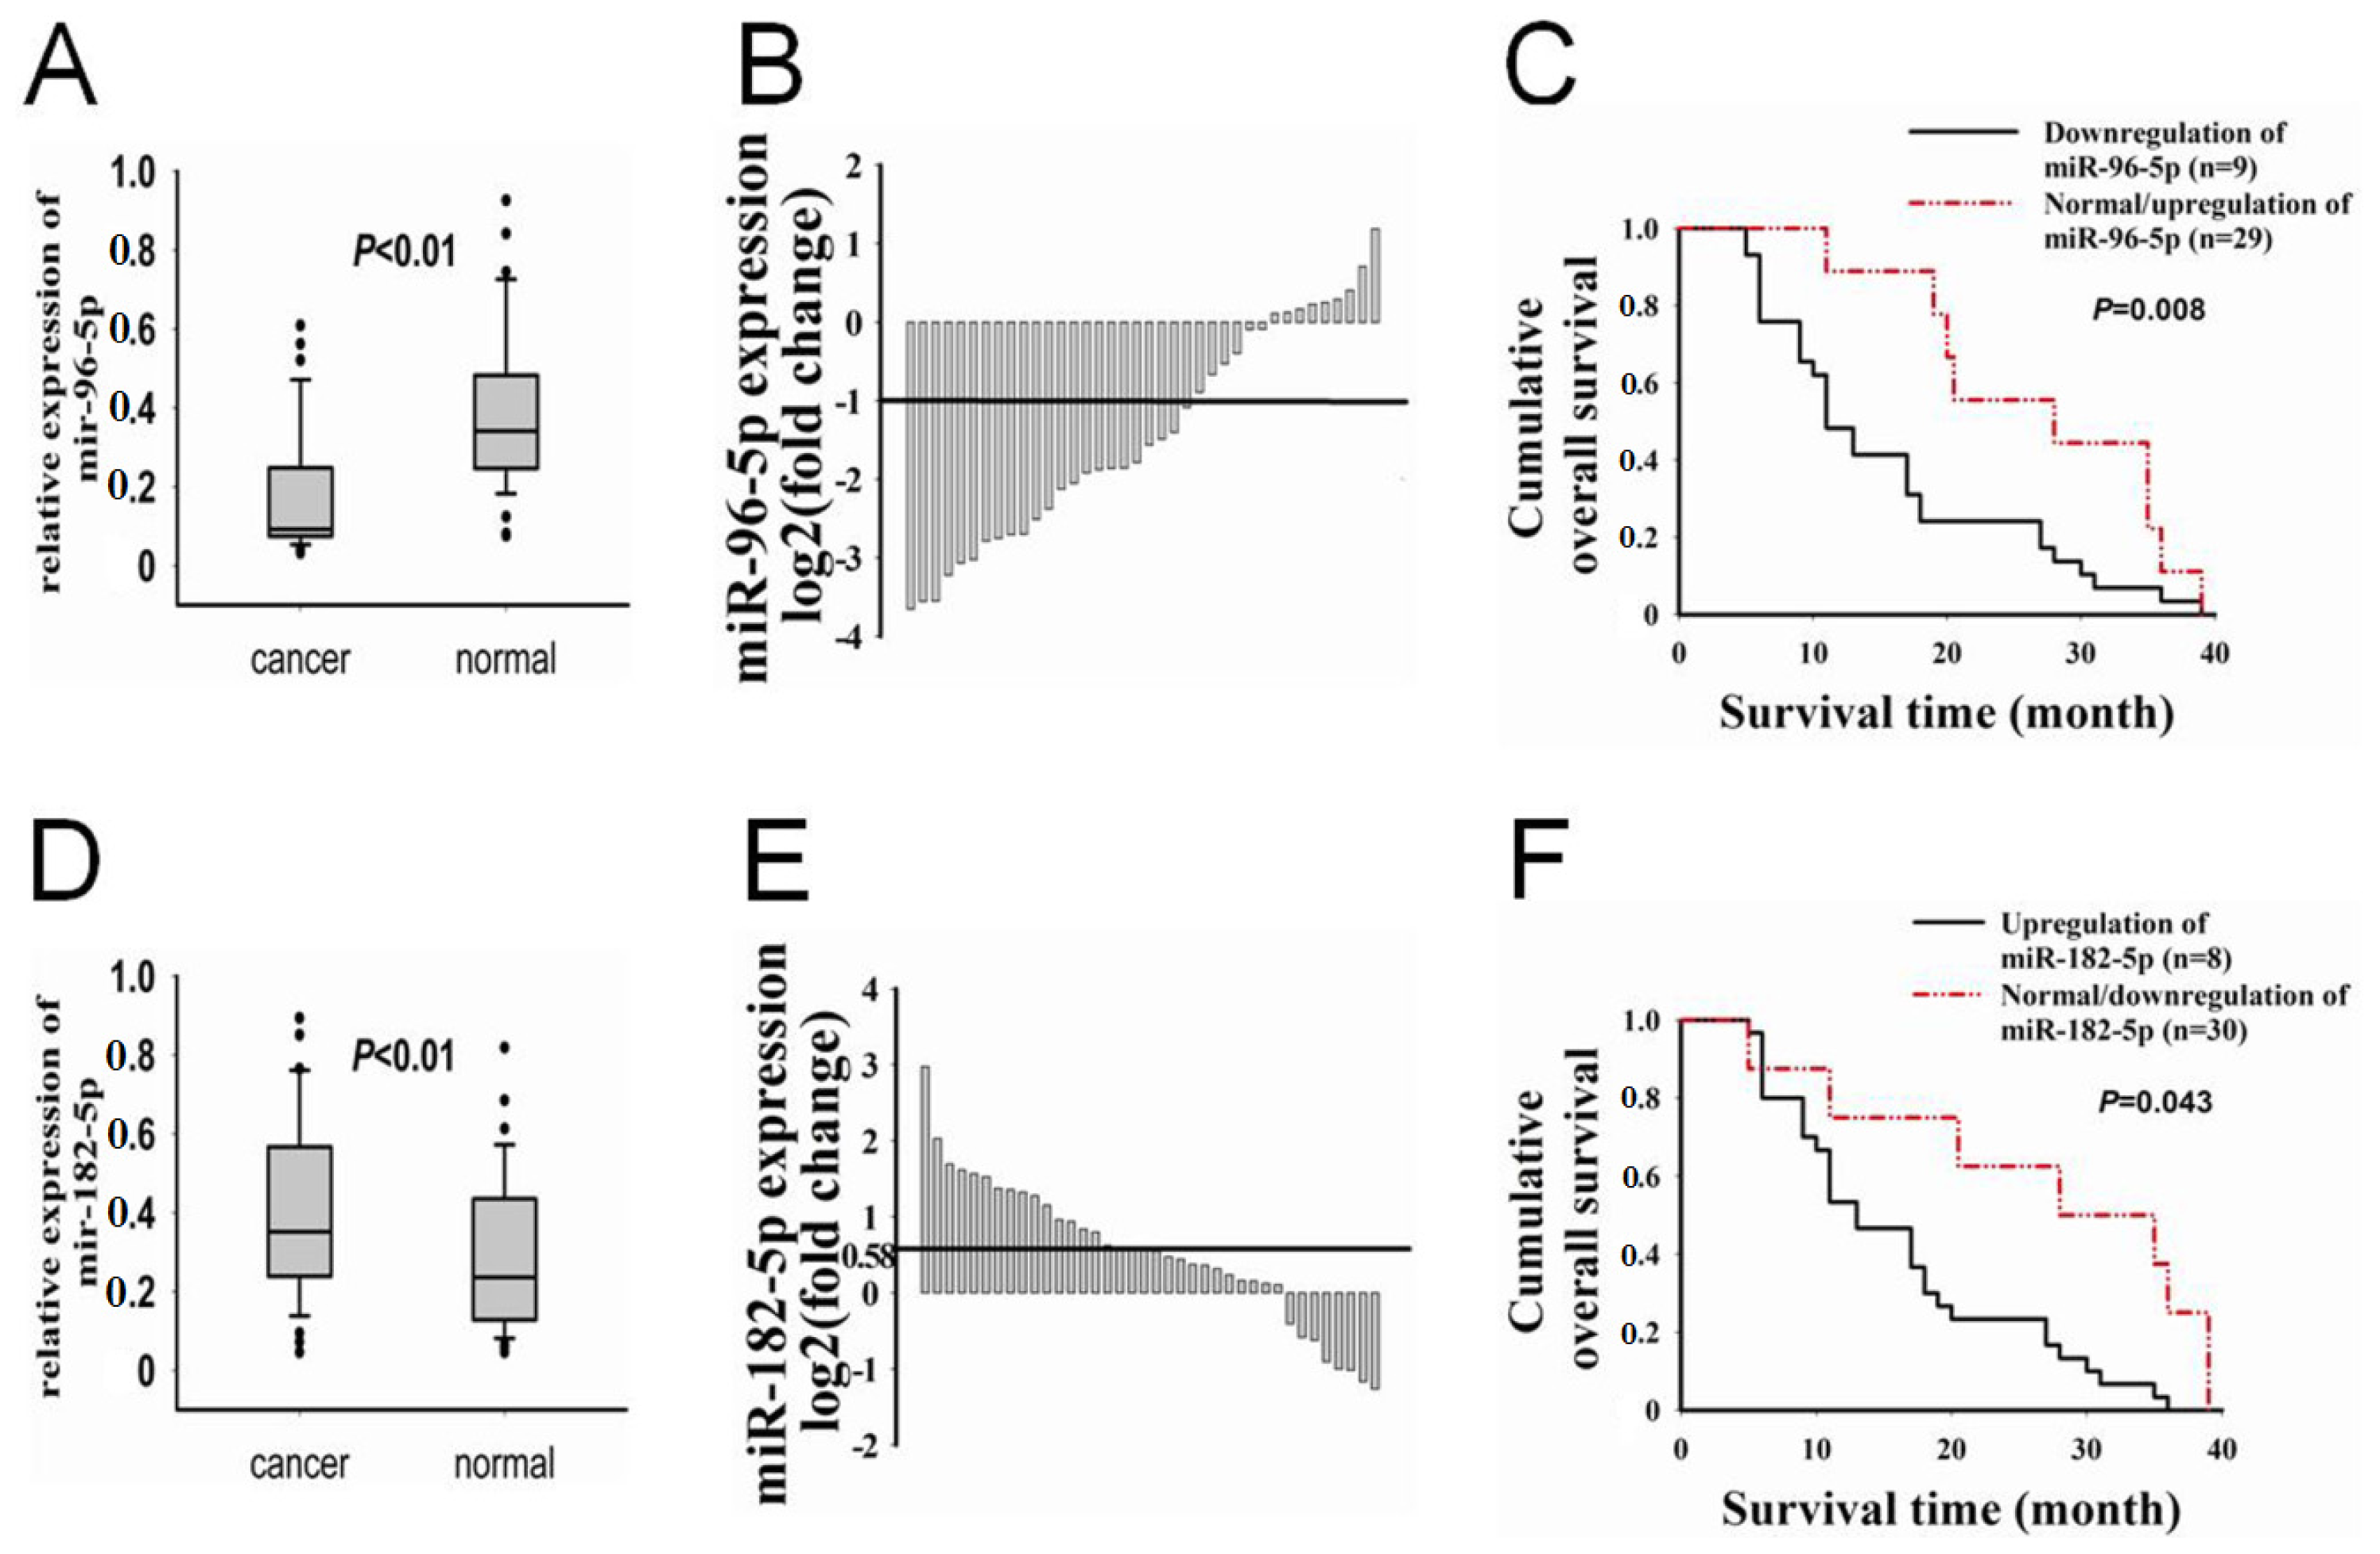
2.1. The Correlations between Expression of miR-96-5p, -182-5p and GPC1 Expression, Clinicopathological Characteristics of PC

In this study, the expression levels of miR-96-5p in the 38 (100%) pairs of PC tissue and matched non-tumor adjacent tissue were determined by qRT-PCR, with snRNA U6 as the endogenous control. We found that miR-96-5p expression was significantly down regulated in PC samples (p < 0.01). The median miR-96-5p expression level in PC tissues was two-fold lower than that of the non-tumor adjacent tissues (median expression 0.176 vs. 0.387, respectively) (Figure 1A). Among the 38 PC patients, 23 (60.53%) showed a reduction in the miR-96-5p level (a reducted miR-96-5p level was defined as expression decreased more than 50% relative to the matched non-tumor adjacent tissues, which was >1 cm from the pancreatic carcinoma) (Figure 1B). We then analyzed the correlations between miR-96-5p expression and clinicpathological characteristics. The patients with lower levels of miR-96-5p expression tended to suffer larger tumor sizes (larger tumor size was defined as ≥2 cm; p = 0.029; Table 1) and poorer differentiation (p = 0.034; Table 1), and there was no significant correlation between miR-96-5p expression and other clinicpathological characteristics. Further, to determine the relationship between miR-96-5p expression and prognosis of PC, we analyzed the data of the three-year-survival time in PC patients. The Kaplan-Meier analysis showed that down regulated expression of miR-96-5p was associated with a decreased survival (Figure 1C). Specifically, the median overall survival time was 16.0 and 27.0 months in miR-96-5p downregulation and normal/upregulation groups, respectively (p = 0.008, log-rank test).
In contrast with miR-96-5p, expression of miR-182-5p was up regulated in tissues of PC patients (p < 0.01). The median miR-182-5p expression level in PC tissues and non-tumor adjacent tissues was 0.403 vs. 0.294, respectively (Figure 1D). Among the 38 PC patients, 17 (44.73%) showed a rise in the miR-182-5p level (a reducted miR-96-5p level was defined as expression decreased more than 50% relative to the matched non-tumor adjacent tissues) (Figure 1E). The patients with higher levels of miR-182-5p expression tended to suffer poorer differentiation (p = 0.007; Table 1). The Kaplan-Meier analysis showed that up regulated expression of miR-182-5p was associated with a decreased survival (Figure 1F). The median overall survival time was 16.0 and 26.0 months in miR-182-5p upregulation and normal/downregulation groups, respectively (p = 0.043, log-rank test).
To confirm the correlations between the expression of miR-96-5p and -182-5p and GPC1 expression in PC tissue samples, we measured GPC1 protein levels in 38 PC tissues using immunohistochemistry. The expressions of GPC1 were defined as normal/underexpression (−/+) and overexpression (++/+++). GPC1 of 25 PC tissues were overexpressed in 38 cases (65.79%), and we observed an inverse correlation between the expression of miR-96-5p and GPC1 protein in PC tissue samples (r = −0.381, p = 0.018) (Table 2). However, the correlation between the expression of miR-182-5p and GPC1 protein was not significant.

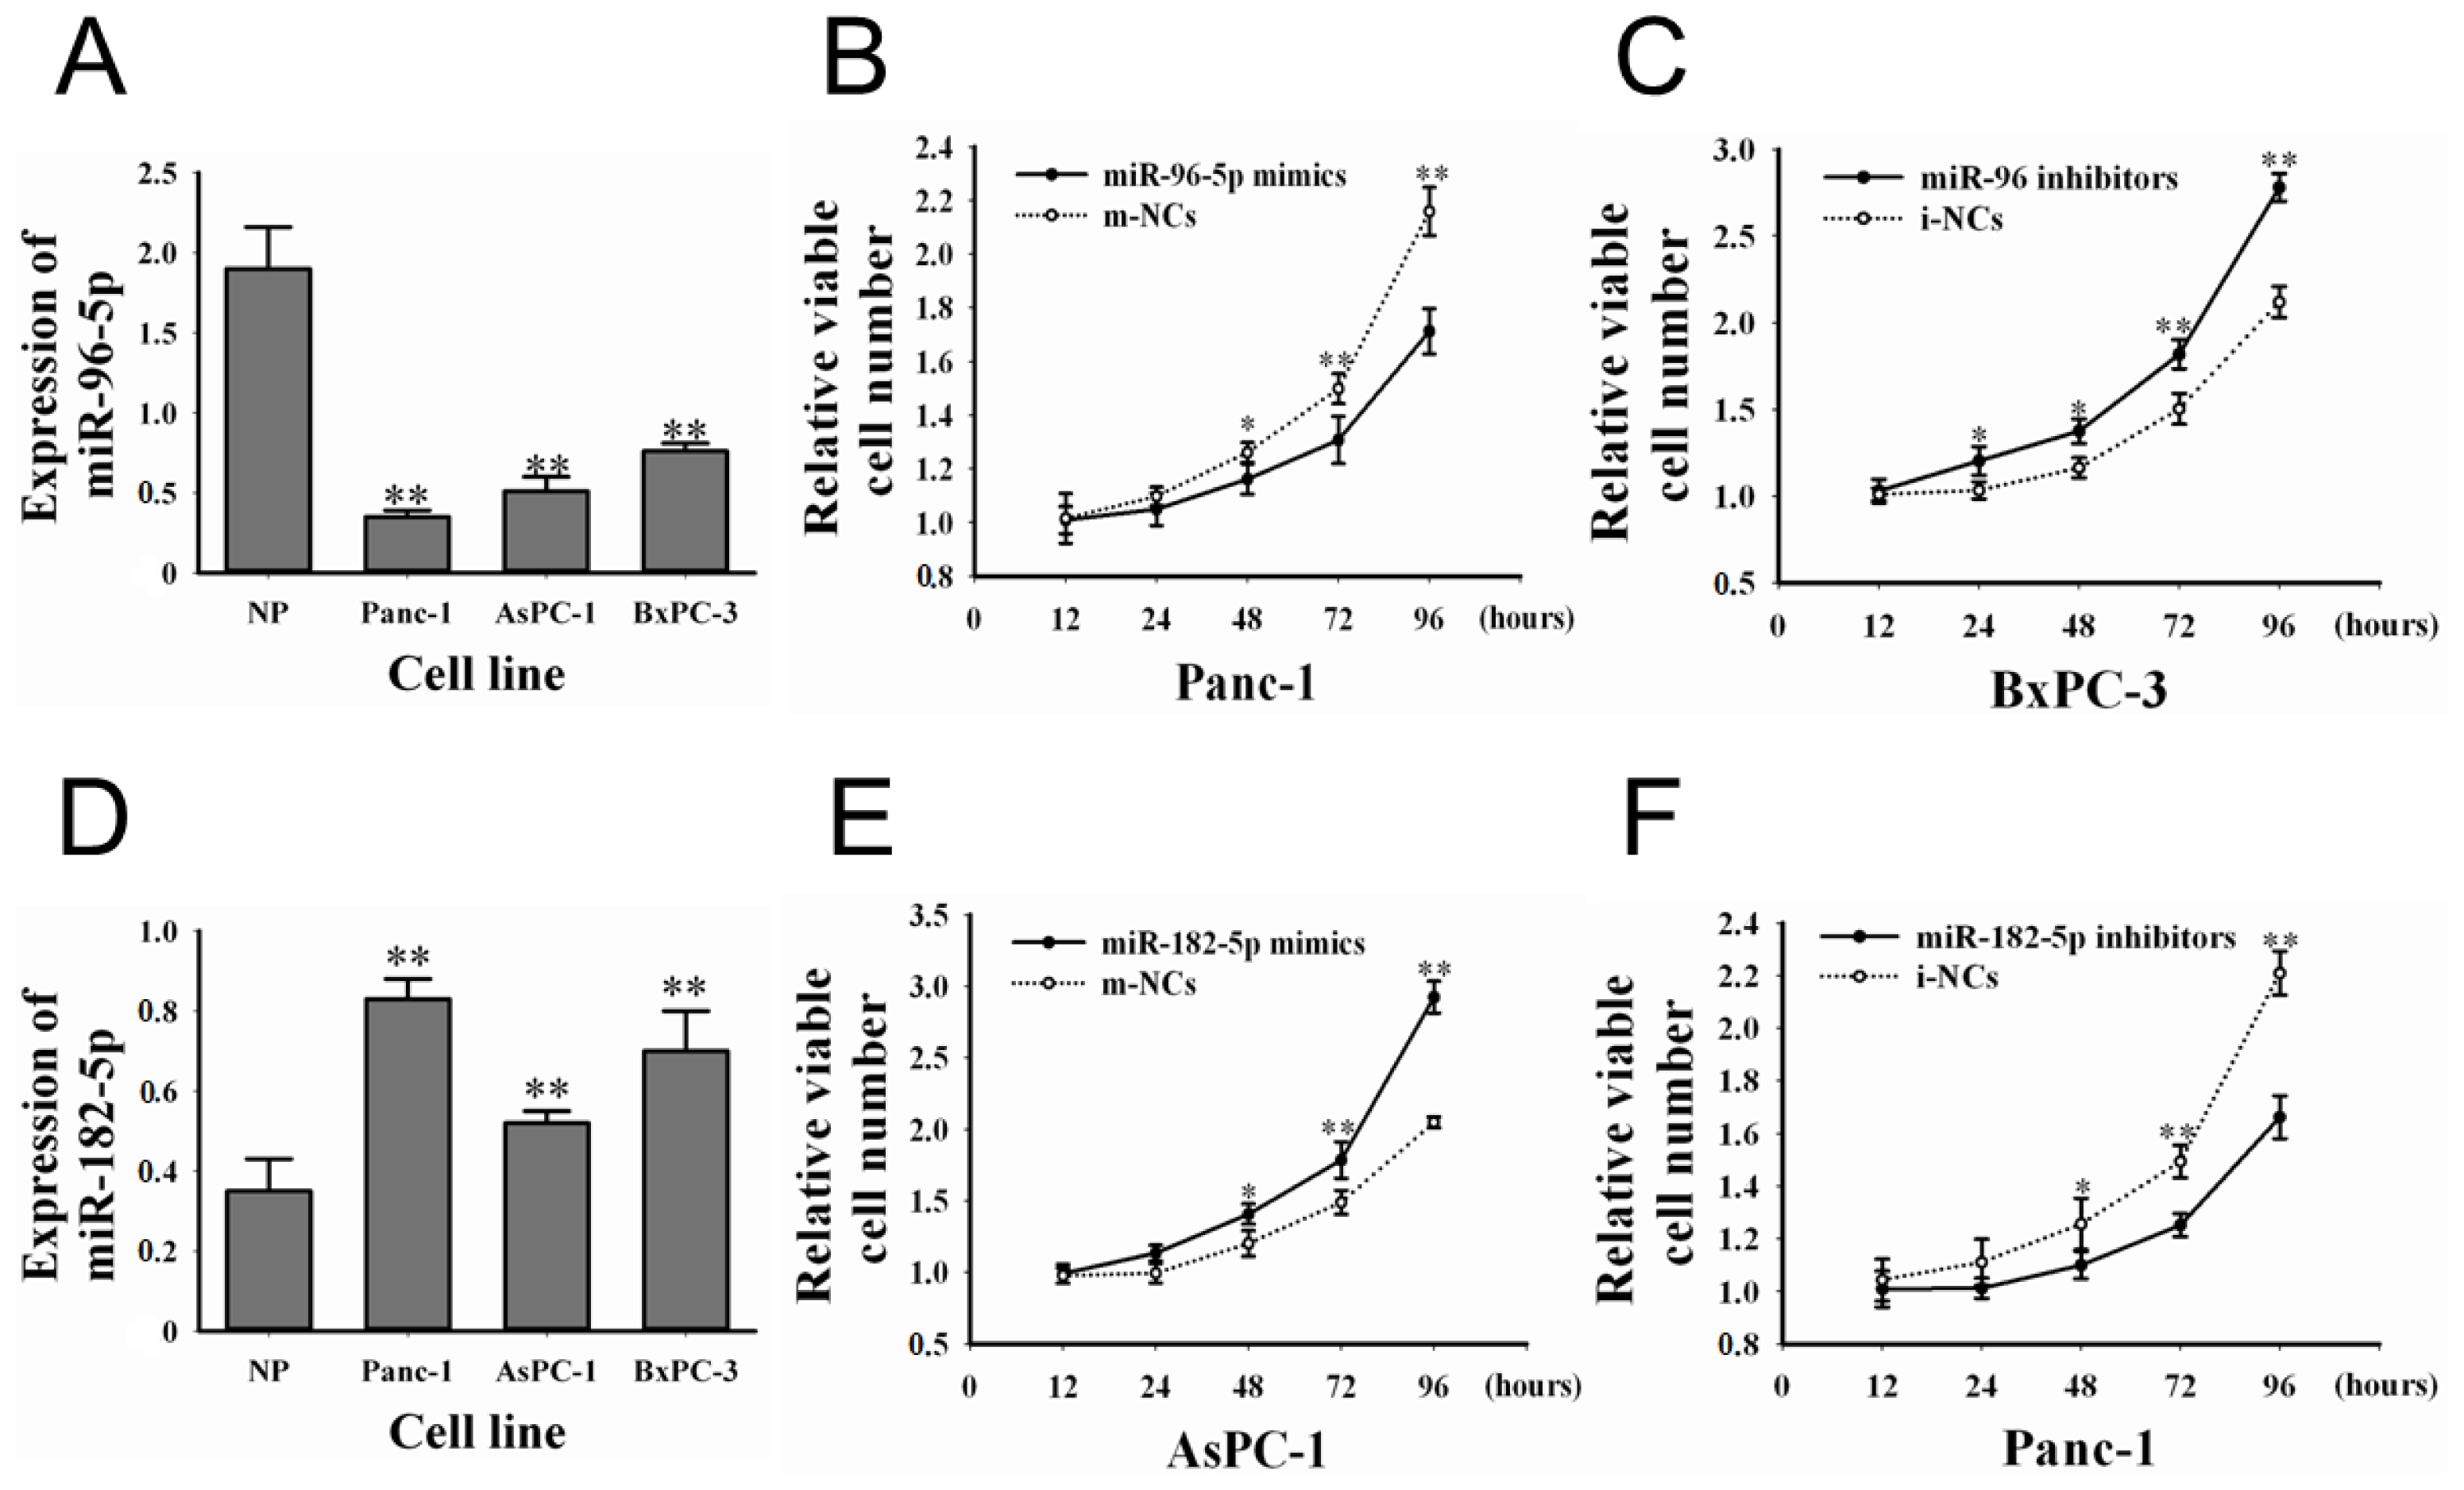
2.2. The Expression of miR-96-5p and -182-5p in Cell Lines and Their Effects on PC Cell Proliferation

The expression levels of miR-96-5p in the PC cell lines were determined by qRT-PCR (snRNA U6 as the endogenous control). As there was no normal pancreatic cell line, we randomly chose three samples of normal pancreatic tissue as the control. We also found that, compared to normal pancreatic tissues, the expression of miR-96-5p was lower in all three PC cell lines (Panc-1, 0.35 ± 0.04-fold; AsPC-1, 0.51 ± 0.09-fold; BxPC-3, 0.76 ± 0.05-fold, Figure 2A). In contrast with miR-96-5p, expression of miR-182-5p was higher in all three cell lines (Panc-1, 0.83 ± 0.05-fold; AsPC-1, 0.52 ± 0.03-fold; BxPC-3, 0.70 ± 0.10-fold, Figure 2D). Based on the differences of both miRNAs expression in three cell lines, we selected the Panc-1, BxPC-3 for miR-96-5p and Panc-1, AsPC-1 for miR-182-5p in PC cell experiments.
The changed expressions of miR-96-5p and -182-5p in PC suggested to investigate whether the both miRNAs have effects on the PC proliferation. In proliferation assay, we found that proliferation of cells transfected with miR-96-5p mimics was lower than that of cells transfected with m-NCs in Panc-1 (Figure 2B), and reducing miR-96-5p expression by miR-96-5p inhibitors promoted cell proliferation in BxPC-3 (Figure 2C). In miR-182-5p study, we found that restoration of miR-182-5p expression by miR-182-5p mimics promoted cell proliferation in AsPC-1 (Figure 2E), and reduced miR-182-5p expression by miR-182-5p inhibitors could inhibit cell proliferation in Panc-1 cells (Figure 2F).

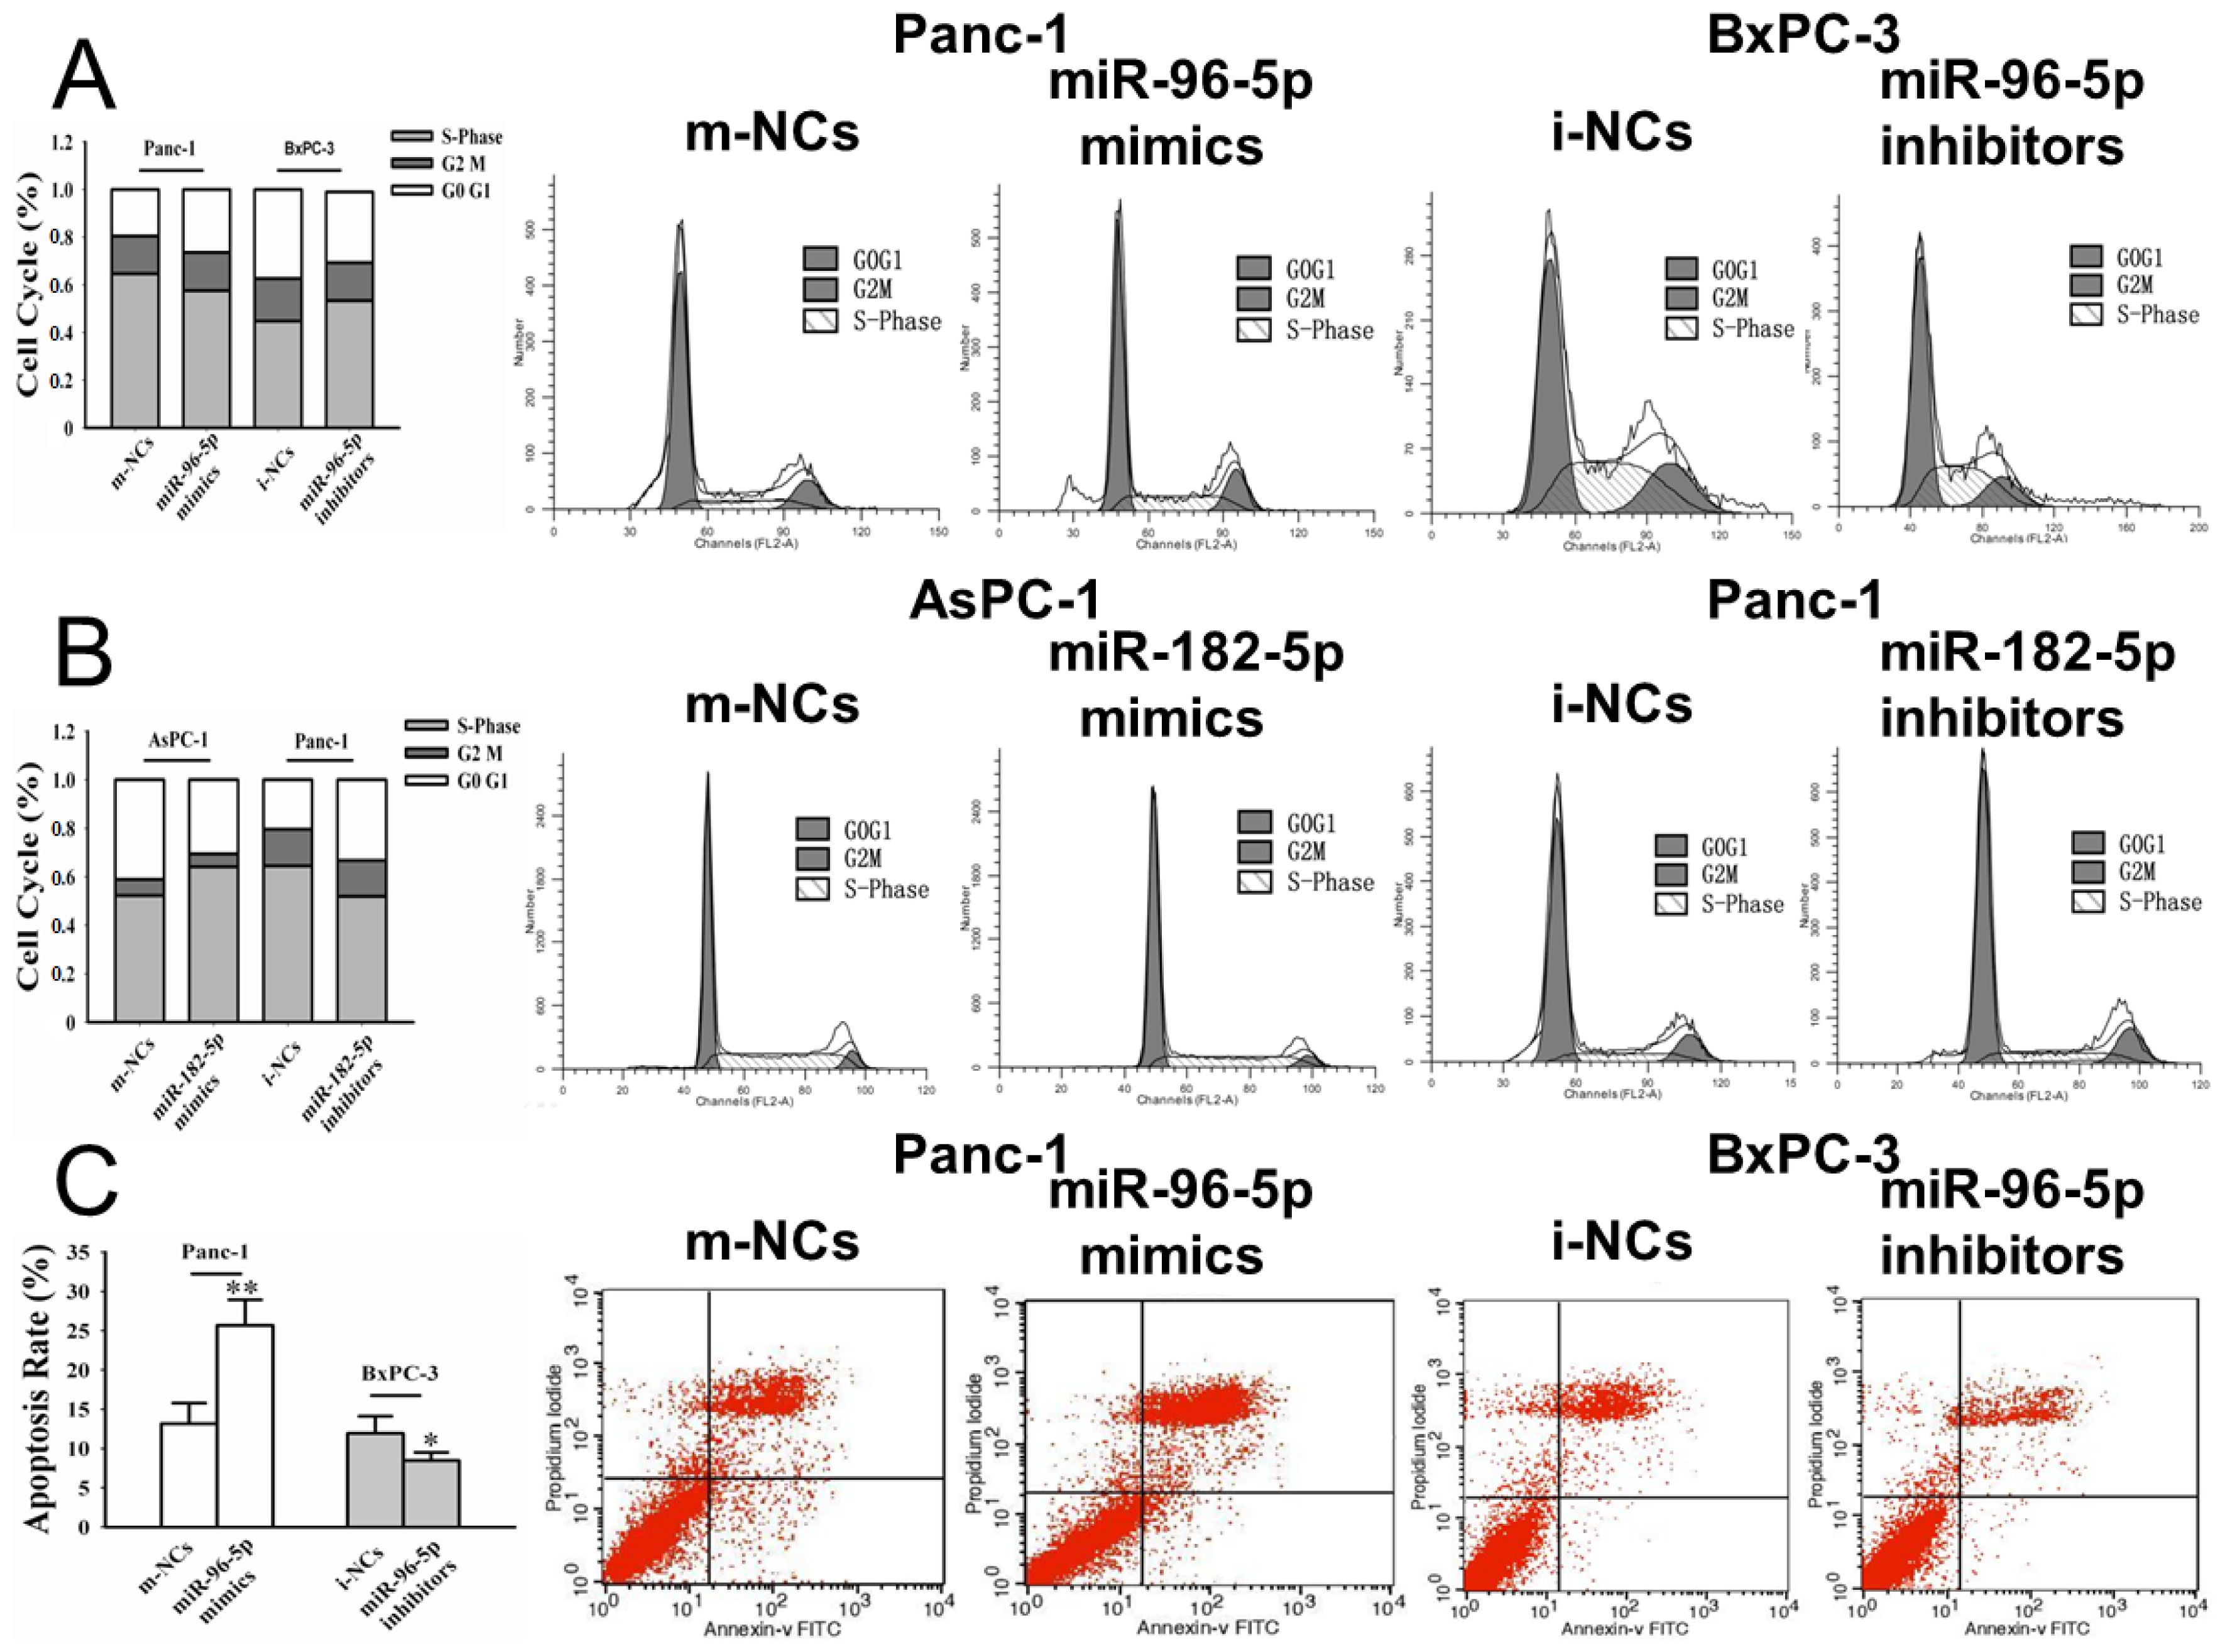
2.3. Effects of miR-96-5p and -182-5p on Cell Cycle and Apoptosis in PC Cells

Knowing that miR-96-5p obviously inhibited PC cell proliferation in vitro, we determined whether miR-96-5p could influence cell cycle progression in PC cells. The cell cycle distribution of Panc-1 cells transfected with miR-96-5p mimics showed a significant increase in the proportion of cells in the G1/G0 phase and a decrease in the proportion of cells in the S phase as compared to that of the m-NCs (mimics-negative controls) (p < 0.01) (Figure 3A). In contrast, the cell cycle distribution analysis of BxPC-3 cells after transfection of miR-96-5p inhibitors showed a significantly decrease proportion of cells in the G0/G1 phase and increased proportion of cells in the S phase, compared to i-NCs-transfected cells (inhibitors-negative controls) (p < 0.01) (Figure 3A). For miR-182-5p, the cell cycle distribution of AsPC-1 cells showed that the proportion of G0/G1 phase dropped more significantly in cells transfected with miR-182-5p mimics than in m-NCs, and the proportion of S phase rised sharply (p < 0.01) (Figure 3B). After transfected with miR-182-5p inhibitors, the proportion of G0/G1 phase went up and the proportion of S phase went down in Panc-1 (p < 0.01) (Figure 3B).
For the effects of miR-96-5p on apoptosis, we found that miR-96-5p mimics significantly increased the apoptosis rate in Panc-1 as compared to that of the m-NCs (25.68% ± 3.25% vs. 13.16% ± 2.61%), and miR-96-5p inhibitors decreased cell apoptosis in BxPC-3 as compared to that of the i-NCs (8.46% ± 1.04% vs. 11.92% ± 2.18%) (Figure 3C). However, miR-182-5p had no significant effect on apoptosis in panc-1 and AsPC-1 cells at 48 h after transfection.

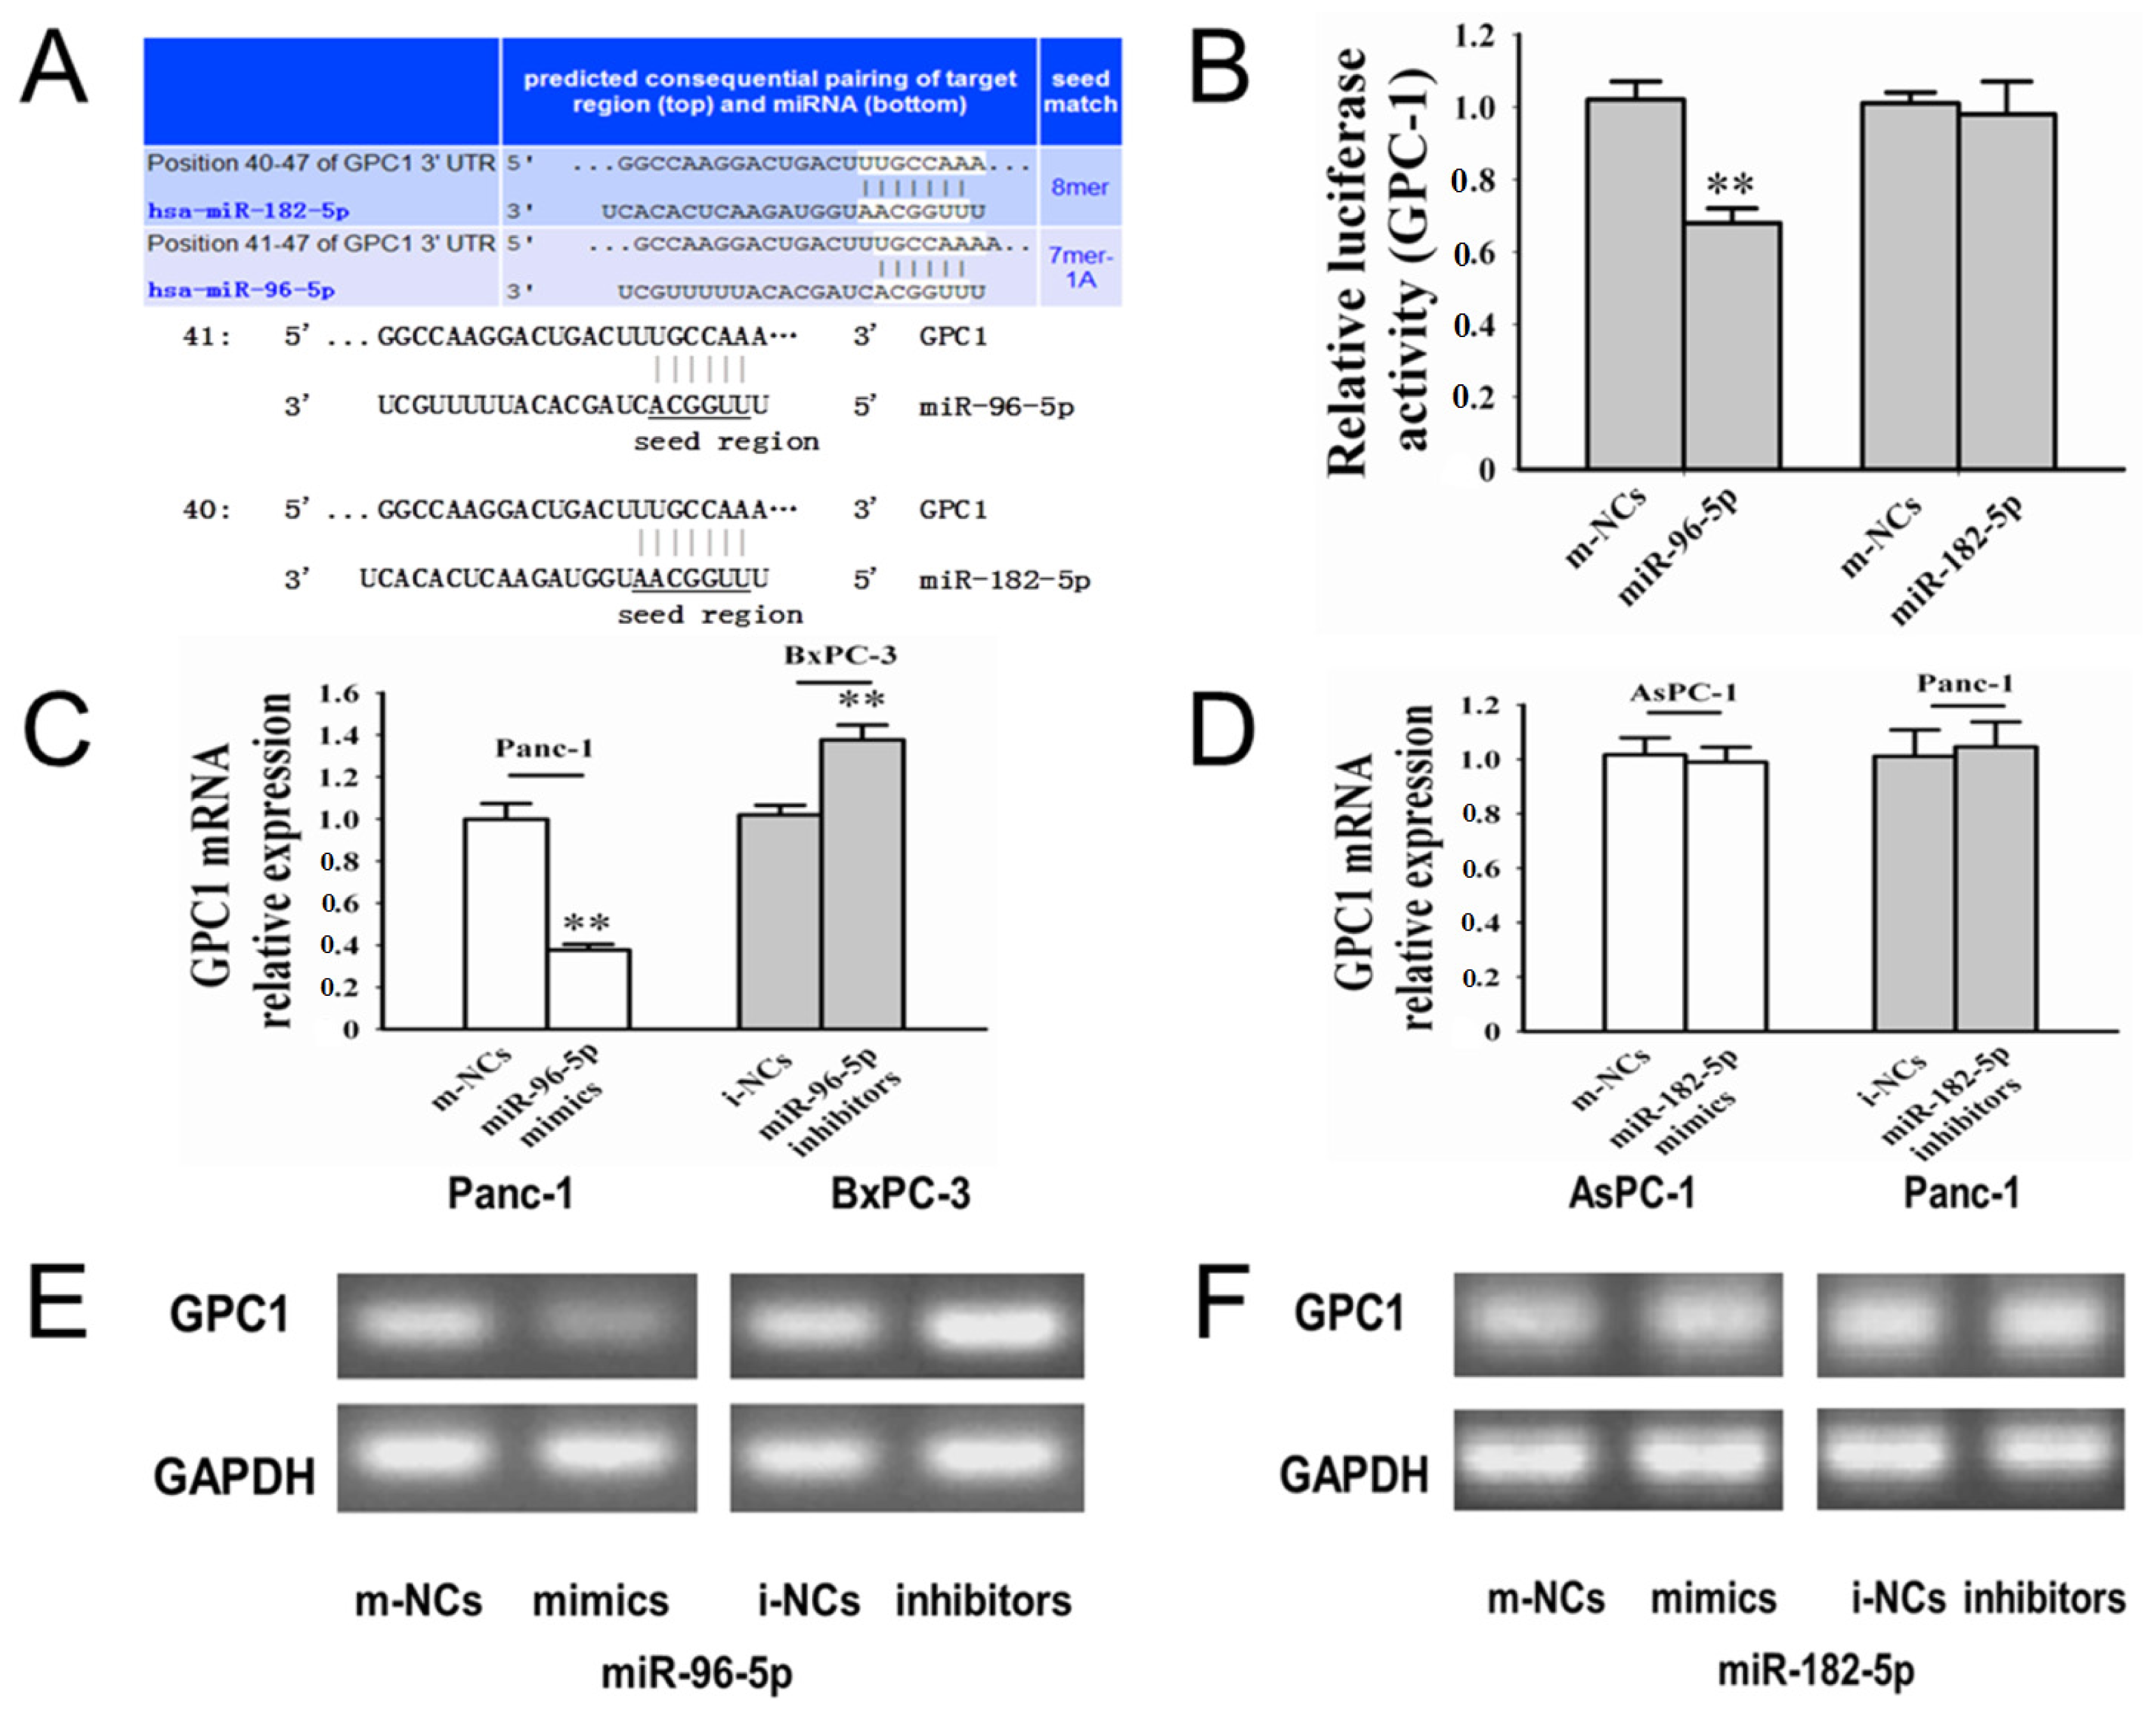
2.4. GPC1 Might Be a Direct Downstream Target for miR-96-5p

As shown in Figure 4B, the relative luciferase activity in cells cotransfected with miR-96-5p mimics was significantly decreased after 48 h (p < 0.01). The reduction in the luciferase activity with miR-182-5p mimics was not significant relative to m-NCs (p = 0.713). Above results suggested that miR-96-5p, not miR-182-5p, could directly bind to the 3′-UTR of human GPC1. We examined the GPC1 mRNA levels in three cells post-transfection by qRT-PCR. After 48 h of transfection, we found that mRNA level of GPC1 to have been suppressed by miR-96-5p mimics in Panc-1 (p < 0.01) (Figure 4C), and mRNA level of GPC1 increased in BxPC-3 cells transfected miR-96-5p inhibitors (p < 0.01) (Figure 4C). We also found that miR-96-5p mimics reduced GPC1 protein levels in panc-1, and GPC1 protein levels increased in BxPC-3 cells transfected miR-96-5p inhibitors at 48 h (Figure 4E). After transfection of miR-182-5p mimics or inhibitors, significant changes were not observed in GPC1 mRNA levels and GPC1 protein levels (Figure 4D,F). These data suggest that miR-96-5p negatively regulates GPC1 protein expression through mRNA degradation and translational repression, and GPC1 could not be the target of miR-182-5p.

2.5. Discussion

2.5.1. Whether miR-96-5p and/or -182-5p Could Regulate GPC1 in PC

Previous studies have indicated that GPC1 is commonly overexpressed in human PC, and it directly contributes to the carcinogenesis and development of PC by controlling cell proliferation [8]. As previous study indicated that miR-96-5p and -182-5p could regulate GPC3 expression, which is also the member of HBGFs, the same as GPC1 [810], we took advantage of bioinformatics to predict the putative target genes of miR-96-5p and -182-5p by using TargetScan, miRanda, and PicTar algorithms, which also suggest that GPC1 might be a potential target for miR-96-5p and -182-5p (Figure 4A). Then, we did a series of tests to determine the relationships between miR-96-5p, -182-5p and GPC1 in three PC cell lines. We measured the miR-96-5p and miR-182-5p expression in Panc-1, AsPC-1, BxPC-3, and found miR-96-5p was lower in Panc-1 and higher in BxPC-3 when compared with normal pancreatic tissues; and miR-182-5p was lower in AsPC-1 and higher in Panc-1. To verify whether GPC1 is a direct target of miR-96-5p, we performed dual-luciferase assay, Quantitative real-time PCR (qRT-PCR), and Western blot analysis in Panc-1 and BxPC-3 cell lines, respectively; and confirmed that miR-96-5p could directly regulate GPC1 expression; but miR-182-5p failed. In addition, the transfection study showed that significant negative changed expression of GPC1 with the miR-96-5p treatment in a time dependent manner; but not found in miR-182-5p treatment group.
In this study, we firstly found that GPC1 was regulated by miR-96-5p rather than miR-182-5p. Indeed, miR-96-5p has other targets in PC, such as KRAS [17,18]. Our study implies that may be more molecular mechanisms exits in the PC development. Moreover, as miRNAs is the upstream of many target proteins in cancer development, anti cancer drugs targeting in miRNA might have better therapeutic effects in specific cancer.

2.5.2. Whether miR-182-5p Could Play a Role in PC

In previous study, miR-182-5p was reported to be over-expressed in some cancers, such as prostate cancer [13], bladder cancer [15], however, miR-182-5p has not been studied in PC yet. Our study suggested that miR-182-5p is a good marker for development and survival time of PC in the population study. Expression of miR-182-5p was up regulated in tissues of PC patients. Patients with higher levels of miR-182-5p expression tended to suffer poorer differentiation. Up-regulated expression of miR-182-5p was associated with a decreased survival in our PC patients. Additionally, in in vitro study, the increased miR-182-5p expression could increase the proliferation of PC cell lines. PC cells in high expression of miR-182-5p were cell cycle arrest at S phase, suggesting that up regulation of miR-182-5p in PC may cause the cancer cells to divide and grow more quickly. However, we did not find the correlation between expression of miR-182-5p and GPC1 protein, nor detect the effects of miR-182-5p treatment on GPC1 protein expression. It should have some other molecular targets, which need further investigation. In this study, we firstly found that miR-182-5p could be a biomarker in PC.

2.5.3. The Validation of the miR-96-5p Effects on PC

Previous studies found that miR-96-5p inhibit cell proliferation in prostate cancer and hepatoma cells [19,20] and only one report in PC [18]. Our findings also showed that miR-96-5p could significantly suppress PC cell proliferation in vitro and cell cycle analysis and apoptosis assay indicated that miR-96-5p can induce Panc-1 cells cycle arrest at the G1/G0 phase and increase the apoptosis rate of Panc-1 cells, suggesting that down regulation of miR-96-5p in PC may cause the cancer cells to divide and grow more quickly.
We also measured the miR-96-5p expression in the PC tissue of PC patients. In the follow-up study, the down regulated miR-96-5p expressions in the pancreatic samples were consistent with previous studies [17,18]. In addition, lower miR-96-5p expressions were related with the poorer clinicopathological characteristics of PC and survival time in PC patients. These findings indicated a validated relationship between miR-96-5p and pancreatic cancer. To explore whether miR-96-5p or -182-5p influences the GPC1 expression, we further analyzed the correlations between expression of miR-96-5p and GPC1 protein in 38 PC tissue samples and found only expression of miR-96-5p was correlated with GPC1 protein. These findings also suggested a close relationship between miR-96-5p and GPC1 in PC.

3. Experimental Section

3.1. Patients and Tissue Samples

A total of 38 pairs of the pancreatic ductal adenocarcinoma and corresponding non-tumor adjacent tissue samples from PC patients were obtained at the Second Affiliated Hospital of Harbin Medical University from March 2008 to August 2011. The clinical characteristics of the patients were collected, including tumor location, histological type, differentiation grade, lymph node invasion, and TNM staging. We followed the all PC patients included for three-year survival. The study was approved by the Research Ethics Committee of Harbin Medical University.

3.2. Immunohistochemistry Staining and Staining Evaluation

GPC1 protein expression was detected immunohistochemically using paraffin-embedded tissues specimens from 38 PC patients according to the methods in our previous studies [21].

3.3. Cell Lines and Transfection

Human PC cell lines Panc-1, AsPC-1 and BxPC-3 and human embryonic kidney 293 T cell line (HEK293T), which were obtained from the Chinese Academy of Sciences Shanghai Branch Cell Bank (Shanghai, China), were propagated in DMEM (Beyotime, Shanghai, China) supplemented with 10% fetal bovine serum. The cells were maintained at 37 °C in an atmosphere of humidified air with 5% CO2. Transfection was performed with Lipofectamine 2000 Reagent (Invitrogen, Carlsbad, CA, USA) according to the manufacturer instructions. MiR-96-5p, -182-5p mimics, mimic negative controls (m-NCs), miR-96-5p, -182-5p inhibitors, and inhibitor negative controls (i-NCs) were purchased from Ribobio (Guangzhou, China). A final concentration of 50 nM of mimics or 100 nM of inhibitors and their respective negative controls (NCs) were used for each transfection in proliferation, cell cycle and apoptosis experiments.

3.4. RNA Extraction and qRT-PCR

Total RNA samples were isolated from primary tissues or from cell lines using TRIzol (Invitrogen, Carlsbad, CA, USA) and reverse transcribed to cDNA using PrimeScript Regent Kit (Takara, Tokyo, Japan). Quantitative real-time PCR was performed using SYBR green kit (Takara, Tokyo, Japan) and the ABI 7500 Real-time PCR system (Applied Biosystems, Foster City, CA, USA) according to the manufacturer’s instructions. Primers were obtained from RiboBio (RiboBio, Guangzhou, China) and listed in Supplementary Table S1. All assays were performed at least in triplicate. The relative expression was normalized to that of internal control snRNA U6 or GAPDH and calculated using 2−ΔΔCt method [22]. Changes in the expression of PC were found to be relative to the non-tumorous controls (non-tumorous tissue adjacent to tumors).

3.5. Cell Proliferation Assay

The cell proliferation was indirectly assayed using the CCK-8 kit (Beyotime, Shanghai, China), which stains living cell according to the manufacturer’s instructions. Five thousand cells were seeded in 96-well plates and transfected with mimics, inhibitors, or their respective NCs the next day. CCK-8 solution was used to measure cell viability at 48 h after transfection. The absorbance of each well was measured with a microplate reader set at 450 nm. All experiments were performed in triplicate.

3.6. Cell Cycle Assay and Apoptosis Analysis

For the cell cycle analysis, cells were harvested by trypsinization, washed twice using cold PBS and fixed in 70% ethanol overnight at −20 °C. Then cells were treated with DNA staining solution containing 3.4 mM Tris-Cl (pH 7.4), propidium iodide, 0.1% triton X-100 buffer and 100 μg/mL RNase A. Cell cycle analysis was performed with FACS flow cytometry. For apoptosis analysis, 48 h after transfection, the cells were collected, washed twice with cold phosphate buffered saline (PBS) and re-suspended in binding buffer at a cell density of 1 × 10⁶/mL. Cells were then stained with Annexin V-FITC (BioVision, San Francisco, CA, USA) and propodium iodide according to the manufacturer’s instructions (Beyotime, Shanghai, China). The signal was acquired by a FACS Calibur flow cytometer (BD Biosciences, Mississauga, ON, Canada) and was analyzed with Cellquest software (BD Biosciences, Mississauga, ON, Canada). Each sample was run in triplicate.

3.7. Dual-Luciferase Reporter Assay

Target sequences of GPC1 3′-UTR (Figure 4A) were cloned into the dual-luciferase reporter vectors CHECK-GPC1-96 and CHECK-GPC1-182, which was constructed by RiboBio (RiboBio Co., Guangzhou, China). HEK-293T cells were plated into 24-well plates with 50%–60% confluence 24 h before transfection. A mixture of 50 nM miR-96-5p or -182-5p mimics, and 0.5 μg CHECK-GPC1-96 or CHECK-GPC1-182 report vector was transfected into cells using Lipofectamine 2000 reagent (Invitrogen, Carlsbad, CA, USA). After 48 h, luciferase activity levels were measured using a dual-luciferase reporter assay system (Promega, Madison, WI, USA) and normalized by dividing firefly luciferase activity by that of Renilla luciferase according to the manufacturers’ instructions. Each transfection was performed in triplicate.

3.8. Western Blot

Total proteins samples were extracted from primary tissues or from cell lines using lysis buffer containing phenylmethyl sulfonyfluoride (PMSF). The samples were mixed with loading buffer and denatured, separated by electrophoresis in a 10% SDS-PAGE gel, and then transferred to polyvinylidene fluoride (PVDF) membranes. The membranes were blocked with 5% nonfat milk for 2 h, incubated with anti-GPC1 antibody (Abcam, Cambridge, UK) or anti-GAPDH antibody (Abcam, Cambridge, UK) overnight at 4 °C. Signals were revealed after incubation with anti-rabbit IgG secondary antibody coupled to peroxidase by using ECL.

3.9. Statistical Analysis

The data were presented as means ± standard deviation (SD). The miR-96-5p and -182-5p expressions were compared in pancreatic cancer tissues and cells by the unpaired Student’s t-test. The relationships between miR-96-5p, -182-5p, and clinicopathologic parameters were evaluated by χ2 test. The survival rates for miR-96-5p and -182-5p expressions were estimated by using the Kaplan-Meier method and the difference in survival curves were tested by log-rank test. The relationships between miR-96-5p, -182-5p, and GPC1 expression were explored by Spearman’s correlation. All statistical analyses were carried out by SPSS13.0 software (SPSS, Chicago, IL, USA). p < 0.05 was considered statistically significant.

4. Conclusions

Our study suggested that both miR-96-5p and -182-5p could be the up stream of PC development. The structure of miR-96-5p and -182-5p are similar, however, their function differs significantly as the data in our study showed above. To study the exact effects of the each miRNA, further investigations on the differences of functions, down stream targets and bio-effects between them are needed.
In conclusion, our study found that both miR-96-5p and -182-5p are both good markers for PC; miR-96-5p, rather than -182-5p, could directly inhibit GPC1 to suppress proliferation of PC cells.

Supplementary Information

ijms-15-06314-s001.pdf

Acknowledgments

This study was supported by grant from the National Science Foundation Committee of China (No. 81170426). The funders had no role in study design, data collection and analysis, decision to publish, or preparation of the manuscript.

Conflicts of Interest

The authors declare no conflict of interest.

References

  1. Vincent, A.; Herman, J.; Schulick, R.; Hruban, R.H.; Goggins, M. Pancreatic cancer. Lancet 2011, 378, 607–620. [Google Scholar]
  2. Hidalgo, M. Pancreatic cancer. N. Engl. J. Med 2010, 362, 1605–1617. [Google Scholar]
  3. Feng, M.; Gao, W.; Wang, R.; Chen, W.; Man, Y.G.; Figg, W.D.; Wang, X.W.; Dimitrov, D.S.; Ho, M. Therapeutically targeting glypican-3 via a conformation-specific single-domain antibody in hepatocellular carcinoma. Proc. Natl. Acad. Sci. USA 2013, 110, E1083–E1091. [Google Scholar]
  4. Aikawa Aikawa, T.; Whipple, C.A.; Lopez, M.E.; Gunn, J.; Young, A.; Lander, A.D.; Korc, M. Glypican-1 modulates the angiogenic and metastatic potential of human and mouse cancer cells. J. Clin. Investig 2008, 118, 89–99. [Google Scholar]
  5. Duan, L.; Hu, X.Q.; Feng, D.Y.; Lei, S.Y.; Hu, G.H. GPC-1 may serve as a predictor of perineural invasion and a prognosticator of survival in pancreatic cancer. Asian J. Surg./Asian Surg. Assoc 2013, 36, 7–12. [Google Scholar]
  6. Mounajjed, T.; Zhang, L.; Wu, T.T. Glypican-3 expression in gastrointestinal and pancreatic epithelial neoplasms. Hum. Pathol 2013, 44, 542–550. [Google Scholar]
  7. Lee, S.; Reha, J.L.; Tzeng, C.W.; Massarweh, N.N.; Chang, G.J.; Hetz, S.P.; Fleming, J.B.; Lee, J.E.; Katz, M.H. Race does not impact pancreatic cancer treatment and survival in an equal access federal health care system. Ann. Surg. Oncol 2013. [Google Scholar] [CrossRef]
  8. Whipple, C.A.; Young, A.L.; Korc, M. A. KrasG12D-driven genetic mouse model of pancreatic cancer requires glypican-1 for efficient proliferation and angiogenesis. Oncogene 2012, 31, 2535–2544. [Google Scholar]
  9. Jalvy-Delvaille, S.; Maurel, M.; Majo, V.; Pierre, N.; Chabas, S.; Combe, C.; Rosenbaum, J.; Sagliocco, F.; Grosset, C.F. Molecular basis of differential target regulation by miR-96 and miR-182: The Glypican-3 as a model. Nucleic Acids Res 2012, 40, 1356–1365. [Google Scholar]
  10. Moskwa, P.; Buffa, F.M.; Pan, Y.; Panchakshari, R.; Gottipati, P.; Muschel, R.J.; Beech, J.; Kulshrestha, R.; Abdelmohsen, K.; Weinstock, D.M.; et al. miR-182-mediated downregulation of BRCA1 impacts DNA repair and sensitivity to PARP inhibitors. Mol. Cell 2011, 41, 210–220. [Google Scholar]
  11. Hwang, H.W.; Mendell, J.T. MicroRNAs in cell proliferation, cell death, and tumorigenesis. Br. J. Cancer 2006, 94, 776–780. [Google Scholar]
  12. Lee, R.C.; Ambros, V. An extensive class of small RNAs in Caenorhabditis elegans. Science 2001, 294, 862–864. [Google Scholar]
  13. Tsuchiyama, K.; Ito, H.; Taga, M.; Naganuma, S.; Oshinoya, Y.; Nagano, K.; Yokoyama, O.; Itoh, H. Expression of microRNAs associated with Gleason grading system in prostate cancer: miR-182-5p is a useful marker for high grade prostate cancer. Prostate 2013, 73, 827–834. [Google Scholar]
  14. Guttilla, I.K.; White, B.A. Coordinate regulation of FOXO1 by miR-27a, miR-96, and miR-182 in breast cancer cells. J. Biol. Chem 2009, 284, 23204–23216. [Google Scholar]
  15. Guo, Y.; Liu, H.; Zhang, H.; Shang, C.; Song, Y. miR-96 regulates FOXO1-mediated cell apoptosis in bladder cancer. Oncol. Lett 2012, 4, 561–565. [Google Scholar]
  16. Weeraratne, S.D.; Amani, V.; Teider, N.; Pierre-Francois, J.; Winter, D.; Kye, M.J.; Sengupta, S.; Archer, T.; Remke, M.; Bai, A.H.; et al. Pleiotropic effects of miR-183~96~182 converge to regulate cell survival, proliferation and migration in medulloblastoma. Acta Neuropathol 2012, 123, 539–552. [Google Scholar]
  17. Tanaka, M.; Suzuki, H.I.; Shibahara, J.; Kunita, A.; Isagawa, T.; Yoshimi, A.; Kurokawa, M.; Miyazono, K.; Aburatani, H.; Ishikawa, S.; et al. EVI1 oncogene promotes KRAS pathway through suppression of microRNA-96 in pancreatic carcinogenesis. Oncogene 2013. [Google Scholar] [CrossRef]
  18. Yu, S.; Lu, Z.; Liu, C.; Meng, Y.; Ma, Y.; Zhao, W.; Liu, J.; Yu, J.; Chen, J. miRNA-96 suppresses KRAS and functions as a tumor suppressor gene in pancreatic cancer. Cancer Res 2010, 70, 6015–6025. [Google Scholar]
  19. Haflidadottir, B.S.; Larne, O.; Martin, M.; Persson, M.; Edsjo, A.; Bjartell, A.; Ceder, Y. Upregulation of miR-96 Enhances Cellular Proliferation of Prostate Cancer Cells through FOXO1. PLoS One 2013, 8, e72400. [Google Scholar]
  20. Xu, D.; He, X.; Chang, Y.; Xu, C.; Jiang, X.; Sun, S.; Lin, J. Inhibition of miR-96 expression reduces cell proliferation and clonogenicity of HepG2 hepatoma cells. Oncol. Rep 2013, 29, 653–661. [Google Scholar]
  21. Zhong, X.Y.; Yu, J.H.; Zhang, W.G.; Wang, Z.D.; Dong, Q.; Tai, S.; Cui, Y.F.; Li, H. MicroRNA-421 functions as an oncogenic miRNA in biliary tract cancer through down-regulating farnesoid X receptor expression. Gene 2012, 493, 44–51. [Google Scholar]
  22. Livak, K.J.; Schmittgen, T.D. Analysis of relative gene expression data using real-time quantitative PCR and the 2−ΔΔCt Method. Methods 2001, 25, 402–408. [Google Scholar]
Figure 1. Analysis of miR-96-5p and miR-182-5p expression in human PC tissues and survival time of PC patients. (A) Real-time PCR analysis of miR-96-5p expression in human pancreatic cancer tissues (n = 38) and matched adjacent noncancerous pancreatic tissues (n = 38). PC, pancreatic cancer tissues; NP, adjacent noncancerous pancreatic tissues; (B) miR-96-5p expression was examined in 38 pairs of PC tissues and NP tissues by qRT-PCR. Data were presented as log2 of fold change of PC relative to NP. The cases below the line (log2 = −1) showed a >50% decrease in the miR-96-5p expression level; (C) Kaplan-Meier curves of the overall survivals of 38 pancreatic cancer patients were scored as miR-96-5p downregulation group (n = 29) and normal/upregulation group (n = 9); (D) Real-time PCR analysis of miR-182-5p expression in human pancreatic cancer tissues (n = 38) and matched adjacent noncancerous pancreatic tissues (n = 38); (E) miR-182-5p expression was examined in 38 pairs of PC tissues and NP tissues by qRT-PCR. Data were presented as log2 of fold change of PC relative to NP. The cases above the line (log2 = 0.58) showed a >150% increase in the miR-182-5p expression level; (F) Kaplan-Meier curves of the overall survivals of 38 pancreatic cancer patients were scored as miR-182-5p upregulation group (n = 30) and normal/downregulation group (n = 8). The p-values are shown with the use of log-rank test. All data are presented as mean ± SD.
Ijms 15 06314f1
Figure 2. The expression of miR-96-5p and -182-5p in cell lines and their effects on PC cell proliferation. (A) The expression level of miR-96-5p in three pancreatic cancer cell lines (Panc-1, AsPC-1, and BxPC-3) and normal pancreatic tissues; (B) Upregulation of miR-96-5p inhibited proliferation in Panc-1; (C) Downregulation of miR-96-5p promoted proliferation in BxPC-3; (D) The expression level of miR-182-5p in three pancreatic cancer cell lines (Panc-1, AsPC-1, and BxPC-3) and normal pancreatic tissues; (E) Upregulation of miR-182-5p promoted proliferation in AsPC-1; (F) Downregulation of miR-182-5p inhibited proliferation in Panc-1. All data from three separate experiments are presented as mean ± SD. * p < 0.05; ** p < 0.01.
Ijms 15 06314f2
Figure 3. Effects of miR-96-5p and -182-5p on cell cycle and apoptosis in PC cells. (A) Flow cytometric analysis of indicated PC cancer cells transfected with miR-96-5p mimics, inhibitors or their respective negative controls (NCs) in Panc-1 and BxPC-3. MiR-96-5p induced cell cycle arrest at G1/G0 phase; (B) Flow cytometric analysis of indicated PC cancer cells transfected with miR-182-5p mimics, inhibitors or their respective NCs in AsPC-1 and Panc-1. MiR-182-5p induced cell cycle arrest at S phase; (C) PC cancer cells transfected with miR-96-5p mimics, inhibitors or their respective NCs in Panc-1 and BxPC-3, and the apoptosis was measured by flow cytometry. * p < 0.05; ** p < 0.01.
Ijms 15 06314f3
Figure 4. Effects of miR-96-5p and -182-5p on GPC1 expression. (A) The miR-96-5p and the miR-96-5p-binding site in the 3′-UTR of GPC1. The miR-182-5p and the miR-182-5p-binding site in the 3′-UTR of GPC1; (B) Luciferase reporter assay with cotransfection of GPC1 3′-UTR and miR-96-5p, miR-182-5p, and their respective NCs in HEK-293T cells; (C) The expression level of GPC1 mRNA was down-regulated by miR-96-5p; (D) The expression level of GPC1 mRNA was not significantly regulated by miR-182-5p using qRT-PCR; (E) Western blot results of GPC1 protein in Panc-1 and BxPC-3 transfected with miR-96-5p mimics, miR-96-5p inhibitors and their respective NCs at 48 h; (F) The expression level of GPC1 protein was not significantly regulated by miR-182-5p. All data from three separate experiments are presented as mean ± SD. ** p < 0.01.
Ijms 15 06314f4
Table 1. Correlations between miR-96-5p, miR-182-5p, and various clinicopathological characteristics of pancreatic cancer (PC) patients.
Clinicopathological CharacteristicsmiR-96-5pmiR-182-5p

Down (%)Normal/Up (%)Up (%)Normal/Down (%)
GenderMale21 (75.0)7 (25.0)22 (78.6)6 (21.4)
Female8 (80.0)2 (20.0)8 (80.0)2 (20.0)
Age (years)<6016 (72.7)6 (27.3)17 (77.3)5 (22.7)
≥6013 (81.2)3 (18.8)13 (81.3)3 (18.7)
Serum CA19-9Negative5 (71.4)2 (28.6)5 (71.4)2 (28.6)
Positive24 (77.4)7 (22.6)25 (80.6)6 (19.4)
Tumor size<218 (66.7)9 (33.3) *21 (77.8)6 (22.2)
≥211 (100.0)0 (0.0)9 (81.8)2 (18.2)
Histological differentiationWell14 (63.6)8 (36.4) *14 (63.6)8 (36.4) *
Poorly15 (93.7)1 (6.3)16 (100.0)0 (0.0)
PancreatitisNo21 (77.8)6 (22.2)23 (85.2)4 (14.8)
Yes8 (72.7)3 (27.3)7 (63.6)4 (36.4)
Regional lymph node metastasisNo23 (74.2)8 (25.8)24 (77.4)7 (22.6)
Yes6 (85.7)1 (14.3)6 (85.7)1 (14.3)
TNM stagingI-IIA23 (74.2)8 (25.8)24 (77.4)7 (22.6)
IIB6 (85.7)1 (14.3)6 (85.7)1 (14.3)
*p < 0.05.
Table 2. Correlations between miR-96-5p, miR-182-5p, and GPC1 protein of PC patients.
GPC1nmiR-96-5pCorrelationmiR-182-5pCorrelation

downup/NormalrpupNormal/downrp
Normal/underexpression(−/+)1376−0.3810.0181120.1000.549
Overexpression(++/+++)25223196
p for Spearman’s correlation.

