Article

Matrilin-3 Chondrodysplasia Mutations Cause Attenuated Chondrogenesis, Premature Hypertrophy and Aberrant Response to TGF-β in Chondroprogenitor Cells

1
Department of Orthopaedics, Warren Alpert Medical School of Brown University, CORO West, Suite 402A, 1 Hoppin Street, Providence, RI 02903, USA
2
Sansom Institute of Health Research, Department of Pharmacy and Medical Sciences, University of South Australia, Adelaide 5000, Australia
3
Stem Cell and Tissue Engineering Laboratory, Department of Orthopaedics, West Virginia University, Morgantown, WV 26506, USA
*
Author to whom correspondence should be addressed.
These authors contributed equally to this work.
Int. J. Mol. Sci. 2014, 15(8), 14555-14573; https://doi.org/10.3390/ijms150814555
Submission received: 18 June 2014 / Revised: 24 July 2014 / Accepted: 8 August 2014 / Published: 21 August 2014
(This article belongs to the Special Issue The Chondrocyte Phenotype in Cartilage Biology)

Abstract

:
Studies have shown that mutations in the matrilin-3 gene (MATN3) are associated with multiple epiphyseal dysplasia (MED) and spondyloepimetaphyseal dysplasia (SEMD). We tested whether MATN3 mutations affect the differentiation of chondroprogenitor and/or mesenchymal stem cells, which are precursors to chondrocytes. ATDC5 chondroprogenitors stably expressing wild-type (WT) MATN3 underwent spontaneous chondrogenesis. Expression of chondrogenic markers collagen II and aggrecan was inhibited in chondroprogenitors carrying the MED or SEMD MATN3 mutations. Hypertrophic marker collagen X remained attenuated in WT MATN3 chondroprogenitors, whereas its expression was elevated in chondroprogenitors expressing the MED or SEMD mutant MATN3 gene suggesting that these mutations inhibit chondrogenesis but promote hypertrophy. TGF-β treatment failed to rescue chondrogenesis markers but dramatically increased collagen X mRNA expression in mutant MATN3 expressing chondroprogenitors. Synovium derived mesenchymal stem cells harboring the SEMD mutation exhibited lower glycosaminoglycan content than those of WT MATN3 in response to TGF-β. Our results suggest that the properties of progenitor cells harboring MATN3 chondrodysplasia mutations were altered, as evidenced by attenuated chondrogenesis and premature hypertrophy. TGF-β treatment failed to completely rescue chondrogenesis but instead induced hypertrophy in mutant MATN3 chondroprogenitors. Our data suggest that chondroprogenitor cells should be considered as a potential target of chondrodysplasia therapy.

1. Introduction

Endochondral bone formation is the primary means of skeletal development in vertebrates. During this process, growth plate chondrocytes undergo rapid proliferation and differentiation into mature chondrocytes. These chondrocytes further differentiated into hypertrophic chondrocytes that, in time, ossify as the diaphysis elongates resulting in long bone growth. The crippling effects of chondrodysplasia illustrate the importance of cartilage development to the process of normal bone growth. Multiple epiphyseal dysplasia (MED) [1] and matrilin type spondyloepimetephyseal dysplasia (SEMD, matrilin type) [2] are two forms of chondrodysplasia associated with mutations in the matrilin-3 (MATN3) gene. MATN3 is a small non-collagenous extracellular matrix (ECM) protein consisting of a von Willebrand factor A (vWFA) domain, four consecutive epidermal growth factor (EGF) repeats and a single coiled-coil domain [3]. MATN3 is specific to cartilage tissue and highly expressed by growth plate chondrocytes during development [3,4]. Despite our current understanding of its molecular interaction with other cartilage ECM proteins, such as type II/IX collagens [5,6], cartilage oligomeric matrix protein COMP [7] and matrilin-1 (MATN1) [3,8,9,10], the biological role of MATN3 remains largely unknown.
MED is characterized by delayed or irregular epiphyseal ossification often followed by the early onset of osteoarthritis in patients [11,12,13]. Currently there are more than 13 known MED associated autosomal dominant missense mutations have been mapped to MATN3’s vWFA protein domain [14,15,16,17,18,19]. A single tryptophan to arginine (R121W) point mutation in the β-strand of the vWFA domain has been identified in approximately one third of all MED patients, making it the most common MATN3 mutation to cause this disorder [1,17]. Furthermore, an autosomal recessive cysteine to serine (C304S) point mutation within the first EGF-like domain of MATN3 has been identified in patients with SEMD [2].
Studies to analyze the underlying mechanisms of chondrodysplasia have previously focused on the effects of the MATN3 missense mutations on chondrocytes. In vitro studies have been conducted using primary bovine and chicken chondrocytes, which transiently over-expressed MED (R116W) and SEMD (C299S) MATN3 mutations, the murine analogs of the human R121W and C304S MATN3 mutations, respectively [16,20]. These mutations led to disturbed protein trafficking to the Golgi and ultimately resulted in cellular retention of MATN3 in the endoplasmic reticulum of cells. These data suggest that cytosolic accumulation of MATN3 protein may be an underlying pathophysiological event responsible for chondrodysplasia [16,20]. Additionally, an in vivo study using knock-in mice carrying the murine equivalent of the MED associated MATN3 point mutation (V194D) has shown that this mutation results in disregulated chondrocyte proliferation, apoptosis, ER stress response and the development of chondrodysplasia [21].
While these previous studies helped to establish that MATN3 is an important ECM protein in regulating cartilage development and homeostasis, they did not address whether chondrodysplasia associated MATN3 mutations can also affect chondroprogenitors, a precursor cell population that gives rise to chondrocytes. Chondroprogenitors reside in the resting zone, peri-chondrium, growth plate groove of Ranvier, articular cartilage and neighboring tissues in the joint (including synovium) [22]. Chondroprogenitors, which derive from mesenchymal stem cells, are crucial for proper endochondral ossification and bone development through chondrogenesis to form chondrocytes upon induction by growth factors such as TGF-β. During this differentiation process, chondrocytes undergo sequential, well-coordinated events including proliferation, synthesis of chondrogenic markers such as collagen II (Col2a1) and aggrecan (Acan), and eventually, hypertrophy and synthesis of hypertrophic marker collagen X (Col10a1). Unlike MATN1, which is expressed mainly by post-mitotic mature chondrocytes [23], MATN3 is predominantly expressed during early chondrogenesis in the growth plate [10]. Thus, MATN3 mutations may affect not only chondrocytes but also mesenchymal stem cell derived chondroprogenitors that harbor such mutations. Alteration of these precursor cells may affect the microenvironment of the ECM within the growth plate or articular cartilage and the downstream events during chondrocyte differentiation, thereby contributing to the pathogenesis of MED and SEMD.
To test this hypothesis, we established stable chondroprogenitor cell lines harboring either the wild-type (WT), MED or SEMD mutant MATN3 gene in ATDC5 cells, which are commonly recognized chondroprogenitor cells for studying chondrogenesis [24,25]. We analyzed the alteration of expression of chondrogenic, as well as hypertrophic, markers in these cell lines. Additionally, we transfected primary porcine synovium derived mesenchymal stem cells (SDMSCs) [26,27] harboring these mutations, which undergo differentiation upon induction with TGF-β in a pellet culture system. Here we show that MATN3 mutations, especially SEMD MATN3, significantly inhibit chondrogenesis of mesenchymal stem cells and chondroprogenitors. Chondroprogenitors harboring MATN3 mutations undergo premature hypertrophy. TGF-β treatment fails to rescue chondrogenesis but instead promotes hypertrophy in chondroprogenitors harboring MATN3 mutations.

2. Results

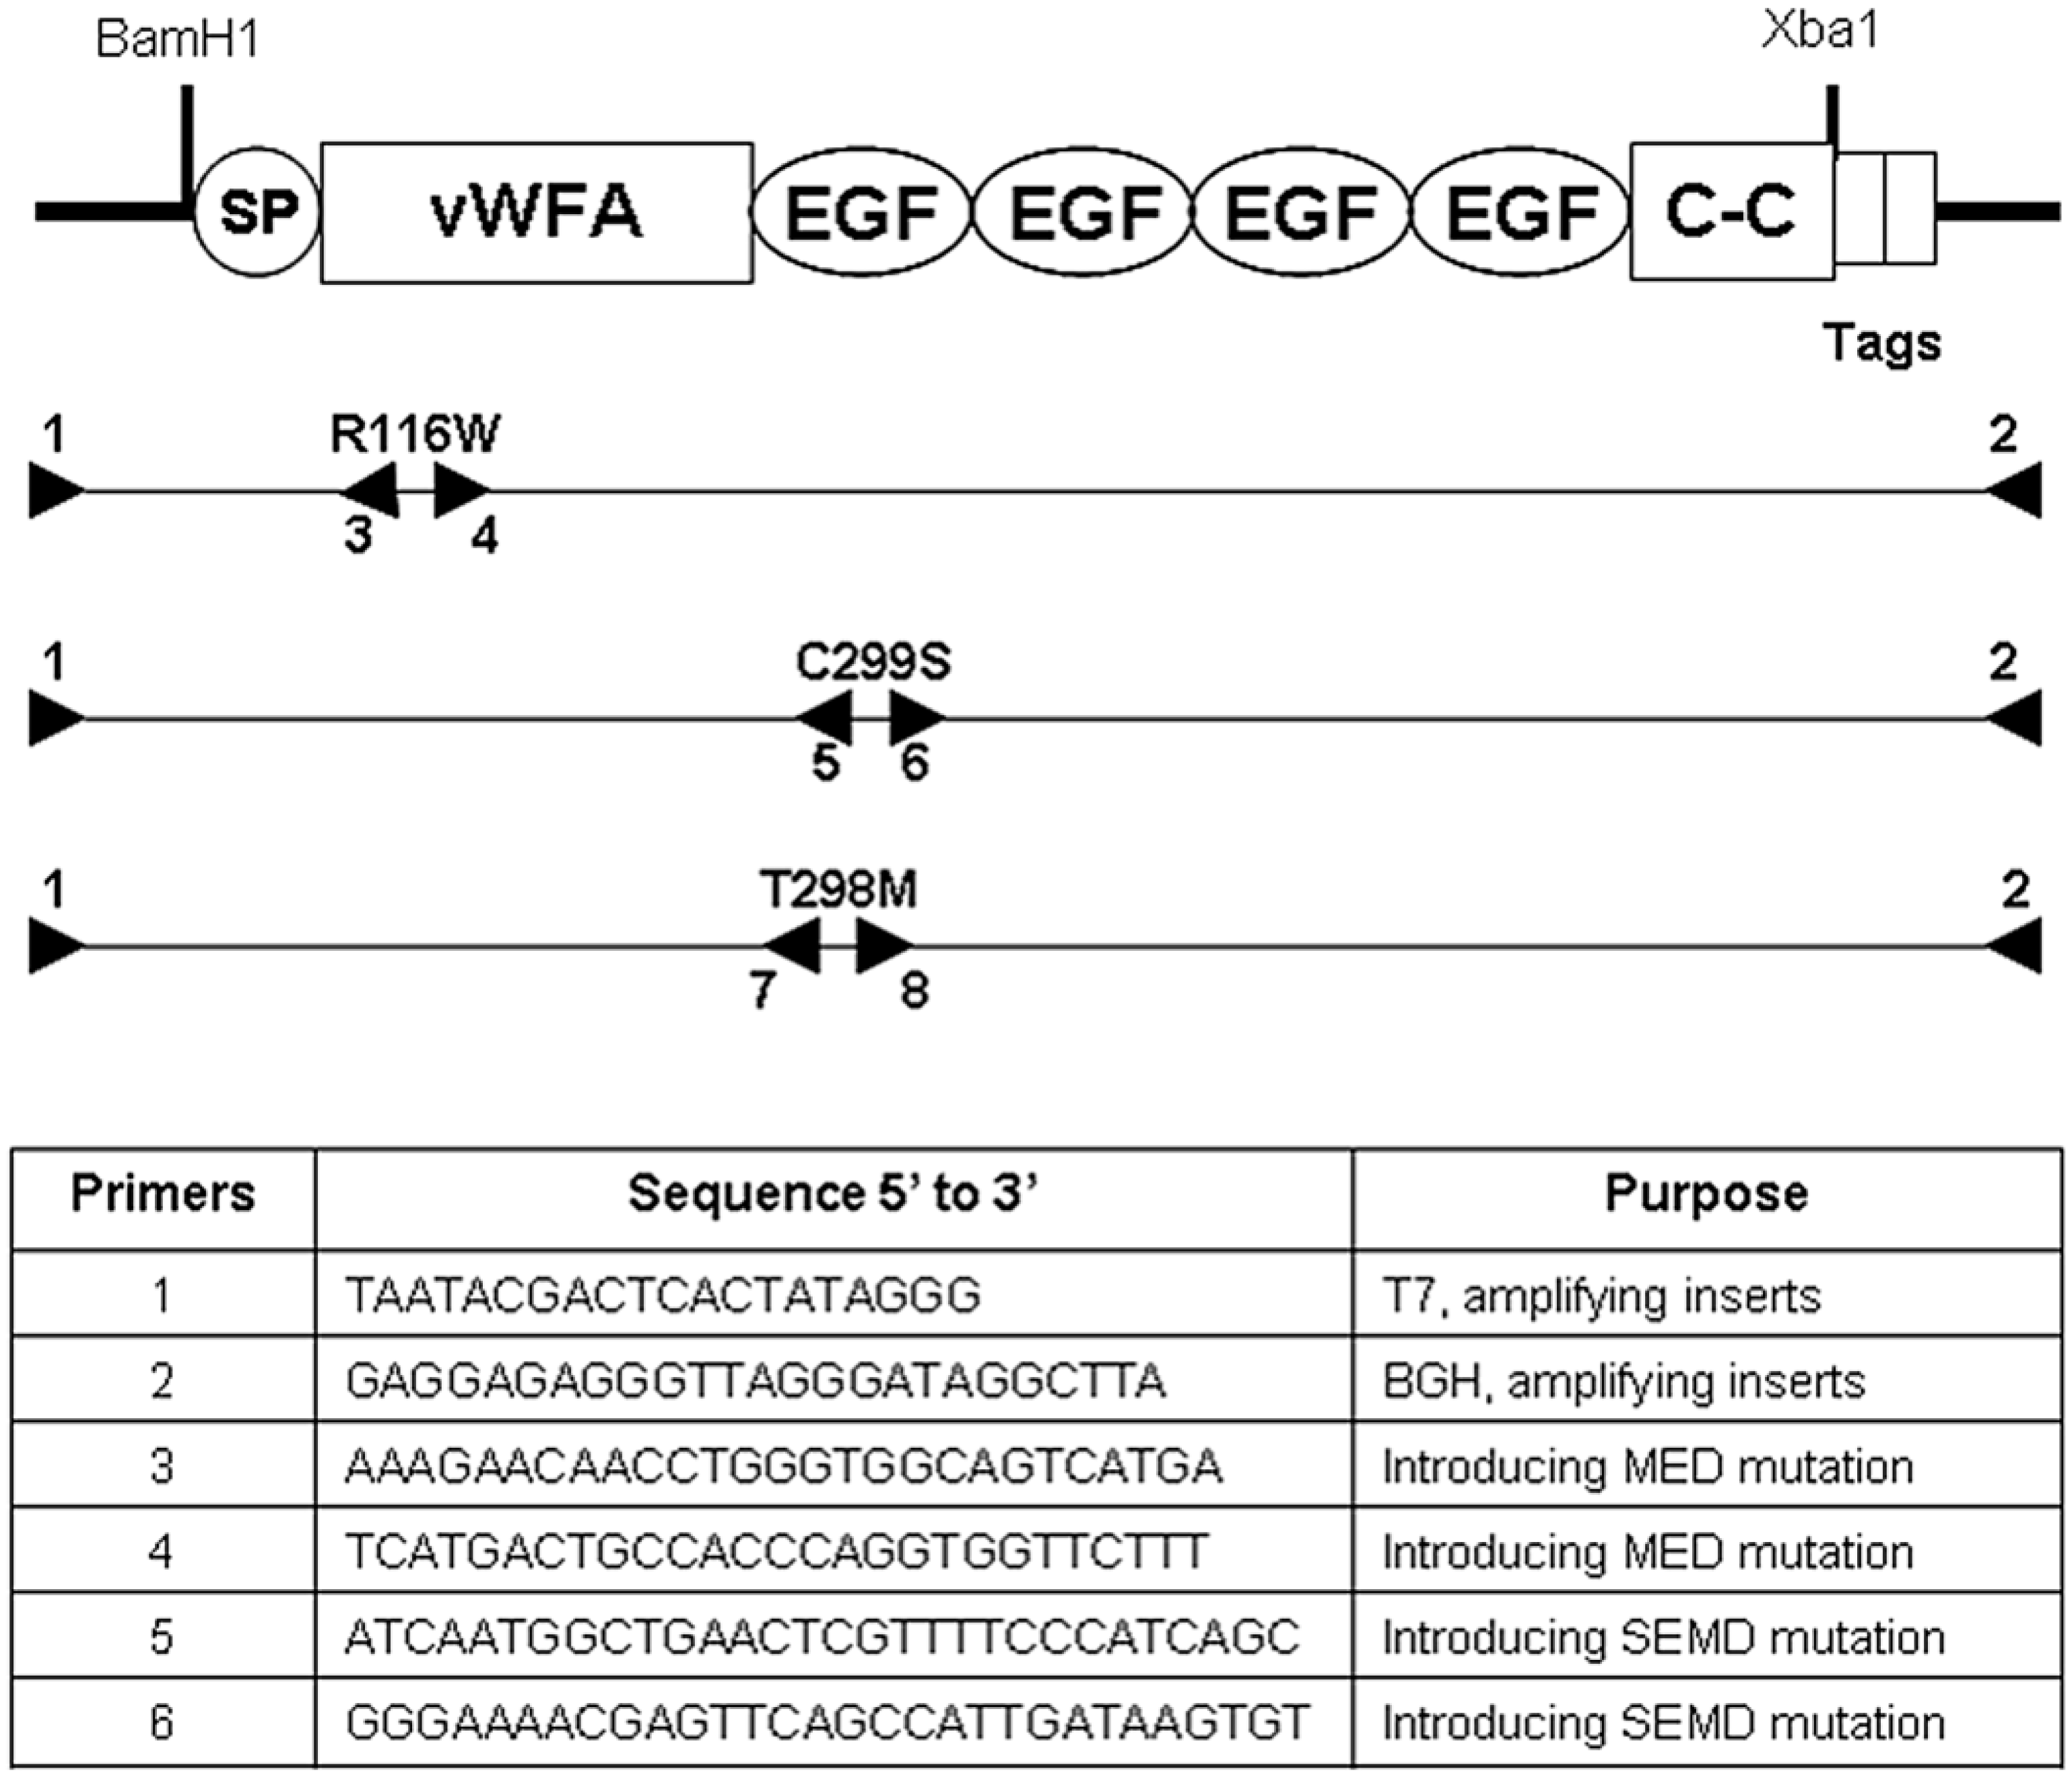
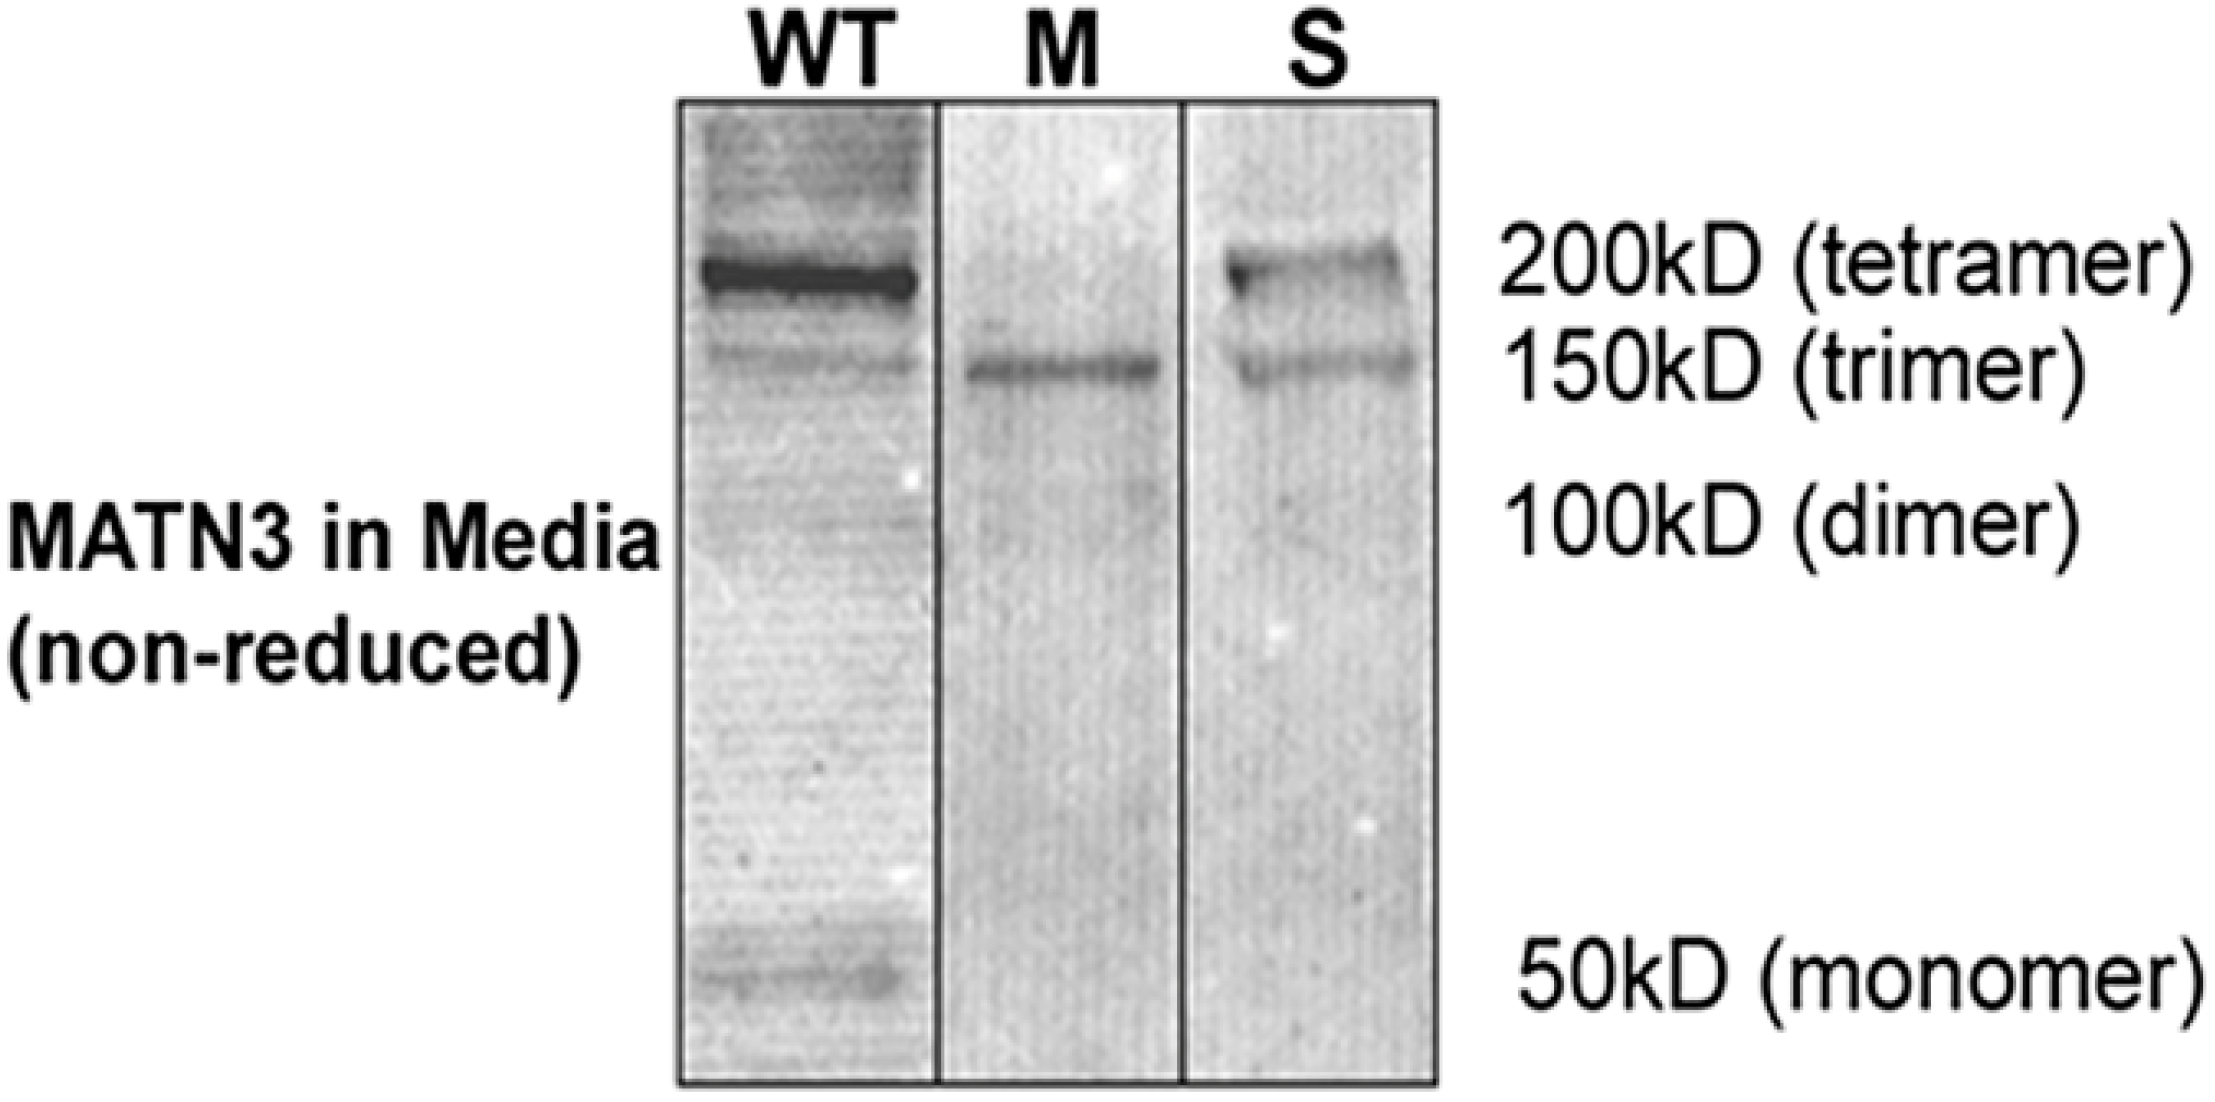
2.1. Establishment of Stable ATDC5 Cell Lines Harboring MED and SEMD Associated MATN3 Mutations

To better understand the function of MATN3 during chondrogenesis, we stably transfected the ATDC5 murine chondroprogenitor cell line with a WT MATN3 gene construct or constructs carrying the MATN3 point mutations associated with either MED or SEMD, respectively (Figure 1). Several cell lines were established by stably transfecting ATDC5 cells with WT, MED or SEMD MATN3 gene constructs. The full length WT MATN3 protein that was secreted into the cell media formed primarily tetramers along with trimer, dimer and monomer (Figure 2), which is similar to the results previously described in chondrocytes [16,20]. The MED MATN3 protein existed mainly in the form of trimer, while the SEMD MATN3 existed in the form of tetramer and trimer (Figure 2).
Figure 1. Generating multiple epiphyseal dysplasia (MED) and spondyloepimetaphyseal dysplasia (SEMD) mutant MATN3 gene constructs. Relative annealing locations of primers used to introduce the MED mutation (R116W) into the vWFA domain, and the SEMD mutation (C299S) into the first EGF-like domain, of the MATN3 gene. The purpose and sequence of each primer used are listed in the table. SP: signal peptide; C–C: coil–coil domain; Tags: V5 and 6xHis.
Ijms 15 14555 g001
Figure 2. Wild-type (WT) and mutant MATN3 protein production by stably transfected ATDC5 cell lines. Western blot analysis using an anti-V5 antibody to detect recombinant MATN3 protein in media of stably transfected with WT, MED or the SEMD MATN3 gene.
Ijms 15 14555 g002

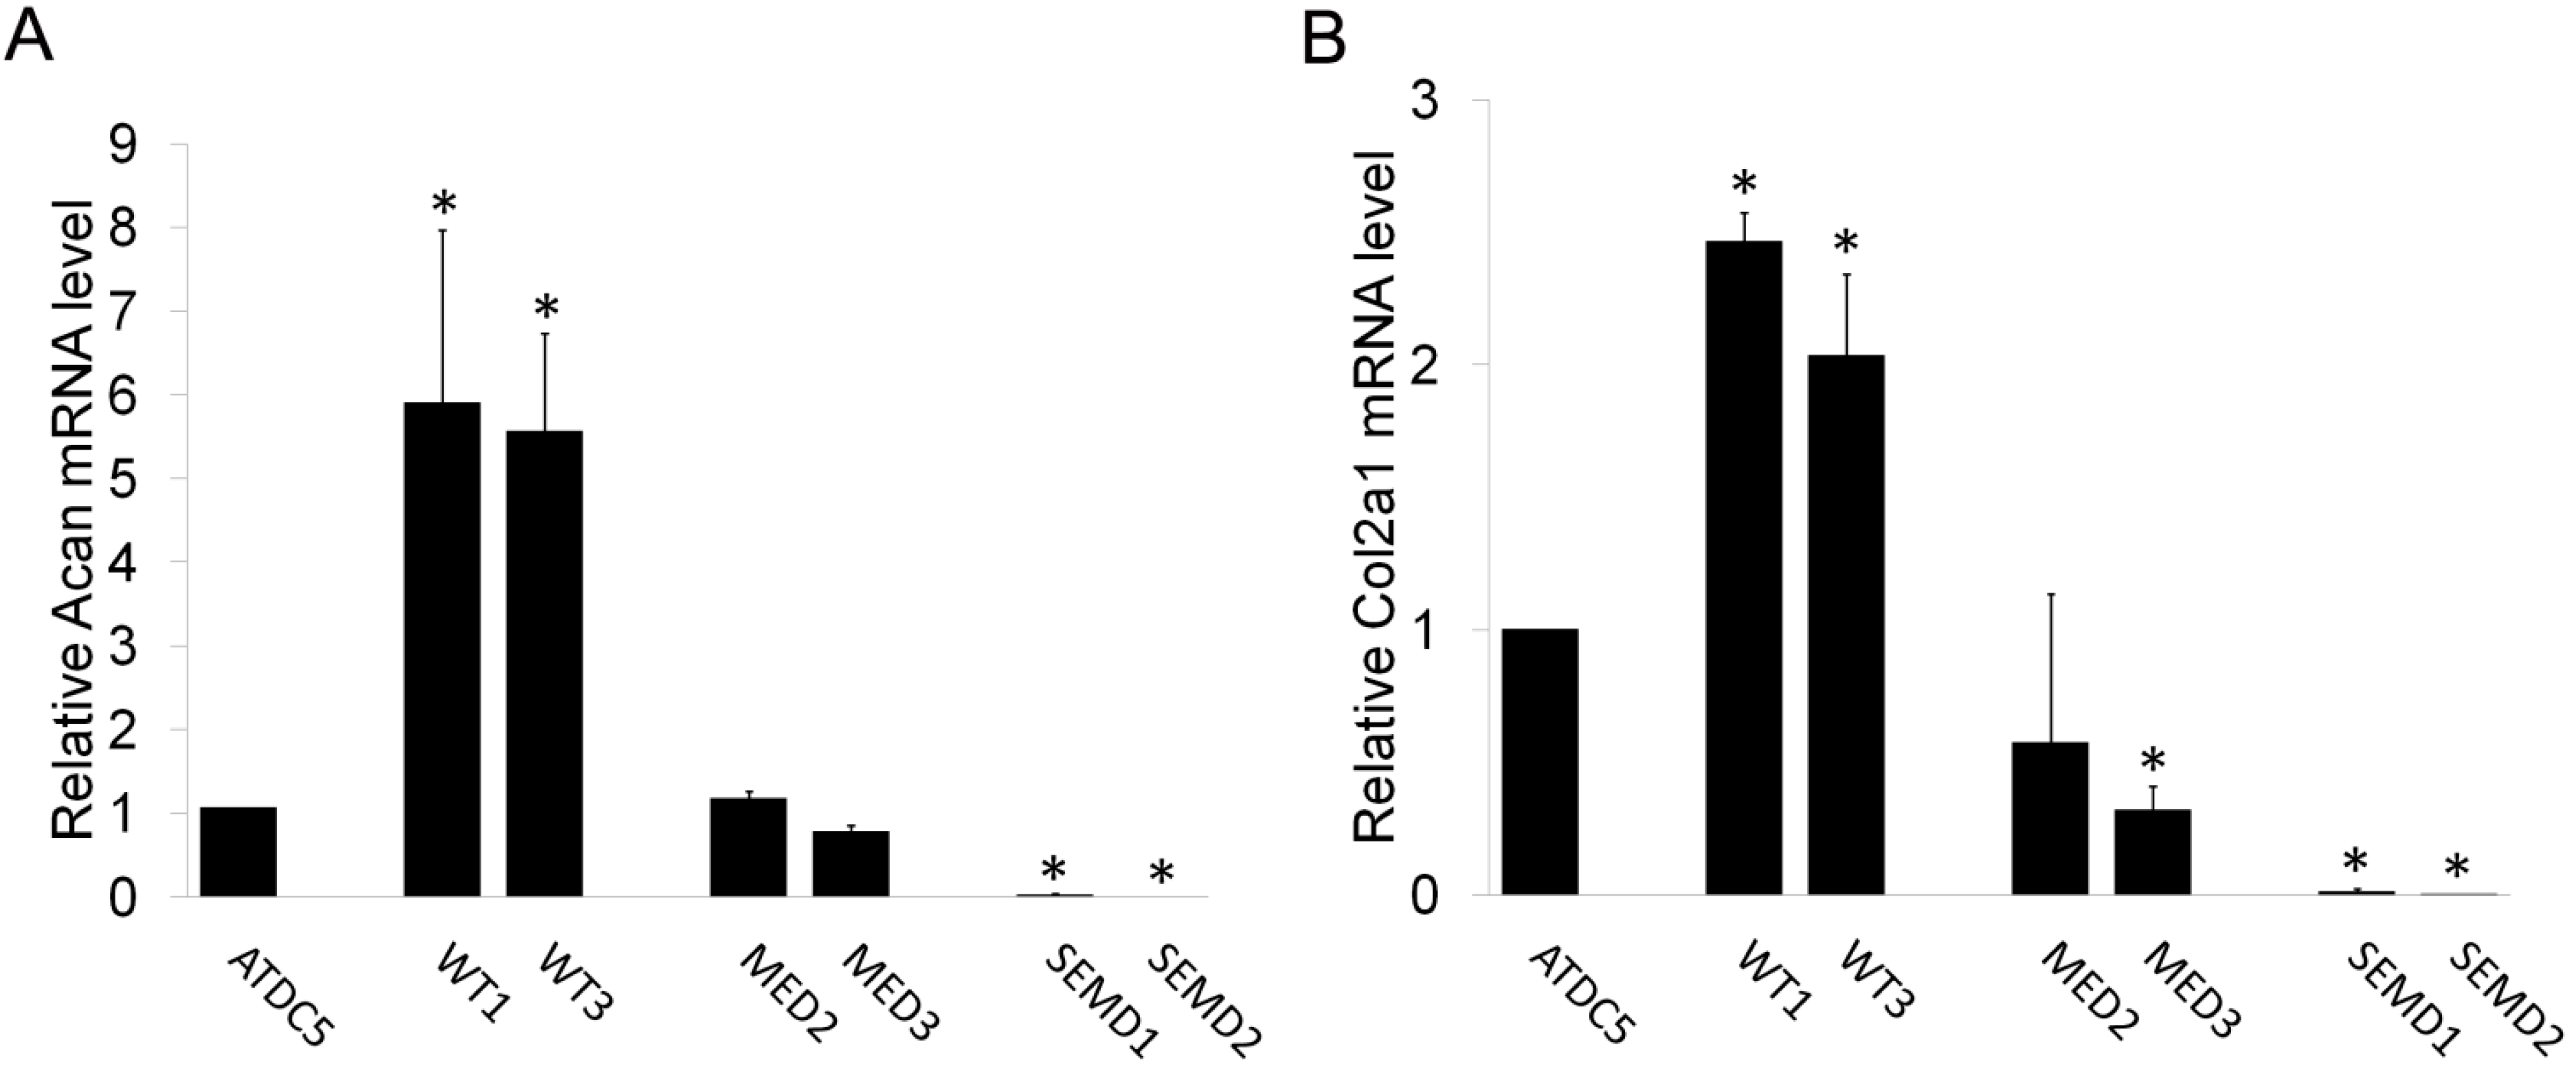
2.2. WT MATN3 Induces Spontaneous Chondrogenesis, while MED and SEMD Mutations Diminish MATN3 Induced Chondrogenic Effects, in Chondroprogenitors

To determine the extent of chondrogenesis in ATDC5 clones expressing WT or mutant MATN3 genes, total proteoglycan content was measured by alcian blue staining. After culturing in the absence of chondrogenesis induction medium for 6 and 12 days, ATDC5 cells exhibited no noticeable alcian blue staining (Figure 3A,B). However, positive staining was observed in the cells stably transfected with WT MATN3. Cells expressing MED MATN3 exhibited reduced alcian blue staining relative to those expressing WT MATN3. Moreover, SEMD MATN3 expressing cells exhibited nearly no alcian blue staining on both day 6 and 12 (Figure 3A,B). Real-time RT-PCR analysis demonstrated that WT MATN3 enhanced Acan mRNA levels from 7 fold (day 6) to more than 13 fold (day 12) relative to parental ATDC5 cells (Figure 4A,B). Furthermore, WT MATN3 expression resulted in a transient up regulation in Col2a1 mRNA peaking at day 6 and returning to basal level by day 12 (Figure 4C,D). WT MATN3 transfection did not significantly alter Col10a1 mRNA expression in ATDC5 cells (Figure 4E,F). In contrast, the MED MATN3 transfected cells exhibited significant suppression of Acan mRNA levels relative to WT MATN3 transfected cells, while SEMD MATN3 transfection abolished Acan and Col2a1 mRNA levels (Figure 4A–D). However, the hypertrophic marker Col10a1 was only upregulated significantly in ATDC5 cells expressing the MATN3 mutations at day 6 (Figure 4E), and remained high at day 12 (Figure 4F).
Figure 3. MED and SEMD associated point mutations reduce MATN3 induced chondrogenesis of ATDC5 chondroprogenitors. (A) Cells were fixed and stained for proteoglycan accumulation using alcian blue on day 6 and (B) day 12. Stains were extracted with 6 M GuHCl and intensities were quantified. *** p ≤ 0.005 vs. WT MATN3 stably transfected cells.
Ijms 15 14555 g003
Figure 4. Chondrogenesis and hypertrophic marker expression in WT and mutant MATN3 transfected ATDC5 chondroprogenitors. (A,B) Aggrecan mRNA levels; (C,D) collagen II mRNA levels; (E,F) collagen X mRNA levels as analyzed by real time RT-PCR in untransfected and MATN3 transfected ATDC5 cells on days 6 and 12, respectively. * p ≤ 0.05 , ** p ≤ 0.01 vs. WT MATN3 stably transfected ATDC5 cells.
Ijms 15 14555 g004

2.3. TGF-β1 Is Incapable of Restoring Normal Chondrogenic Phenotype to Cells Expressing the MED or SEMD MATN3 Mutation

To determine whether TGF-β1 can rescue suppressed chondrogenesis in mutant chondroprogenitors, chondrogenic differentiation in response to TGF-β1 treatment was examined by real-time RT-PCR. TGF-β1 treatment of ATDC5 cells enhanced Acan mRNA expression by approximately 100 fold and Col2a1 by 29 fold on day 6, which remained significantly elevated, with respect to untreated ATDC5 controls, at day 12 and day 16 (Figure 5 A(1),B(1)). Even though WT MATN3 can induce spontaneous chondrogenesis in chondroprogenitors, TGF-β1 treatment helped to further enhance Acan and Col2a1 expression, however, to a lesser extent than observed in the parental ATDC5 control cells (Figure 5 A(2),B(2)). In MED MATN3 cells, TGF-β1 treatment increased Acan and Col2a1 at earlier time point (day 6), but was largely ineffective at later time points (Figure 5 A(3),B(3)). In SEMD MATN3 cells, neither Acan nor Col2a1 levels were increased in response to TGF-β1 stimulation (Figure 5 A(4),B(4)). However, the hypertrophic chondrocyte marker Col10a1 was greatly induced by TGF-β1 treatment in both MED and SEMD MATN3 chondroprogenitors, while its levels remained low in WT MATN3 cells and the parental ATDC5 cells (Figure 5 C(1–4)).
Figure 5. Effects of TGF-β1 on the chondrogenic differentiation of ATDC5 cells expressing WT, MED or SEMD MATN3 during a 16 day time course. ATDC5 cells were seeded into 12 well culture plates and the growth media replaced with DMEM:F12 supplemented with or without TGF-Β1 (10 ng/mL). On Days 6, 12 and 16, gene expression was quantified in each group: untransfected ATDC5; WT MATN3; MED; SEMD, respectively. (A(14)) expression of Acan; (B(14)) Col2a1 and (C(14)) Col10a1 was measured using real-time RT-PCR. Relative quantities less than 1.00 are so indicated for clarity. * p ≤ 0.05, ** p ≤ 0.01 , *** p ≤ 0.005 vs. TGF-β1 untreated groups.
Ijms 15 14555 g005

2.4. The Effect of WT and Mutant MATN3 on Chondrogenesis Is Consistent among Different Cell Lines

We generated multiple stable cell lines harboring each MATN3 transgene (Table 1). The above data were obtained from WT3, MED2, and SEMD2. To test whether the effect of WT and mutant MATN3 on chondroprogenitor cells were consistent among different cell lines, we quantified the basal mRNA expression levels of chondrogenesis markers Acan and Col2a1 in two cell lines that expressed lower and higher expression level of each MATN3 transgene, respectively. Our results showed that the effect of MATN3 on chondrogenesis largely depended on the type of MATN3 expressed (i.e., whether it is WT or MED or SEMD), rather than the expression levels of each MATN3 transgene (Figure 6).
Table 1. Wild-type or mutant MATN3 gene expression in stably transfected ATDC5 cell lines.
Cell LinesGenerated ClonesMATN3 Expression Levels (Relative to Parental ATDC5)
WT MATN3WT12.6
WT218.4
WT325.7
MED MATN3MED11.5
MED21.9
MED317.2
SEMD MATN3SEMD16.9
SEMD246.8
SEMD31122
Figure 6. Low and high expression clones of WT and mutant MATN3 transfected cell lines show similar trend of chondrogenesis marker expression. (A) Gene expression of aggrecan and (B) type II collagen in low and high expression WT or mutant MATN3 stably transfected ATDC5 cell lines as analyzed by real time RT-PCR 24 h post seeding. * p ≤ 0.05 vs. untransfected ATDC5 cells.
Ijms 15 14555 g006

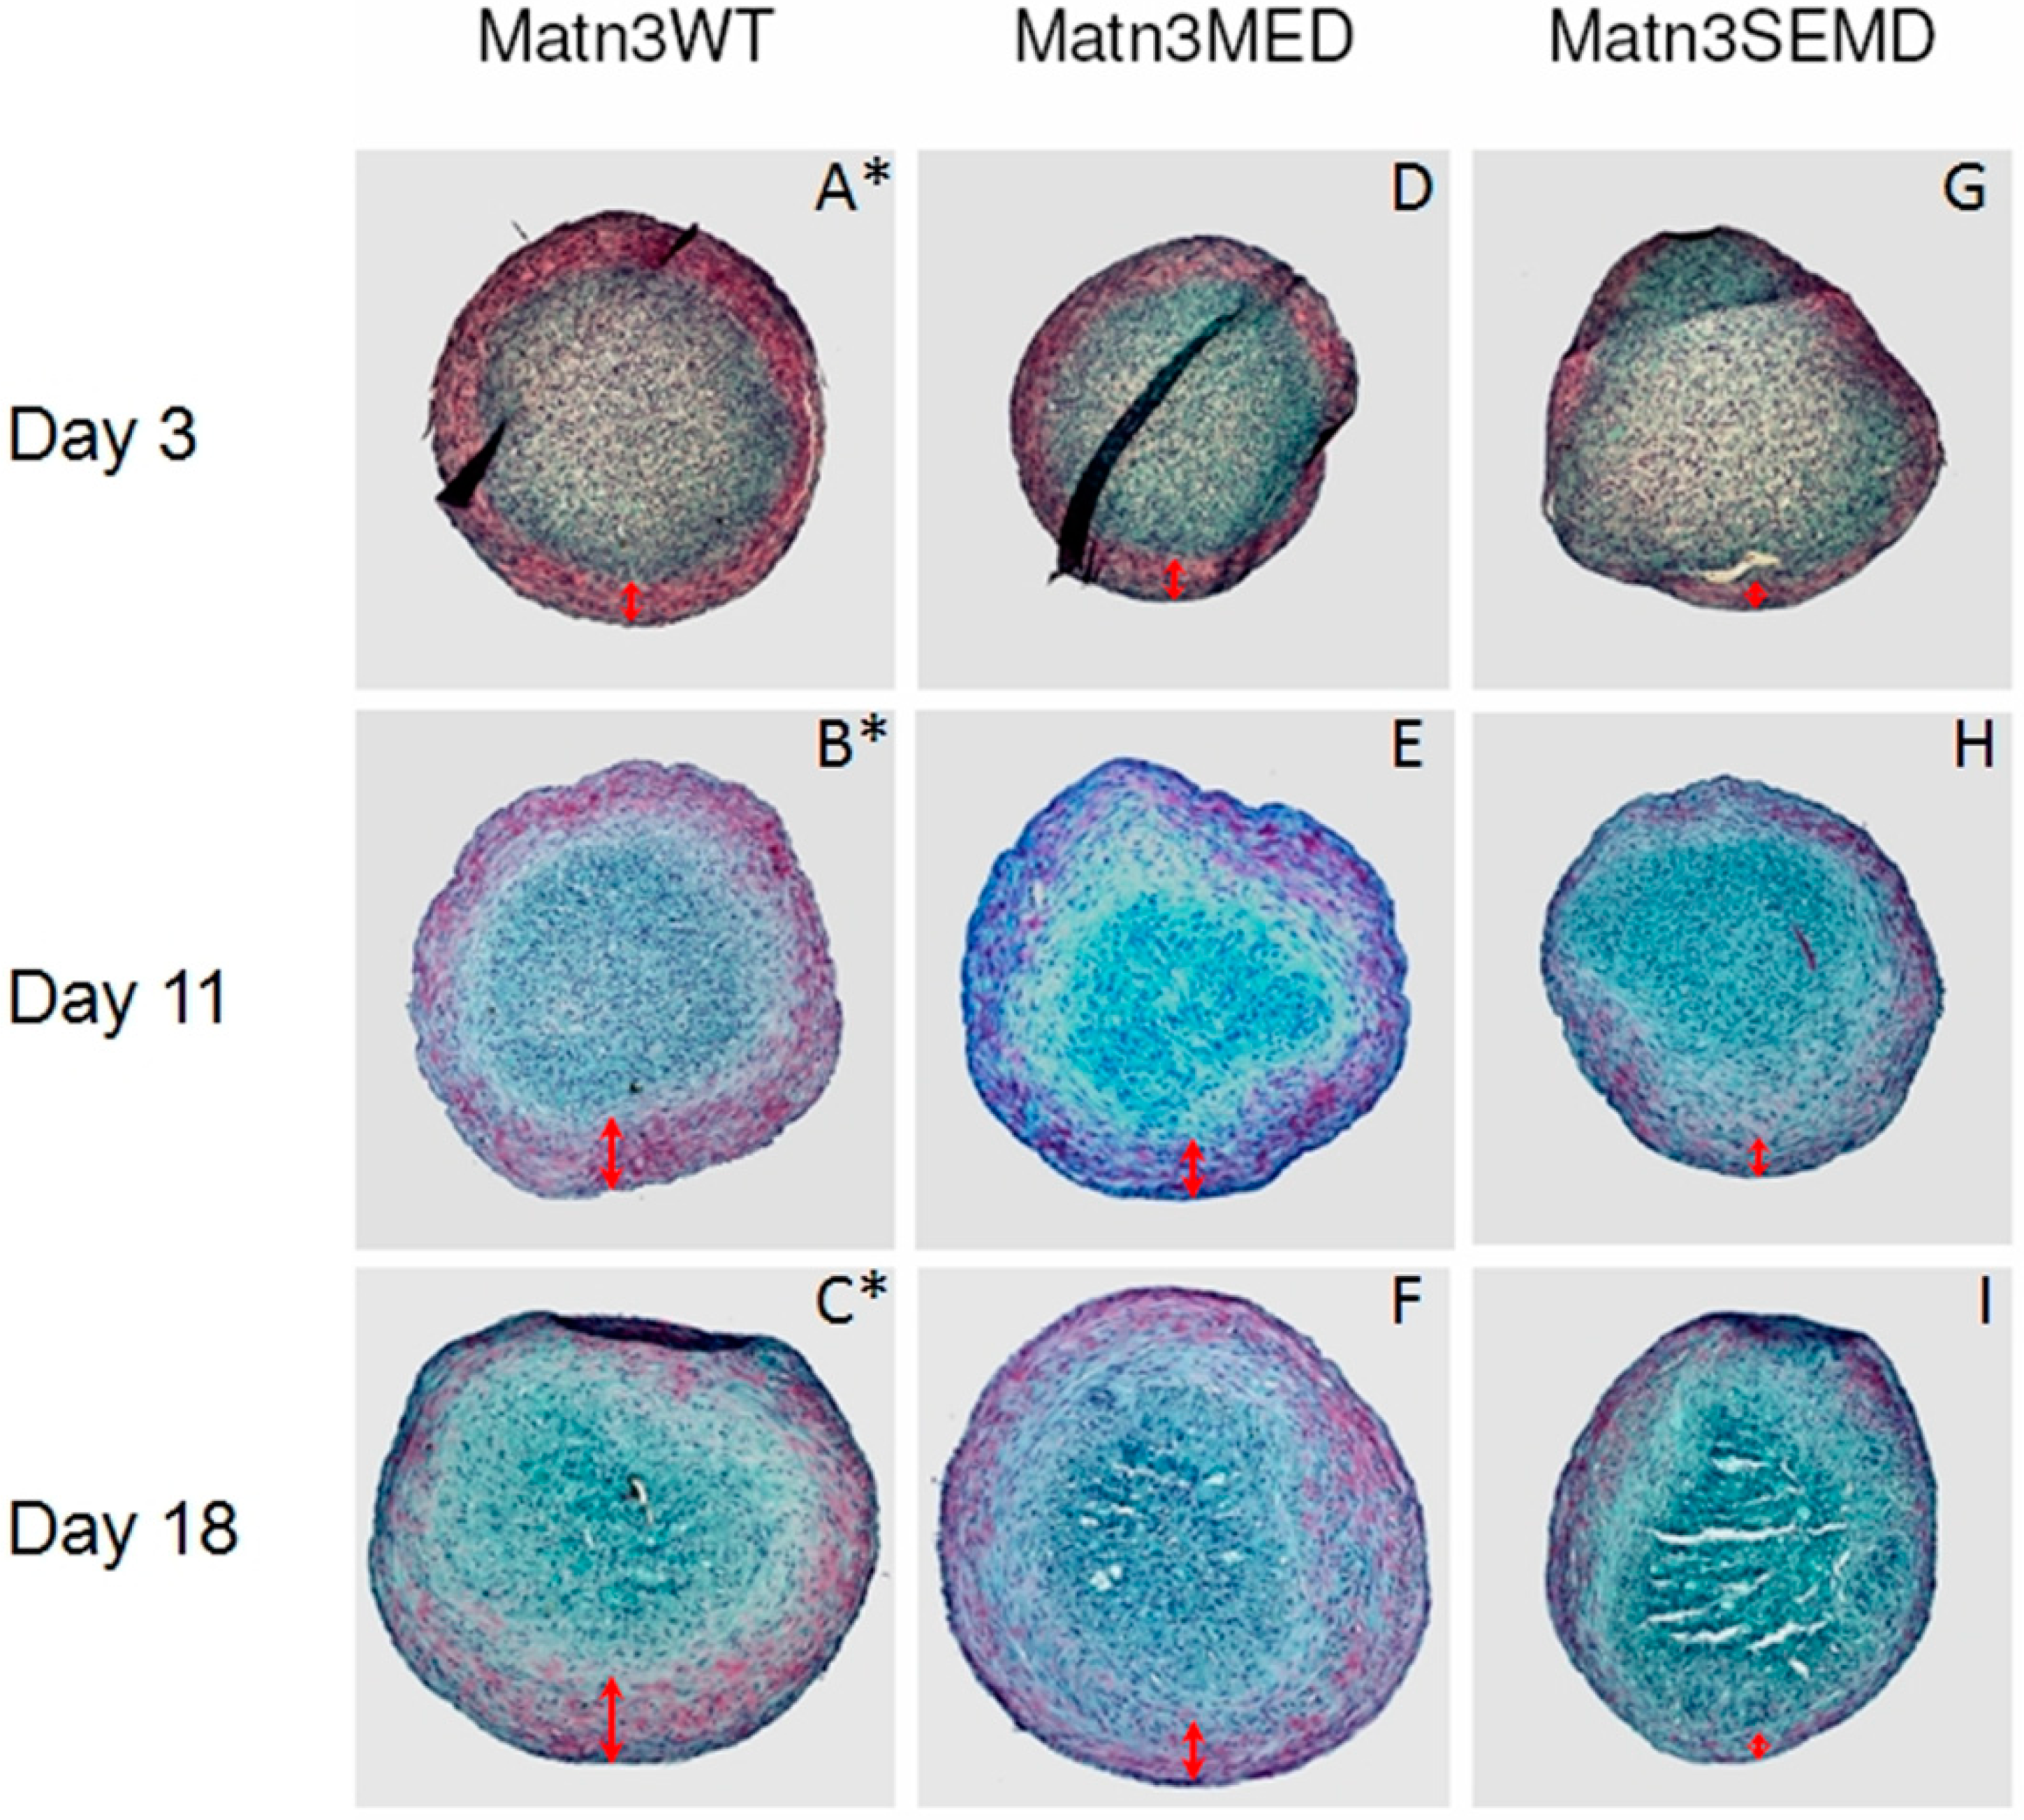
2.5. Synovium Derived Mesenchymal Stem Cells Expressing SEMD MATN3 Exhibit Diminished Chondrogenesis Potential

To investigate the effect of WT and mutant MATN3 gene expression in primary stem cells, we transfected porcine synovium derived mesenchymal stem cells (SDMSCs) with WT, MED or SEMD MATN3 gene construct respectively. They were then incubated in the presence of TGF-β to induce chondrogenesis in pellet culture. In comparison to the WT MATN3 expressing SDMSC, the GAG content was significantly lower in the SEMD MATN3 expressing SDMSC after 3 and 11 days of incubation. The GAG content of the SEMD MATN3 expressing SDMSC or non-transfected SDMSC was significantly lower than those transfected with WT MATN3 after 18 days incubation (Figure 7). Histological analysis of the SDMSC pellet culture indicates that the size of the pellet of the SEMD MATN3 expressing cells was significantly smaller than that of WT MATN3 or MED MATN3 expressing cells (Figure 8). Furthermore, the chondrogenesis area as indicated by red Safranin-O staining in the pellet was significantly smaller in the SEMD MATN3 expressing cells than that of WT MATN3 or MED MATN3 expressing cells (Figure 8). This suggests an overall attenuation of chondrogenesis in the SDMSCs transfected with the SEMD mutant MATN3 gene.
Figure 7. SEMD MATN3 transfected primary synovium derived mesenchymal stem cells exhibit reduced GAG content. GAG content was measured using a dimethylmethylene blue assay and values were normalized to DNA content. Controls are cells transfected with empty vector. ** p ≤ 0.01, *** p ≤ 0.005 vs. WT MATN3 transfected cells.
Ijms 15 14555 g007
Figure 8. The SEMD MATN3 mutation hinders MATN3 induced chondrogenesis of primary porcine synovium derived stem cells. (AC) Extent of chondrogenesis of WT MATN3 transfected; (DF) MED MATN3 transfected and (GI) SEMD MATN3 transfected porcine SDMSC pellets as indicated by Safranin-O staining. Red double headed arrows indicate the depth of each pellet’s peripheral cartilaginous zone that stained positive with Safranin-O. * Note: A, B and C were reference panels from a previous study [26] for the purpose of comparing the extent of chondrogenesis in WT MATN3 transfected cells vs. MED or SEMD MATN3 transfected cells.
Ijms 15 14555 g008

3. Experimental Section

The ATDC5 murine chondroprogenitor cell line was acquired from RIKEN cell bank, Japan. All cell culture reagents including DMEM:F12, fetal bovine serum, trypsin EDTA solution and Anti V5 antibody were purchased from Invitrogen (Carlsbad, CA, USA). Human Transferrin, Selenite, Trypan blue, Alcian Blue and GuHCl was purchased from Sigma-Aldrich (St. Louis, MO, USA) while TGF-β1 was from Peprotech (Rocky Hill, NJ, USA).

3.1. Cloning and Construction of MATN3 cDNAs

The WT MATN3 gene construct and mutant MATN3 construct containing a R116W point mutation (MED), were each cloned into expression vectors of pcDNA3.1/V5-His (Invitrogen, Carlsbad, CA, USA) as previously described [10,20]. Using similar methods, we also generated MATN3 with the C299S point mutation (SEMD) on mouse sequence NM_010770 (Figure 1). Overlapping PCR was performed to create MATN3 cDNA carrying the SEMD mutation using mouse full-length pcDNA3.1-MATN3 and Qiagen hotstart Taq (Valencia, CA, USA). Primer sequences are listed in Figure 1. The size of the 1.4 kb MATN3 product was confirmed on a 1% agarose gel. The pcDNA plasmid plus the mutated MATN3 PCR products were digested with BamH1 and Xba1 (Roche, Mannheim, Germany). The SEMD product was then ligated into pcDNA and transformed into competent E.coli DH5α cells (Invitrogen, Carlsbad, CA, USA). Colonies grown on ampicillin LB agar were picked and expanded. All plasmids were purified using high pure plasmid isolation kit (Roche, Mannheim, Germany) to check for the MATN3 inserts using BamH1 and Xba1 digestion. Furthermore, individual SEMD and MED clones were sequenced with T7 and BGH primers and confirmed to contain the desired nucleotide change in MATN3.

3.2. Establishing ATDC5 Chondroprogenitor Cell Lines and SDMSCs Harboring MATN3 Mutations

ATDC5 cells were grown in complete media (DMEM:F12, 5% FBS and 10 μg/mL Transferrin, 3 × 10⁻⁸ M sodium selenite) [24], and maintained at 37 °C and 5% CO2. Cells were split into 12 well plates and grown to 95% confluency. Transfection was performed with Lipofectamine 2000 according to manufacture instruction (Invitrogen, Carlsbad, CA, USA). Briefly, 1 μg of DNA was mixed with 2 μL Lipofectamine 2000 in serum free Opti-MEM. Within 20 min at room temperature, the mixture was added to cells. After 24 h, media was changed. G418 (5, 6, 7 or 8 μM) was added in the complete media to select against cells that were not successfully transfected. Untransfected cells were killed by incubation with 4 concentrations of G418 after 4 days. After treatment of 5 μM G4182 for two weeks, several individual clones from each transfected cell line were isolated using sterile loops and cultured to confluency in new 12 well plates with complete media without G418. All ATDC5 clones containing various MATN3 constructs were subcultured for further gene and protein characterization. Several clones were analyzed for MATN3 protein production/retention (data not shown). For several lines, gene expression analysis was conducted to verify that chondrogenesis marker expression did not greatly vary based on relative MATN3 expression alone (Figure 6). After this was confirmed, a single clone was selected to represent each WT, MED or SEMD mutant MATN3 line for experiments.
CD14 negative isolation was used to acquire primary SDMSCs from porcine synovium, as previously described [26,27,28]. SDMSCs were plated at a cell density of 1.8 × 10⁶ cells per 25 cm culture flask. After 24 h, cells were stably transfected using 8 μg of the previously described WT, MED or SEMD murine MATN3 constructs and 12 μg of FuGENE 6 (Roche, Indianapolis, IN, USA) transfection mediator, according to the manufacturer’s instruction.

3.3. SDS-Polyacrylamide Gel Electrophoresis and Western Blot Analysis

Stably transfected ATDC5 cells containing the WT or mutant MATN3 genes as well as the untransfected ATDC5 control cells were grown in monolayer in 6 well culture plates in complete media. After 3 days, cell lysates and supernatants were separately collected for western blot analysis. To concentrate MATN3 proteins from media, 50 μL Ni-Agarose beads (Invitrogen, Carlsbad, CA, USA) were used to isolate His tagged recombinant MATN3 proteins from 1.0 mL of cell supernatants. After 48 h at 4 °C on a shaker, the Ni-agarose beads from all samples were centrifuged and washed 7 times with buffer containing 20 mM potassium phosphate, 500 mM potassium chloride, 10 mM imidazole pH 7.5. Before protein samples were loaded on to 10% SDS PAGE gel, His tagged proteins were dissociated from Ni-Agarose beads by boiling at 95 °C for 10 min in 30 μL 2× SDS gel loading buffer, then put on ice and centrifuged to separate Ni-Agarose beads. For western blot, proteins were transferred onto Immobilon-PVDF membrane (Millipore Corp., Bedford, MA, USA) in 25 mM Tris, 192 mM glycine, and 15% methanol. The membranes were blocked in Odyssey® Blocking Buffer for 1 h and then probed with a mAb against murine V5 (1:5000) (Invitrogen, Carlsbad, CA, USA). IRDye® 800CW Conjugated anti-Mouse (diluted 1:10,000) (LI-COR Biosciences, Lincoln, NE, USA) was used as secondary antibody. The mutant and WT MATN3 with V5 tag proteins were visualized in the 800 nm channel using Odyssey infrared image system according to manufacturer’s instruction (LI-COR Biosciences, Lincoln, NE, USA). Molecular protein marker used is specific for the Odyssey system and is visualized in the 700 nm channel.

3.4. Experimental Cell Culture Conditions

All experiments involving ATDC5 cells were conducted in monolayer cell culture. Each selected WT, MED and SEMD MATN3 ATDC5 clone and untransfected ATDC5 control were plated in triplicate at 5 × 10⁴ cells/well in 12 well plates in DMEM:F12, 5% FBS and 10 μg/mL Transferrin, 3 × 10⁻⁸ M sodium selenite). Experiments involving primary SDMSCs were conducted using a previously described pellet culture system [26]. Transfected and mock-transfected (control) primary SDMSCs were detached using trypsin EDTA. 3.0 × 10⁵ cells were centrifuged for 10 min at 500× g to obtain cell pellets which were then cultured in 24-well plates for 3, 11 and 18 days in TGF-β1 (10 ng/mL) supplemented High-Glucose DMEM media containing: proline (40 mg/mL), 100 mM dexamethasone, 0.1 mM ascorbic acid 2-phosphate, penicillin (100 U/mL), streptomycin (100 mg/L), insulin (6.25 mg/mL), transferring (6.25 mg/mL), selenous acid (6.25 mg/mL), linoleic acid (5.35 mg/mL) and BSA (1.25 mg/mL).

3.5. RNA Isolation and Real-Time RT-PCR

Three-hundred microliters of Lysis/binding buffer (Ambion, Austin, TX, USA) was added to each monolayer cell culture well. All samples were collected and immediately processed to isolate total RNA using filter cartridge and buffers from RNAqueous Kit (Ambion, Austin, TX, USA) according to manufacturer’s instructions. Total RNA was quantified using a NanoDrop 2000c (Thermo Scientific, Wilmington, DE, USA), and 500 ng of RNA was used for cDNA synthesis using iScript Reverse Transcription Supermix (Bio-Rad Hercules, CA, USA) for RT-PCR according the manufacturer’s instructions. Quantification of mRNA was performed by RT-PCR with QuantiTect SYBR Green PCR Kit (Qiagen, Valencia, CA, USA) using the synthesized cDNA and primers described in Table 2 via Bio-Rad 96 well thermo cycler. Ribosomal RNA 18S was used as the internal control. The cycle threshold (Ct) values for specific target gene and 18S of each cDNA test sample (test) and control (ctl) were measured and obtained using Opticon Monitor Analysis Software: Version 2.02 (Bio-Rad, Hercules, CA, USA). In accordance with the delta delta Ct (∆∆Ct) method, relative transcript levels were calculated as x = 2(−ΔΔCt), where ΔΔCt = ΔE − ΔC, ΔE = CttestCt18S; ΔC = CtctlCt18S.
Table 2. Forward and reverse primer sequences used in gene expression analysis.
GeneForwardReverse
AcanCAGTGCGATGCAGGCTGGCTCCTCCGGCACTCGTTGGCTG
Col2a1CACACTGGTAAGTGGGGCAAGACCGGGATTGTGTTGTTTCAGGGTTCGGG
Col10a1GCCAGGAAAGCTGCCCCACGGAGGTCCGGTTGGGCCTGGT
MATN3TTCCACCCGCGCGCCATATTCCGTGTCTGTGGCCCCGATGTC

3.6. Alcian Blue Staining and Quantification

On Days 6 and 12, media was removed from each of the stable transfected ATDC5 clones and gently washed with sterile 1× PBS to remove detached/dead cells. Cells were fixed in cold 100% methanol for 2 min at −20 °C and gently washed with 1× PBS. Samples were stained overnight with 500 μL of 0.1% Alcian blue in 0.1 M HCl pH = 1.0, plates were washed 3 times in milli-Q water (Millipore, Billerica, MA, USA). Images of Alcian Blue staining were acquired using a Leica MZ6 Stereo microscope (Leica Microsystems, Buffalo Grove, IL, USA). Blue stains were extracted for quantification using 300 μL of 6 M GuHCl, which was incubated overnight. Extracted color was measured in a 96 well plate at 620 nm using a spectrophotometer.

3.7. Histology and Safranin-O Staining of Primary SDMSC Cell Pellets

Primary SDMSC cell pellets were fixed using 4% paraformaldehyde in PBS (pH 7.4) for 24 h at 4 °C followed by dehydration in ethanol. Specimens were then cleared using xylene and embedded in paraffin. Individual sections (5 μm) were then cut and subsequently stained with safranin-O/fast green (for visualization of GAG) and counterstained with hematoxylin [26].

3.8. GAG Quantification with Dimethylmethylene Blue Assay

After 3, 11 and 18 days in culture, primary SDMSC cell pellets were digested in buffer containing papain (125 mg/mL), 100 mM phosphate, 10 mM EDTA and 10 mM cysteine. Using the digested lysates, a dimethylmethylene blue assay [29] was conducted to measure GAG content with a spectrophotometer (PerkinElmer, Norwalk, CT, USA). Bovine chondrotin sulfate was used to generate the standard curve utilized for GAG quantification. DNA content, as measured by Hoechst 33258 dye and a spectrofluorometer (QM-1; Photon Technology International, South Brunswick, NJ, USA), was used to control for cell number. Type I calf thymus DNA (Sigma, St. Louis, MO, USA) was used to generate the standard curve utilized for DNA quantification.

3.9. Statistical Analysis

All quantitative data are expressed as mean ± SDM (standard deviation of the mean). Statistics were conducted using one-way ANOVA followed by post-hoc analysis. In Figure 5, a Student’s t-test was used to compare TGF-β1 treated and untreated groups. Differences between groups were considered statistically significant when p-value ≤0.05.

4. Discussion

Extracellular matrix (ECM) proteins have been proposed to provide a microenvironment suitable for maintaining the chondrogenic phenotype of differentiating mesenchymal stem cells [26], which is required for proper musculoskeletal development. However, it is not clear whether mutations of an ECM gene can affect chondroprogenitor cell differentiation into chondrocytes. Several chondrodysplasia mutations including MED and SEMD have been mapped to MATN3, a gene encoding a non-collagenous matrix glycoprotein [2,13,14,16,17,20,30]. Previous studies have utilized transient transfection of the MED (R116W) and SEMD (C299S) mutant MATN3 gene constructs into chondrocytes to understand their effects [16,20]. Until now, it has been generally assumed that the molecular defects of MED and SEMD reside in chondrocytes, which were thought to be the only type of cells within cartilage. However, in recent years, it has been shown that cartilage contains a population of progenitor cells of the mesenchymal origin that can differentiate along the chondrogenic lineage, which is vital for cartilage development [31,32].
The main goal of our study was to understand the role of the WT MATN3 gene, as well as MED and SEMD mutant MATN3 genes, during the process of chondroprogenitor cell differentiation, which is a crucial preamble to articular cartilage tissue formation and endochondral ossification during skeletal development. To do this, we established several chondroprogenitor cell lines by stably transfecting ATDC5 cells with the wild type, MED or SEMD MATN3 gene constructs. Using these lines, we demonstrated that chondroprogenitors expressing the WT MATN3 gene show signs of spontaneous chondrogenic differentiation. Relative to the WT MATN3 transfected cells, ATDC5 cells carrying the MED MATN3 mutation exhibited reduced chondrogenic marker expression at most tested time points. This diminishment was even more pronounced in cells carrying the SEMD MATN3 mutation. Consistent with mRNA analysis of chondrogenesis markers, alcian blue staining intensities indicated a reduction of proteoglycan accumulation in ATDC5 cells carrying either the MED or SEMD MATN3 mutant construct. The SEMD MATN3 group exhibited the greatest reduction in alcian blue staining intensity relative to wild-type MATN3 expressing cells. Similarly, primary SDMSCs expressing the SEMD MATN3 mutant construct exhibited a significant reduction of GAG content compared to the WT MATN3 group. In particular, our experiments with SDMSCs demonstrated that the presence of the SEMD associated mutant MATN3 gene can hinder the process of chondrogenesis in primary cells, in a similar way to that observed in the ATDC5 cell line, confirming that this phenomenon is not simply an isolated event observed in one particular cell model, but rather a definitive abnormality observed in cells that express this MATN3 mutation.
Furthermore, both the MED MATN3 and SEMD MATN3 expressing ATDC5 cells exhibit elevated type X collagen mRNA levels relative to the control cell group whereas WT MATN3 cells remain at normal levels, strongly suggesting that the MED and SEMD associated MATN3 mutations induce premature hypertrophy during chondroprogenitor cell differentiation. Taken together, these findings suggested that the MED and SEMD associated MATN3 mutation can dramatically impact the early stages of chondrogenesis in both chondroprogenitor cells by abrogating proteoglycan accumulation. This is the first study to report the evidence suggesting that the MED and SEMD mutations, and the SEMD mutation in particular, affect early chondrogenesis of progenitor cells. Chondrogenesis, as part of the endochondral ossification process, is a crucial step that can influence skeletal formation [33,34]. Interestingly, the significant elevation of the hypertrophic markers observed in the MED and SEMD MATN3 expressing cells also suggest that these MATN3 mutations may promote premature hypertrophy. Because the coordination between the proliferative and hypertrophic stage of chondrogenesis is critical to the longitudinal bone growth during skeletal development [35], the occurrence of premature hypertrophy may shorten the chondrogenic process thereby negatively impacting bone growth [36].
Previous studies have demonstrated that TGF-β1 treatment can promote chondrogenesis while also preventing chondrocyte hypertrophy [37,38]. To determine whether TGF-β1 can remedy the reduced chondrogenic potential and increased hypertrophy that is typical of mutant MATN3 expressing progenitor lines, we treated these cells with TGF-β1 for up to 16 days in culture. TGF-β1 treatment appeared to enhance aggrecan expression in normal chondroprogenitor cells as well as WT-MATN3 transfected cells but failed to elevate its expression in the cells harboring either MED or SEMD MATN3 mutations. The inability of TGF-β1 to rescue the attenuation of the chondrogenic marker aggrecan in the MED and SEMD expressing cells suggests that TGF-β1 is not effective in restoring the normal chondrogenic phenotype in mutant chondroprogenitor cells. What is more, TGF-β1 treatment further increased the already elevated type X collagen mRNA levels in both MED and SEMD MATN3 expressing cells. This suggests that the combined effect of TGF-β1 and mutant MATN3 proteins may expedite terminal differentiation in these chondroprogenitor cells.
Overall, the present study presents evidence supporting the hypothesis that cartilage ECM protein MATN3 provides a microenvironment suitable for promoting chondrogenic differentiation and inhibiting hypertrophy for chondroprogenitors. We demonstrate here for the first time that MED or SEMD chondrodysplasia associated MATN3 missense mutations have a dominant effect to render attenuated chondrogenesis and premature hypertrophy in chondroprogenitor cells.

Acknowledgments

The authors would like to acknowledge Junming Luo for his assistance with generating the WT, MED and SEMD mutant MATN3 gene constructs. This study was supported by funding from NIH and Arthritis Foundation. F.H.Z. was funded by the Australian NHMRC overseas training fellowship.

Author Contributions

C.T.J. contributed significantly to article composition and acquisition of the majority of data presented including gene expression analysis by RT-PCR and ATDC5 cell staining via Alcian blue. He also contributed to experimental design and performed final analysis and interpretation of the data, final data assembly as well as statistical analysis and approved the article for submission.
F.H.Z. contributed significantly to experimental design. She assisted with article composition and acquisition of data. She contributed to the analysis of gene expression and staining data of ATDC5 cells and assisted with data assembly and approved the article for submission.
M.P. contributed in the acquisition of data by performing all experiments involving primary porcine SDMSCs. He also assisted in data assembly and statistical analysis thereof. He has revised the article and approved it for submission.
Z.W. generated the stably transfected ATDC5 cell lines used in this study. He has revised the article and approved it for submission.
N.L. contributed to the mRNA characterization of stably transfected ATDC5 cell lines. He has revised the article and approved it for submission.
P.H. contributed to the protein characterization of stably transfected ATDC5 cell lines. He has revised the article and approved it for submission.
Q.C. made significant contributions to designing the study and supervised it to completion. He also funded the study and assisted in data interpretation and analysis. He has revised the article and approved it for submission.

Conflicts of Interest

The authors declare no conflict of interest.

References

  1. Chapman, K.L.; Mortier, G.R.; Chapman, K.; Loughlin, J.; Grant, M.E.; Briggs, M.D. Mutations in the Region Encoding the Von Willebrand Factor A Domain of Matrilin-3 Are Associated with Multiple Epiphyseal Dysplasia. Nat. Genet. 2001, 28, 393–396. [Google Scholar] [CrossRef] [PubMed]
  2. Borochowitz, Z.U.; Scheffer, D.; Adir, V.; Dagoneau, N.; Munnich, A.; Cormier-Daire, V. Spondylo-Epi-Metaphyseal Dysplasia (SEMD) Matrilin 3 Type: Homozygote Matrilin 3 Mutation in a Novel Form of SEMD. J. Med. Genet. 2004, 41, 366–372. [Google Scholar] [CrossRef] [PubMed]
  3. Klatt, A.R.; Nitsche, D.P.; Kobbe, B.; Morgelin, M.; Paulsson, M.; Wagener, R. Molecular Structure and Tissue Distribution of Matrilin-3, a Filament-Forming Extracellular Matrix Protein Expressed during Skeletal Development. J. Biol. Chem. 2000, 275, 3999–4006. [Google Scholar] [CrossRef] [PubMed]
  4. Deak, F.; Wagener, R.; Kiss, I.; Paulsson, M. The Matrilins: A Novel Family of Oligomeric Extracellular Matrix Proteins. Matrix Biol. 1999, 18, 55–64. [Google Scholar] [CrossRef] [PubMed]
  5. Budde, B.; Blumbach, K.; Ylostalo, J.; Zaucke, F.; Ehlen, H.W.; Wagener, R.; Ala-Kokko, L.; Paulsson, M.; Bruckner, P.; Grassel, S. Altered Integration of Matrilin-3 into Cartilage Extracellular Matrix in the Absence of Collagen IX. Mol. Cell. Biol. 2005, 25, 10465–10478. [Google Scholar] [CrossRef] [PubMed]
  6. Fresquet, M.; Jowitt, T.A.; Ylostalo, J.; Coffey, P.; Meadows, R.S.; Ala-Kokko, L.; Thornton, D.J.; Briggs, M.D. Structural and Functional Characterization of Recombinant Matrilin-3 A-Domain and Implications for Human Genetic Bone Diseases. J. Biol. Chem. 2007, 282, 34634–34643. [Google Scholar] [CrossRef] [PubMed]
  7. Mann, H.H.; Ozbek, S.; Engel, J.; Paulsson, M.; Wagener, R. Interactions between the Cartilage Oligomeric Matrix Protein and Matrilins. Implications for Matrix Assembly and the Pathogenesis of Chondrodysplasias. J. Biol. Chem. 2004, 279, 25294–25298. [Google Scholar]
  8. Klatt, A.R.; Paulsson, M.; Wagener, R. Expression of Matrilins during Maturation of Mouse Skeletal Tissues. Matrix Biol. 2002, 21, 289–296. [Google Scholar] [CrossRef] [PubMed]
  9. Wu, J.J.; Eyre, D.R. Matrilin-3 Forms Disulfide-Linked Oligomers with Matrilin-1 in Bovine Epiphyseal Cartilage. J. Biol. Chem. 1998, 273, 17433–17438. [Google Scholar] [CrossRef] [PubMed]
  10. Zhang, Y.; Chen, Q. Changes of Matrilin Forms during Endochondral Ossification. Molecular Basis of Oligomeric Assembly. J. Biol. Chem. 2000, 275, 32628–32634. [Google Scholar]
  11. Treble, N.J.; Jensen, F.O.; Bankier, A.; Rogers, J.G.; Cole, W.G. Development of the Hip in Multiple Epiphyseal Dysplasia. Natural History and Susceptibility to Premature Osteoarthritis. J. Bone Jt. Surg. Br. 1990, 72, 1061–1064. [Google Scholar]
  12. Unger, S.L.; Briggs, M.D.; Holden, P.; Zabel, B.; Ala-Kokko, L.; Paassilta, P.; Lohiniva, J.; Rimoin, D.L.; Lachman, R.S.; Cohn, D.H. Multiple Epiphyseal Dysplasia: Radiographic Abnormalities Correlated with Genotype. Pediatr. Radiol. 2001, 31, 10–18. [Google Scholar] [CrossRef] [PubMed]
  13. Makitie, O.; Mortier, G.R.; Czarny-Ratajczak, M.; Wright, M.J.; Suri, M.; Rogala, P.; Freund, M.; Jackson, G.C.; Jakkula, E.; Ala-Kokko, L.; et al. Clinical and Radiographic Findings in Multiple Epiphyseal Dysplasia Caused by MATN3 Mutations: Description of 12 Patients. Am. J. Med. Genet. A 2004, 125A, 278–284. [Google Scholar] [CrossRef] [PubMed]
  14. Jackson, G.C.; Barker, F.S.; Jakkula, E.; Czarny-Ratajczak, M.; Makitie, O.; Cole, W.G.; Wright, M.J.; Smithson, S.F.; Suri, M.; Rogala, P.; et al. Missense Mutations in the Β Strands of the Single A-Domain of Matrilin-3 Result in Multiple Epiphyseal Dysplasia. J. Med. Genet. 2004, 41, 52–59. [Google Scholar] [CrossRef] [PubMed]
  15. Mabuchi, A.; Haga, N.; Maeda, K.; Nakashima, E.; Manabe, N.; Hiraoka, H.; Kitoh, H.; Kosaki, R.; Nishimura, G.; Ohashi, H.; et al. Novel and Recurrent Mutations Clustered in the Von Willebrand Factor A Domain of MATN3 in Multiple Epiphyseal Dysplasia. Hum. Mutat. 2004, 24, 439–440. [Google Scholar] [CrossRef] [PubMed]
  16. Otten, C.; Wagener, R.; Paulsson, M.; Zaucke, F. Matrilin-3 Mutations that Cause Chondrodysplasias Interfere with Protein Trafficking while a Mutation Associated with Hand Osteoarthritis does Not. J. Med. Genet. 2005, 42, 774–779. [Google Scholar] [CrossRef] [PubMed]
  17. Cotterill, S.L.; Jackson, G.C.; Leighton, M.P.; Wagener, R.; Makitie, O.; Cole, W.G.; Briggs, M.D. Multiple Epiphyseal Dysplasia Mutations in MATN3 Cause Misfolding of the A-Domain and Prevent Secretion of Mutant Matrilin-3. Hum. Mutat. 2005, 26, 557–565. [Google Scholar] [CrossRef] [PubMed]
  18. Fresquet, M.; Jackson, G.C.; Loughlin, J.; Briggs, M.D. Novel Mutations in Exon 2 of MATN3 Affect Residues within the Alpha-Helices of the A-Domain and can Result in the Intracellular Retention of Mutant Matrilin-3. Hum. Mutat. 2008, 29, 330. [Google Scholar] [CrossRef] [PubMed]
  19. Kim, O.H.; Park, H.; Seong, M.W.; Cho, T.J.; Nishimura, G.; Superti-Furga, A.; Unger, S.; Ikegawa, S.; Choi, I.H.; Song, H.R.; et al. Revisit of Multiple Epiphyseal Dysplasia: Ethnic Difference in Genotypes and Comparison of Radiographic Features Linked to the COMP and MATN3 Genes. Am. J. Med. Genet. A 2011, 155A, 2669–2680. [Google Scholar] [CrossRef] [PubMed]
  20. Zhang, Y.; Wang, Z.K.; Luo, J.M.; Kanbe, K.; Chen, Q. Multiple Functions of the Von Willebrand Factor A Domain in Matrilins: Secretion, Assembly, and Proteolysis. J. Orthop. Surg. Res. 2008, 3, 21. [Google Scholar] [CrossRef] [PubMed]
  21. Leighton, M.P.; Nundlall, S.; Starborg, T.; Meadows, R.S.; Suleman, F.; Knowles, L.; Wagener, R.; Thornton, D.J.; Kadler, K.E.; Boot-Handford, R.P.; et al. Decreased Chondrocyte Proliferation and Dysregulated Apoptosis in the Cartilage Growth Plate are Key Features of a Murine Model of Epiphyseal Dysplasia Caused by a MATN3 Mutation. Hum. Mol. Genet. 2007, 16, 1728–1741. [Google Scholar] [CrossRef] [PubMed]
  22. Yang, W.; Wang, J.; Moore, D.C.; Liang, H.; Dooner, M.; Wu, Q.; Terek, R.; Chen, Q.; Ehrlich, M.G.; Quesenberry, P.J.; et al. Ptpn11 Deletion in a Novel Progenitor Causes Metachondromatosis by Inducing Hedgehog Signalling. Nature 2013, 499, 491–495. [Google Scholar] [CrossRef] [PubMed]
  23. Chen, Q.; Johnson, D.M.; Haudenschild, D.R.; Goetinck, P.F. Progression and Recapitulation of the Chondrocyte Differentiation Program: Cartilage Matrix Protein is a Marker for Cartilage Maturation. Dev. Biol. 1995, 172, 293–306. [Google Scholar] [CrossRef] [PubMed]
  24. Atsumi, T.; Miwa, Y.; Kimata, K.; Ikawa, Y. A Chondrogenic Cell Line Derived from a Differentiating Culture of AT805 Teratocarcinoma Cells. Cell Differ. Dev. 1990, 30, 109–116. [Google Scholar] [CrossRef] [PubMed]
  25. Choi, H.J.; Nepal, M.; Park, Y.R.; Lee, H.K.; Oh, S.R.; Soh, Y. Stimulation of Chondrogenesis in ATDC5 Chondroprogenitor Cells and Hypertrophy in Mouse by Genkwadaphnin. Eur. J. Pharmacol. 2011, 655, 9–15. [Google Scholar] [CrossRef] [PubMed]
  26. Pei, M.; Luo, J.; Chen, Q. Enhancing and Maintaining Chondrogenesis of Synovial Fibroblasts by Cartilage Extracellular Matrix Protein Matrilins. Osteoarthr. Cartil. 2008, 16, 1110–1117. [Google Scholar] [CrossRef] [PubMed]
  27. Pei, M.; He, F.; Vunjak-Novakovic, G. Synovium-Derived Stem Cell-Based Chondrogenesis. Differentiation 2008, 76, 1044–1056. [Google Scholar] [CrossRef] [PubMed]
  28. Bilgen, B.; Ren, Y.; Pei, M.; Aaron, R.K.; Ciombor, D.M. CD14-Negative Isolation Enhances Chondrogenesis in Synovial Fibroblasts. Tissue Eng. Part A 2009, 15, 3261–3270. [Google Scholar] [CrossRef] [PubMed]
  29. Farndale, R.W.; Buttle, D.J.; Barrett, A.J. Improved Quantitation and Discrimination of Sulphated Glycosaminoglycans by use of Dimethylmethylene Blue. Biochim. Biophys. Acta 1986, 883, 173–177. [Google Scholar] [CrossRef] [PubMed]
  30. Mostert, A.K.; Dijkstra, P.F.; Jansen, B.R.; van Horn, J.R.; de Graaf, B.; Heutink, P.; Lindhout, D. Familial Multiple Epiphyseal Dysplasia due to a Matrilin-3 Mutation: Further Delineation of the Phenotype Including 40 Years Follow-Up. Am. J. Med. Genet. A 2003, 120A, 490–497. [Google Scholar] [CrossRef] [PubMed]
  31. O'Sullivan, J.; D'Arcy, S.; Barry, F.P.; Murphy, J.M.; Coleman, C.M. Mesenchymal Chondroprogenitor Cell Origin and Therapeutic Potential. Stem Cell. Res. Ther. 2011, 2, 8. [Google Scholar]
  32. Dowthwaite, G.P.; Bishop, J.C.; Redman, S.N.; Khan, I.M.; Rooney, P.; Evans, D.J.; Haughton, L.; Bayram, Z.; Boyer, S.; Thomson, B.; et al. The Surface of Articular Cartilage Contains a Progenitor Cell Population. J. Cell. Sci. 2004, 117, 889–897. [Google Scholar] [CrossRef] [PubMed]
  33. Barna, M.; Niswander, L. Visualization of Cartilage Formation: Insight into Cellular Properties of Skeletal Progenitors and Chondrodysplasia Syndromes. Dev. Cell. 2007, 12, 931–941. [Google Scholar] [CrossRef] [PubMed]
  34. Zuscik, M.J.; Hilton, M.J.; Zhang, X.; Chen, D.; O’Keefe, R.J. Regulation of Chondrogenesis and Chondrocyte Differentiation by Stress. J. Clin. Investig. 2008, 118, 429–438. [Google Scholar] [CrossRef] [PubMed]
  35. De Luca, F.; Barnes, K.M.; Uyeda, J.A.; De-Levi, S.; Abad, V.; Palese, T.; Mericq, V.; Baron, J. Regulation of Growth Plate Chondrogenesis by Bone Morphogenetic Protein-2. Endocrinology 2001, 142, 430–436. [Google Scholar]
  36. Vega, R.B.; Matsuda, K.; Oh, J.; Barbosa, A.C.; Yang, X.; Meadows, E.; McAnally, J.; Pomajzl, C.; Shelton, J.M.; Richardson, J.A.; et al. Histone Deacetylase 4 Controls Chondrocyte Hypertrophy during Skeletogenesis. Cell 2004, 119, 555–566. [Google Scholar] [CrossRef] [PubMed]
  37. Ballock, R.T.; Heydemann, A.; Wakefield, L.M.; Flanders, K.C.; Roberts, A.B.; Sporn, M.B. TGF-Β 1 Prevents Hypertrophy of Epiphyseal Chondrocytes: Regulation of Gene Expression for Cartilage Matrix Proteins and Metalloproteases. Dev. Biol. 1993, 158, 414–429. [Google Scholar] [CrossRef] [PubMed]
  38. Van der Kraan, P.M.; Blaney Davidson, E.N.; Blom, A.; van den Berg, W.B. TGF-Β Signaling in Chondrocyte Terminal Differentiation and Osteoarthritis: Modulation and Integration of Signaling Pathways through Receptor-Smads. Osteoarthr. Cartil. 2009, 17, 1539–1545. [Google Scholar]

