Article

Comparative Proteomic Analysis of Gossypium thurberi in Response to Verticillium dahliae Inoculation

1
Economic Crop Research Institute, Henan Academy of Agricultural Sciences, Zhengzhou 450002, China
2
State Key Laboratory of Cotton Biology, Institute of Cotton Research, Chinese Academy of Agricultural Sciences, Anyang 455000, China
3
Plant Protection Research Institute, Henan Academy of Agricultural Sciences, Zhengzhou 450002, China
4
Department of Biological Sciences, Texas Tech University, Lubbock, TX 79409, USA
5
Department of Crop Biotechnology, Agronomy College, Henan Agricultural University, Zhengzhou 450002, China
*
Authors to whom correspondence should be addressed.
These authors contributed equally to this work.
Int. J. Mol. Sci. 2015, 16(10), 25121-25140; https://doi.org/10.3390/ijms161025121
Submission received: 27 June 2015 / Revised: 12 October 2015 / Accepted: 12 October 2015 / Published: 22 October 2015
(This article belongs to the Special Issue Plant Microbe Interaction)

Abstract

:
Verticillium wilt is threatening cotton productivity globally. This disease is caused by soil-borne Verticillium dahliae which directly infects cotton roots, and exclusively colonizes and occludes xylem vessels, finally resulting in necrosis, defoliation, and most severely, plant death. For the first time, iTRAQ (isobaric tags for relative and absolute quantification) was applied to screen the differentially expressed proteins of Gossypium thurberi inoculated with V. dahliae. A total of 6533 proteins were identified from the roots of G. thurberi after inoculation with V. dahliae, and 396 showed up- and 279 down-regulated in comparison to a mock-inoculated roots. Of these identified proteins, the main functional groups were those involved in cell wall organization and reinforcement, disease-resistant chemicals of secondary metabolism, phytohormone signaling, pathogenesis-related proteins, and disease-resistant proteins. Physiological and biochemical analysis showed that peroxidase activity, which promotes the biosynthesis and accumulation of lignin, was induced early in the hypocotyl after inoculation with V. dahliae. Similarly, salicylic acid also accumulated significantly in hypocotyl of the seedlings after inoculation. These findings provide an important knowledge of the molecular events and regulatory networks occurring during G. thurberi-V. dahliae interaction, which may provide a foundation for breeding disease-resistance in cotton.

1. Introduction

Cotton (Gossypium spp.) is the most important fiber crop and one of the sources for edible oil and protein [1]. Cotton production and yield is detrimentally affected by the soil borne pathogen V. dahliae [2,3,4]. Severe outbreaks of this disease can cause yield reductions of up to 30% [5]. Fungicides and chemicals means have proven ineffective at controlling Verticillium wilt, although some cultural practices such as appropriate seeding and crop rotation can suppress the development of the disease to some extent [6].
Several reports show that, although some of the main cultivars (upland cotton, Gossypium hirsutum L.) were sensitive to Verticillium wilt, variation in resistance to Verticillium wilt was identified among different cotton cultivars or germplasm resources [7,8]. Using these resistant cultivars or genetic resource, progress has been made to characterize cotton defense in response to V. dahliae infection. For example, some defense responsive genes were identified such as PR10 [9], ERF-Like transcription factor [10], anti-apoptosis [11], major latex protein [12] and a receptor-like protein [13]. In addition, cotton inoculation experiments showed that some resistance genes could be induced within 10 min in response to pathogen infection [12]. These findings indicate the complexity of cotton defense response to V. dahliae infection, which may involves multiple defense pathways.
In order to elucidate the molecular mechanisms leading to Verticilium wilt resistance, RNA-seq were used to analyze the differentially expressed genes of cotton in response to V. dahliae infection [14,15,16]. Studies have shown the involvement of some miRNAs and their respective target genes in the resistance to Verticillium wilt [17,18], while virus-induced gene silencing and proteomic studies have further characterized this response [19,20,21]. These studies indicate that genes specially involved in the metabolism of lignin, gossypol, phytohormones, and phenylalanine may play vital roles during cotton defense response to each different species of V. dahliae. However, the multiple molecular mechanisms are still poorly understood.
This study aimed to shed more light on the molecular mechanisms involved in the cotton defense response. We have primarily investigated the differentially expressed proteins involved in the molecular events of resistance to V. dahliae infection by two-dimensional electrophoresis (2-DE) and tandem time-of-flight mass spectrometry (MALDI-TOF-MS), which showed the upregulation of the proteins most likely involved in the response to biotic and abiotic stresses, signal transduction, protein processing and degradation, and other processes [8]. In this study, iTRAQ with a more sensitive and accurate protein quantification was applied to further identify differentially expressed proteins of G. thurberi after V. dahliae inoculation. Our objective was to enrich the knowledge of the molecular events involved in the cotton defense response.

2. Results and Discussion

2.1. Colonization Identification of V. dahliae in Seedling Roots after Inoculation

In order to identify the successful colonization of V. dahliae in inoculated seedlings, the pathogen- and mock-inoculated roots were sampled at 1.0 h after inoculation. The amplification of a V. dahliae house-keeping gene tubulin β chain using V. dahliae- specific primers showed a product band of 169 bp as expected (Figure 1, Table S1). The result confirmed the successful colonization of V. dahliae in G. thurberi seedlings.
Figure 1. PCR amplification of tubulin β chain gene from G. thurberi seedlings after inoculation. M: Marker 100, 1: V. dahliae; 2: Control seedling; 35 represent V. dahliae-inoculated seedlings.
Ijms 16 25121 g001

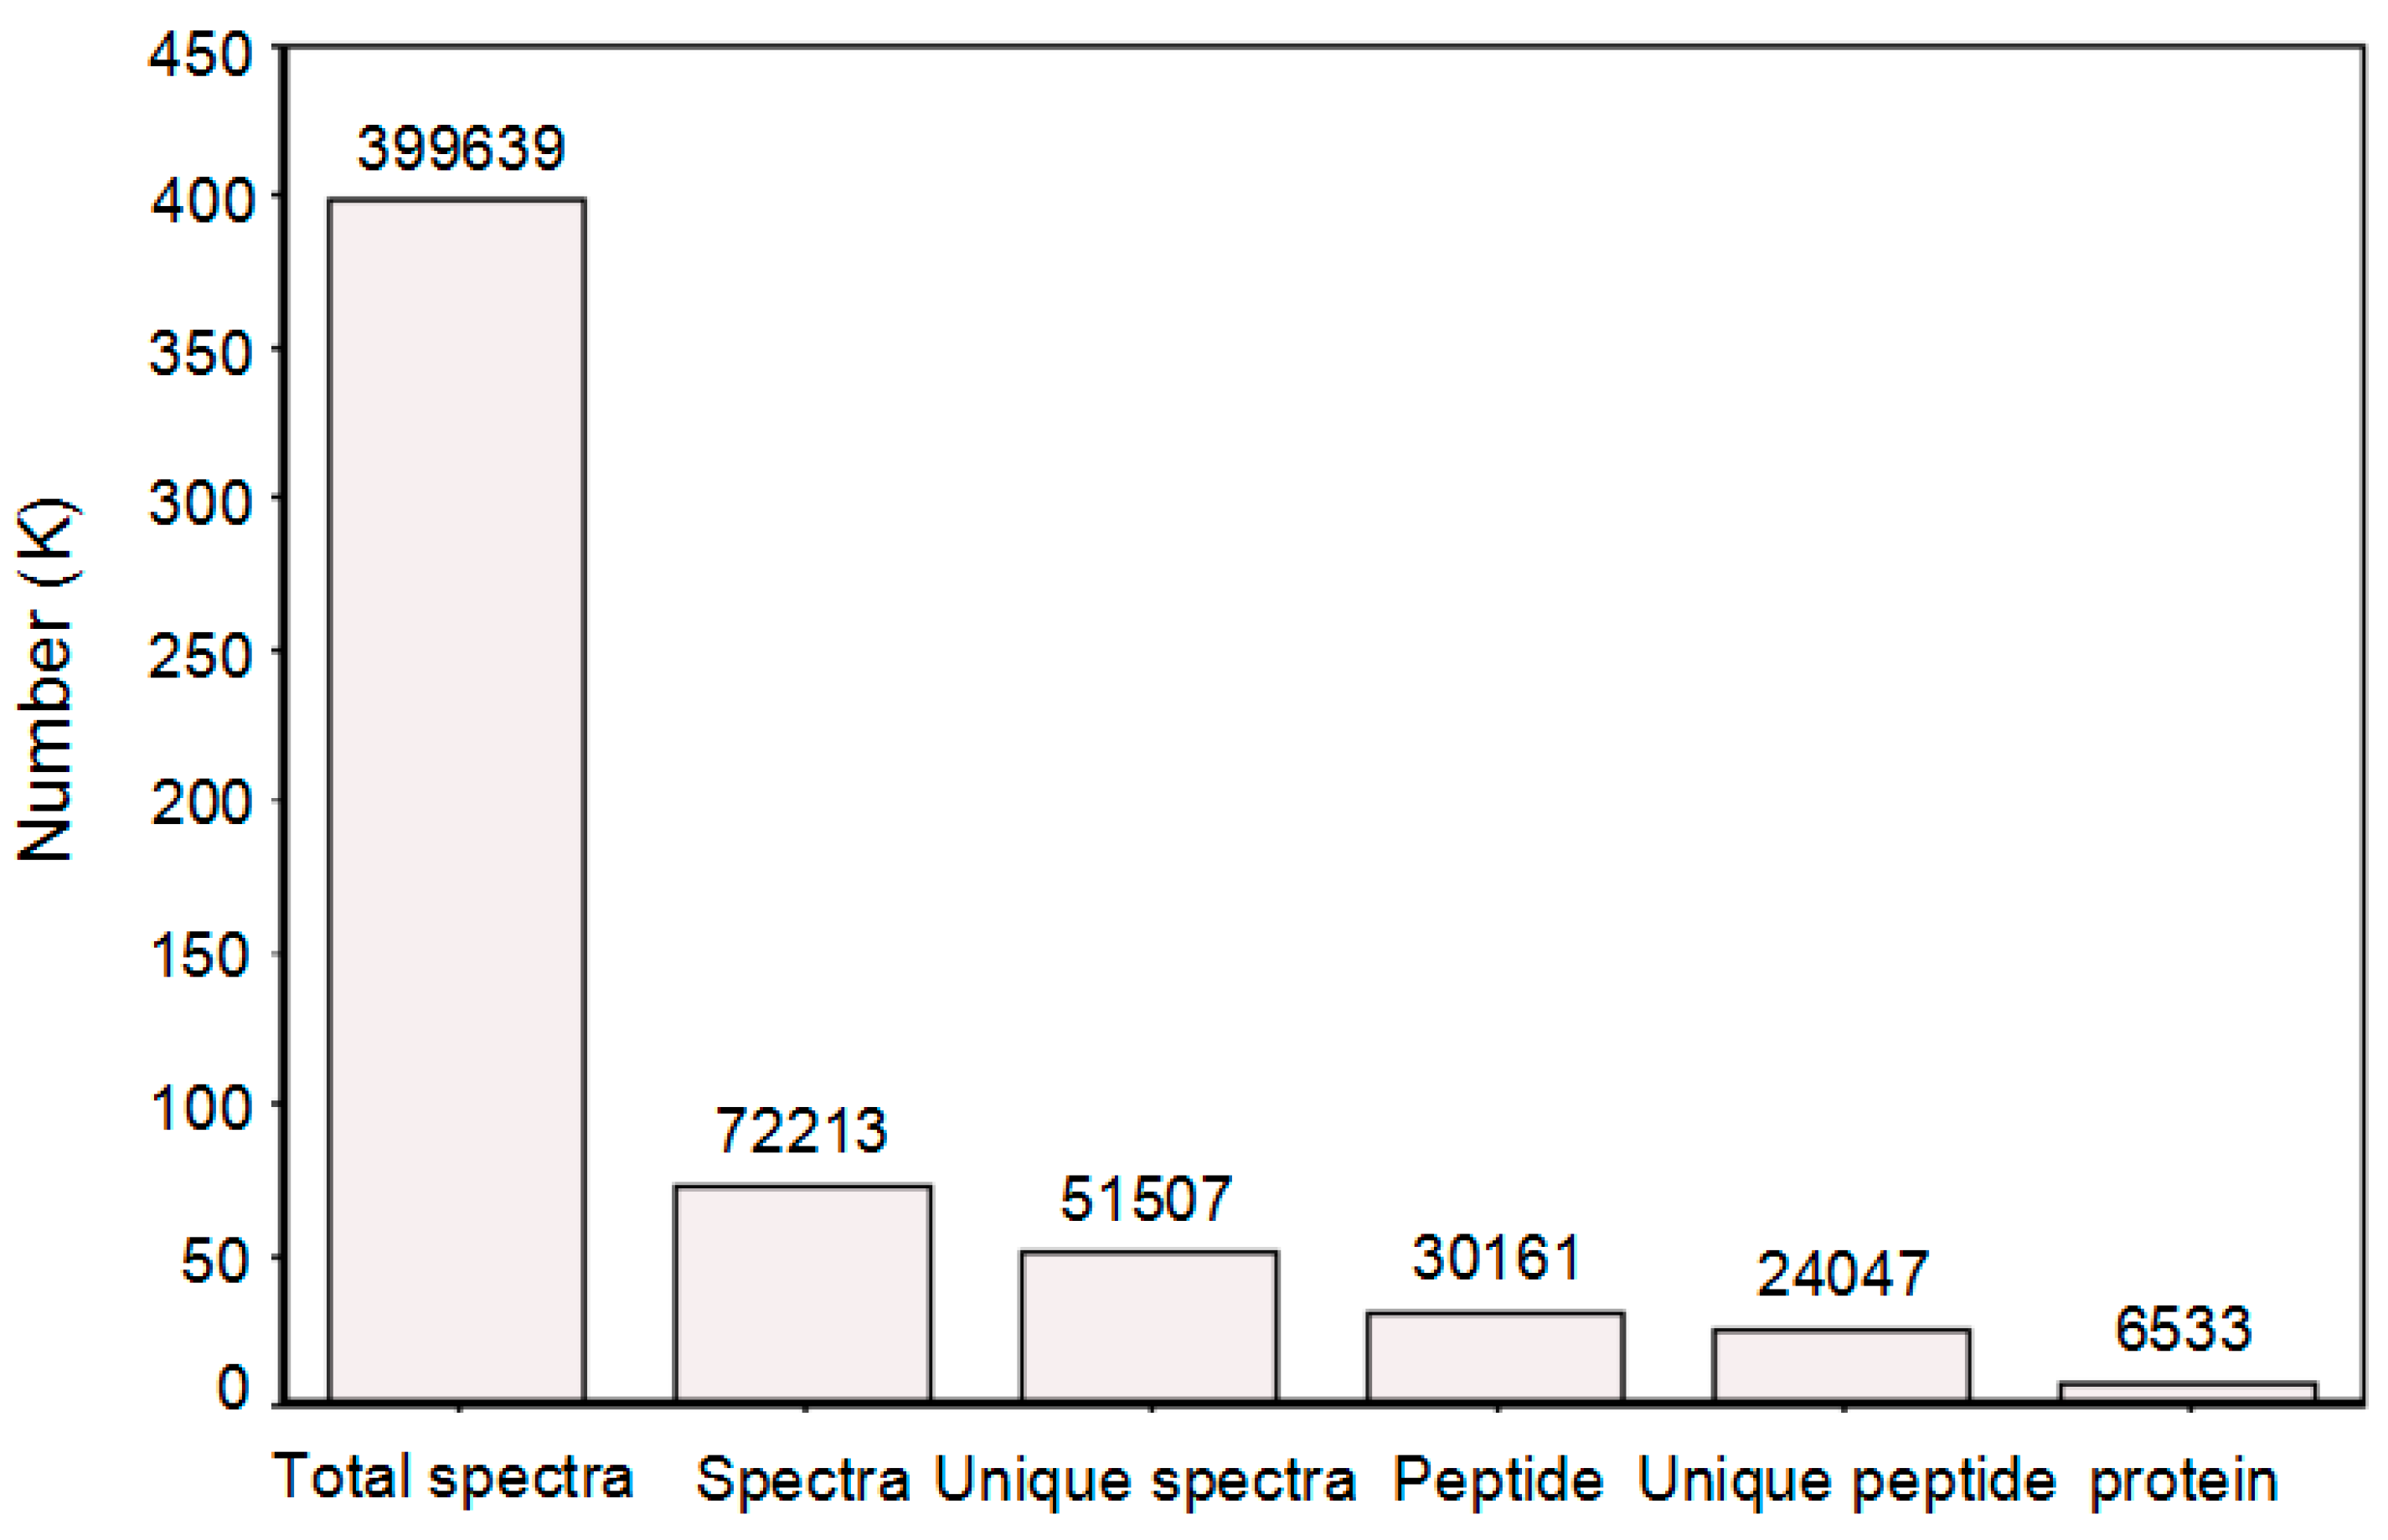
2.2. Proteins Identified by I-TRAQ and Their Functional Annotation

To obtain a relative overview of the molecular mechanism and metabolism pathways during the cotton response to V. dahliae inoculation, equal amounts of proteins extracted from the roots of both V. dahliae- and mock-inoculated seedlings at 0, 0.5, 1, 6, 12, and 24 h after inoculation were mixed thoroughly, respectively, and then used for proteomic analysis using the iTRAQ-based quantitative method and LC-ESI-MS/MS. As a result, a total of 6533 proteins were identified using the Mascot 2.3.02 search engine against a database [22] containing 40,523 protein sequences (Figure 2).
In order to investigate the functions and related biological processes of all the identified proteins, all of the total 6533 proteins were classified with Gene Ontology (GO) terms using GO::Term Finder [23]. In total, 6135 proteins were annotated, and 16 GO terms were enriched for molecular function and 22 terms for biological processing. For function classification, the 16 functional protein categories were mainly classified into catalytic activity (45.51%), followed by binding (39.42%), transporter activity (5.79%), structural molecule activity (3.04%), enzyme regulator activity (1.28%), antioxidant activity(1.23%), etc. (Figure 3a, Table S2). For biological processing classification, 22 categories were mainly involved in metabolic process (15.65%), followed by cellular process (15.63%), response to stimulus (8.91%), biological regulation (5.29%), etc. Expectedly, there were 308 proteins (1.16%) involved in the G. thurberi immune response to V. dahliae (Figure 3b, Table S2).
Figure 2. Basic statistics of identified proteins.
Ijms 16 25121 g002
Figure 3. Gene Ontology (GO) annotation of the whole identified proteins. (a,b) represented the classification of molecular function and biological process of the identified proteins, respectively.
Ijms 16 25121 g003
To further clarify the functions of the proteins in specific biological pathways, a KEGG enrichment analysis was performed. Among the total identified 6533 proteins, 4728 were assigned to 128 different specific pathways, and most of the proteins were mainly involved in metabolic pathways (1505), biosynthesis of secondary metabolites (968), ribosome (199), protein processing in the endoplasmic reticulum (172), RNA transport (152), phenylpropanoid biosynthesis (152), spliceosome (146), phytohormone signaling (132), glycolysis and gluconeogenesis (128), starch and sucrose metabolism (117). Similar to the GO analysis, 144 proteins were involved in plant-pathogen interactions (Table S3).

2.3. Identification and Enrichment Analysis of Differentially Expressed Proteins (DEPs)

In order to identify the protein expression changes in the roots between V. dahliae- and mock-inoculated seedlings, a 1.2-fold cut-off (p-value < 0.05) was designated as the significant change standard in abundance. As a result, a total of 675 non-redundant proteins were identified, and among them, 396 showed up- and 279 down-regulation in seedlings after inoculation with V. dahliae in comparison to the mock-inoculated (Figure 4a).
Figure 4. Statistics and COG (Clusters of Orthologous Groups) classification of differentially expressed proteins. (a,b) showed the statistics and the COG functional classification of differentially expressed proteins, respectively. A–V and Z represent RNA processing (A), chromatin structure and dynamics (B), energy production and conversion (C), cell cycle, cell division (D), amino acid metabolism and transport (E), nucleotide metabolism and transport (F), carbohydrate metabolism and transport (G), coenzyme metabolism and transport (H), lipid metabolism and transport (I), translation, ribosomal biogenesis and structure (J), transcription (K), DNA replication, recombination and repair (L), cell wall, membrane, and envelope biogenesis (M), cell motility (N), protein modification, turnover, and chaperones (O), inorganic metabolism and transport (P), biosynthesis, transport and catabolism of secondary metabolites (Q), general function prediction only (R), function unknown (S), signal transduction event (T), intracellular trafficking, secretion, and vesicular transport (U), defense responses (V), and cytoskeleton (Z).
Ijms 16 25121 g004
To further analyze the annotated DEPs related to the response of G. thurberi to V. dahliae inoculation, a COG (Clusters of Orthologous Groups) analysis of all the up- and down-regulated proteins was performed to phylogenetically analyze widespread domain families. Most of the up-regulated proteins (89.6%) proteins were grouped in 22 COG clusters. Among the COG clusters, the largest group was only general function prediction (15.2%, 54), followed by translation, ribosomal biogenesis and structure (12.7%, 45), carbohydrate metabolism and transport (10.7%, 38), protein modification, turnover, chaperones (9.9%, 35), energy production and conversion (8.5%, 30), cell wall, membrane, and envelope biogenesis (5.9%, 21), signal transduction mechanisms (4.8%, 17), etc. In addition, most of the proteins involved in cell wall, membrane, and envelope biogenesis, and cytoskeleton were up-regulated. Similarly, the down-regulated proteins had a similar distribution as that of up-regulated proteins except for RNA processing and modification (A), signal transduction (V), and cytoskeleton (Z) categories, which were nearly exclusively up-regulated proteins (Figure 4b, Table S4).
Furthermore, the Kyoto Encydopedia of Genes and Genomics (KEGG) enrichment analysis was conducted to filter the DEPs that corresponded to specific biological pathways. In total, 508 (75.3%) DEPs were assigned to 102 metabolic pathways. For the up-regulated proteins, 304 (75.3%) proteins were assigned to 90 pathways, which mainly included metabolic pathways (Ko01100), secondary metabolites biosynthesis (ko01110), ribosome (ko03010), the processing of protein in endoplasmic reticulum (ko04141), sucrose and starch metabolism (ko00500), etc. (Table 1).
Many of the up-regulated proteins were specially enriched in the pathways of pathogens response including flavonoid biosynthesis (ko00941), phenylpropanoid biosynthesis (ko00940), phenylalanine metabolism (ko00360), plant-pathogen interaction (ko04626), and phytohormone signal transduction (ko04075) (Table S2). In contrast, the down-regulated proteins associated with these aforementioned categories were much fewer, e.g., phenylpropanoid biosynthesis, plant-pathogen interaction, and phyto hormone signaling.
Table 1. Kyoto Encydopedia of Genes and Genomics (KEGG) pathways of Differentially Expressed Proteins (DEPs) during the response of G. thurbri to V. dahliae.
No.Enriched KEGG PathwaysDEPsp-Value
Up (304)Down (204)
1Metabolic pathways (ko01100)104 (34.21%)79 (38.73%)1
2Biosynthesis of secondary metabolites (ko01110)69 (22.7%)52 (25.49%)1
3Ribosome (ko03010)32 (10.53%)20 (9.8%)1
4Protein processing in endoplasmic reticulum (ko04141)24 (7.89%)2 (0.98%)1
5Starch and sucrose metabolism (ko00500)21 (6.91%)5 (2.45%)1
6Protein export (ko03060)1 (0.33%)3 (1.47%)1
7Phenylpropanoid biosynthesis (ko00940)16 (5.26%)01
8Spliceosome (ko03040)13 (4.28%)13 (6.37%)1
9Flavonoid biosynthesis (ko00941)12 (3.95%)9 (4.41%)1
10Phenylalanine metabolism (ko00360)11 (3.62%)10 (4.9%)1
11Plant-pathogen interaction (ko04626)10 (3.29%)2 (0.98%)1
12Glycolysis/Gluconeogenesis (ko00010)9 (2.96%)4 (1.96%)1
13Phagosome (ko04145)8 (2.63%)2 (0.98%)1
14Endocytosis (ko04144)7 (2.3%)2 (0.98%)1
15Amino sugar and nucleotide sugar metabolism (ko00520)7 (2.3%)7 (3.43%)1
16Oxidative phosphorylation (ko00190)7 (2.3%)14 (6.86%)1
17RNA transport (ko03013)7 (2.3%)5 (2.45%)1
18Fatty acid metabolism (ko00071)7 (2.3%)2 (0.98%)1
19Ascorbate and aldarate metabolism (ko00053)7 (2.3%)6 (2.94%)1
20Aminoacyl-tRNA biosynthesis (ko00970)7 (2.3%)17 (8.33%)1
21Carbon fixation in photosynthetic organisms (ko00710)7 (2.3%)01
22Glyoxylate and dicarboxylate metabolism (ko00630)6 (1.97%)01
23Nitrogen metabolism (ko00910)6 (1.97%)3 (1.47%)1
24Alanine, aspartate and glutamate metabolism (ko00250)6 (1.97%)1 (0.49%)1
25Galactose metabolism (ko00052)6 (1.97%)4 (1.96%)1
26Pyruvate metabolism (ko00620)6 (1.97%)4 (1.96%)1
27Plant hormone signal transduction (ko04075)5 (1.64%)1 (0.49%)1
28Propanoate metabolism (ko00640)5 (1.64%)4 (1.96%)1
29Stilbenoid, diarylheptanoid and gingerol biosynthesis (ko00945)5 (1.64%)7 (3.43%)1
30Pyrimidine metabolism (ko00240)5 (1.64%)6 (2.94%)1
31Glycerophospholipid metabolism (ko00564)5 (1.64%)1 (0.49%)1
32Pentose phosphate pathway (ko00030)4 (1.32%)1 (0.49%)1
33Peroxisome (ko04146)4 (1.32%)3 (1.47%)1
34Limonene and pinene degradation (ko00903)4 (1.32%)6 (2.94%)1
35Terpenoid backbone biosynthesis (ko00900)4 (1.32%)1 (0.49%)1
36Tryptophan metabolism (ko00380)4 (1.32%)1 (0.49%)1
37Cutin, suberine and wax biosynthesis (ko00073)4 (1.32%)1 (0.49%)1
38Proteasome (ko03050)4 (1.32%)3 (1.47%)1
39Pentose and glucuronate interconversions (ko00040)4 (1.32%)4 (1.96%)1
40Tyrosine metabolism (ko00350)4 (1.32%)01
41Purine metabolism (ko00230)3 (0.99%)8 (3.92%)1
42Porphyrin and chlorophyll metabolism (ko00860)3 (0.99%)1 (0.49%)1
43Glucosinolate biosynthesis (ko00966)3 (0.99%)01
44mRNA surveillance pathway (ko03015)3 (0.99%)4 (1.96%)1
45Flavone and flavonol biosynthesis (ko00944)3 (0.99%)8 (3.92%)1
46Citrate cycle (ko00020)3 (0.99%)1 (0.49%)1
47Glycerolipid metabolism (ko00561)3 (0.99%)2 (0.98%)1
48Phosphatidylinositol signaling system (ko04070)3 (0.99%)01
49Ubiquinone and other terpenoid-quinone biosynthesis (ko00130)3 (0.99%)01
50Diterpenoid biosynthesis (ko00904)3 (0.99%)7 (3.43%)1
51β-Alanine metabolism (ko00410)3 (0.99%)3 (1.47%)1
52Ubiquitin mediated proteolysis (ko04120)3 (0.99%)01
53Glycine, serine and threonine metabolism (ko00260)3 (0.99%)1 (0.49%)1
54Fatty acid biosynthesis (ko00061)2 (0.66%)1 (0.49%)1
55Lysine degradation (ko00310)2 (0.66%)1 (0.49%)1
56Cysteine and methionine metabolism (ko00270)2 (0.66%)2 (0.98%)1
57Other glycan degradation (ko00511)2 (0.66%)1 (0.49%)1
58Monoterpenoid biosynthesis (ko00902)2 (0.66%)01
59Phenylalanine, tyrosine and tryptophan biosynthesis (ko00400)2 (0.66%)01
60Sphingolipid metabolism (ko00600)2 (0.66%)2 (0.98%)1
61Arginine and proline metabolism (ko00330)2 (0.66%)1 (0.49%)1
62Nucleotide excision repair (ko03420)2 (0.66%)1 (0.49%)1
63Sulfur metabolism (ko00920)2 (0.66%)01
64Glycosphingolipid biosynthesis-ganglio series (ko00604)1 (0.33%)1 (0.49%)1
65ABC transporters (ko02010)1 (0.33%)1 (0.49%)1
66α-Linolenic acid metabolism (ko00592)1 (0.33%)3 (1.47%)1
67Photosynthesis (ko00195)1 (0.33%)01
68Tropane, piperidine and pyridine alkaloid biosynthesis (ko00960)1 (0.33%)2 (0.98%)1
69Inositol phosphate metabolism (ko00562)1 (0.33%)01
70Anthocyanin biosynthesis (ko00942)1 (0.33%)01
71Pantothenate and CoA biosynthesis (ko00770)1 (0.33%)01
72Glycosaminoglycan degradation (ko00531)1 (0.33%)1 (0.49%)1
73Taurine and hypotaurine metabolism (ko00430)1 (0.33%)01
74Histidine metabolism (ko00340)1 (0.33%)1 (0.49%)1
75Biosynthesis of unsaturated fatty acids (ko01040)1 (0.33%)01
76Butanoate metabolism (ko00650)1 (0.33%)1 (0.49%)1
77Benzoxazinoid biosynthesis (ko00402)1 (0.33%)1 (0.49%)1
78Fatty acid elongation (ko00062)1 (0.33%)01
79DNA replication (ko03030)1 (0.33%)1 (0.49%)1
80Isoquinoline alkaloid biosynthesis (ko00950)1 (0.33%)01
81Glutathione metabolism (ko00480)1 (0.33%)7 (3.43%)1
82Valine, leucine and isoleucine degradation (ko00280)1 (0.33%)3 (1.47%)1
83RNA polymerase (ko03020)1 (0.33%)4 (1.96%)1
84Fructose and mannose metabolism (ko00051)1 (0.33%)2 (0.98%)1
85Cyanoamino acid metabolism (ko00460)1 (0.33%)01
86One carbon pool by folate (ko00670)1 (0.33%)01
87SNARE interactions in vesicular transport (ko04130)1 (0.33%)1 (0.49%)1
88Regulation of autophagy (ko04140)1 (0.33%)01
89RNA degradation (ko03018)1 (0.33%)2 (0.98%)1
90Circadian rhythm-plant (ko04712)1 (0.33%)01
91Zeatin biosynthesis (ko00908)03 (1.47%)1
92Isoflavonoid biosynthesis (ko00943)03 (1.47%)1
93Selenocompound metabolism (ko00450)02 (0.98%)1
94Sesquiterpenoid and triterpenoid biosynthesis (ko00909)01 (0.49%)1
95Ribosome biogenesis in eukaryotes (ko03008)04 (1.96%)1
96Indole alkaloid biosynthesis (ko00901)01 (0.49%)1
97Brassinosteroid biosynthesis (ko00905)02 (0.98%)1
98Steroid biosynthesis (ko00100)01 (0.49%)1
99Riboflavin metabolism (ko00740)01 (0.49%)1
100Valine, leucine and isoleucine biosynthesis (ko00290)01 (0.49%)1
101Vitamin B6 metabolism (ko00750)02 (0.98%)1
102Base excision repair (ko03410)01 (0.49%)1

2.4. Proteins Related to Cell Wall Organization and Reinforcement

In plants, the cell wall is one of the first defense barriers protecting plants from invasion by fungal pathogens, and is also a major factor in the basal resistance of the host plant. During pathogen attacks, the structure and composition of cell walls are modified to withstand the physical and chemical forces of fungus [24,25]. For example, some cell wall components like lignin are accumulated in the stem or roots to reinforce the cell wall against pathogen invasion [16,26,27]. In Arabidopsis inoculated with Pseudomonas syringae pv. tomato DC3000, the resistant mutants showed more callose deposition than wild type plants, and a susceptible mutant had reduced callose deposition [28]. Similarly, tobacoo plants also showed an increased callose deposition in leaves when attacked by Pseudomonas syringae [29]. In addition, significant more papillae which are effective in preventing penetration by pathogens, were found on leaves of barley during infection with Blumeria graminis f. sp. Hordei [30]. In this study, some proteins involved in lignin biosynthesis and/or metabolic processes (Cotton_D_gene_10018639; Cotton_D_gene_10007128), callose synthesis (Cotton_D_gene_10027166, Cotton_D_gene_10014770) and deposition (Cotton_D_gene_10033043, Cotton_D_gene_10014769, Cotton_D_gene_10016775) were also induced after inoculating G. thurberi with V. dahliae (Table S4). A total of 21 proteins, involved in cell wall, membrane, envelope biogenesis, and cytoskeleton, were induced in roots of G. thurberi after infection of V. dahliae in this experiment (Table S4). Previous reports have shown that, after infection of pathogens, the peroxidase (POD) activity of plants promoted the biosynthesis and accumulation of lignin, and the lignification of infected tissues [31,32]. In the present study, the measurement of POD activity also showed that the activation of POD in hypocotyl increased significantly after inoculation with V. dahliae compared to that of mock-inoculated control during the 24 h after treatment (Figure 5).
Figure 5. Induction of peroxidase (POD) activity in hypocotyls after inoculation. Data represented the induction of POD activity in the hypocotyls of G. thurberi seedlings in response to V. dahliae infection at 0, 0.5, 1, 6, 24 h after mock- and fungal- inoculation. Means significantly different from one another (at 0.5, 6, 24 h after inoculation) by Tukey (α = 0.05) were shown as different letters on each column.
Ijms 16 25121 g005

2.5. Products of Metabolism Involved in Response of G. thurberi to V. dahliae

Products of plant secondary metabolism play very important roles in plant-pathogen interaction and plant defense. In this study, proteins involved in synthesis of secondary metabolites such as phytoalexin, chorismate, and phenolics precursor flavonoids, were significantly increased in response to V. dahliae inoculation than that of control, which contributed to plant response to biotic stress [33]. For example, one chorismate binding protein (Cotton_D_gene_10006706), which is an important component of plant defense against pathogen attempt, was up-regulated (Table S4) [34,35]. In addition, another DEP (Cotton_D_gene_10006256) involved in phytoalexin metabolism pathway, which plays an important role during response to pathogens attack, was also significantly accumulated (Table S4) [36]. Moreover, several proteins (Cotton_D_gene_10031714, involved in phenylpropanoid biosynthetic process; Cotton_D_gene_10030618, involved in phenylpropanoid metabolic process; Cotton_D_gene_10008985, involved in phenylpropanoid metabolic process), which are the common targets of different plant pathogens, were also up-regulated (Table S4) [37,38,39,40].

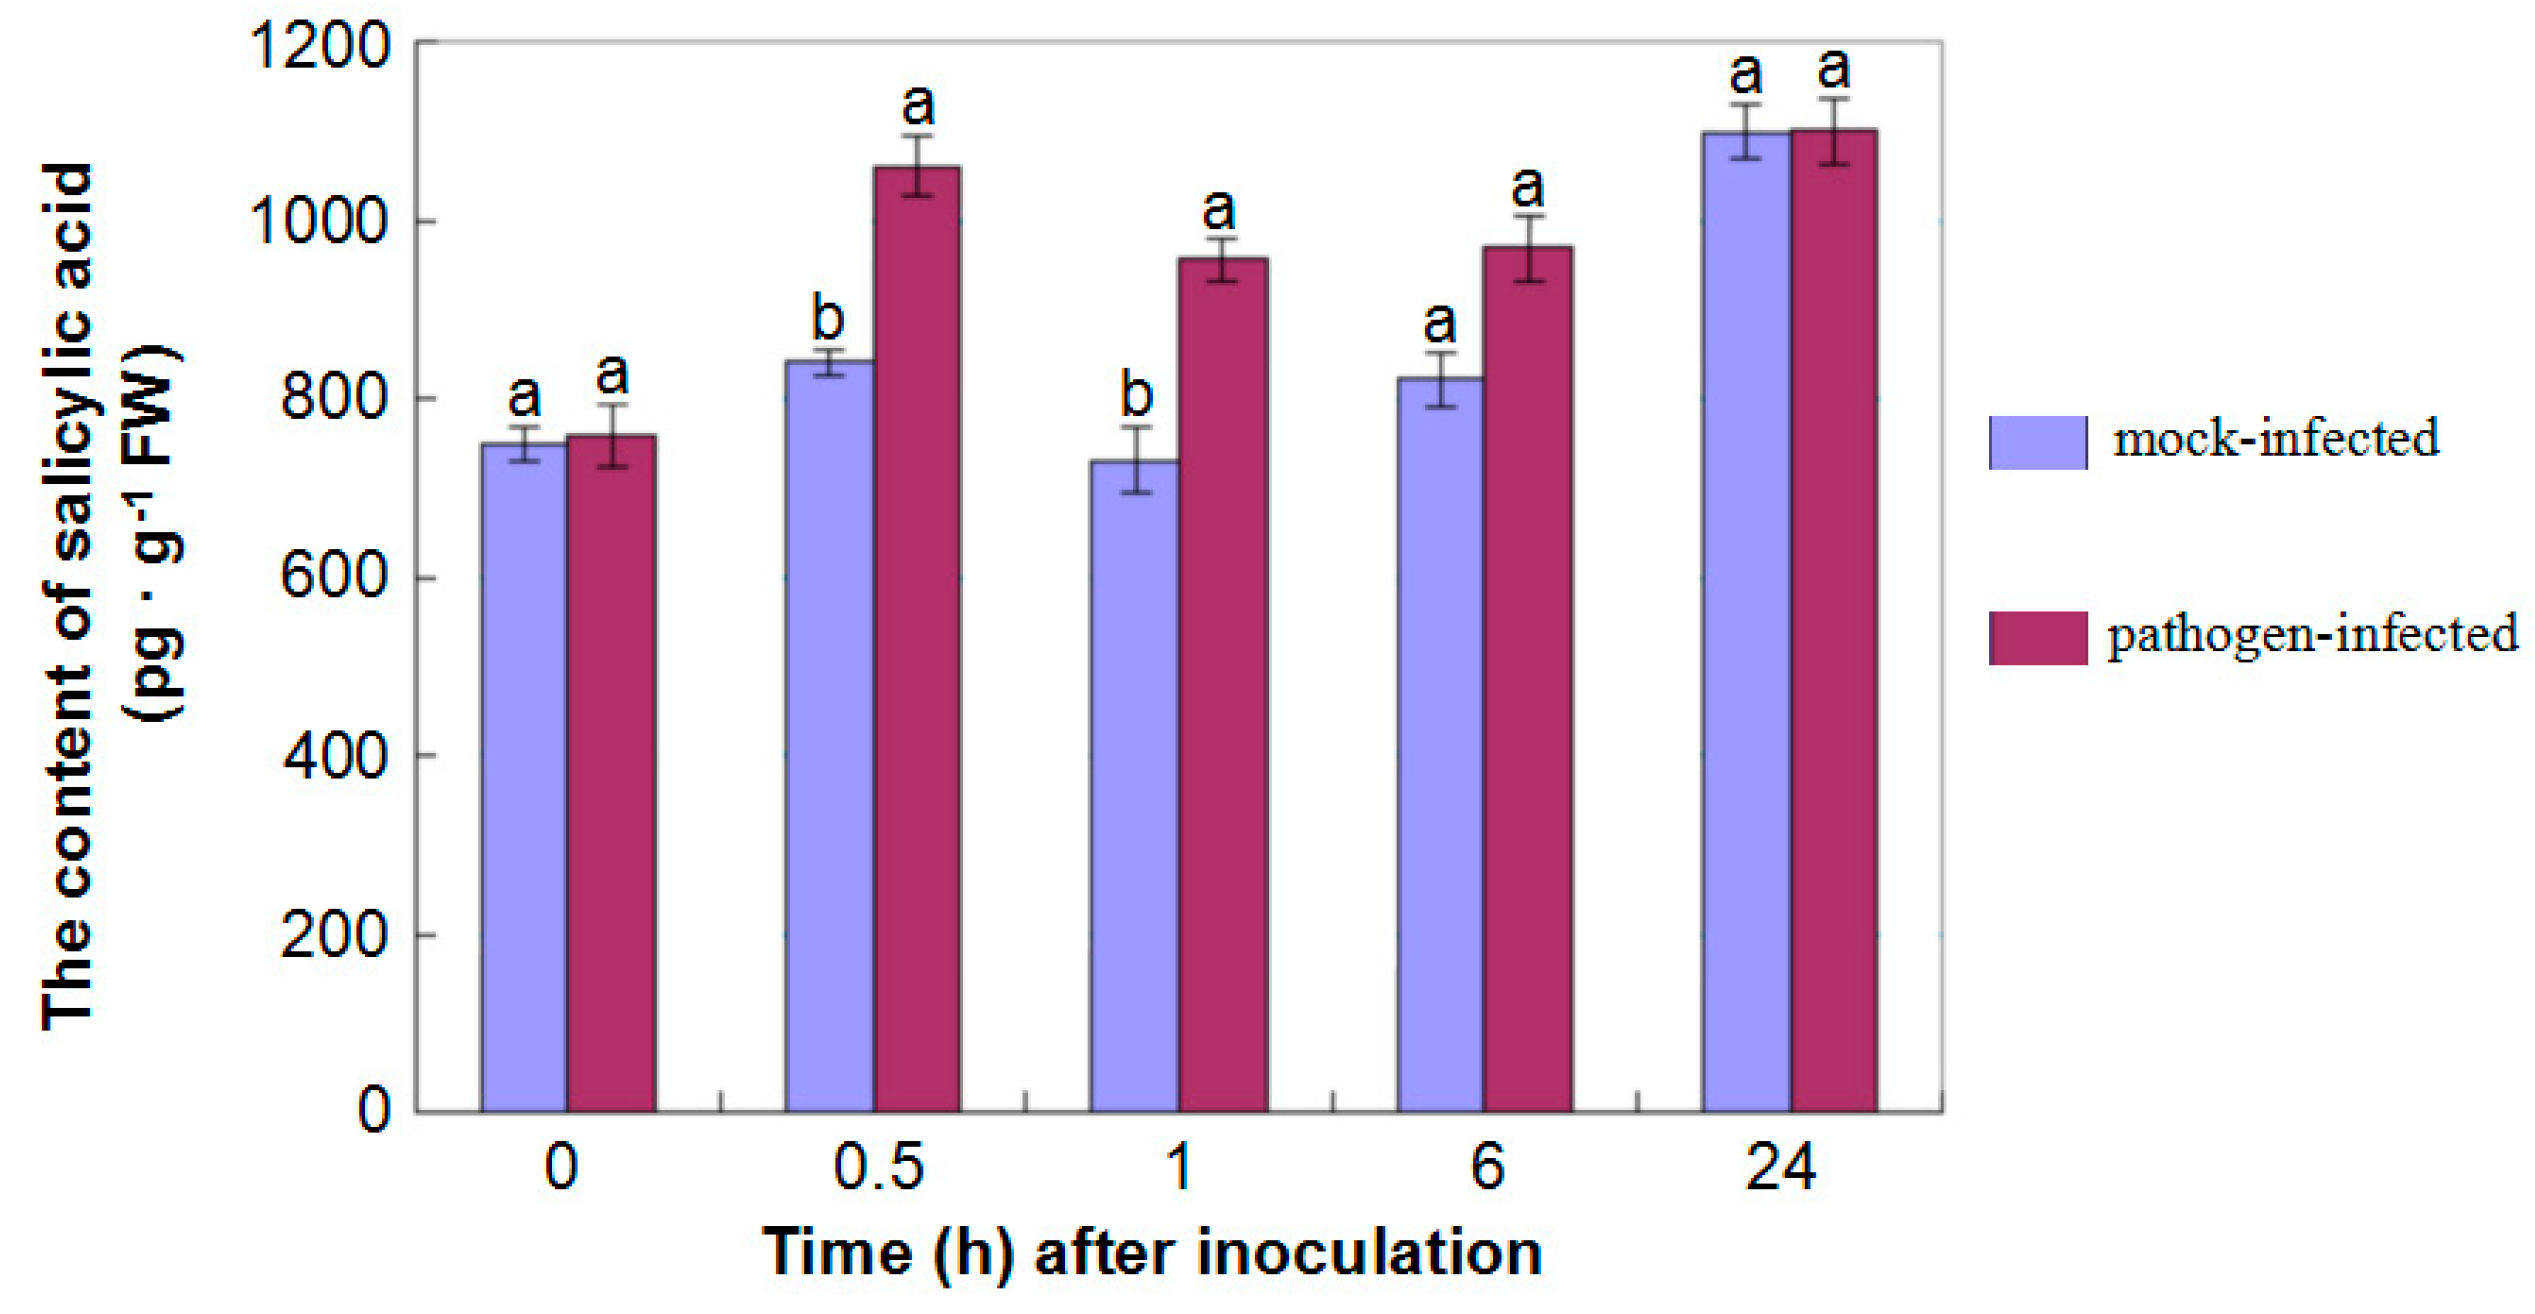
2.6. The Differential Expression of Proteins in Signal Pathways of Phytohormones

Plant hormones play central roles in plant responses to almost all of biotic stresses, during which the plant’s own defense systems convert pathogen-induced signalling into the activation of defense responses, and most of which depend on the action of plant hormones such as salicylic acid (SA) and jasmonates (JAs), etc., [41,42]. In this study, 132 proteins involved in the synthesis and signaling of phytohormones were identified, six of which were significantly differentially accumulated (Table S3 and Table 1). Studies on the biosynthesis, perception, and signaling of specific phytohormones in tobacco and Arabidopsis, proved the essential importance of phytohormones on the regulation of down-stream immune signal events. Indeed, upon pathogen attack, plants synthesize many different hormones, which lead to the activation of specific sets of defense-associated genes [42,43].
Similar results were also obtained in this study. For example, some enzymes such as isochorismate synthase (Cotton_D_gene_10000849) involved in JA biosynthesis, were up-regulated. Additionally, KEGG analysis also showed that proteins associated with several pathways involved in JA biosythesis including phenylpropanoid biosynthesis (ko00940) and phenylalanine metabolism (ko00360), displayed a significantly differential accumulation in roots after inoculation with V. dahliae compared to control (Table 1 and Table S4) [44]. What is more, the content quantification of SA also showed a higher abundance in hypocotyls after inoculated with V. dahliae compared to that of control (Figure 6).
Regulatory crosstalk is abundant in the huge, complex and still obscure network of plant hormone signaling [41,45]. Our research shows that proteins simultaneously involved in jasmonic acid, salicylic acid, abscisic acid, and ethylene signal pathways (Cotton_D_gene_10024874, Cotton_D_gene_10036611, Cotton_D_gene_10008648, Cotton_D_gene_10016775, Cotton_D_gene_10021424, Cotton_D_gene_10033223, and Cotton_D_gene_10009632) were differentially expressed, which indicates that an intricate regulatory network exists in the response of G. thurberi to V. dahliae infection (Table S4). In fact, bioinformatics analysis also showed that all of the abovementioned proteins were also involved in many other bio-processes such as regulation of protein dephosphorylation, programmed cell death, defense response through the callose deposition in cell wall, lignin biosynthetic process, oxidation-reduction process, etc.
Figure 6. Content of salicylic acid in hypocotyls after inoculation. Data represented the content of salicylic acid in the hypocotyls of G. thurberi seedlings in response to V. dahliae infection at 0, 0.5, 1, 6, 24 h after mock- and fungal-inoculation. Means significantly different from one another (at 0.5, 1, 6 h after inoculation) by Tukey (α = 0.05) were shown as different letters on each column.
Ijms 16 25121 g006

2.7. Disease Resistance Response Proteins

Apart from some disease resistant proteins involved in degrading the cell wall components of pathogenic fungi such as chitinases (paralogs of Cotton_D_gene_10005890, Cotton_D_gene_10018458, Cotton_D_gene_10005890), and β-1,3-glucanase (the paralog of Cotton_D_gene_10017109), which were accumulated (Table S4) [46,47], many NBS-LRR domain containing proteins, which can recognize the effectors of pathogens through LRR domains directly or indirectly, were identified [48,49,50]. Although most of these NBS-LRR domain containing proteins showed no significant difference in cotton roots, there were two (paralogs of Cotton_D_gene_10024930 and Cotton_D_gene_10027338) which were up-regulated (Table S4). Similarly, real-time RT-PCR analysis also demonstrated that both of the two protein-encoding genes were induced at 24 h at the transcriptional level after inoculation compared to that of control (Figure 7).
Figure 7. Expression pattern of 2 NBS-LRR-like protein encoding genes. Data showed the real-time RT-PCR analysis of two up-regulated protein encoding genes in response to infection at 0, 0.5, 1, 6, 24 h after mock- and fungal-inoculation.
Ijms 16 25121 g007

3. Experimental Section

3.1. Plant Cultivation and Inoculation

A moderately aggressive defoliating fungus, V. dahliae D07038, from the Cotton Institute of the Chinese Academy of Agriculture Sciences (CICAAS), was incubated on a potato-dextrose agar plate for 1 week, and then inoculated for 3–4 days in Czapek broth on a shaker at 120 rpm at 25 °C until spores concentration reached 108–109 spores/mL. The suspension was adjusted to 107 spores/mL with sterilized distilled water for inoculation [2].
Seeds of cotton (G. thurberi) were surface-sterilized with ddH2O, and planted in sterilized soil (a mix of vermiculite and nutrient) at 25 °C in a greenhouse. Every seedling was inoculated with 15 mL of a V. dahliae spore suspension of 107 spores/mL by watering roots at the two-true-leaf developmental stage of seedlings [51]. Control seedlings were inoculated with equal volume of ddH2O in the same way. The roots, hypocotyls, and leaves of four individual seedlings of triple biological repeats for each treatment were harvested at 0, 0.5 1, 6, 12, and 24 h post-inoculation after washing by 75% ethanol and sterilized water [5]. They were frozen immediately in liquid nitrogen and stored at −80 °C for future use.

3.2. Protein Extraction and Quantification

Roots were ground into fine powder in liquid nitrogen, and then total proteins were extracted with lysis buffer (7 M Urea, 2 M Thiourea, 4% CHAPS, 40 mM Tris-HCl, pH 8.5) containing 1 mM PMSF and 2 mM EDTA (final concentration). 5 min later, 10 mM DTT (dl-Dithiothreitol) was added to each sample. The suspension was sonicated for 15 min at 200 W, and then centrifuged for 15 min at 4 °C, 30,000× g. The supernatant was mixed well with 5× volume of chilled acetone containing 10% (v/v) TCA (trichloroacetic acid), and then incubated overnight at −20 °C. After centrifugation of 15 min at 4 °C, 30,000× g, the precipitate was thoroughly washed three times with chilled acetone and air-dried, and then dissolved in lysis buffer (7 M urea, 2 M thiourea, 4% NP40, 20 mM Tris-HCl, pH 8.0–8.5). The suspension was sonicated for 15 min at 200 W and centrifuged for 15 min at 4 °C, 30,000× g, and the supernatant was then transferred to another new tube. In order to reduce disulfide bonds of supernatant proteins, 10 mM DTT was added and samples were incubated for 1 h at 56 °C. Subsequently, 55 mM IAM (2-iodoacetamide) was added to block the cysteines, and then incubated for 1 h in dark condition. The supernatant was mixed thoroughly with 55-fold volume of chilled acetone for 2 h at −20 °C to precipitate proteins. After centrifugation of 15 min at 4 °C, 30,000× g, the supernatant was discarded, the precipitate was air-dried for 5 min and dissolved in 500 µL 0.5 M TEAB (triethylammonium bicarbonate), then sonicated for 15 min at 200 W. Finally, samples were centrifuged for 15 min at 4 °C, 30,000× g. The supernatant was transferred to a new tube and quantified using the Bradford method using bovine serum albumin as a standard [52]. The protein solutions were kept for further analysis at −80 °C.

3.3. I-TRAQ Labeling and SCX Fractionation

Total proteins (100 µg) were taken out of each sample solution and digested with Trypsin Gold (Promega, Madison, WI, USA) with the ratio of protein:trypsin = 30:1 for 16 h at 37 °C. After being dried by vacuum centrifugation, the peptides were reconstituted in 0.5 M TEAB and processed according to the protocol for 8-plex iTRAQ reagent (Applied Biosystems, Waltham, MA, USA). Briefly, after one unit of iTRAQ reagent was thawed and reconstituted in 24 µL isopropanol, the peptide samples were labelled with iTRAQ tags as follow: mock-inoculated seedlings (114 tag), pathogen inoculated seedlings (118 tag). After the labelled peptides were incubated for 2 h at room temperature, the labelled peptide mixtures were then pooled and dried by vacuum centrifugation.
SCX chromatography was performed using a LC-20AB HPLC Pump system (Shimadzu, Kyoto, Japan). After reconstituted in 4 mL buffer A (25 mM NaH2PO4 in 25% ACN, pH 2.7), the labeled peptide mixtures were loaded onto a 4.6 × 250 mm Ultremex SCX column containing 5-µm particles (Phenomenex, Torrance, CA, USA). The peptides were eluted for 10 min at the flow rate of 1 mL/min with a gradient of buffer A, 5%–60% buffer B (25 mM NaH2PO4, 1 M KCl in 25% ACN, pH 2.7) for 27 min, and 60%–100% buffer B for 1 min. The system was then maintained for 1 min at 100% buffer B before equilibrating with buffer A for 10 min prior to the next injection. In order to reduce the complexity and improve the accuracy of the total labelled peptides for the following mass spectrometry analysis, the eluted peptides were collected and pooled into 20 fractions every minute by monitoring the absorbance at 214 nm, and each fractions were desalted with a Strata XC18 column (Phenomenex), and dried by vacuum centrifugation.

3.4. LC-ESI-MS/MS and Data Analysis

Each fraction was resuspended in buffer A (5% ACN, 0.1% FA) and centrifuged for 10 min at 20,000× g, the final concentration of peptide was about 0.5 μg/μL. 10 μL supernatant was loaded on a LC-20AD nanoHPLC (Shimadzu, Kyoto, Japan) by the autosampler onto the 2 cm C18 trap column. Then, the peptides were eluted onto the 10 cm analytical C18 column (inner diameter 75 μm) packed in-house. After samples were loaded for 4 min at 8 μL/min, the 35 min gradient was run at 300 nL/min starting from 2% to 35% B (95% ACN, 0.1% FA), followed by 5 min linear gradient to 60% and by 2 min linear gradient to 80%, and after maintenance for 4 min at 80% B, return to 5% within 1 min.
Data collection was performed using the TripleTOF 5600 System (AB SCIEX, Concord, ON, Canada) fitted with a Nanospray III source (AB SCIEX), and using a pulled quartz tip as the emitter (New Objectives, Woburn, MA, USA). Data was collected using an ion spray voltage at 2.5 kV, curtain gas of 30 psi, nebulizer gas of 15 psi, and an interface heater temperature at 150 °C. The MS was operated for Time of Flight Mass Spectrometry (TOF MS) scans with a reversed phase (RP) of equal to or greater than 30,000 Full Width Half Maximum (FWHM). For Information Dependent Acquisition (IDA), survey scans were acquired in 250 ms, and if exceeding a threshold of 120 counts per second (counts/s) and with a +2 to +5 charge-state, 30 product ion scans were collected. The total cycle time was set to 3.3 s, and Q2 transmission window was 100 Da for 100%. For each scan, four time bins were summed at a pulser frequency value of 11 kHz by monitoring the 40 GHz multichannel Time to Digital Convert (TDC) detector with four-anode channel detect ion. For collision-induced dissociation, the sweeping collision energy setting of 35 ± 5 eV, coupled with iTRAQ adjust rolling collision energy, was applied to all precursor ions. Dynamic exclusion was set for 1/2 of peak width (15 s), and each time, the exclusion list was refreshed off the precursor.
After collected from the Orbitrap, the raw data files were converted into Mascot generic format (MGF) files by Proteome Discoverer 1.2 (PD 1.2, Thermo), (5600 msconverter). Protein identification was performed through Mascot search engine (Matrix Science, London, UK; version 2.3.02) against a database containing 40,523 sequences [22].
For protein identification, the mass tolerance of 0.1 Da (ppm) and 0.05 Da for fragmented ions were permitted for intact peptide masses with the allowance for one missed cleavage in trypsin digests, and using Carbamidomethyl (C), iTRAQ8plex (N-term), and iTRAQ8plex (K) as fixed modifications, and Gln- > pyro-Glu (N-term Q), Oxidation (M), and Deamidated (NQ) as the potential variable modifications. At the same time, the charge states of peptides were set to + 2 and + 3. Specifically, an automatic decoy database search was performed in Mascot through choosing the decoy checkbox in which a random sequence of database is generated and tested for raw spectra and the real database. In addition, in order to further reduce the false probability in peptide identification, peptides only with the significance scores (≥20) at the 99% confidence interval by a Mascot probability analysis greater than “identity” were utilized in this study, and each confident protein identification should involve at least one unique peptide.
For protein quantitation, that a protein should contain at least two unique peptides was required. Mascot 2.3.02 was applied to weight and normalize the quantitative protein ratios with the median ratio, and the ratios only with p-values <0.05 and the fold changes only of >1.2 were considered as significant.

3.5. Bioinformatics Analysis

Cluster of Orthologous Groups of proteins (COG), a database for protein ortholog classification, was used to classify and group all the identified proteins [23].
GO enrichment analysis was applied to map all DEPs to GO terms in the database (http://www.geneontology.org/), calculating protein encoding gene numbers for every term, then using a hypergeometric test to determine significantly enriched GO terms of DEPs based on “GO::Term Finder” [53], and the algorithm method used is described as follows
P = i = 0 M 1 { ( i M ) ( n i N M ) } / ( n N )
where, N represents the number of all genes with GO annotations, n represents the number of DEPs in N, M represents the number of all genes that are annotated to certain GO terms, and m represents the number of DEPs in M.
KEGG, a major pathway-related database [54], was applied to perform metabolic pathway enrichment analysis of DEPs [55]. This analysis identifies significantly enriched metabolic pathways of DEPs. The calculating formula is the same as that in GO enrichment analysis, but here, N is the number of all proteins with known KEGG annotation, n is the number of DEPs in N, M is the number of all proteins annotated to specific pathways, and m is the number of DEPs in M.

3.6. Measurement of Enzyme Activity

The hypocotyl samples were collected at 0, 0.5, 1, 6, 12, and 24 h from both V. dahliae- and mock-inoculated cotton plants. Five seedlings were collected for each treatment at each time point. Samples of 100 mg were homogenized thoroughly in extraction buffer (sodium acetate 50 mM, pH 5.0). After the lysate was centrifuged for 15 min at 14,000× g, 4 °C, the supernatant was collected as the crude enzyme for the estimation of enzyme activities. POD activity was assayed at 470 nm by using guaiacol as the hydrogen donor [25]. The reaction mixture contained 0.1 M NaPi, 50 mM guaiacol, 10 mM H2O2, and the crude extracts. The assay was performed for 5 min at 25 °C, and enzyme activity was determined over the linear part of the reaction spectrophotometrically at 470 nm; POD activity was expressed as mU per gram fresh weight of sample.

3.7. Content Quantification of Hormones

The extraction, purification, and quantification of endogenous phytohormones were performed by enzyme-linked immunosorbent assay (ELISA) according to the methods with minor modification [56]. In total, 0.5 g of hypocotyl powder was homogenized by inversing in pre-chilled 80% aqueous methanol containing butoylated hydroxytoluene (1 mmol/L). The supernatant was centrifuged for 20 min at 5000× g at 4 °C, and the precipitate was re-extracted again. The crude extract was passed through a Sep-Pak C18 cartridge (Waters, Milford, MA, USA). Then, after the filtrate was dried in N2 gas, the resultant residue was dissolved in phosphate buffered saline (PBS, 0.01 mol/L, pH 7.4). The level of salicylic acid was then determined and expressed as pg per gram fresh weight of sample based on monoclonal antibodies (Affandi, Shanghai, China). Absorbance of the developed color at 490 nm was measured by a microplate reader (M-SPmax250, Wako Pure Chem, Tokyo, Japan).

3.8. qRT-PCR Analysis

Two induced NBS-LRR domain containing protein paralogs coding genes (Cotton_D_gene_10024930 and Cotton_D_gene_10027338) were selected for expression pattern analysis. qRT-PCR was performed to estimate the expression profile at the transcriptional level. Specific primers with 95%–103% amplification efficiency of cotton and endogenous genes were designed with Primer Premire 5.0 (Premier, Toronto, ON, Canada) (Table S1). The qRT-PCR assay using 2 μL (5 ng/μL) cDNA and SYBR Green PCR Master Mix (Takara, Dalian, China) was carried out in three technical triplicates on an ABI Prism 7000 Real-time PCR system (Foster City, CA, USA). 20 μL qRT-PCR reactions were incubated in a 96-well plate at 95 °C for 10 min, followed by 40 cycles of 95 °C for 15 s and 60 °C for 60 s with the default PCR baseline subtracted RFU of 100. The cotton endogenous cotton endogenous actin gene was used as the internal reference gene to normalize the amount of cDNA in each reaction (Table S1), and the relative expression levels of selected genes were calculated with the 2−ΔΔCt method using the SDS software (Applied Biosystems) [57].

3.9. Statistical Analysis

The data of phytohormone content and enzyme activity obtained in this study were subjected to analysis of variance (ANOVA), and all significant differences were examined according to Tukey test by DPS 6.05 software at p < 0.05 (Zhejiang University, Hangzhou, China) [58].

4. Conclusions

In this study, iTRAQ was applied for the first attempt to identify the differentially expressed proteins in G. thurberi inoculated with V. dahliae. As a result, 6533 proteins were identified from the roots, and among these identified proteins, 396 showed up- and 279 down-regulation after inoculation when compared to control. COG annotation showed that, 355/396 (89.6%) proteins fell into 22 COG clusters. Among these COG clusters, except for some basal metabolic groups, most of the rest, involved in cell wall, membrane, envelope biogenesis, and cytoskeleton, were up-regulated. Further KEGG analysis showed that the up-regulated proteins involved in the pathogen resistance pathway such as phenylalanine metabolism (ko00360), phenylpropanoid biosynthesis (ko00940), flavonoid biosynthesis (ko00941), plant-pathogen interaction (ko04626), and phytohormone signaling (ko04075), were enriched. Moreover, peroxidase (POD) activity, which promotes the biosynthesis and accumulation of lignin, and salicylic acid, which plays a central role in plant responses to almost all of biotic stresses, were both steadily induced in the hypocotyl of pathogen inoculated seedlings during the first 24 h after inoculation in comparison to control.
These findings provide a more comprehensive picture of the molecular events involved in regulatory networks during the response of G. thurberi to V. dahliae infection, which may support further research to breed disease-resistant cotton.

Supplementary Materials

Supplementary materials can be found at https://www.mdpi.com/1422-0067/16/10/25121/s1.

Acknowledgments

We acknowledge Fang Liu in Institute of Cotton Research, Chinese Academy of Agriculture Sciences (CICAAS) for the seeds of G. thurberi supply. This work was supported by the Natural Science Foundation of China (NSFC grant No. U1304319), the Open Topic of National Key Laboratory of Cotton Biology, CICAAS (Grant No. CB2013A03), the National Transgenic Major Projects (Grant No. 2014ZX08005005-006), the Henan Provincial Budget Project: Cloning and Functional Analysis of Genes Resistant to Verticillium wilt in Cotton. This study was supported also by Innovative Talents of Science and Technology Plan of Henan Province (2015), and Funds for International Training of Henan Provincial High-level Talents Training (YWZ[2014]2).

Author Contributions

Weiping Fang, Xiaojie Yang, and Deyi Xie designed the experiment and carried out the experiment. Heqin Zhu, Wu Li, Zhifang Li, Fu’an Zhao, Shuping Lv, Zhongjie Tang, Lihong Nie, Yuanming Zhao, Jianan Hou, and Jinxia Wang performed the plant inoculation, cultivation, and sample collection. Xiaojie Yang and Lirong Yang wrote the manuscript draft, Zhenzhen Xu and Li Sun revised the manuscript. Xiaojie Yang, Jinxia Wang, and Yao Sun performed the statistical analysis of all data. All authors read and approved the final manuscript.

Conflicts of Interest

The authors declare no conflict of interest.

References

  1. Song, X.L.; Zhang, T.Z. Identification of quantitative trait loci controlling seed physical and nutrient traits in cotton. Seed Sci. Res. 2007, 17, 243–251. [Google Scholar] [CrossRef]
  2. Sink, K.; Grey, W.E. A root-injection method to assess Verticillium wilt resistance of peppermint (Mentha × piperita L) and its use in identifying resistant somaclones of cv. Black Mitcham. Euphytica 1999, 106, 223–230. [Google Scholar] [CrossRef]
  3. Klosterman, S.J.; Atallah, Z.K.; Vallad, G.E.; Subbarao, K.V. Diversity, pathogenicity, and management of Verticillium species. Annu. Rev. Phytopathol. 2009, 47, 39–62. [Google Scholar] [CrossRef] [PubMed]
  4. Bejarano Alcazar, J.; Blanco Lopez, M.A.; Melero Vara, J.M.; Jimenez Diaz, R.M. The influence of Verticillium wilt epidemics on cotton yield in southern Spain. Plant Pathol. 1997, 46, 168–178. [Google Scholar] [CrossRef]
  5. Cai, Y.F.; He, X.H.; Mo, J.C.; Sun, Q.; Yang, J.P.; Liu, J.G. Molecular research and genetic engineering of resistance to Verticillium wilt in cotton. Afr. J. Biotechnol. 2009, 8, 7363–7372. [Google Scholar]
  6. Kamal, M.E. Integrated control of Verticillium wilt of cotton. Plant Dis. 1985, 69, 1025–1032. [Google Scholar]
  7. Yang, C.; Guo, W.Z.; Li, G.Y.; Gao, F.; Lin, S.S.; Zhang, T.Z. QTLs mapping for Verticillium wilt resistance at seedling and maturity stages in Gossypium barbadense L. Plant Sci. 2007, 174, 290–298. [Google Scholar] [CrossRef]
  8. Zhao, F.A.; Fang, W.P.; Xie, D.Y.; Zhao, Y.M.; Tang, Z.J.; Li, W.; Nie, L.H.; Lv, S.P. Proteomic identification of differentially expressed proteins in Gossypium thurberi inoculated with cotton Verticillium dahliae. Plant Sci. 2012, 185–186, 176–184. [Google Scholar] [CrossRef] [PubMed]
  9. Zhou, X.J.; Lu, S.; Xu, Y.H.; Wang, J.W.; Chen, X.Y. A cotton cDNA (GaPR-10) encoding a pathogenesis-related 10 protein with in vitro ribonuclease activity. Plant Sci. 2002, 162, 629–636. [Google Scholar] [CrossRef]
  10. Qin, J.; Zhao, J.Y.; Zuo, K.J.; Cao, Y.F.; Ling, H.; Sun, X.F.; Tang, K.X. Isolation and characterization of an ERF-like gene from Gossypium barbadense. Plant Sci. 2004, 167, 1383–1389. [Google Scholar] [CrossRef]
  11. Tian, J.; Zhang, X.Y.; Liang, B.G.; Li, S.W.; Wu, Z.X.; Wang, Q.H.; Leng, C.X.; Dong, J.L.; Wang, T. Expression of baculovirus anti-apoptotic genes p35 and op-iap in cotton (Gossypium hirsutum L.) enhances tolerance to Verticillium wilt. PLoS ONE 2010, 5, e14218. [Google Scholar] [CrossRef] [PubMed]
  12. Chen, J.Y.; Dai, X.F. Cloning and characterization of the Gossypium hirsutum major latex protein gene and functional analysis in Arabidopsis thaliana. Planta 2010, 231, 861–873. [Google Scholar] [CrossRef] [PubMed]
  13. Zhang, B.L.; Yang, Y.W.; Chen, T.Z.; Yu, W.G.; Liu, T.L.; Li, H.J.; Fan, X.H.; Ren, Y.Z.; Shen, D.Y.; Liu, L.; et al. Island cotton GbVe1 gene encoding a receptor-like protein confers resistance to both defoliating and non-defoliating isolates of Verticillium dahliae. PLoS ONE 2012, 7, e51091. [Google Scholar] [CrossRef] [PubMed]
  14. Zhang, Y.; Wang, X.F.; Ding, Z.G.; Ma, Q.; Zhang, G.R.; Zhang, S.L.; Li, Z.K.; Li, W.Q.; Zhang, G.Y.; Ma, Z.Y. Transcriptome profiling of Gossypium barbadense inoculated with Verticillium dahliae provides a resource for cotton improvement. BMC Genom. 2013, 14, 637. [Google Scholar] [CrossRef] [PubMed]
  15. Sun, Q.; Jiang, H.Z.; Zhu, X.Y.; Wang, W.N.; He, X.H.; Shi, Y.Z.; Yuan, Y.L.; Du, X.M.; Cai, Y.F. Analysis of sea-island cotton and upland cotton in response to Verticillium dahliae infection by RNA sequencing. BMC Genom. 2013, 14, 852. [Google Scholar] [CrossRef] [PubMed]
  16. Xu, L.; Zhu, L.F.; Tu, L.L.; Liu, L.L.; Yuan, D.J.; Jin, L.; Long, L.; Zhang, X.L. Lignin metabolism has a central role in the resistance of cotton to the wilt fungus Verticillium dahliae as revealed by RNA-Seq-dependent transcriptional analysis and histochemistry. J. Exp. Bot. 2011, 62, 5607–5621. [Google Scholar] [CrossRef] [PubMed]
  17. Yin, Z.J.; Li, Y.; Han, X.L.; Shen, F.F. Genome-wide profiling of miRNAs and other small non-coding RNAs in the Verticillium dahliae-inoculated cotton roots. PLoS ONE 2012, 7, e35765. [Google Scholar] [CrossRef] [PubMed]
  18. He, X.H.; Sun, Q.; Jiang, H.Z.; Zhu, X.Y.; Mo, J.H.; Long, L.; Xiang, L.X.; Xie, Y.F.; Shi, Y.Z.; Yuan, Y.L.; Cai, Y.F. Identification of novel microRNAs in the Verticillium wilt-resistant upland cotton variety KV-1 by high-throughput sequencing. Springer Plus 2014, 3, 564. [Google Scholar] [CrossRef] [PubMed]
  19. Wang, F.X.; Ma, Y.P.; Yang, C.L.; Zhao, P.M.; Yao, Y.; Jian, G.L.; Luo, Y.M.; Xia, G.X. Proteomic analysis of the sea-island cotton roots infected by wilt pathogen Verticillium dahliae. Proteomics 2011, 11, 1–14. [Google Scholar] [CrossRef] [PubMed]
  20. Zhang, W.W.; Wang, S.Z.; Liu, K.; Si, N.; Qi, F.J.; Jian, G.L. Comparative expression analysis in susceptible and resistant Gossypium hirsutum responding to Verticillium dahliae infection by cDNA-AFLP. Physiol. Mol. Plant Pathol. 2012, 80, 50–57. [Google Scholar] [CrossRef]
  21. Gao, W.; Long, L.; Zhu, L.; Xu, L.; Gao, W.; Sun, L.Q.; Liu, L.L.; Zhang, X.L. Proteomic and virusinduced gene silencing (VIGS) analyses reveal that gossypol, brassinosteroids and jasmonic acid contribute to the resistance of cotton to Verticillium dahliae. Mol. Cell. Proteom. 2013, 12, 3690–3703. [Google Scholar] [CrossRef] [PubMed]
  22. Wang, K.B.; Wang, Z.W.; Li, F.G.; Ye, W.W.; Wang, J.Y.; Song, G.L.; Yue, Z.; Cong, L.; Shang, H.H.; Zhu, S.L.; et al. The draft genome of a diploid cotton Gossypium raimondii. Nat. Genet. 2012, 44, 1098–1103. [Google Scholar] [CrossRef] [PubMed]
  23. Tatusov, R.L.; Galperin, M.Y.; Natale, D.A.; Koonin, E.V. The COG database: A tool for genome-scale analysis of protein functions and evolution. Nucleic Acids Res. 2000, 28, 33–36. [Google Scholar] [CrossRef] [PubMed]
  24. Naoumkina, M.A.; Zhao, Q.; Gallego-Giraldo, L.; Dai, X.; Zhao, P.X.; Dixon, R.A. Genome-wide analysis of phenylpropanoid defence pathways. Mol. Plant Pathol. 2010, 11, 829–846. [Google Scholar] [CrossRef] [PubMed]
  25. Smit, F.; Dubery, L.A. Cell wall reinforcement in cotton hypocotyls in response to a Verticillium dahliae elicitor. Phytochemistry 1997, 44, 811–815. [Google Scholar] [CrossRef]
  26. Pomar, F.; Novo, M.; Bernal, M.A.; Merino, F.; Barcelo, A.R. Changes in stem lignins (monomer composition and crosslinking) and peroxidase are related with the maintenance of leaf photosynthetic integrity during Verticillium wilt in Capsicum annuum. New Phytol. 2004, 163, 111–123. [Google Scholar] [CrossRef]
  27. Gayoso, C.; Pomar, F.; Novo-Uzal, E.; Merino, F.; Martinez de Ilarduya, O. The Ve-mediated resistance response of the tomato to Verticillium dahliae involves H2O2, peroxidase and lignins and drives PAL gene expression. BMC Plant Biol. 2010, 10, 232–251. [Google Scholar] [CrossRef] [PubMed]
  28. Swain, S.; Singh, N.; Nandi, A.K. Identification of plant defence regulators through transcriptional profiling of Arabidopsis thaliana cdd1 mutant. J. Biosci. 2015, 40, 137–146. [Google Scholar] [CrossRef] [PubMed]
  29. Matern, S.; Peskan-Berghoefer, T.; Gromes, R.; Kiesel, R.V.; Rausch, T. Imposed glutathione-mediated redox switch modulates the tobacco wound-induced protein kinase and salicylic acid induced protein kinase activation state and impacts on defence against Pseudomonas syringae. J. Exp. Bot. 2015, 66, 1935–1950. [Google Scholar] [CrossRef] [PubMed]
  30. Chowdhury, J.; Henderson, M.; Schweizer, P.; Burton, R.A.; Fincher, G.B.; Little, A. Differential accumulation of callose, arabinoxylan and cellulose in nonpenetrated versus penetrated papillae on leaves of barley infected with Blumeria graminis f. sp. hordei. New Phytol. 2014, 204, 650–660. [Google Scholar] [CrossRef] [PubMed]
  31. Christensen, J.H.; Bauw, G.; Welinder, K.G.; van Montagu, M.; Boerjan, W. Purification and characterization of peroxidases correlated with lignification in poplar xylem. Plant Physiol. 1998, 118, 125–135. [Google Scholar] [CrossRef] [PubMed]
  32. Ray, H.; Hammerschmidt, R. Responses of potato tuber to infection by Fusarium sambucinum. Physiol. Mol. Plant Pathol. 1998, 53, 81–92. [Google Scholar] [CrossRef]
  33. Treutter, D. Significance of flavonoids in plant resistance and enhancement of their biosynthesis. Plant Biol. 2005, 7, 581–591. [Google Scholar] [CrossRef] [PubMed]
  34. Wildermuth, M.C.; Dewdney, J.; Wu, G.; Ausubel, F.M. Isochorismate synthase is required to synthesize salicylic acid for plant defence. Nature 2001, 414, 562–565. [Google Scholar] [PubMed]
  35. Jelenska, J.; Yao, N.; Vinatzer, B.A.; Wright, C.M.; Brodsky, J.L.; Greenberg, J.T. A J domain virulence effector of Pseudomonas syringae remodels host chloroplasts and suppresses defenses. Curr. Biol. 2007, 17, 499–508. [Google Scholar] [CrossRef] [PubMed]
  36. Ahuja, I.; Kissen, R.; Bones, A.M. Phytoalexins in defense against pathogens. Trends Plant Sci. 2012, 17, 73–90. [Google Scholar] [CrossRef] [PubMed]
  37. Venisse, J.S.; Malnoy, M.; Faize, M.; Paulin, J.P.; Brisset, M.N. Modulation of defense responses of Malus spp. during compatible and incompatible interactions with Erwinia amylovora. Mol. Plant Microbe Interact. 2002, 15, 1204–1212. [Google Scholar] [CrossRef] [PubMed]
  38. Thilmony, R.; Underwood, W.; He, S.Y. Genome-wide transcriptional analysis of the Arabidopsis thaliana interaction with the plant pathogen Pseudomonas syringae pv. tomato DC3000 and the human pathogen Escherichia coli O157:H7. Plant J. 2006, 46, 34–53. [Google Scholar] [CrossRef] [PubMed]
  39. Truman, W.; de Zabala, M.T.; Grant, M. Type III effectors orchestrate a complex interplay between transcriptional networks to modify basal defence responses during pathogenesis and resistance. Plant J. 2006, 46, 14–33. [Google Scholar] [CrossRef] [PubMed]
  40. Vogt, T. Phenylpropanoid biosynthesis. Mol. Plant. 2010, 3, 2–20. [Google Scholar] [CrossRef] [PubMed]
  41. Bari, R.; Jones, J.D. Role of plant hormones in plant defence responses. Plant Mol. Biol. 2009, 69, 473–488. [Google Scholar] [CrossRef] [PubMed]
  42. Pieterse, C.M.; van der Does, D.; Zamioudis, C.; Leon-Reyes, A.; van Wees, S.C. Hormonal modulation of plant immunity. Annu. Rev. Cell Dev. Biol. 2012, 28, 489–521. [Google Scholar] [CrossRef] [PubMed]
  43. Glazebrook, J.; Chen, W.J.; Estes, B.; Chang, H.S.; Nawrath, C.; Metraux, J.P.; Zhu, T.; Katagiri, F. Topology of the network integrating salicylate and jasmonate signal transduction derived from global expression phenotyping. Plant J. 2003, 34, 217–228. [Google Scholar] [CrossRef] [PubMed]
  44. Vlot, A.C.; Dempsey, D.A.; Klessig, D.F. Salicylic acid, a multi-faceted hormone to combat disease. Annu. Rev. Phytopathol. 2009, 47, 177–206. [Google Scholar] [CrossRef] [PubMed]
  45. Glazebrook, J. Contrasting mechanisms of defense against biotrophic and necrotrophic pathogens. Annu. Rev. Phytopathol. 2005, 43, 205–227. [Google Scholar] [CrossRef] [PubMed]
  46. Adams, D.J. Fungal cell wall chitinases and glucanases. Microbiology 2004, 150, 2029–2035. [Google Scholar] [CrossRef] [PubMed]
  47. Lawrence, S.D.; Novak, N.G. Expression of poplar chitinase in tomato leads to inhibition of development in Colorado potato beetle. Biotechnol. Lett. 2006, 28, 593–599. [Google Scholar] [CrossRef] [PubMed]
  48. Nurnberger, T.; Brunner, F.; Kemmerling, B.; Piater, L. Innate immunity in plants and animals: Striking similarities and obvious differences. Immunol. Rev. 2004, 198, 249–266. [Google Scholar] [CrossRef] [PubMed]
  49. Catanzariti, A.M.; Dodds, P.N.; Ve, T.; Kobe, B.; Ellis, J.G.; Staskawicz, B.J. The AvrM effector from Flax rust has a structured C-terminal domain and interacts directly with the M resistance protein. Mol. Plant-Microbe Interact. 2010, 23, 49–57. [Google Scholar] [CrossRef] [PubMed]
  50. Ade, J.; de Young, B.J.; Golstein, C.; Innes, R.W. Indirect activation of a plant nucleotide binding site-leucine-rich repeat protein by a bacterial protease. Proc. Natl. Acad. Sci. USA 2007, 104, 2531–2536. [Google Scholar] [CrossRef] [PubMed]
  51. Zuo, K.; Wang, J.; Wu, W.; Chai, Y.; Sun, X.; Tang, K. Identification and characterization of differentially expressed ESTs of Gossypium barbadense infected by Verticillium dahliae with suppression subtractive hybridization. Mol. Biol. 2005, 39, 214–223. [Google Scholar] [CrossRef]
  52. Bradford, M.M. Rapid and sensitive method for quantitation of microgram quantities of protein utilizing principle of protein-dye binding. Anal. Biochem. 1976, 72, 248–254. [Google Scholar] [CrossRef]
  53. Liu, Y.H.; Lin-Wang, K.; Deng, C.; Warran, B.; Wang, L.; Yu, B.; Yang, H.Y.; Wang, J.; Espley, R.V.; Zhang, J.L.; et al. Comparative transcriptome analysis of white and purple potato to identify genes involved in anthocyanin biosynthesis. PLoS ONE 2015, 10, e0129148. [Google Scholar] [CrossRef] [PubMed]
  54. Kanehisa, M.; Goto, S.; Sato, Y.; Furumichi, M.; Tanabe, M. KEGG for integration and interpretation of large-scale molecular data sets. Nucleic Acids Res. 2012, 40, D109–D114. [Google Scholar] [CrossRef] [PubMed]
  55. Kanehisa, M.; Araki, M.; Goto, S.; Hattori, M.; Hirakawa, M.; Itoh, M.; Katayama, T.; Kawashima, S.; Okuda, S.; Tokimatsu, T.; Yamanishi, Y. KEGG for linking genomes to life and the environment. Nucleic Acids Res. 2008, 36, D480–D484. [Google Scholar] [CrossRef] [PubMed]
  56. Yang, J.; Zhang, J.; Wang, Z.; Zhu, Q.; Wang, W. Hormonal changes in the grains of rice subjected to water stress during grain filling. Plant Physiol. 2001, 127, 315–323. [Google Scholar] [CrossRef] [PubMed]
  57. Livak, K.J.; Schmittgen, T.D. Analysis of relative gene expression data using real-time quantitative PCR and the 2−ΔΔCt method. Methods 2001, 25, 402–408. [Google Scholar] [CrossRef] [PubMed]
  58. Tang, Q.Y.; Zhang, C.X. Data Processing System (DPS) software with experimental design, statistical analysis and data mining developed for use in entomological research. Insect Sci. 2013, 20, 254–260. [Google Scholar] [CrossRef] [PubMed]

