Article

In Vitro Cytotoxic Evaluation of MgO Nanoparticles and Their Effect on the Expression of ROS Genes

1
Department of Biological Engineering, Konkuk University, 120 Neungdong-ro, Gwangjin-Gu, Seoul 143701, Korea
2
Department of Chemical Engineering, Konkuk University, 120 Neungdong-ro, Gwangjin-Gu, Seoul 143701, Korea
3
Water Environment Center, Korea Institute of Science and Technology, P.O. Box 131, Cheongryang-Gu, Seoul 130650, Korea
4
Urban Agriculture Research Division, National Institute of Horticultural and Herbal Science, Rural Development Administration, Jeonju 560500, Korea
*
Author to whom correspondence should be addressed.
Int. J. Mol. Sci. 2015, 16(4), 7551-7564; https://doi.org/10.3390/ijms16047551
Submission received: 10 February 2015 / Revised: 19 March 2015 / Accepted: 30 March 2015 / Published: 3 April 2015
(This article belongs to the Special Issue Bioactive Nanoparticles)

Abstract

:
Water-dispersible MgO nanoparticles were tested to investigate their cytotoxic effects on oxidative stress gene expression. In this in vitro study, genes related to reactive oxygen species (ROS), glutathione S-transferase (GST) and catalase, were quantified using real-time polymerase chain reactions (molecular level) and molecular beacon technologies (cellular level). The monodispersed MgO nanoparticles, 20 nm in size, were used to treat human cancer cell lines (liver cancer epithelial cells) at different concentrations (25, 75 and 150 µg/mL) and incubation times (24, 48 and 72 h). Both the genetic and cellular cytotoxic screening methods produced consistent results, showing that GST and catalase ROS gene expression was maximized at 150 µg/mL nanoparticle treatment with 48 h incubation. However, the genotoxic effect of MgO nanoparticles was not significant compared with control experiments, which indicates its significant potential applications in nanomedicine as a diagnostic and therapeutic tool.

1. Introduction

Advancements in nanotechnology have led to the development of the new field of nanomedicine, which involves the application of nanomaterials and nanodevices for diagnostic and therapeutic purposes. Although nanomaterials are currently being widely used in the fields of life science and biomedicine, there is a serious lack of information concerning the human health and environmental implications of manufactured nanomaterials [1,2]. Recent in vivo and in vitro studies have suggested that inhalational and dermal absorption of some nanomaterials may have adverse health effects [3] and the use of medical products containing nanomaterials may lead to chronic health conditions [4]. Thus, along with the development of novel nanoparticles, a simultaneous assessment of the toxicological and environmental effects of nanoparticles should be considered [3].
Among various manufactured nanomaterials, metal oxide nanoparticles such as ZnO, Fe3O4, MnO and MgO have high potential as contrast-enhancement agents for MRI procedures to help provide excellent anatomical images [5,6,7]. A key requirement for the successful use of these nanoparticles in biomedical applications is their good dispersibility, colloidal stability in biological media, internalization efficiency, and low toxicity. Although a variety of methods for synthesizing high-quality metal oxide nanoparticles in organic solvents with improved monodispersity and crystallinity have been reported [8], such nanoparticles are water-immiscible and not sufficiently stable in the physiological conditions. We used the polyehtyleneglycol (PEG)-derivatized phospholipid ligands with biocompatible PEGs as tail groups and surface-coordinating phospholipids as head groups. This sophisticated method produces high water stability and biocompatibility by displacing hydrophobic ligands on the surface of the metal oxide nanoparticles with phospholipids regardless of core materials [9,10].
The potential cytotoxicity of nanoparticles is derived from oxidative stress induced by reactive oxygen species (ROS) [11]. Thus, oxidative stress is a suitable measure for comparing the toxic effects of different nanoparticles [12,13]. In addition, the adverse effects of ROS generation lead to apoptosis, which induces significant cell structure damage to membrane lipids, membrane proteins, and the nuclear membrane [14]. Many studies have demonstrated the ability of nanoparticles to generate ROS in a cell-free environment [15,16]. Some studies have shown that carbon nanoparticles can induce glutathione depletion indicative of oxidative stress in epithelial cell lines [15] and in the lung cells [17]. This oxidative stress has been linked to the induction of the signalling pathways [18] that lead to pro-inflammatory oxidative stress gene expression in macrophages [11]. Therefore, the evaluation of the oxidative potential of nanoparticles is an important part of assessing their toxicity.
In the present study, we selected glutathione S-transferase and catalase, which are the most common oxidative stress genes reported in human cell lines [14], to evaluate cytotoxicity through the expression of ROS genes by the engineered metal oxide nanoparticles (MgO), considering the cell viability results of earlier work [7]. Among the metal oxide nanomaterials, MgO is particularly interesting as a low cost, environmentally friendly material. The toxicity of MgO has found to be lower than other metal oxide nanoparticles, including ZnO [19], which is the same size, and TiO2 [20], which is commonly attributed to the production of reactive oxygen species [21]. Hence, the PEG-phospholipid encapsulated MgO nanoparticles were used in various concentrations to treat human cancer cell lines with different incubation times. The liver cancer epithelial cells were chosen as in vitro models since MRI contrast agents have cytotoxic impact on those cell lines in vivo. For quantification of the expressed ROS genes, we analyzed the expression of oxidative stress gene by using both TaqMan probe-based RT-PCR and molecular beacon (MB) technology in the live cells.

2. Results

2.1. Biocompatible MgO Nanoparticle Synthesis

Monodispersed, water-dispersible MgO nanoparticles were 20 nm in diameter, uniform in size and synthesized by the thermal decomposition of metal-oleate complex. The resulting nanoparticles were stabilized using hydrophobic tails of surfactants (oleic acid and oleylamine) and dispersed in a nonpolar organic solvent such as chloroform. Then, the nanoparticles were encapsulated by PEG-phospholipids shell to endow them with biocompatibility.

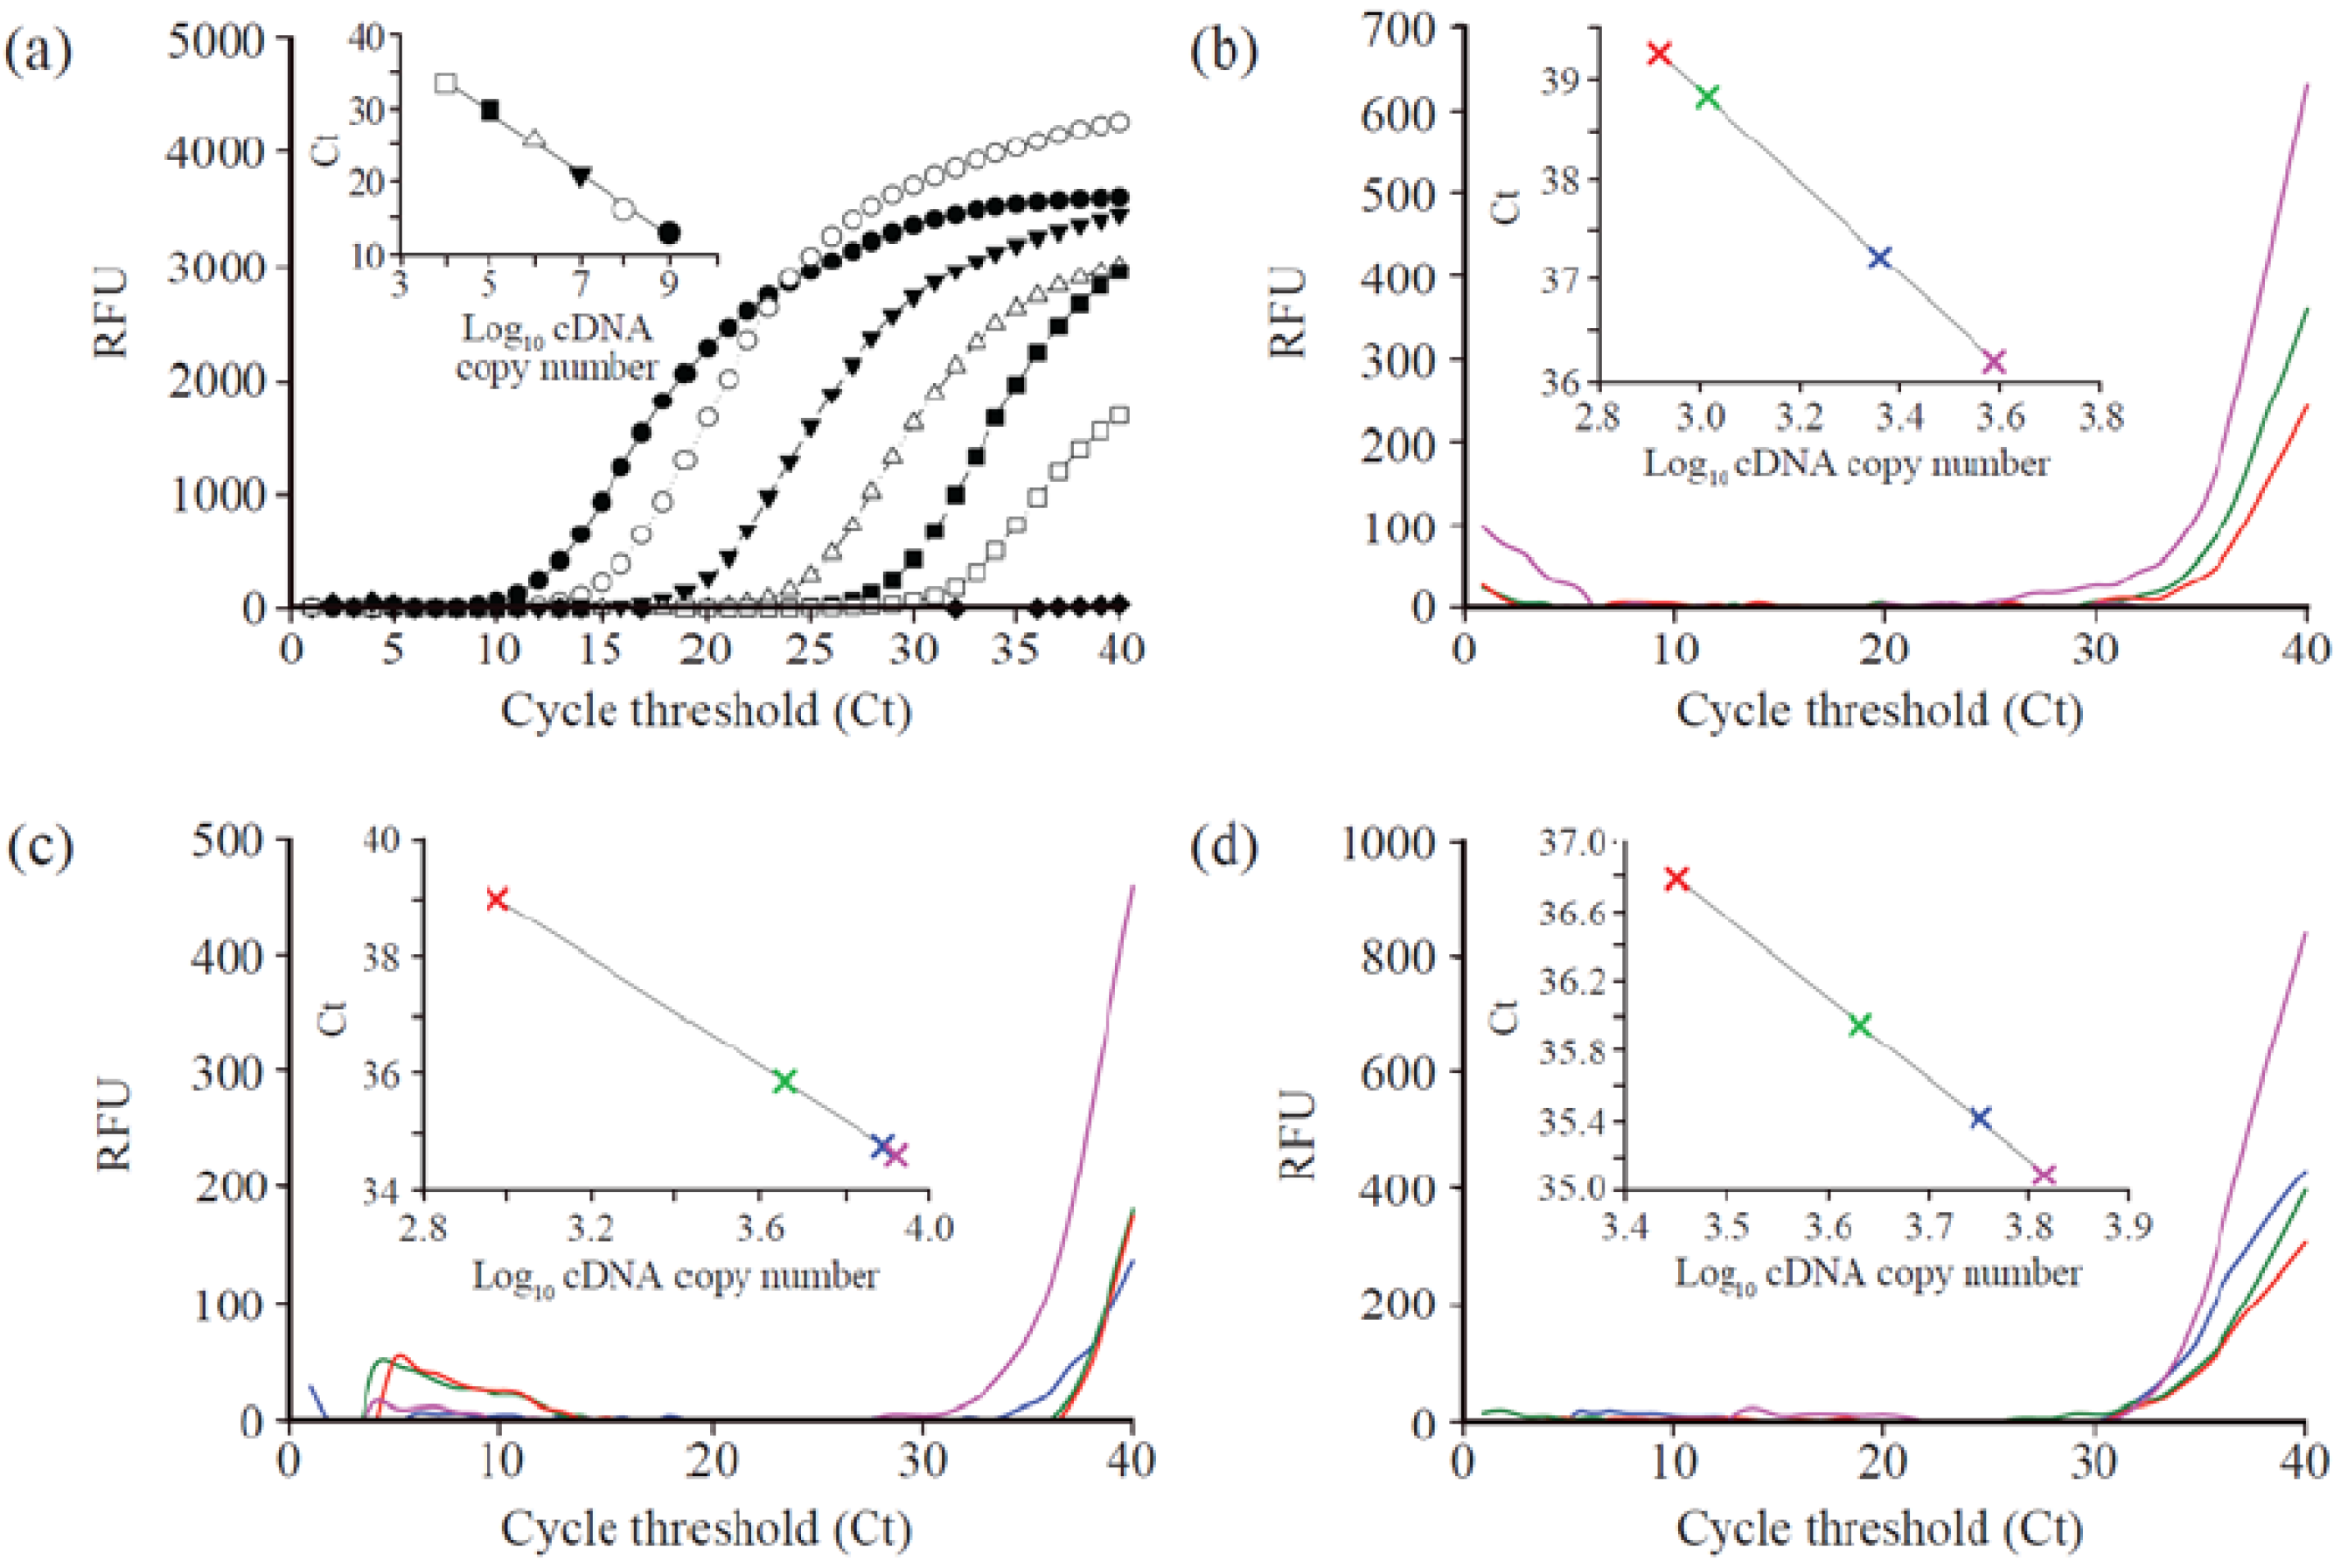
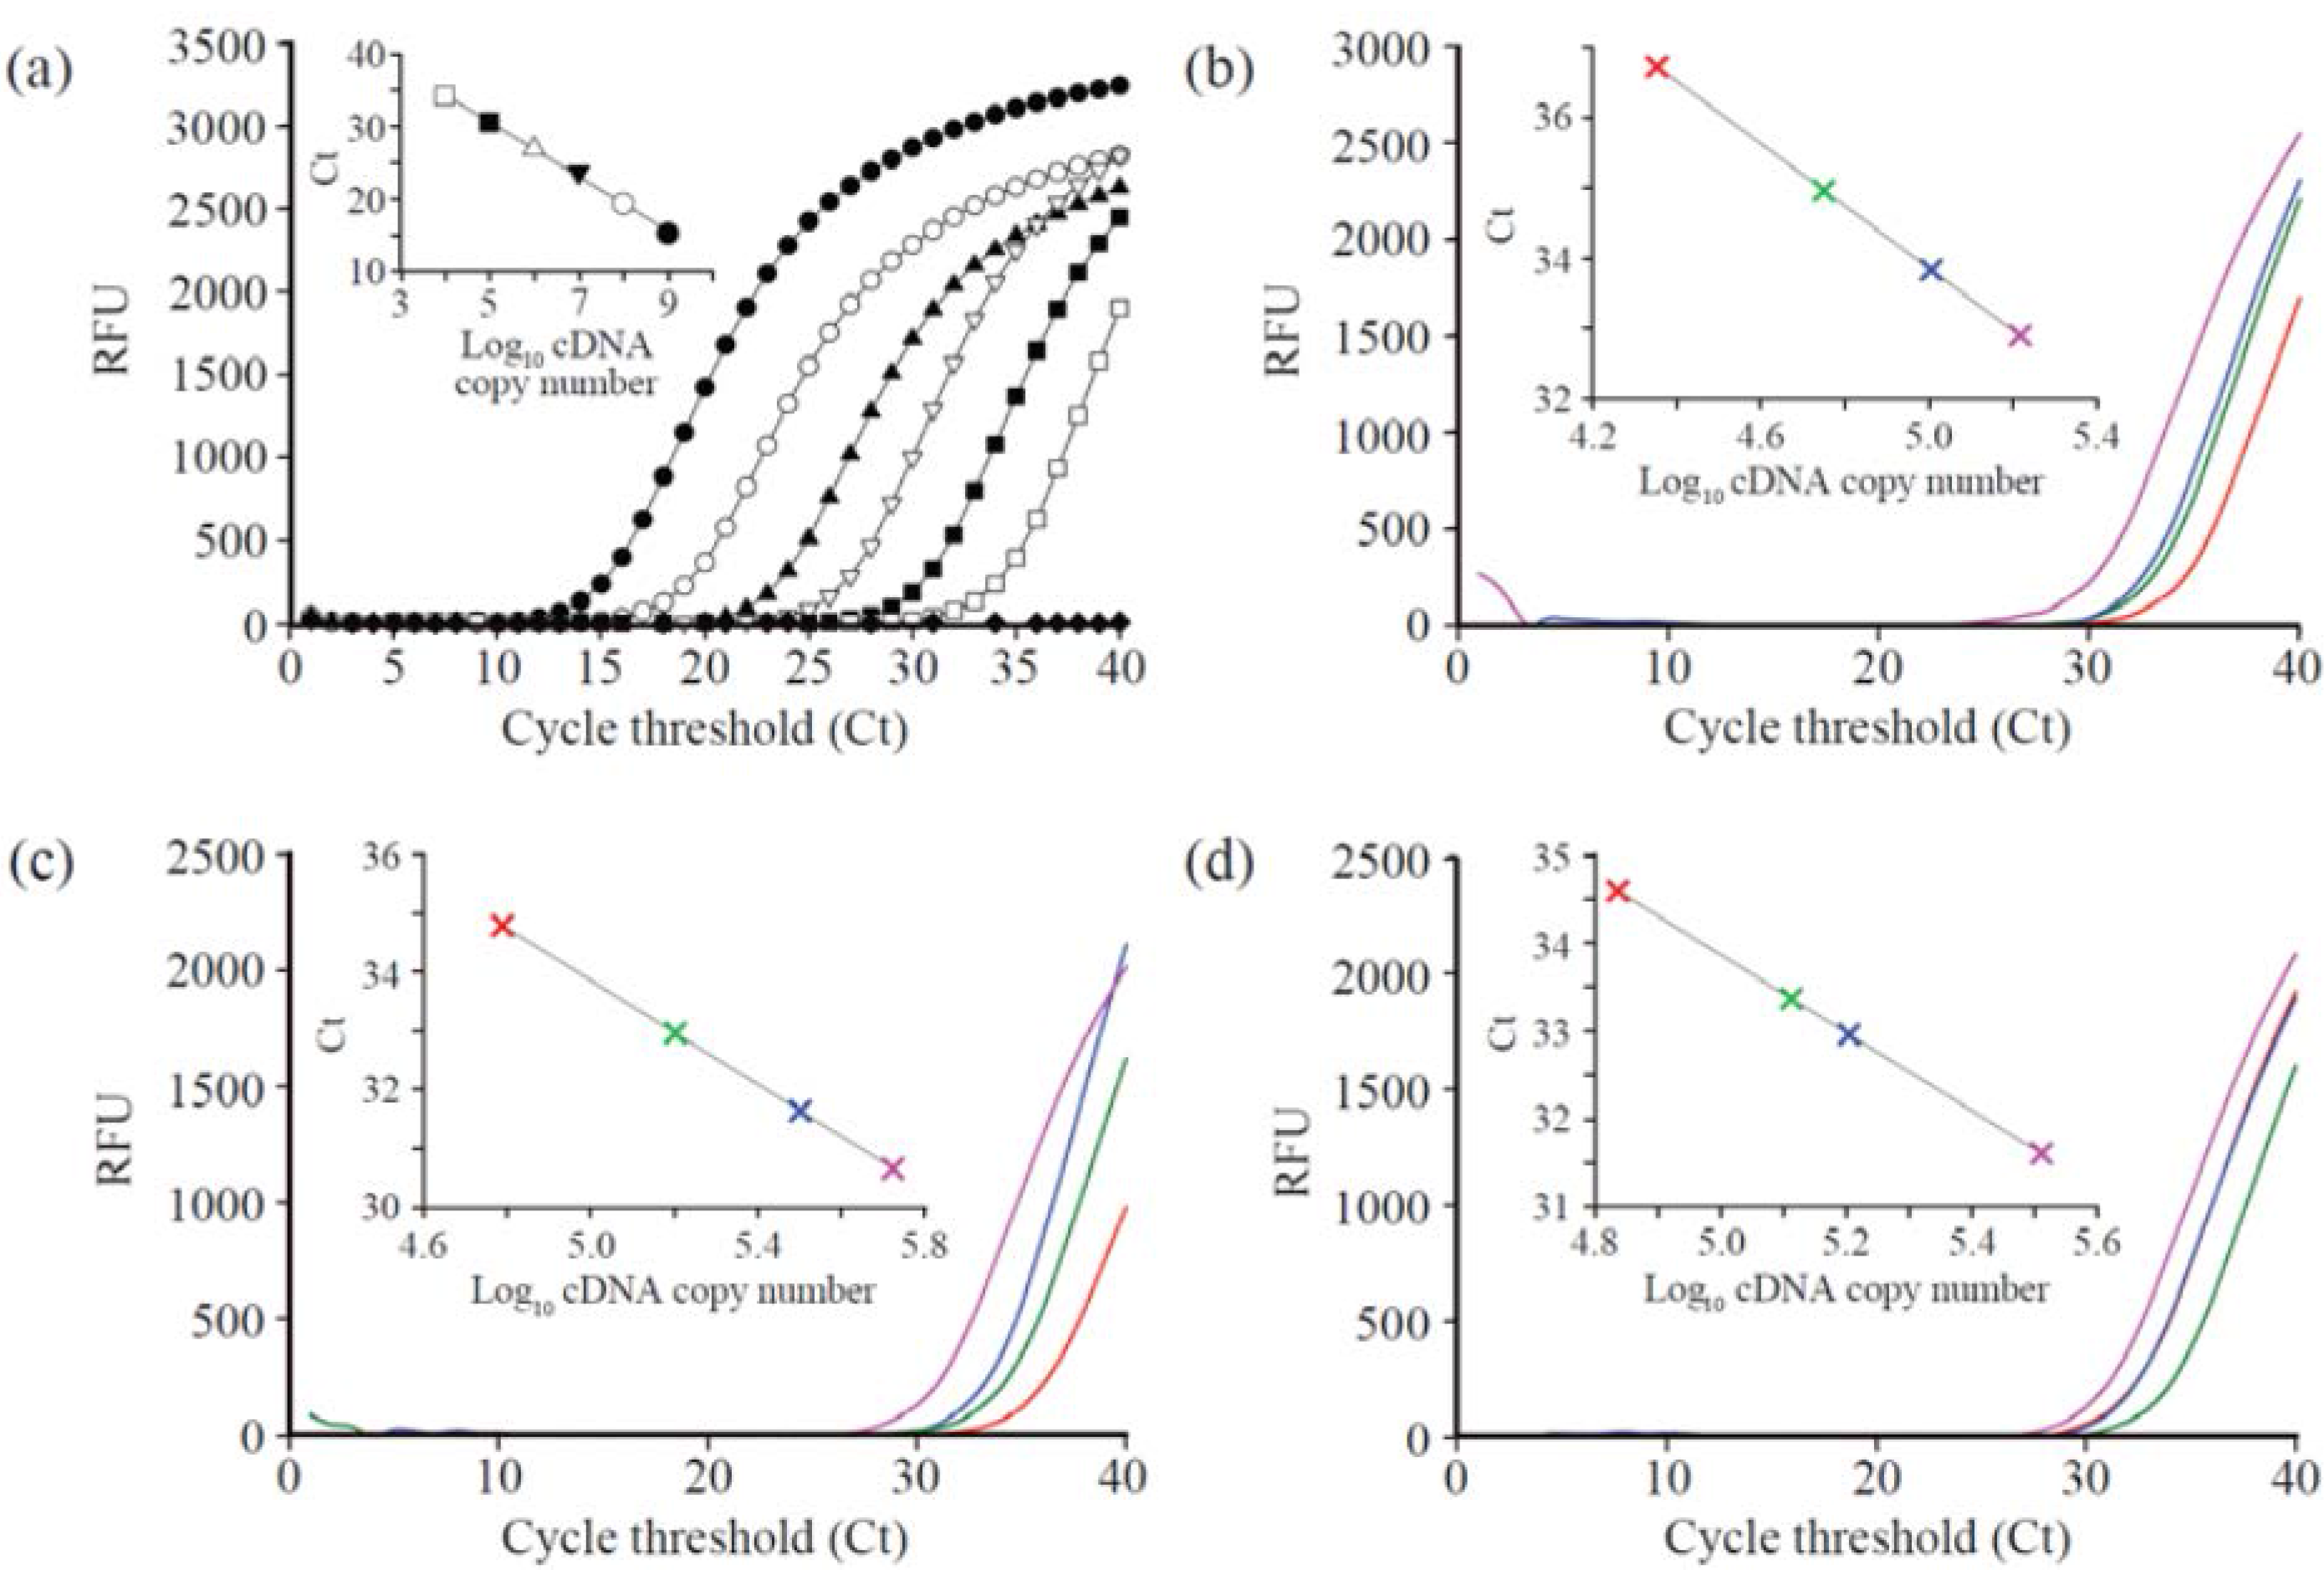
2.2. Real-Time Quantitation of GST and Catalase Genes

The genes expressions of the GST and catalase from HepG2 were quantified using RT-PCR. Initially, a calibration curve was obtained by using serial dilution of synthetic cDNA as a template ranging from 109 to 104. Figure 1a and Figure 2a show the calibration curve for GST and catalase gene expression. The RNAs extracted from the cell lines that were treated with 25, 75, and 150 µg/mL of MgO nanoparticles incubated for 24, 48, and 72 h were used for RT-PCR for quantitation. The expressed GST gene level of cells shows the tendency toward decreasing Ct values as the concentration of nanoparticles increased at a fixed incubation time (Figure 1 and Table 1). At 24 h incubation time, the amount of cDNA gradually increased from 8.40 × 10² for the control to 1.12 × 10³ for 25 µg/mL, 2.34 × 10³ for 75 µg/mL, and 3.90 × 10³ for 150 µg/mL as shown in Figure 1b. At 48 h incubation time (Figure 1c), the corresponding copy amount of cDNA was 9.57 × 10² for a control, 4.60 × 10³ for 25 µg/mL, 7.83 × 10³ for 75 µg/mL, and 8.40 × 10³ for 150 µg/mL. In the case of 25 and 75 µg/mL treatment, GST gene expression decreased slightly, meaning the maximum expression point is located between 24 and 48 h incubation time. However, when 150 µg/mL of MgO was used, the maximum level was near 48 h incubation time due to the relatively high concentration of the MgO treatment. The same or slight decrease in the quantity of cDNA was measured as 4.10 × 10³ for 25 µg/mL, 5.37 × 10³ for 75 µg/mL, and 5.90 × 10³ for 150 µg/mL after 72 h incubation (Figure 1d). Under our experimental conditions, the highest copy number of GST gene in the HepG2 cell was seen to be 8.40 × 10³ when treated with 150 µg/mL of MgO at 48 h incubation. A similar trend in gene expression in catalase was observed as shown in Figure 2. This indicates that the expression level increases proportionally with concentration at a fixed incubation time. The maximum gene expression level of the catalase gene was 5.26 × 10⁵ at 150 µg/mL of MgO with 48 h incubation (Figure 2 and Table 2). However, the absolute cDNA copy number with catalase genes were more expressed than GST genes.
Figure 1. Genotoxicity of MgO nanoparticles on expression of GST in HepG2 cells. (a) RT-PCR profiles with serially diluted cDNA as a template (● 1.0 × 10⁹, ○ 1.0 × 10⁸, ▼ 1.0 × 10⁷, △ 1.0 × 10⁶, ■ 1.0 × 10⁵, □ 1.0 × 10⁴, ♦ blank) and the calibration curve of cDNA copy number with respect to the corresponding Ct values (inset). The enlarged RT-PCR profiles depend on the MgO nanoparticle incubation time of (b) 24 h, (c) 48 h and (d) 72 h, and MgO concentrations (red: control, green: 25 µg/mL, blue: 75 µg/mL, pink: 150 µg/mL).
Ijms 16 07551 g001
Figure 2. Genotoxicity of MgO nanoparticles on the expression of catalase in HepG2 cells. (a) RT-PCR profiles with serially diluted cDNA as a template (● 1.0 × 10⁹, ○ 1.0 × 10⁸, ▼ 1.0 × 10⁷, △ 1.0 × 10⁶, ■ 1.0 × 10⁵, □ 1.0 × 10⁴, ♦ blank) and the calibration curve of the cDNA copy number with respect to the corresponding Ct values (Inset). The RT-PCR profiles depend on the MgO nanoparticle incubation time of (b) 24 h, (c) 48 h and (d) 72 h, and MgO concentrations (red: control, green: 25 µg/mL, blue: 75 µg/mL, pink: 150 µg/mL).
Ijms 16 07551 g002
Table 1. The expressed GST gene number with variation in MgO concentration and incubation time.
MgO Conc. (μg)cDNA Copy Number
24 h48 h72 h
08.40 × 1029.57 × 1022.88 × 103
251.15 × 1034.60 × 1034.10 × 103
752.34 × 1037.83 × 1035.37 × 103
1503.90 × 1038.40 × 1035.90 × 103
Table 2. The expressed catalase gene number with variation in MgO concentration and incubation time.
MgO Conc. (μg)cDNA Copy Number
24 h48 h72 h
00.23 × 1050.62 × 1050.68 × 105
250.57 × 1051.63 × 1051.32 × 105
751.11 × 1053.207 × 1051.61 × 105
1501.63 × 1055.26 × 1053.25 × 105

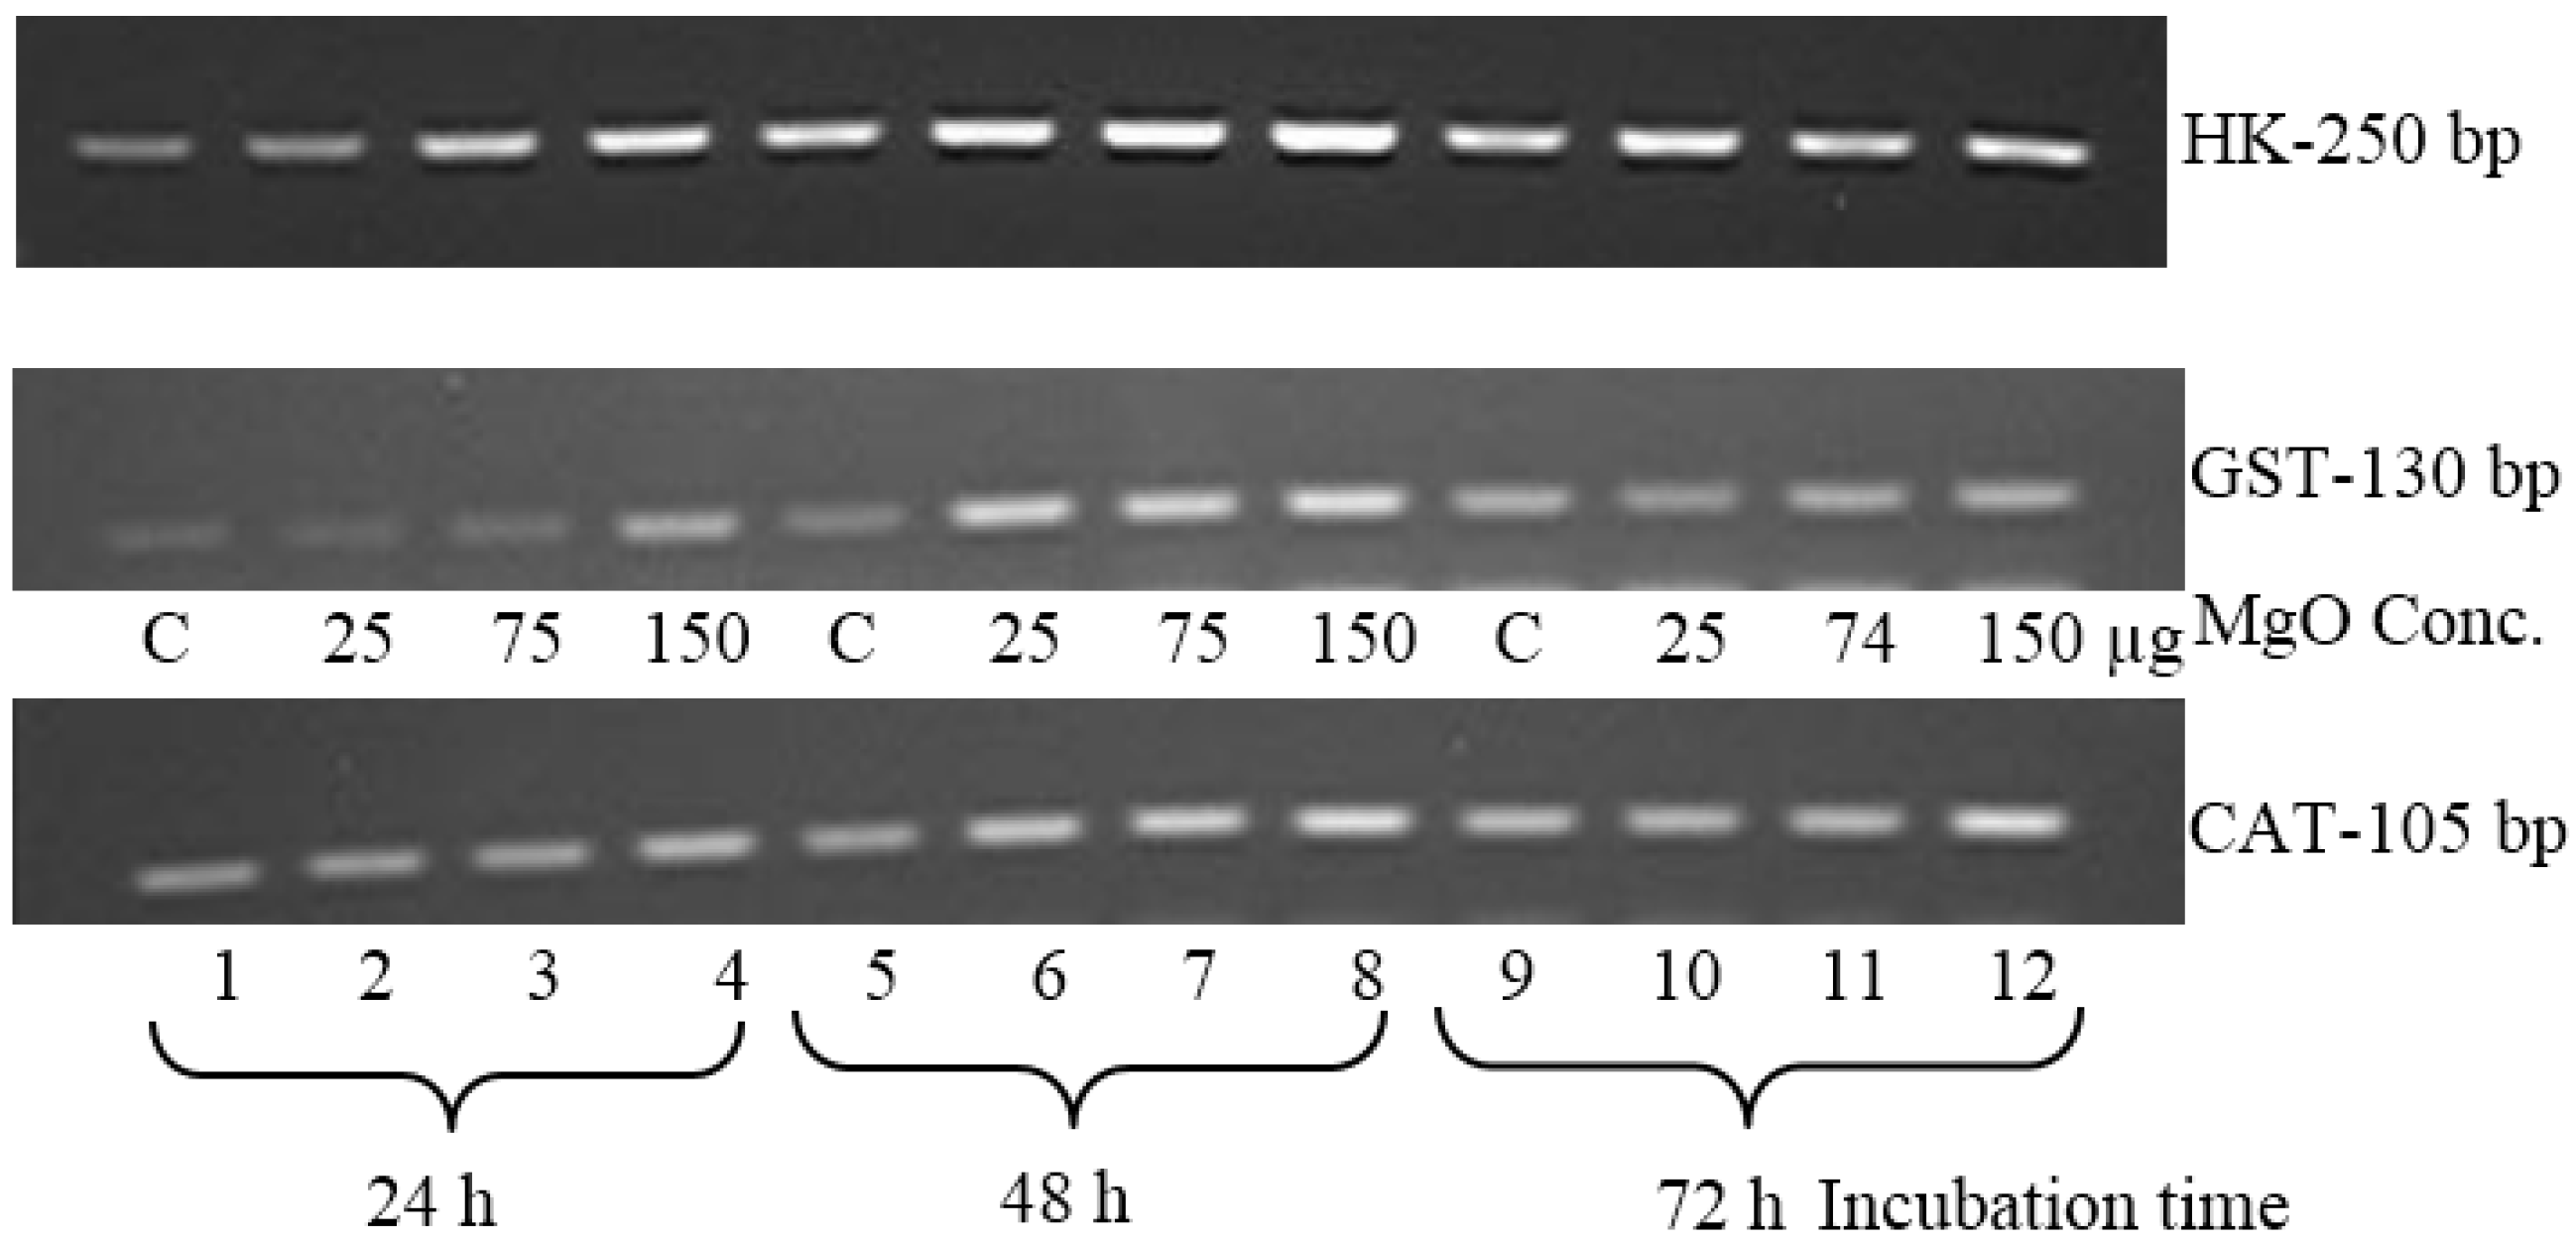
2.3. Quantitative Analysis of GST and Catalase on an Agarose Gel

The synthesized cDNA of MCF7 cell samples after MgO treatments was amplified by PCR for the expression of GST and catalase with 30 thermal cycles. Figure 3 shows the amplified product bands of GST and catalase genes along the GAPDH housekeeping gene. An increase in the concentration from 25 to 150 µg/mL of MgO nanoparticles showed a progressive increase in the band intensity in the agarose gel. The highest band intensity was expressed in the samples treated with 150 µg/mL of MgO nanoparticles at a fixed incubation time. However, the highest band intensity was observed at 48 h incubation, while the lowest and medium intensity bands were observed at 24 and 72 h, respectively, for both GST and catalase. These results were consistent with the RT-PCR data.
Figure 3. Gene expressions of GST and catalase of HepG2 on agarose gel. Expression of GST and catalase bands of HepG2 cell samples at 30 cycles amplification of cDNA. The gene expressions of GST (130 bp) and catalase (105 bp) showed variations in the band intensity with respect to MgO concentration and incubation time. The house keeping gene (GAPDH) for 200 bp product was also used as a reference control.
Ijms 16 07551 g003

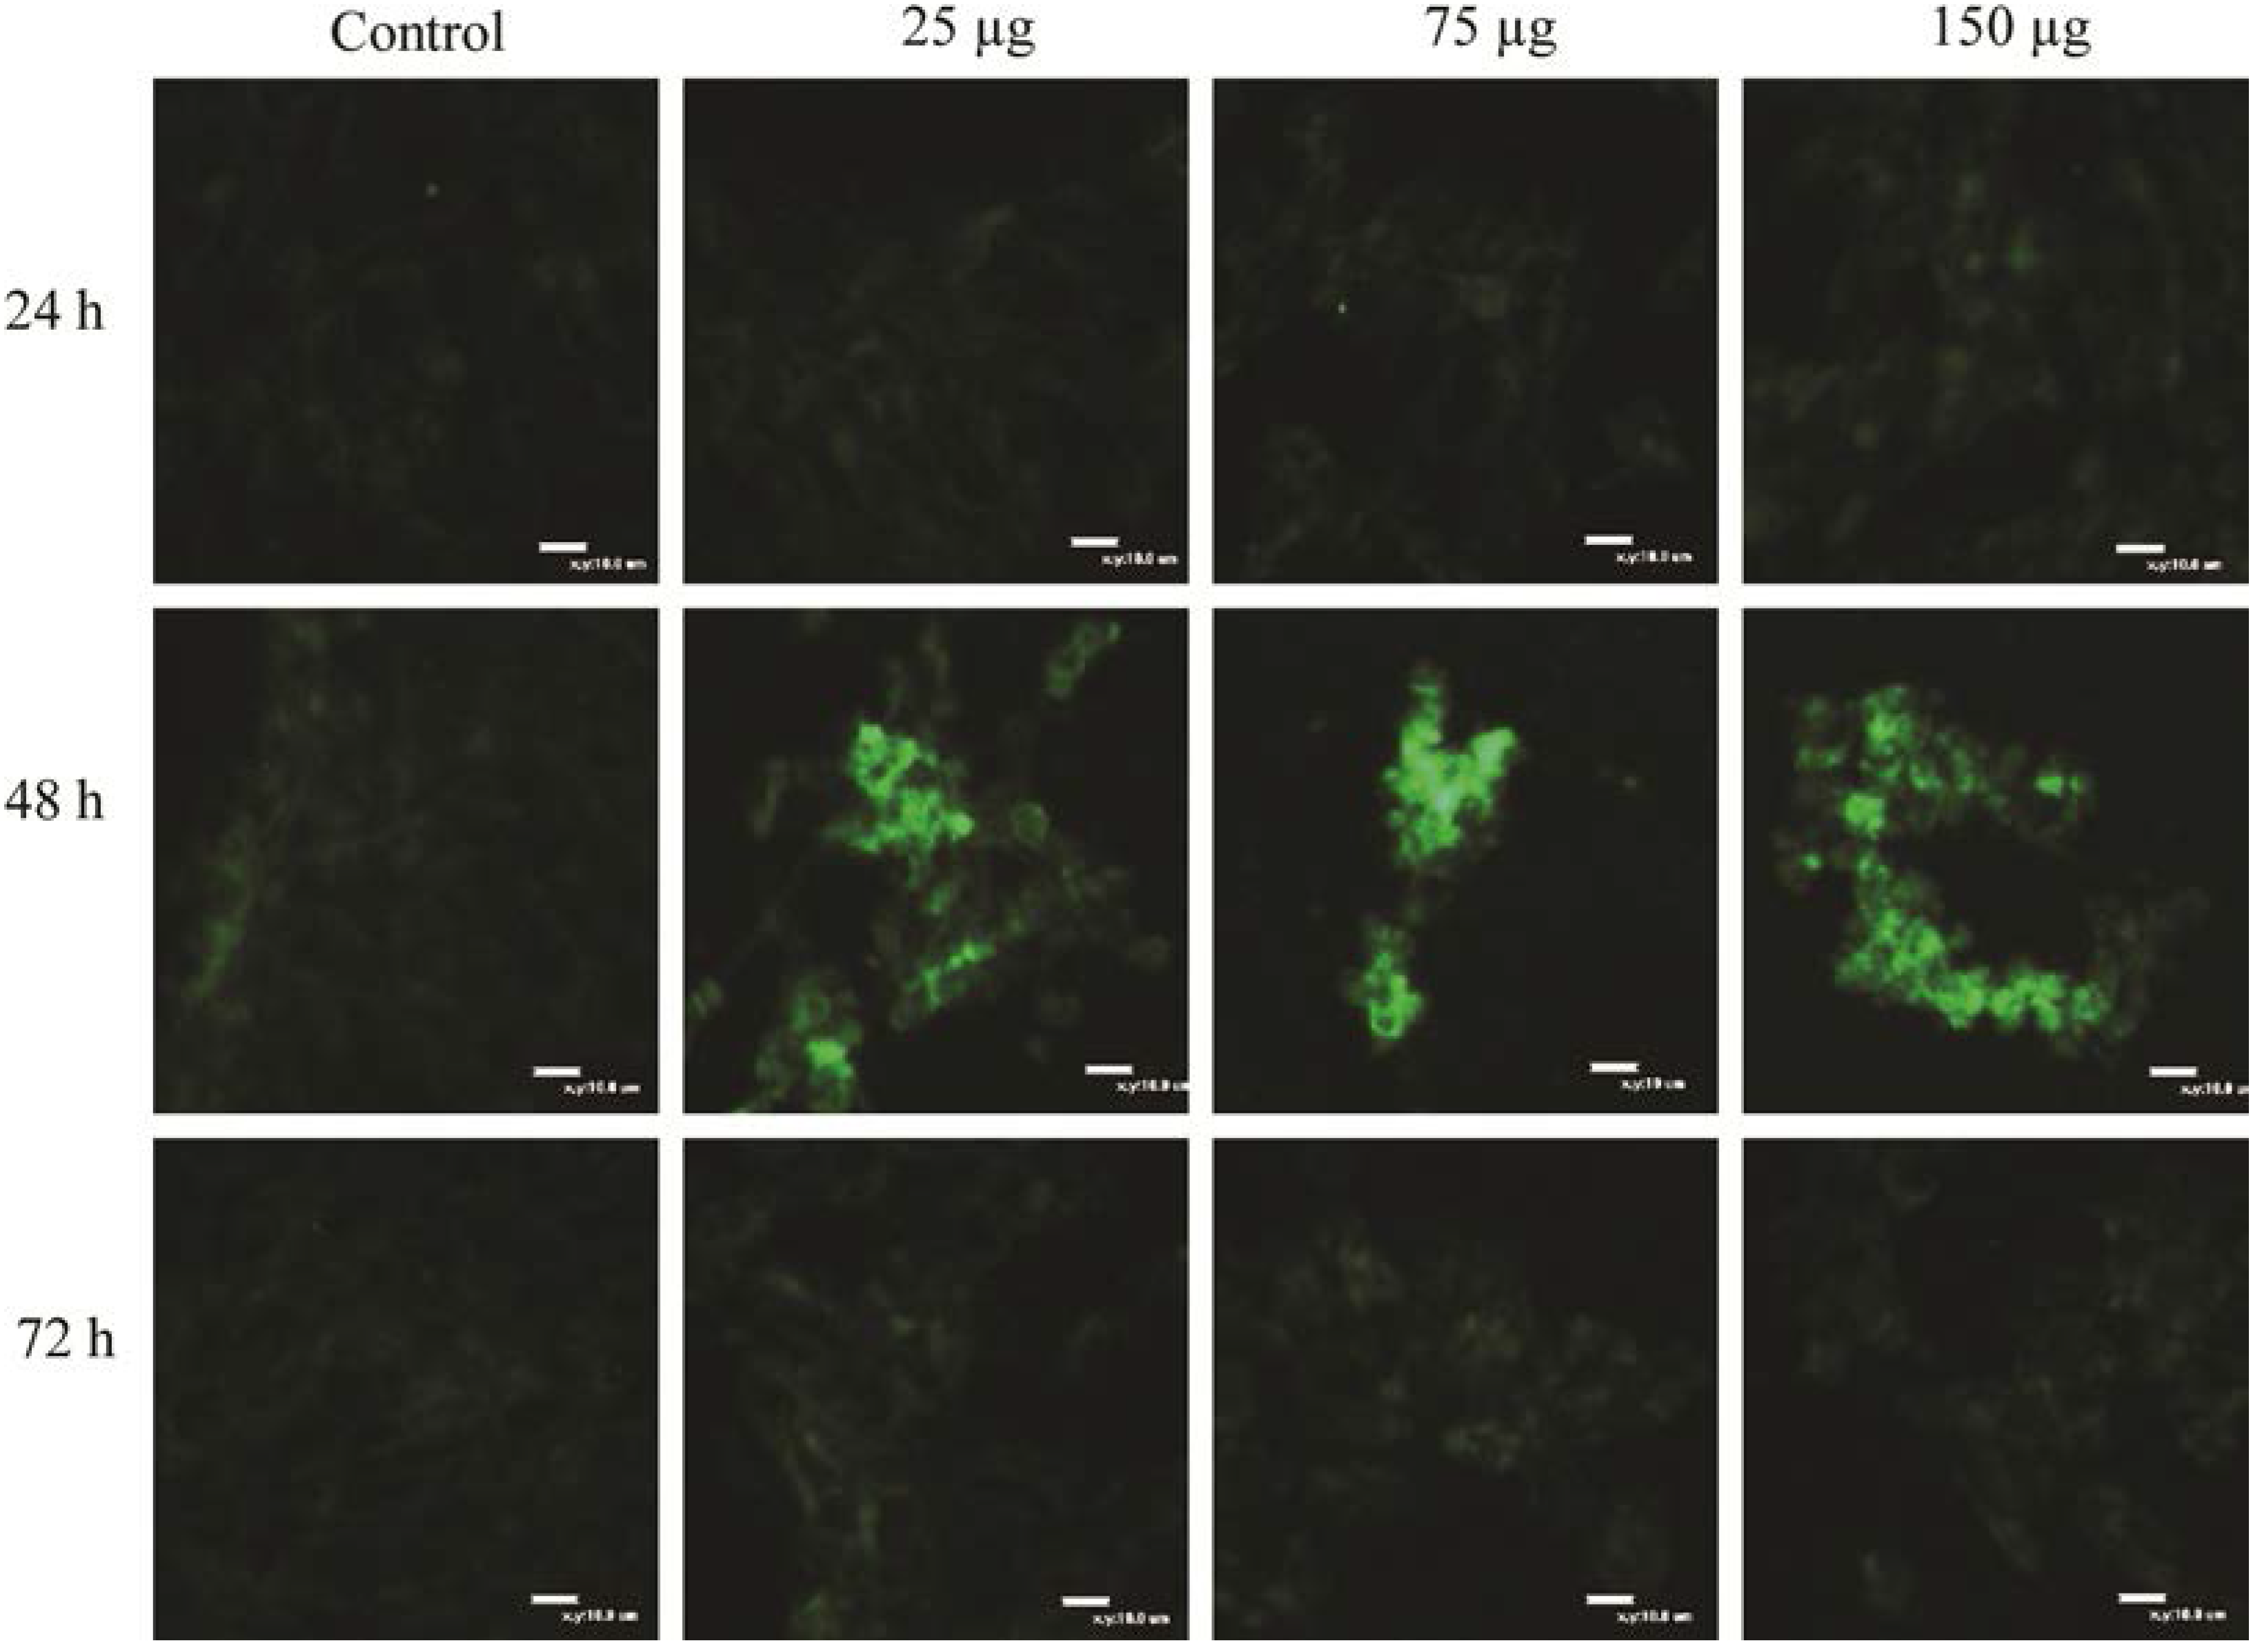
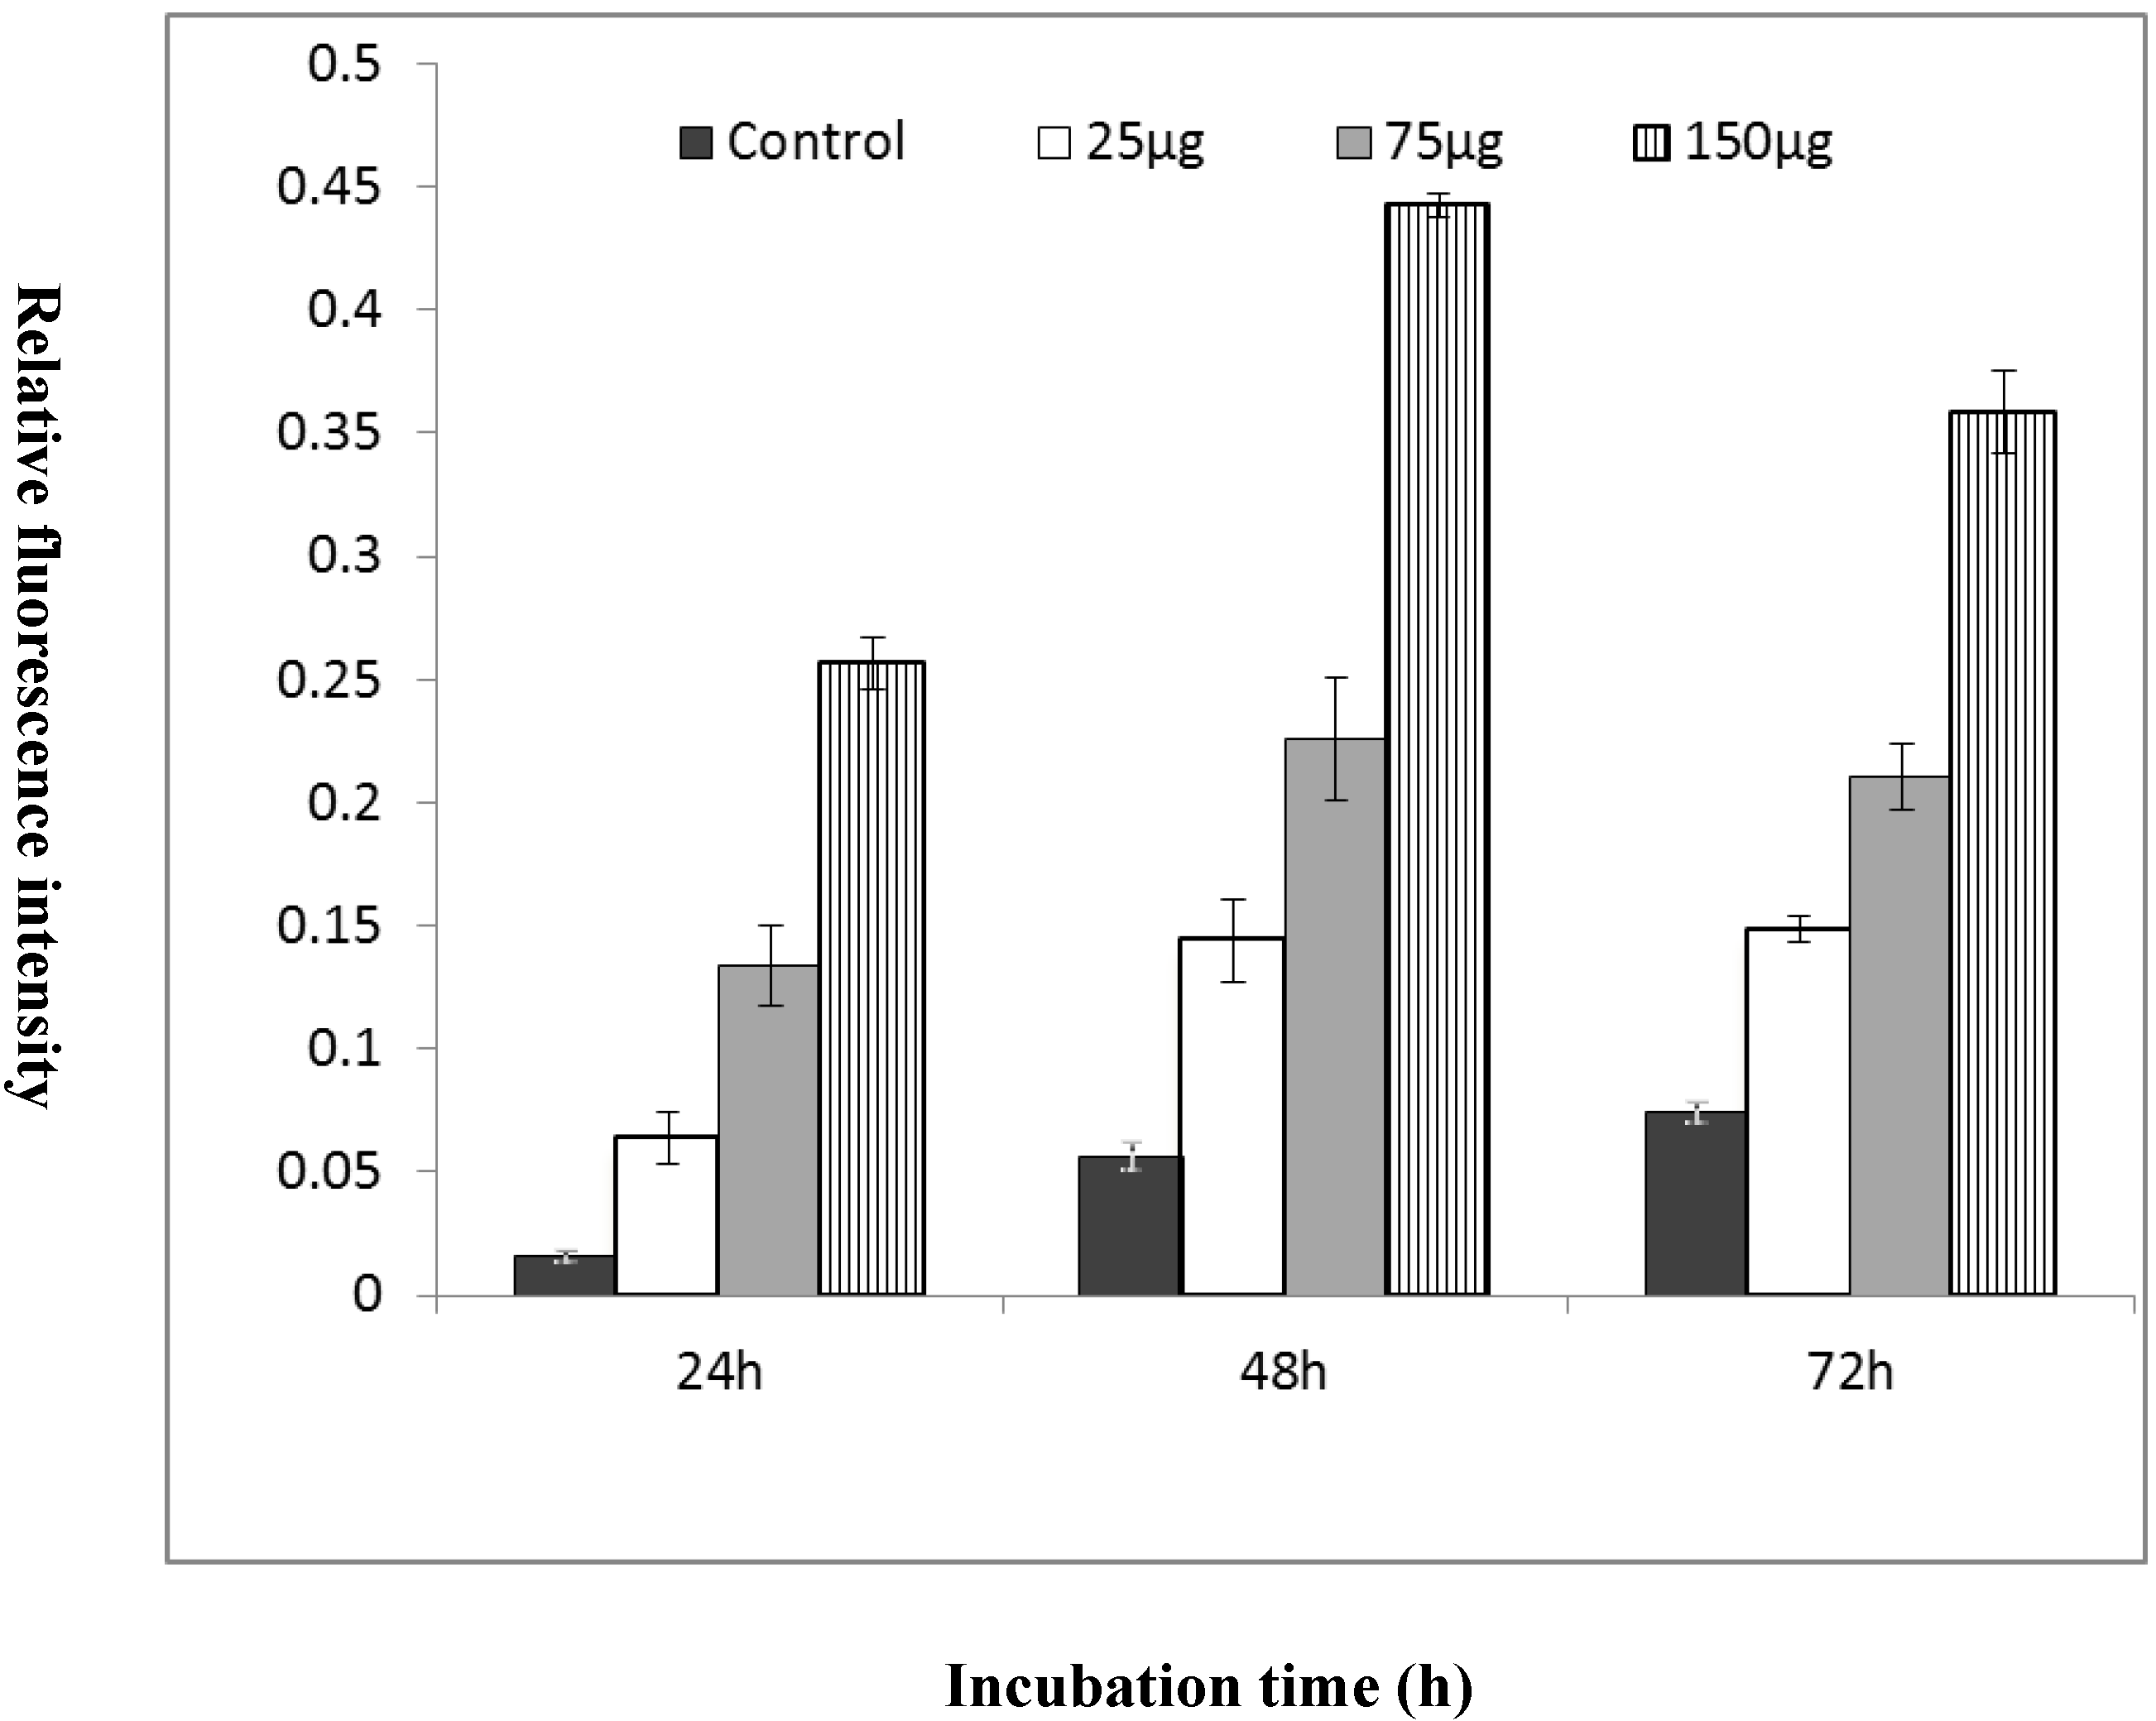
2.4. GST Expression in a Living Cell Based on Molecular Beacon Technology

The GST MB probes were delivered into the cytoplasm of cells in a specific growth medium using a reversible permeabilization method with the activation of SLO [22]. Probe hybridization was initiated when the probe was bound with the specific target mRNA for the expression of GST genes. The signals were detected with 488 nm excitation and 530 nm emissions under a laser scanning confocal microscope and a fluorometry. While the fluorescence signals were found to be weak in control cells at all three incubation times, the fluorescence signals were intensified at 24 h incubation, and then decreased at 48 h in T98G cells (Figure 4). Increased concentration of MgO (25, 75 and 150 µg/mL) generated higher fluorescence intensities. The cells displayed green fluorescence signals exterior to the nucleus in the cytoplasm region. This showed that the cells cannot be consistent with the results of quantitative real-time PCR analysis.
Figure 4. Confocal microscopic images of the expression of GST genes in HepG2 treated with MgO nanoparticles. Molecular beacons targeting the GST gene were delivered into live cells by a reverse permeabilization method using an activated SLO. The fluorescent live cell images at 24 h (top panel), 48 h (middle panel) and 72 h (bottom panel) were presented with excitation at 488 nm and emission detection at 530 nm. The intensity of the fluorescent signals was maximized at 48 h incubation time in proportion to MgO concentrations (scale bar size: 10 µm). The intensity of the fluorescent signals was found to be weak due to the low expression of target genes.
Ijms 16 07551 g004
Fluorometric analysis measures relative fluorescence intensities depending on the incubation time and concentrations of treated MgO nanoparticles (Figure 5). With an increase in MgO concentration from 25 to 150 µg/mL, the fluorescence signals were intensified, and treated cells at 48 h showed higher-intensity expression of fluorescence signals in comparison with 24 and 72 h incubation. At 150 µg/mL MgO concentration, HepG2 cells recorded the strongest fluorescence signal (RFI = 0.44) compared with 24 h (RFI = 0.26) and 72 h (RFI = 0.36) treatments.
Figure 5. Analysis of gene expression of GST genes of each cell line by fluorometric determination. Fluorometric results showed that the gene expression of the cell line (HepG2), which depends on the MgO concentration and incubation times. Molecular beacons targeting the GST gene were delivered into live cells by a reverse permeabilization method using an activated SLO. The GST gene was expressed maximum at 48 h incubation time with proportion to MgO concentrations.
Ijms 16 07551 g005

3. Discussion

Monodispersed MgO nanoparticles synthesized in this study were water-dispersible and biocompatible due to PEG-phospholipid surface modifications. In the case of metal oxide nanoparticles such as iron oxide and manganese oxide, the surface is stable and relatively unreactive compared to other nanoparticles [5,6,7]. Therefore, the strategies are very limited in terms synthesis of water-dispersible metaloxide nanoparticles for biomedical applications [22,23]. Surface modification by PEG-phospholipids utilizes hydrophobic interactions between the surfactants to stabilize the nanoparticles and phospholipids. This does not depend on the core material of nanoparticles, and can therefore be used for any type of inorganic nanoparticle. The high water solubility and biocompatibility of the engineered MgO nanoparticles promotes intracellular uptake and accumulation for imaging cellular distribution and functions. These engineered metal oxide nanoparticles were shown to overcome the drawbacks of currently used MRI contrast agents and can be used as a promising biolabel in molecular and cellular imaging studies [5,7,22]. A nanotoxicological evaluation of the engineered MgO nanoparticles should be performed to ensure biological safety prior to commercialization as MRI contrast agent. Presently, many reports on in vitro cytotoxicity studies of nanoparticles are being published, but the wide range of different cell lines, nanoparticle concentrations, exposure times, and colorimetric assays makes it difficult to compare and determine whether the cytotoxicity observed is physiologically relevant. In this study, we screened the cytotoxicity by quantifying the expression of oxidative stress genes (GST and catalase) at the mRNA level using RT-PCR. In this investigation, we have used human cancer cell lines. Cancer cell treatment with nanoparticles may involve unusual physiology in their metabolic process, which induces rapid cell growth and division. This might inhibit normal cell function through increased ROS expression, which ultimately leads to apoptosis.
The quantitative analysis of the GST and catalase genes using RT-PCR has clearly showed that an increase in concentration of MgO was directly proportional to the expression of the oxidative stress genes in all the three cell lines. The cytotoxicity of the cancer cells was maximized at 48 h incubation as compared to 24 and 72 h. One of the possible reasons for this phenomenon is that the accumulation of ROS does not trigger cellular responses at 24 h, but continuous exposure for 48 h increases oxidative stress levels to maximize ROS gene expression. According to the hierarchical oxidative stress hypothesis, at the first tier of oxidative stress, antioxidant response elements are activated, resulting in the expression of phase 2 and antioxidant enzymes such as hemeoxygenase 1 (HO-1), NAD(P)H:quinone oxidoreductase 1 (NQO1), GST, catalase, etc. by the transcription factor, Nrf2 [24,25,26]. Then the activity of these enzymes including GST and catalase were augmented to offset the generated ROS in 72 h [26], leading to a decrease in related gene expression levels. Moreover, with a prolonged incubation time of 72 h, cell division was initiated, which reduces the concentration of nanoparticles in the cytoplasm through endocytosis [27]. Thus, a relatively low concentration of nanoparticles has less cytotoxic effect on the newly born-cells, resulting in the reduced quantity of ROS genes at 72 h.
The ROS genes in this study demonstrated that the catalase was found quantitatively with a higher copy number of cDNA than GST. This result suggests that the catalase gene is more regulated by Nrf2 than GST for expressing different levels of antioxidant enzymes under MgO treatment [26,28]. HepG2 cell samples showed the maximum copy number of cDNA in both GST and catalases. This indicates that the quantitation of gene expressions in cell lines play a significant part in assessing the nanotoxic responses in a given time. However, knowledge of the molecular mechanisms that regulate related gene expression depending on cell types is limited.
The maximum gene expression level (8.40 × 10³ for GST and 5.26 × 10⁵ for catalase) of HepG2 cells at 48 h with 150 µg/mL MgO treatment were 9-fold higher in GST and catalase than the control. At 72 h of incubation, the gene expression level (5.90 × 10³ for GST and 3.25 × 10⁵ for catalase) was less than twice that of the control. Thus, as the MgO concentration increased to 25, 75, and 150 µg/mL, the gene expression increments were less than two-fold. These results indicate that the PEG-phospholipid coated MgO nanoparticles are stable, biocompatible and less toxic in terms of inducing reactive oxygen species, when considering the nanoparticle concentration and incubation times.
Of all candidate technologies for in vivo endogenous mRNA detection, the most promising one is MB technology [29]. We designed the stem and loop sequence to target the GST gene in living cells. To deliver the MB into the cell lines, we used a SLO method, which is rapid, efficient, less damaging and more versatile than the conventional transfection methods. The SLO creates minute pores in the cell membrane through which the MB are delivered into the cells. Once MB targeted its GST mRNA in the cytoplasm, the green fluorescence signal was emitted with 488 nm excitation (Figure 4). In the present experiments, confocal images clearly showed the green fluorescence has a different signal intensity with different concentrations of MgO nanoparticle treatments with incubation time. In the same manner as the RT-PCR, the fluorescence intensities are stronger at 48 h in all the cell lines, and increased with the MgO concentration. As in the established research [16,30] indicating the subcellular localization of metal oxide nanoparticles in BEAS-2B cells induced oxidative stress, it seems that the MgO nanoparticles penetrated the cytoplasm and localized in the peri-regions of the nucleus, which may induce direct interaction between the nanoparticles and cellular molecules to cause adverse toxic cellular responses. We quantified those fluorescence intensities using fluorometric analysis in Figure 5. The GST gene expression trend by MB technology is identical to the RT-PCR data in the three cell lines in terms of the MgO concentration and incubation times, although the intensity ratio based on the control is somewhat different from the values calculated on the basis of cDNA copy number.

4. Experimental Section

4.1. MgO Nanoparticle Preparation and Cell Culture

Water-dispersible and biocompatible MgO nanoparticles were synthesized (SkySpring Nanomaterials, Inc., Houston, TX, USA) [5,31,32]. Nanoparticles were dispersed in chloroform and then encapsulated by PEG-phospholipids shell to endow them with biocompatibility. Two mL of the organic dispersible oxide nanoparticles in CHCl3 (5 mg/mL) were mixed with 1 mL of CHCl3 containing 10 mg of 1,2-distearoyl-sn-glycero-3-phosphoethanolamine-N-[methoxy(polyethylene glycol)-2000]. After evaporating the solvent, it was incubated at 75 °C in vacuum for 50 min. An addition of 4 mL water resulted in a clear and dark-brown suspension. After filtration and centrifugation, the resulting nanoparticles were then well dispersed in phosphate buffered saline (PBS, pH 7.2). The cell lines were derived from the human hepatocellular carcinoma—HepG2 cells (ATCC HB-8065). The cell lines between 15 and 25 of the subculture passages were used as adherent cells. Cell lines were treated with 25, 75 and 150 µg/mL concentrations of MgO nanoparticles in serum-free culture medium and incubated for a period of 24, 48 and 72 h. The cell lines were grown and maintained in Dulbecco’s Modified Eagle’s Medium (DMEM) was supplemented with 10% fetal bovine serum (FBS) and 1% penicillin (10,000 IU/mL)—streptomycin (10,000 µg/mL). Cells were washed with PBS and incubated in a 3 mL trypsin-ethylenediaminetetraacetic acid (EDTA, 0.2%) for 3–5 min at 37 °C in a CO2 incubator. Cell suspensions were then centrifuged for 3 min at 1300 rpm. Then the pellet was re-suspended with a fresh medium and the seed density was adjusted using a hemocytometer based cell counting by an inverted microscope. For the RT-PCR quantitation of ROS, cells were cultured in a 24 micro-well plate (1 × 10⁵ cells/mL).

4.2. TaqMan RT-PCR Analysis

The MgO nanoparticle treated cells were used for the isolation of total RNA using a Qiagen RNeasy mini kit. The isolated total RNAs were collected in 20 µL RNase free water and quantified by nanodrop spectrophotometer. We conducted a RT-PCR using a two-step reaction which consisted of complementary DNA (cDNA) synthesis by reverse transcription reaction and then RT-PCR analysis for quantitative gene expression. The cDNA was synthesized by adding 1 µg total RNA to the reverse transcriptase premix tube (AccuPower™ Cyclescript RT premix dT20, Bioneer, Daejeon, Korea) with a reaction volume made up to 20 µL with RNase free water. The tubes were placed in a thermocycler and incubated at 45 °C for 50 min for cDNA synthesis and followed by 90 °C for 5 min for a reverse transcriptase inactivation. Synthesized cDNA was used as a template in the real time analysis. The synthesized primers and TaqMan probes for GST (forward primer: 5'-GATACTGGGGTACTGGGACATCC-3'; reverse primer: 5'-CCACTGGCTTCTGTCATAATCAGG-3', Tm 58 °C, product size: 130 bp, gene bank number: NM_146421.2; TagMan probe sequence: 5'-CCCACGCCATCCGCCTGCTCCT-3', Tm 68.9 °C ) and catalase (forward primer: 5'-ACAGCAAACCGCACGCTATG-3' with Tm 58.6 °C; reverse primer: 5'-CAGTGGTCAGGACATCAGCTTTC-3' with Tm 57.3 °C, product size: 150 bp, gene bank number: NM_001752; TagMan probe sequence: 5'-CCCGCTGCTCCTTCCAGTGCTGC-3', Tm 69.8 °C ) genes were used in RT-PCR. The TaqMan probes were conjugated with the fluorophore, 5-carboxyfluorescein (FAM) at 5' end and black hole quencher (BHQ1) at 3' end. The 20 µL reaction mixture consisted of 1 µL of cDNA template, 0.25 µL of TaqMan probe (20 µM), 0.5 µL of forward and reverse primers (10 µM), 10 µL of Mastermix (Dynamo™ probe qPCR kit, Finnzymes, Finland) and 7.75 µL of RNase free water. RT-PCR was performed in a qPCR thermocycler (Bio-RAD, Hercules, CA, USA, CFX96TM real-time system) with initiation at 90 °C for 15 min followed by 40 cycles of amplification at 90 °C for 15 s (denature) and 50 °C for 50 s (anneal and elongation). Samples were analyzed with the wavelength of excitation/emission at 488/530 nm with respect to the FAM fluorophore, and the relationship of the amplified cDNA copy number versus its cycle threshold (Ct) values was plotted in the graph.

4.3. Standard Calibration Curve of RT-PCR

Standard calibration curves for real time analysis were obtained using the total RNA isolated from HepG2 cells. HepG2 cell lines were treated with 1 mM concentration of hydrogen peroxide and incubated for 7 h. Then the isolation of total RNA and reverse transcription reaction were conducted as described above. Special primers for GST (forward primer: 5'-GCACCATGCCCATGATACTG-3' and reverse primer: 5'-ATGCTGCTCCTTCATGCAAC-3') and catalase (forward primer: 5'-GAGGCCTCCTGCAGTGTTCT-3' and reverse primer: 5'-CATTAAGCCATGACGGTGCT-3') were used to obtain a large product (923 bp for GST and 2115 bp for catalase) which is close to the entire gene size (1155 bp for GST and 2300 bp for catalase) in order to mimic real GST and catalase genes. These 923 and 2115 bp product bands were eluted from a gel and quantified using a nanodrop spectrophotometer to determine the exact copy number of the template. Templates were serially diluted from 109 to 104 and used for the RT-PCR reactions to obtain the calibration curve.

4.4. Quantitative Analysis on an Agarose Gel

The expression level of GST and catalase genes on an agarose gel was confirmed by PCR. PCR was performed in a 20 µL reaction volume, consisting of 2 µL of templates (cDNA from MCF7 cell line), 1 µL of forward and reverse primer (10 µM), 0.3 µL of enzymes (i-StarMAX™ II DNA polymerase (5 U/mL), Intron Biotech., Sungnam, Korea), 2 µL of dNTP (2.5 mM each), 2 µL of 10× reaction buffer (300 mM Tris-HCl, 300 mM salts consisting of K+, NH4+ and 20 mM Mg2+), and 11.7 µL of RNase water. PCR was then carried out in a thermocycler at 90 °C for 2 min, followed by 30 cycles of amplification at 95 °C for 60 s, 55 °C for 30 s and 70 °C for 5 min. The amplified products were then separated in a 1.5% agarose gel electrophoresis with 1× TBE buffer (87 mM Tris base, 90 mM boric acid, and 2 µM EDTA) at 100 V for 60 min. The gel was stained with ethidium bromide (EtBr) and illuminated under UV for detecting the expressed gene bands. A 200 bp housekeeping gene, glyceraldehyde 3-phosphate dehydrogenase (GAPDH) (forward primer: 5'-GCCATCAATGACCCCTTCAT-3' and reverse primer: 5'-GCTCCTGGAAGATGGTGATG-3') were used as a reference control.

4.5. Cellular Genotoxicity Test Using MB Technology

The MBs for GST gene expression were designed as 5'-CGCGATCACGAAGGATAGTGGGTAGCTGAGGCGATCGCG-3' with 25 bp loop (italic) and 7 bp stem sequence. A FAM fluorophore and a quencher BHQ1 were labeled at 5' and 3' end, respectively (Bioneer, Korea). Cell lines were cultured in a 96 micro-well plate at a concentration of 5 × 10⁴ cells/mL. After 24 h of incubation, the cells were treated with various concentrations of MgO nanoparticles and different incubation times as described earlier. MBs were delivered into the live cells with a reverse permeabilization method by activated Streptolysin O (SLO) [33]. First the SLO was activated by adding 5 mM of tris(2-carboxyethyl)phosphine (TCEP) to 2 U/mL of SLO for 30 min at 37 °C. Then, the cells were incubated for 10 min in 200 µL of serum free medium containing 0.2 U/mL of activated SLO and 3 µL of MB (1 µM) for cell permeabilization and MB delivery. After incubating with MB, the cells were resealed by adding 0.5 mL of the typical growth medium and incubated for 1 h at 37 °C before performing confocal microscopic and fluorometric analysis. The green fluorescence imaging of live cells was performed by a laser scanning confocal microscope (Nikon ECLIPSE C1si, Melville, NY, USA). The culture plates were read under a microplate spectrofluorometer (Spectra Max M2, Molecular Devices, Silicon Valley, CA, USA). The fluorescence signal of the MBs which were hybridized with a GST target gene was analyzed with excitation at 488 nm and emission detection at 530 nm.

5. Conclusions

In conclusion, we have evaluated the cytotoxicity of the PEG-phospholipid coated MgO nanoparticles on human cancer cell lines (HepG2) with different concentrations and incubation times. Targeting the two oxidative stress genes (GST and catalase), we performed a quantitative analysis of gene expression at the mRNA level by using the RT-PCR and at the cellular level by using the MB technology. These results are consistent at 48 h incubation, revealing a maximum gene expression proportional to MgO concentration, whereas at 72 h, the gene expression is reduced twice the amount in the control. In addition, the increment ratio of the expressed GST and catalase gene number compared with the control was not significant, demonstrating high stability, biocompatibility, and low toxicity, suggesting that engineered MgO nanoparticles as an excellent contrast agent for magnetic resonance imaging in the field of biomedicine. For further cytotoxicity study, various primary cells and in vivo tests also should be performed to explore the linear relationship between gene expression and protein level in cells.

Acknowledgments

This research was supported by the Korea Ministry of Environment as “Eco-Innovation Project (405-112-038)”. This work was also carried out with the support of the “Cooperative Research Program for Agriculture Science & Technology Development (Project title: Isolation and identification of Rhizobacteria for indoor VOCs removal, Project No. 010205022014)”, Rural Development Administration, Republic of Korea.

Author Contributions

These authors contributed equally to the present work.

Conflicts of Interest

The authors declare no conflict of interest.

References

  1. El-Ansary, A.; Al-Daihan, S. On the toxicity of therapeutically used nanoparticles. J. Toxicol. 2009. [Google Scholar] [CrossRef]
  2. Martirosyan, A.; Schneider, Y. Engineered nanomaterials in food: Implications for food fafety and consumer health. Int. J. Environ. Res. Public Health 2014, 11, 5720–5750. [Google Scholar] [CrossRef] [PubMed]
  3. Seaton, A.; Donaldson, K. Nanoscience, nanotoxicology, and the need to think small. Lancet 2005, 365, 923–924. [Google Scholar] [CrossRef] [PubMed]
  4. Peters, K.; Unger, R.E.; Kirkpatrick, C.J.; Gatti, A.M.; Monari, E. Effects of nano-scaled particles on endothelial cell function in vitro: Studies on viability, proliferation and inflammation. J. Mater. Sci. Mater. Med. 2004, 15, 321–325. [Google Scholar] [CrossRef] [PubMed]
  5. Na, H.B.; Lee, L.H.; An, K.; Park, Y.I.; Park, M.; Lee, I.S.; Nam, D.H.; Kim, S.T.; Kim, S.H.; Kim, S.W.; et al. Development of a T1 contrast agent for magnetic resonance imaging using MnO nanoparticles. Angew. Chem. Int. Ed. 2007, 119, 5493–5497. [Google Scholar]
  6. Srivastava, S.; Awasthi, R.; Gajbhiye, N.S.; Agarwal, V.; Singh, A.; Yadav, A.; Gupta, R.K. Innovative synthesis of citrate-coated superparamagnetic Fe3O4 nanoparticles and its preliminary applications. J. Colloid Interface Sci. 2011, 359, 104–111. [Google Scholar] [CrossRef] [PubMed]
  7. Krishnamoorthy, K.; Moon, J.Y.; Hyun, H.B.; Cho, S.K.; Kim, S.J. Mechanistic investigation on the toxicity of MgO nanoparticles towards cancer cells. J. Mater. Chem. 2012, 22, 24610–24617. [Google Scholar] [CrossRef]
  8. Yang, X.C.; Shang, Y.L.; Li, Y.H.; Zhai, L.J.; Foster, N.R.; Li, Y.X.; Zou, D.; Pu, Y. Synthesis of monodisperse Iron oxide nanoparticles without surfactants. J. Nanomater. 2014. [Google Scholar] [CrossRef]
  9. Chiu, S.K.; Manhat, B.A.; DeBenedetti, W.J.I.; Brown, A.N.; Fichter, K.; Vu, T.; Eastman, M.; Jiao, J.; Goforth, A.M. Aqueous red-emitting silicon nanoparticles for cellular imaging: Consequences of protecting against surface passivation by hydroxide and water for stable red emission. J. Mater. Res. 2013, 28, 216–230. [Google Scholar] [CrossRef]
  10. Malvindi, M.A.; de Matteis, V.; Galeone, A.; Brunetti, V.; Anyfantis, G.C.; Athanassiou, A.; Cingolani, R.; Pompa, P.P. Toxicity assessment of Silica coated Iron oxide nanoparticles and biocompatibility improvement by surface engineering. PLoS ONE 2014, 9, e85835. [Google Scholar] [CrossRef] [PubMed]
  11. Manke, A.; Wang, L.; Rojanasakul, Y. Mechanisms of nanoparticle-induced oxidative stress and toxicity. BioMed Res. Int. 2013. [Google Scholar] [CrossRef]
  12. Huang, Y.W.; Wu, C.H.; Aronstam, R.S. Toxicity of transition metal oxide nanoparticles: Recent insights from in vitro studies. Materials 2010, 3, 4842–4859. [Google Scholar] [CrossRef]
  13. Zhang, H.; Ji, Z.; Xia, T.; Meng, H.; Low-Kam, C.; Liu, R.; Pokhrel, S.; Lin, S.; Wang, X.; Liao, Y.P.; et al. Use of metal oxide nanoparticle band gap to develop a predictive paradigm for oxidative stress and acute pulmonary inflammation. ACS Nano 2012, 6, 4349–4368. [Google Scholar]
  14. Park, E.J.; Choi, J.; Park, Y.K.; Park, K. Oxidative stress induced by cerium oxide nanoparticles in cultured BEAS-2B cells. Toxicology 2008, 245, 90–100. [Google Scholar] [CrossRef] [PubMed]
  15. Stone, V.; Shaw, J.; Brown, D.M.; Macnee, W.; Faux, S.P.; Donaldson, K. The role of oxidative stress in the prolonged inhibitory effect of ultrafine carbon black on epithelial cell function. Toxicol. In Vitro 1998, 12, 649–659. [Google Scholar] [CrossRef] [PubMed]
  16. Wilson, M.R.; Lightbody, J.H.; Donaldson, K.; Sales, J.; Stones, V. Interactions between ultrafine particles and transition metals in vivo and in vitro. Toxicol. Appl. Pharmacol. 2002, 184, 172–179. [Google Scholar] [CrossRef] [PubMed]
  17. Sahu, D.; Kannan, G.M.; Vijayaraghavan, R.; Anand, T.; Khanum, F. Nanosized Zinc oxide induces toxicity in human lung cells. ISRN Toxicol. 2013. [Google Scholar] [CrossRef]
  18. Vandebriel, R.J.; Jong, W.H.D. A review of mammalian toxicity of ZnO nanoparticles. Nanotechnol. Sci. Appl. 2012, 5, 61–71. [Google Scholar] [CrossRef] [PubMed]
  19. Vidic, J.; Stankic, S.; Haque, F.; Ciric, D.; Goffic, R.L.; Vidy, A.; Jupille, J.; Delmas, B. Selective antibacterial effects of mixed ZnMgO nanoparticles. J. Nanopart. Res. 2013, 15, 1595–1604. [Google Scholar] [CrossRef] [PubMed]
  20. Lai, J.C.K.; Lai, M.B.; Jandhyam, S.; Dukhande, V.V.; Bhushan, A.; Daniels, C.K.; Leung, S.W. Exposure to titanium dioxide and other metallic oxide nanoparticles induces cytotoxicity on human neural cells and fibroblasts. Int. J. Nanomed. 2008, 3, 533–545. [Google Scholar]
  21. Leung, Y.H.; Ng, A.M.C.; Xu, X.; Shen, Z.; Gethings, L.A.; Wong, M.T.; Chan, C.M.; Guo, M.Y.; Ng, Y.H.; Djurisic, A.B.; et al. Mechanisms of antibacterial activity of MgO: Non-ROS mediated toxicity of MgO nanoparticles towards Escherichia coli. Small 2014, 10, 1171–1183. [Google Scholar]
  22. Lee, Y.C.; Chen, D.Y.; Dodd, S.J.; Bouraoud, N.; Koretsky, A.P.; Krishnan, K.M. The use of silica coated MnO nanoparticles to control MRI relaxivity in response to specific physiological changes. Biomaterials 2012, 33, 3560–3567. [Google Scholar] [CrossRef] [PubMed]
  23. Na, H.B.; Song, I.C.; Hyeon, T. Inorganic nanoparticles for MRI contrast agents. Adv. Mater. 2009, 21, 2133–2148. [Google Scholar] [CrossRef]
  24. Talalay, P.; Dinkova–Kostova, A.T.; Holtzclaw, W.D. Importance of phase 2 gene regulation in protection against electrophile and reactive oxygen toxicity and carcinogenesis. Adv. Enzym. Regul. 2003, 43, 121–134. [Google Scholar] [CrossRef]
  25. Xia, T.; Kovochich, M.; Brant, J.; Hotze, M.; Sempf, J.; Oberley, T.; Sioutas, C.; Yeh, J.I.; Wiesner, M.R.; Nel, A.E. Comparison of the abilities of ambient and manufactured nanoparticles to induce cellular toxicity according to an oxidative stress paradigm. Nano Lett. 2006, 6, 1794–1807. [Google Scholar] [CrossRef] [PubMed]
  26. Li, N.; Alam, J.; Venkatesan, M.I.; Eiguren-Fernandez, A.; Schmitz, D.; di Stefano, E.; Slaughter, N.; Killeen, E.; Wang, X.; Huang, A.; et al. Nrf2 is a key transcription factor that regulates antioxidant defense in macrophages and epithelial cells: Protection against the proinflammatory and oxidizing effects of diesel exhaust chemicals. J. Immunol. 2004, 173, 3467–3481. [Google Scholar]
  27. Hu, F.; Neoh, K.G.; Cen, L.; Kang, E.T. Cellular responses to magnetic nanoparticles “PEGylated” via surface-initiated atom transfer radical polymerization. Biomacromolecules 2006, 7, 809–816. [Google Scholar] [CrossRef] [PubMed]
  28. Chan, K.; Kan, Y.W. Nrf2 is essential for protection against acute pulmonary injury in mice. Proc. Natl. Acad. Sci. USA 1999, 96, 12731–12736. [Google Scholar] [CrossRef] [PubMed]
  29. Kloc, M.; Zearfoss, N.R.; Etkin, L.D. Mechanisms of subcellular mRNA localization. Cell 2002, 108, 533–544. [Google Scholar] [CrossRef] [PubMed]
  30. Brown, D.M.; Donaldson, K.; Borm, P.J.; Schins, R.P.; Dehnhardt, M.; Gilmour, P.; Jimenez, L.A.; Stone, V. Calcium and ROS-mediated activation of transcription factors and TNF-α Cytokine gene expression in macrophages exposed to ultrafine particles. Am. J. Physiol. 2004, 286, 344–353. [Google Scholar]
  31. Dubertret, B.; Skourides, P.; Norris, D.J.; Noireaux, V.; Brivanlou, A.H.; Libchaber, A. In vivo imaging of quantum dots encapsulated in phospholipid micelles. Science 2002, 298, 1759–1762. [Google Scholar] [CrossRef] [PubMed]
  32. Park, J.; An, K.; Hwang, Y.; Park, J.G.; Noh, H.J.; Kim, J.Y.; Park, J.H.; Hwang, N.M.; Hyeon, T. Ultra-large-scale synthesis of monodisperse nanocrystals. Nat. Mater. 2004, 3, 891–895. [Google Scholar] [CrossRef] [PubMed]
  33. Santangelo, P.J.; Nix, B.; Tsourkas, A; Bao, G. Dual FRET molecular beacons for mRNA detection in live cells. Nucleic Acids Res. 2004, 32, e57. [Google Scholar]

