Article

Overexpressing Ferredoxins in Chlamydomonas reinhardtii Increase Starch and Oil Yields and Enhance Electric Power Production in a Photo Microbial Fuel Cell

Graduate School of Biotechnology and Bioengineering, Yuan Ze University, Taoyuan 320, Taiwan
*
Author to whom correspondence should be addressed.
Int. J. Mol. Sci. 2015, 16(8), 19308-19325; https://doi.org/10.3390/ijms160819308
Submission received: 21 June 2015 / Revised: 22 July 2015 / Accepted: 4 August 2015 / Published: 14 August 2015
(This article belongs to the Special Issue Plant Molecular Biology)

Abstract

:
Ferredoxins (FDX) are final electron carrier proteins in the plant photosynthetic pathway, and function as major electron donors in diverse redox-driven metabolic pathways. We previously showed that overexpression of a major constitutively expressed ferredoxin gene PETF in Chlamydomonas decreased the reactive oxygen species (ROS) level and enhanced tolerance to heat stress. In addition to PETF, an endogenous anaerobic induced FDX5 was overexpressed in transgenic Chlamydomonas lines here to address the possible functions of FDX5. All the independent FDX transgenic lines showed decreased cellular ROS levels and enhanced tolerance to heat and salt stresses. The transgenic Chlamydomonas lines accumulated more starch than the wild-type line and this effect increased almost three-fold in conditions of nitrogen depletion. Furthermore, the lipid content was higher in the transgenic lines than in the wild-type line, both with and without nitrogen depletion. Two FDX-overexpressing Chlamydomonas lines were assessed in a photo microbial fuel cell (PMFC); power density production by the transgenic lines was higher than that of the wild-type cells. These findings suggest that overexpression of either PETF or FDX5 can confer tolerance against heat and salt stresses, increase starch and oil production, and raise electric power density in a PMFC.

1. Introduction

Photosynthetic microalgae are autotrophic cells that have rapid growth capacity; as such they are key resources in biorefineries [1]. However, the cultivation of microalgae during biomass production is sensitive to environmental factors [2,3]. To increase the biomass production of microalgae, the screening of naturally available isolates for rapid growth rates, high lipid contents, and broad environmental tolerance are all highly desirable [4]. Genetic engineering is also commonly performed to develop microalgal strains possessing these genetic traits [1,5,6].
The unicellular green alga Chlamydomonas reinhardtii has been used as a model organism for studying photosynthesis, starch metabolism and oil synthesis [7,8,9]. In addition, C. reinhardtii offers the potential to generate bioelectricity in a photo microbial fuel cell (PMFC), a device that is able to produce electrical energy using photo microorganisms under light [10]. Electrons produced by the microorganisms are transferred to the anode and flow to the cathode compartment via an external circuit [11]. The level of reduction of the photo microorganisms can be genetically engineered to improve their performance in PMFCs.
Ferredoxins (FDXs) are widely distributed iron-sulfur containing proteins and (2Fe-2S) cluster ferredoxins usually harbor the conserved amino acid motif CX4CX2CXnC for cluster insertion [12]. FDXs have a very negative reduction potential and therefore they function as major electron donors in diverse redox-driven metabolic pathways [13]. In plants and microalgae, FDXs deliver reducing equivalents from photosystem I (PSI) in photosynthetic organisms and provide electrons to FDX-NADPH-oxidoreductase (FNR) for NADP+ reduction, which is essential in the Calvin cycle for carbon assimilation [13]. FDXs can also transfer electrons to other enzymes such as ferredoxin-thioredoxin reductase (FTR) in carbon metabolism, nitrite reductases in nitrogen assimilation, and fatty acid desaturases [14,15,16,17]. These FDX-involving metabolic pathways suggest that FDXs may facilitate biomass production through the transfer of excess electrons generated from photosynthesis to enzymes involved in biomass production.
FDXs also play crucial roles in ROS (reactive oxygen species)-scavenging systems by regenerating ascorbate that protects the photosynthetic apparatus in the water-water cycle [18]. High levels of ROS cause oxidative damage of DNA, proteins, and membranes, and can lead to cell death. Chloroplasts are a prime source of ROS, which are created as byproducts of photosynthesis even in the most favorable conditions [18,19]. ROS such as hydrogen peroxide (H2O2) are further increased in cells suffering from stress due to heat or excess salt [20]. To reduce the toxicity of ROS, photosynthetic organisms have evolved several anti-oxidant systems [21]. These pathways include enzymes involved in free-radical scavenging, which in turn help relieve the oxidative stress on the cell [14,19]. The elimination of ROS toxicity is a practical approach to improve cell stress tolerance. For example, ectopic expression of cyanobacterial flavodoxin, a functional analog of FDX, in transgenic tobacco decreased the ROS level and enhanced the tolerance of the plant to heat, excessive light, cold, drought, UV radiation and iron starvation [22,23]. In addition, overexpression of PETF, the major form of FDX in Chlamydomonas, increased the proportion of reduced ascorbate under normal growth conditions and decreased the ROS level, including H2O2, enhancing the cell survival rate under heat stress [24].
In Chlamydomonas, there are at least six plant-type FDXs, PETF and FDX2-6 [25]. These FDX genes have different expression patterns in response to various environmental conditions. For example, PETF is constitutively expressed in a broad range of environmental conditions, whereas FDX5 is highly expressed in anaerobic conditions [25,26]. PETF is known as the major photosynthetic FDX and acts in electron transfer between photosystem I and FNR [25]. PETF and FDX5 are grouped in the same phylogenetic cluster, indicating that they are most closely related to leaf-type FDXs [16,25]. The putative protein structure of FDX5 resembles that of PETF in the position of cysteine residues for possible disulfide bond formation, and both PETF and FDX5 belong to a typical plant type 2Fe-2S protein family located in the chloroplast [16,25]. FDX5 has a reduction potential very similar to that of PETF, but is unable to reduce NADP+ via ferredoxin-NADP-reductase and the plastidic [FeFe]-hydrogenase HydA1, so the role of FDX5 in the anaerobic pathway is unclear [16,27].
In this study, transgenic Chlamydomonas cell lines overexpressing either PETF or FDX5 were generated to clarify whether increasing gene expression levels of FDXs could alleviate oxidative damage under heat and salt stresses. Starch content was evaluated in these transgenic lines. Lipids accumulated more in the transgenic lines than in the wild-type cells, irrespective of nitrogen depletion. The two FDX overexpressing Chlamydomonas lines were applied in PMFCs; power density production by the transgenic lines was higher than that for the wild type.

2. Results and Discussion

2.1. Result

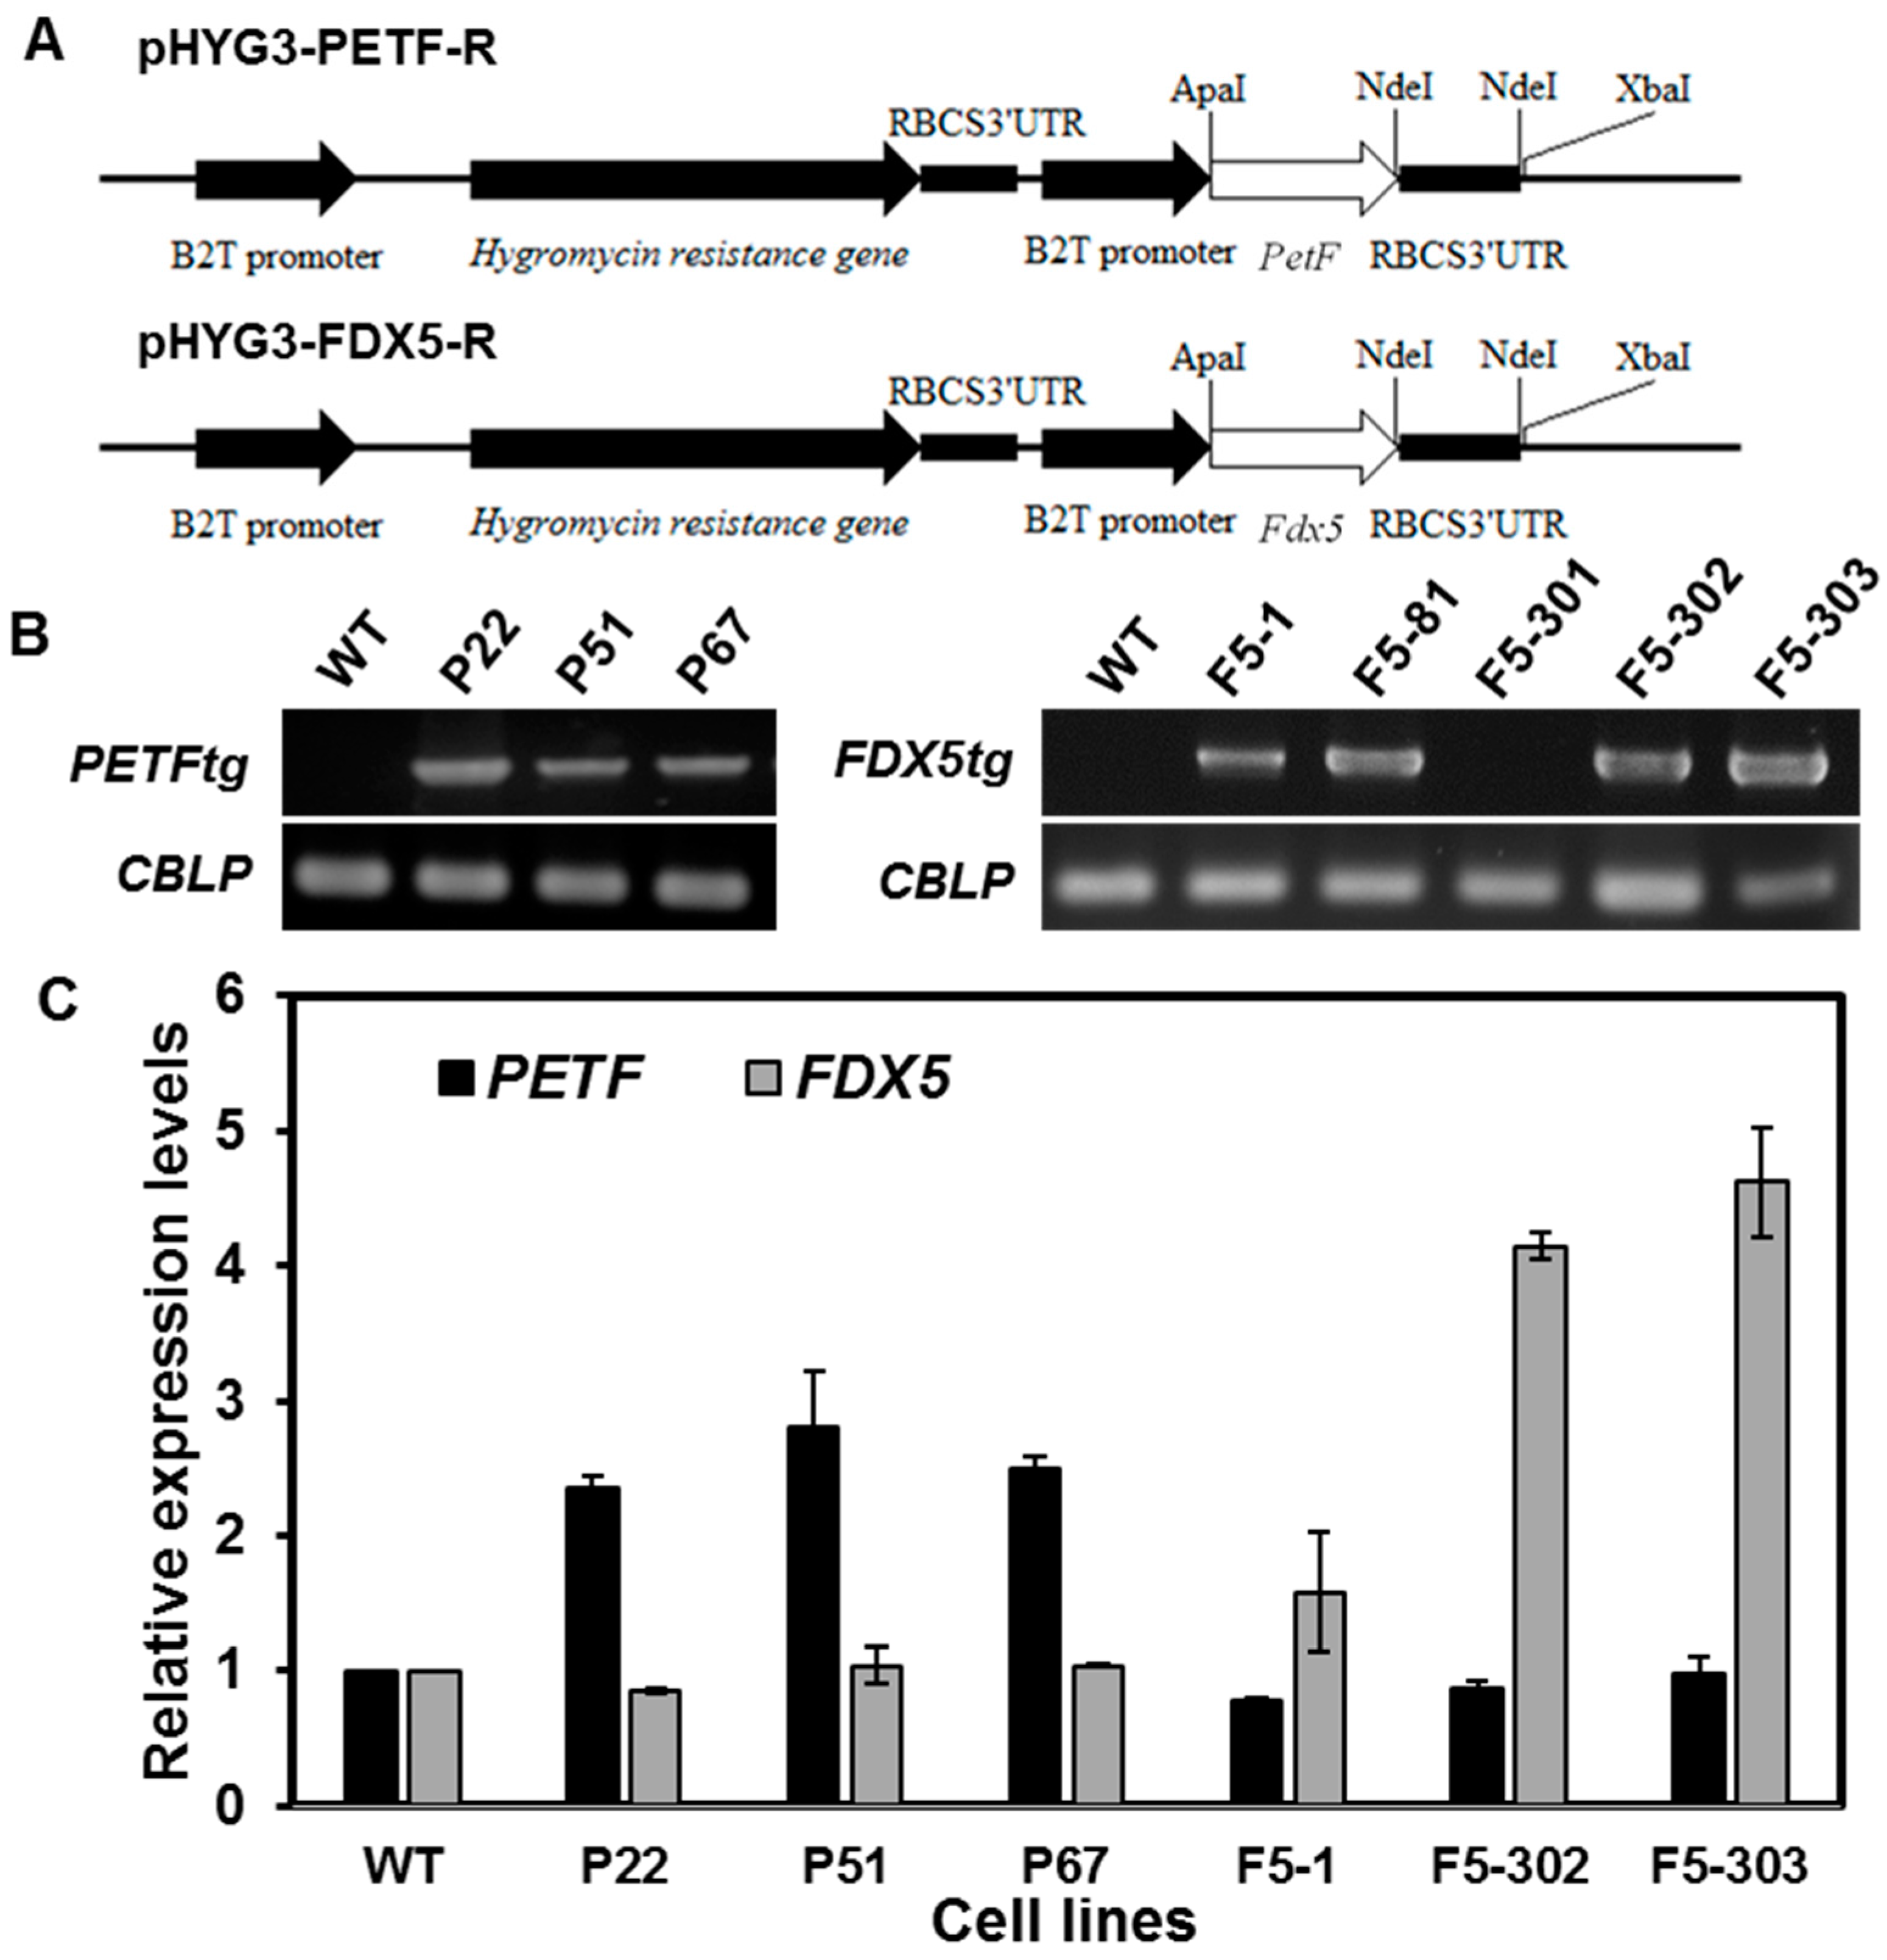
2.1.1. Generation and Characterization of Transgenic Lines Overexpressing Ferredoxin Genes

The binary constructs pHyg3-PETF-R and pHyg3-FDX5-R (Figure 1A), which contain different ferredoxin cDNAs, PETF and FDX5, fused downstream of the B2T (β2-tubulin) promoter, were transformed into Chlamydomonas by electroporation, and at least three putative independent transgenic Chlamydomonas lines were selected for each construct. To evaluate the putative transgenic Chlamydomonas lines, PCR-based genomic DNA analysis was performed using specific primers to confirm the presence of transgenes. The transgene PETFtg was detected in the cell lines P22, P51 and P67, and FDX5tg was detected in lines F5-1, F5-81, F5-302 and F5-303, respectively. In contrast, no transgenes were detected in the wild-type line (Figure 1B). The CBLP gene, encoding a Chlamydomonas G-protein beta subunit-like polypeptide, was used as a loading control for the extracted genomic DNA (Figure 1B). The levels of total PETF and FDX5 mRNA were determined by quantitative RT-PCR in each selected transgenic line. Figure 1C shows that PETF mRNA accumulated more in lines P22, P51 and P67 than in the wild type, as did FDX5 mRNA in lines F5-1, F5-302 and F5-303. These results indicate that the selected transgenic Chlamydomonas lines were ectopically overexpressing either PETF or FDX5.
Figure 1. Characterization of transgenic Chlamydomonas overexpressing PETF and FDX5, respectively; (A) Schematic illustration of plasmids pHYG3-PETF-R and pHYG3-FDX5-R prepared for electroporation. The coding sequence of either PETF or FDX5 was ligated between the β2-tubulin promoter (PT) and the 3ʹUTR of ribulose-1,5-bisphosphate carboxylase/oxygenase small subunit (RBCS) to generate pHYG3-PETF-R and pHYG3-Fd5-R, respectively. The transformants harboring the aph7 gene were screened by hygromycin; (B) To confirm putative transformants, specific primers were used to amplify part of the promoter and the entire FDX gene to the 3ʹUTR region. Amplification of CBLP (G-protein beta subunit-like polypeptide) was used as an internal control for genomic DNA; (C) The relative quantity (RQ) of PETF and FDX5 transcripts in algal lines. The total mRNA transcripts from endogenous and recombinant FDX genes, either PETF or FDX5, were quantified by qPCR with specific primers. Relative expression levels are the relative quantities of either PETF or FDX5 transcripts compared to the CBLP transcripts respectively, and then normalized by the value of non-transformant CC125 under normal growth conditions.
Ijms 16 19308 g001

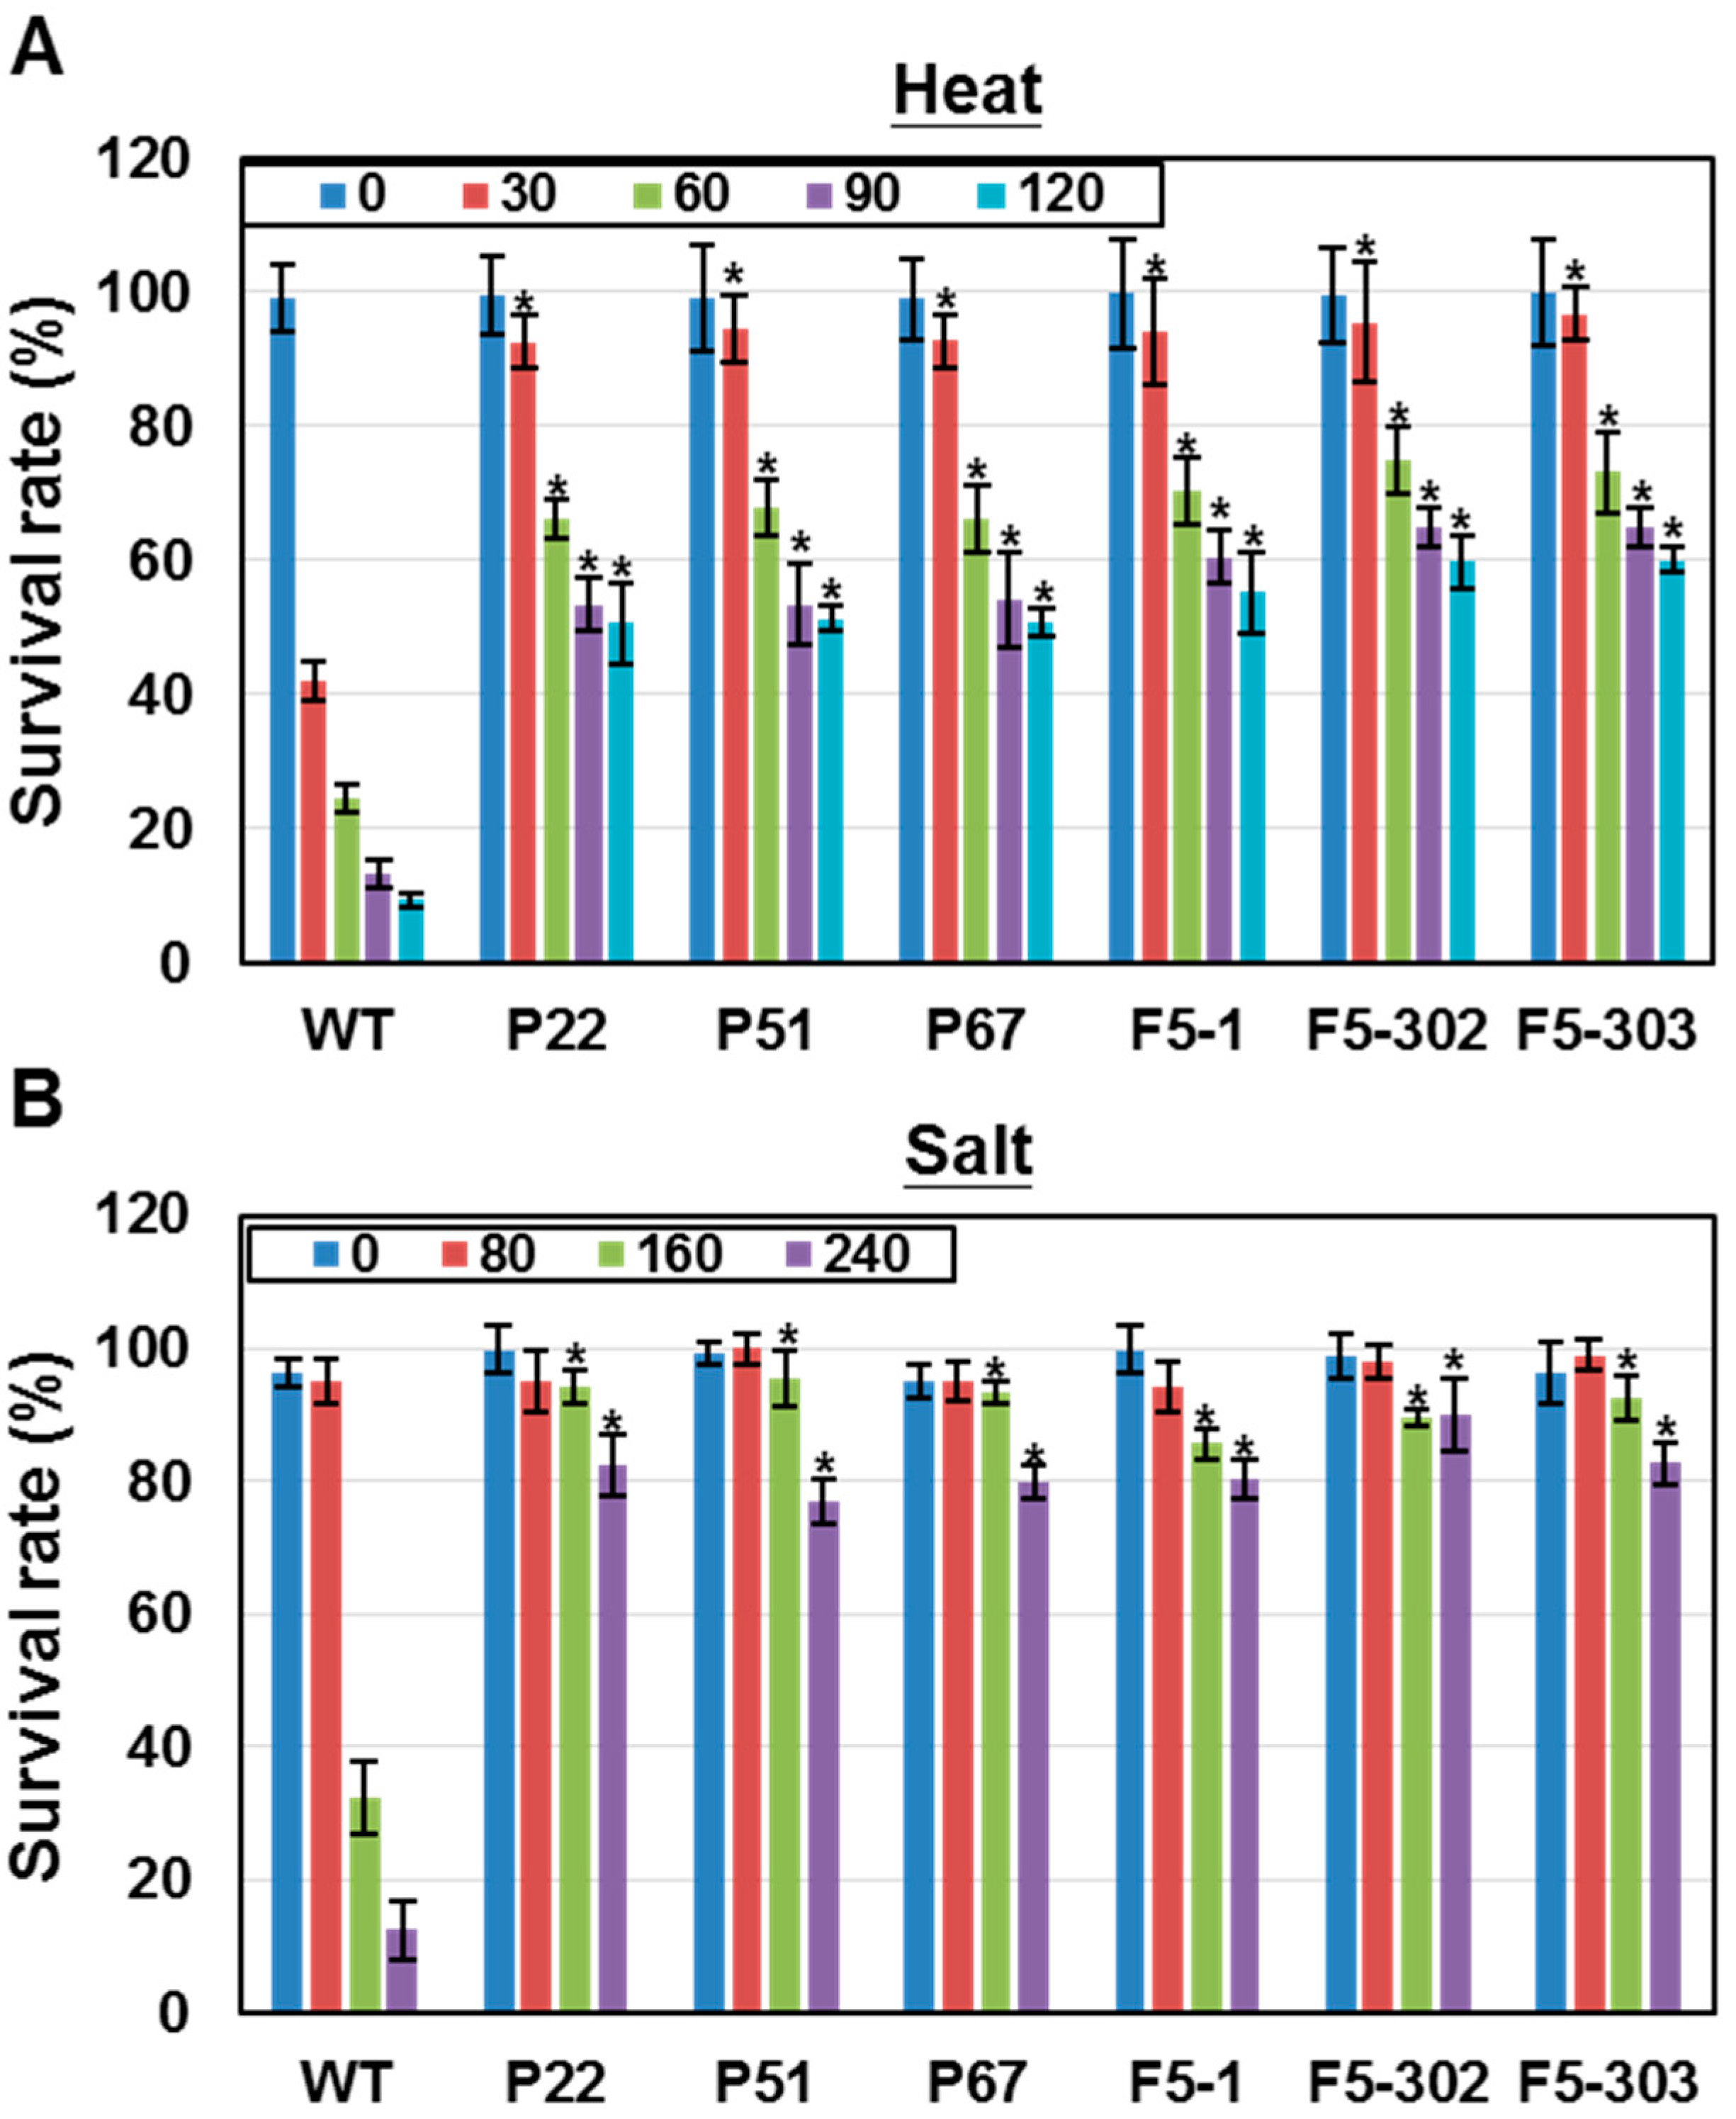
2.1.2. Overexpression of Ferredoxins Promotes Tolerance to Heat and Salt Stresses in Chlamydomonas

In our previous study it was shown that overexpression of PETF in transgenic Chlamydomonas lines led to greater heat tolerance than in the wild type. ROS levels in these transgenic PETF lines also decreased in both normal and heat-stressed growth conditions [24]. To address whether overexpression of FDX5 also lowered the ROS level in Chlamydomonas, the levels of H2O2, which is the major ROS, were compared in the wild-type and transgenic lines. The accumulation of H2O2 was lowered by ectopic expression of PETF in both normal and heat-stress conditions (Figure 2), consistent with our previous results [24]. The H2O2 levels in the FDX5 transgenic line were lower than those in the wild-type cells in normal and heat-stressed conditions (Figure 2). A dye to label cellular ROS, H2DCFDA, was applied to observe Chlamydomonas cells under a confocal microscope. A ROS green signal was not observed under normal growth conditions for either the wild-type or transgenic lines. After heat treatment, strong ROS fluorescent signals were detected in the chloroplast of wild-type cells, whereas slight ROS signals were observed in both the PETF and FDX5 overexpression lines (Figure 2). These results indicate that ectopic expression of FDX5 cDNA decreased the ROS level in cells, similar to previous observations for ectopic expression of PETF.
Figure 2. Comparison of ROS accumulation pattern and H2O2 content in wild-type and transgenic cell lines overexpressing ferredoxins under normal and high temperature growth conditions. Wild-type (WT), PETF transgenic line (P51), and FDX5 transgenic line (F5-302) were incubated at 25 or 42 °C for 40 min and stained with H2DCFDA to monitor the accumulation of cellular ROS (A); The green color indicates the presence of ROS. The red color indicates autofluorescence of chlorophyll. Bars indicate 10 μm. The H2O2 content in cells was also measured (B). Error bars indicate SD of the mean for five replicate cell suspensions. Asterisks on the columns indicate significant differences from the WT based on Student’s t-test (p < 0.05).
Ijms 16 19308 g002
The survival rates of PETF and FDX5 transgenic lines under heat stress were measured to examine whether FDX5 facilitates microalgal adaptation to heat stress, as PETF does [24]. Cells were subjected to heat treatment at 42 °C for various time periods and recovered for 3 days. The cell viability of the wild-type line dropped to 40% after heat treatment for 30 min, and progressively decreased to 10% after 120 min (Figure 3A). In contrast, the survival rates of two independent FDX5 transgenic lines, F5-1, F5-302 and F5-303, remained at about 95% after heat treatment for 30 min (Figure 3A). Although survival rates progressively decreased in these transgenic lines as the heat treatment time increased, the FDX5 transgenic lines remained around 60% viable after heat treatment for 120 min. Similar heat tolerance was also observed in three independent PETF transgenic lines, P22, P51 and P67 (Figure 3A).
Figure 3. The survival rates of transgenic Chlamydomonas under heat and salt stresses. The wild-type (WT), PETF transgenic lines (P22, P51 and P67) and FDX5 transgenic lines (F5-1, F5-302 and F5-303) of Chlamydomonas were treated with either heat or salt stress. (A) Survival rates of Chlamydomonas cells under heat stress. Chlamydomonas cell lines were cultured at 42 °C for 30, 60, 90 or 120 min, then the cells were recovered at 25 °C for 72 h and the survival rates determined; (B) Survival rates of Chlamydomonas cells under salt stress. Chlamydomonas cell lines were cultured in 80, 160 or 240 mM NaCl for 12 h, and the survival rates were determined. Error bars indicate SD of the mean for five biological repeats; asterisks on the columns indicate significant differences from the WT based on Duncan’s multiple range test (p < 0.05).
Ijms 16 19308 g003
Salt (NaCl) stress have been reported to increase the levels of ROS and inhibit the cell growth in Chlamydomonas [28]. To examine whether overexpression of PETF or FDX5 conferred salt tolerance in transgenic Chlamydomonas lines, the PETF and FDX5 transgenic lines were treatment with 80, 160 and 240 mM salt concentrations. The survival rate of the wild-type line dropped to 35% and 15% after incubation in 160 and 240 mM NaCl for 12 h, respectively, whereas the survival rates of PETF and FDX5 transgenic lines remained at 80%–90% (Figure 3B). Taken together, these results indicate that the overexpression of PETF or FDX5 genes enhances the tolerance of Chlamydomonas to heat and salt stresses.

2.1.3. Overexpression of Ferredoxins Promotes Tolerance to Heat and Salt Stresses in Chlamydomonas
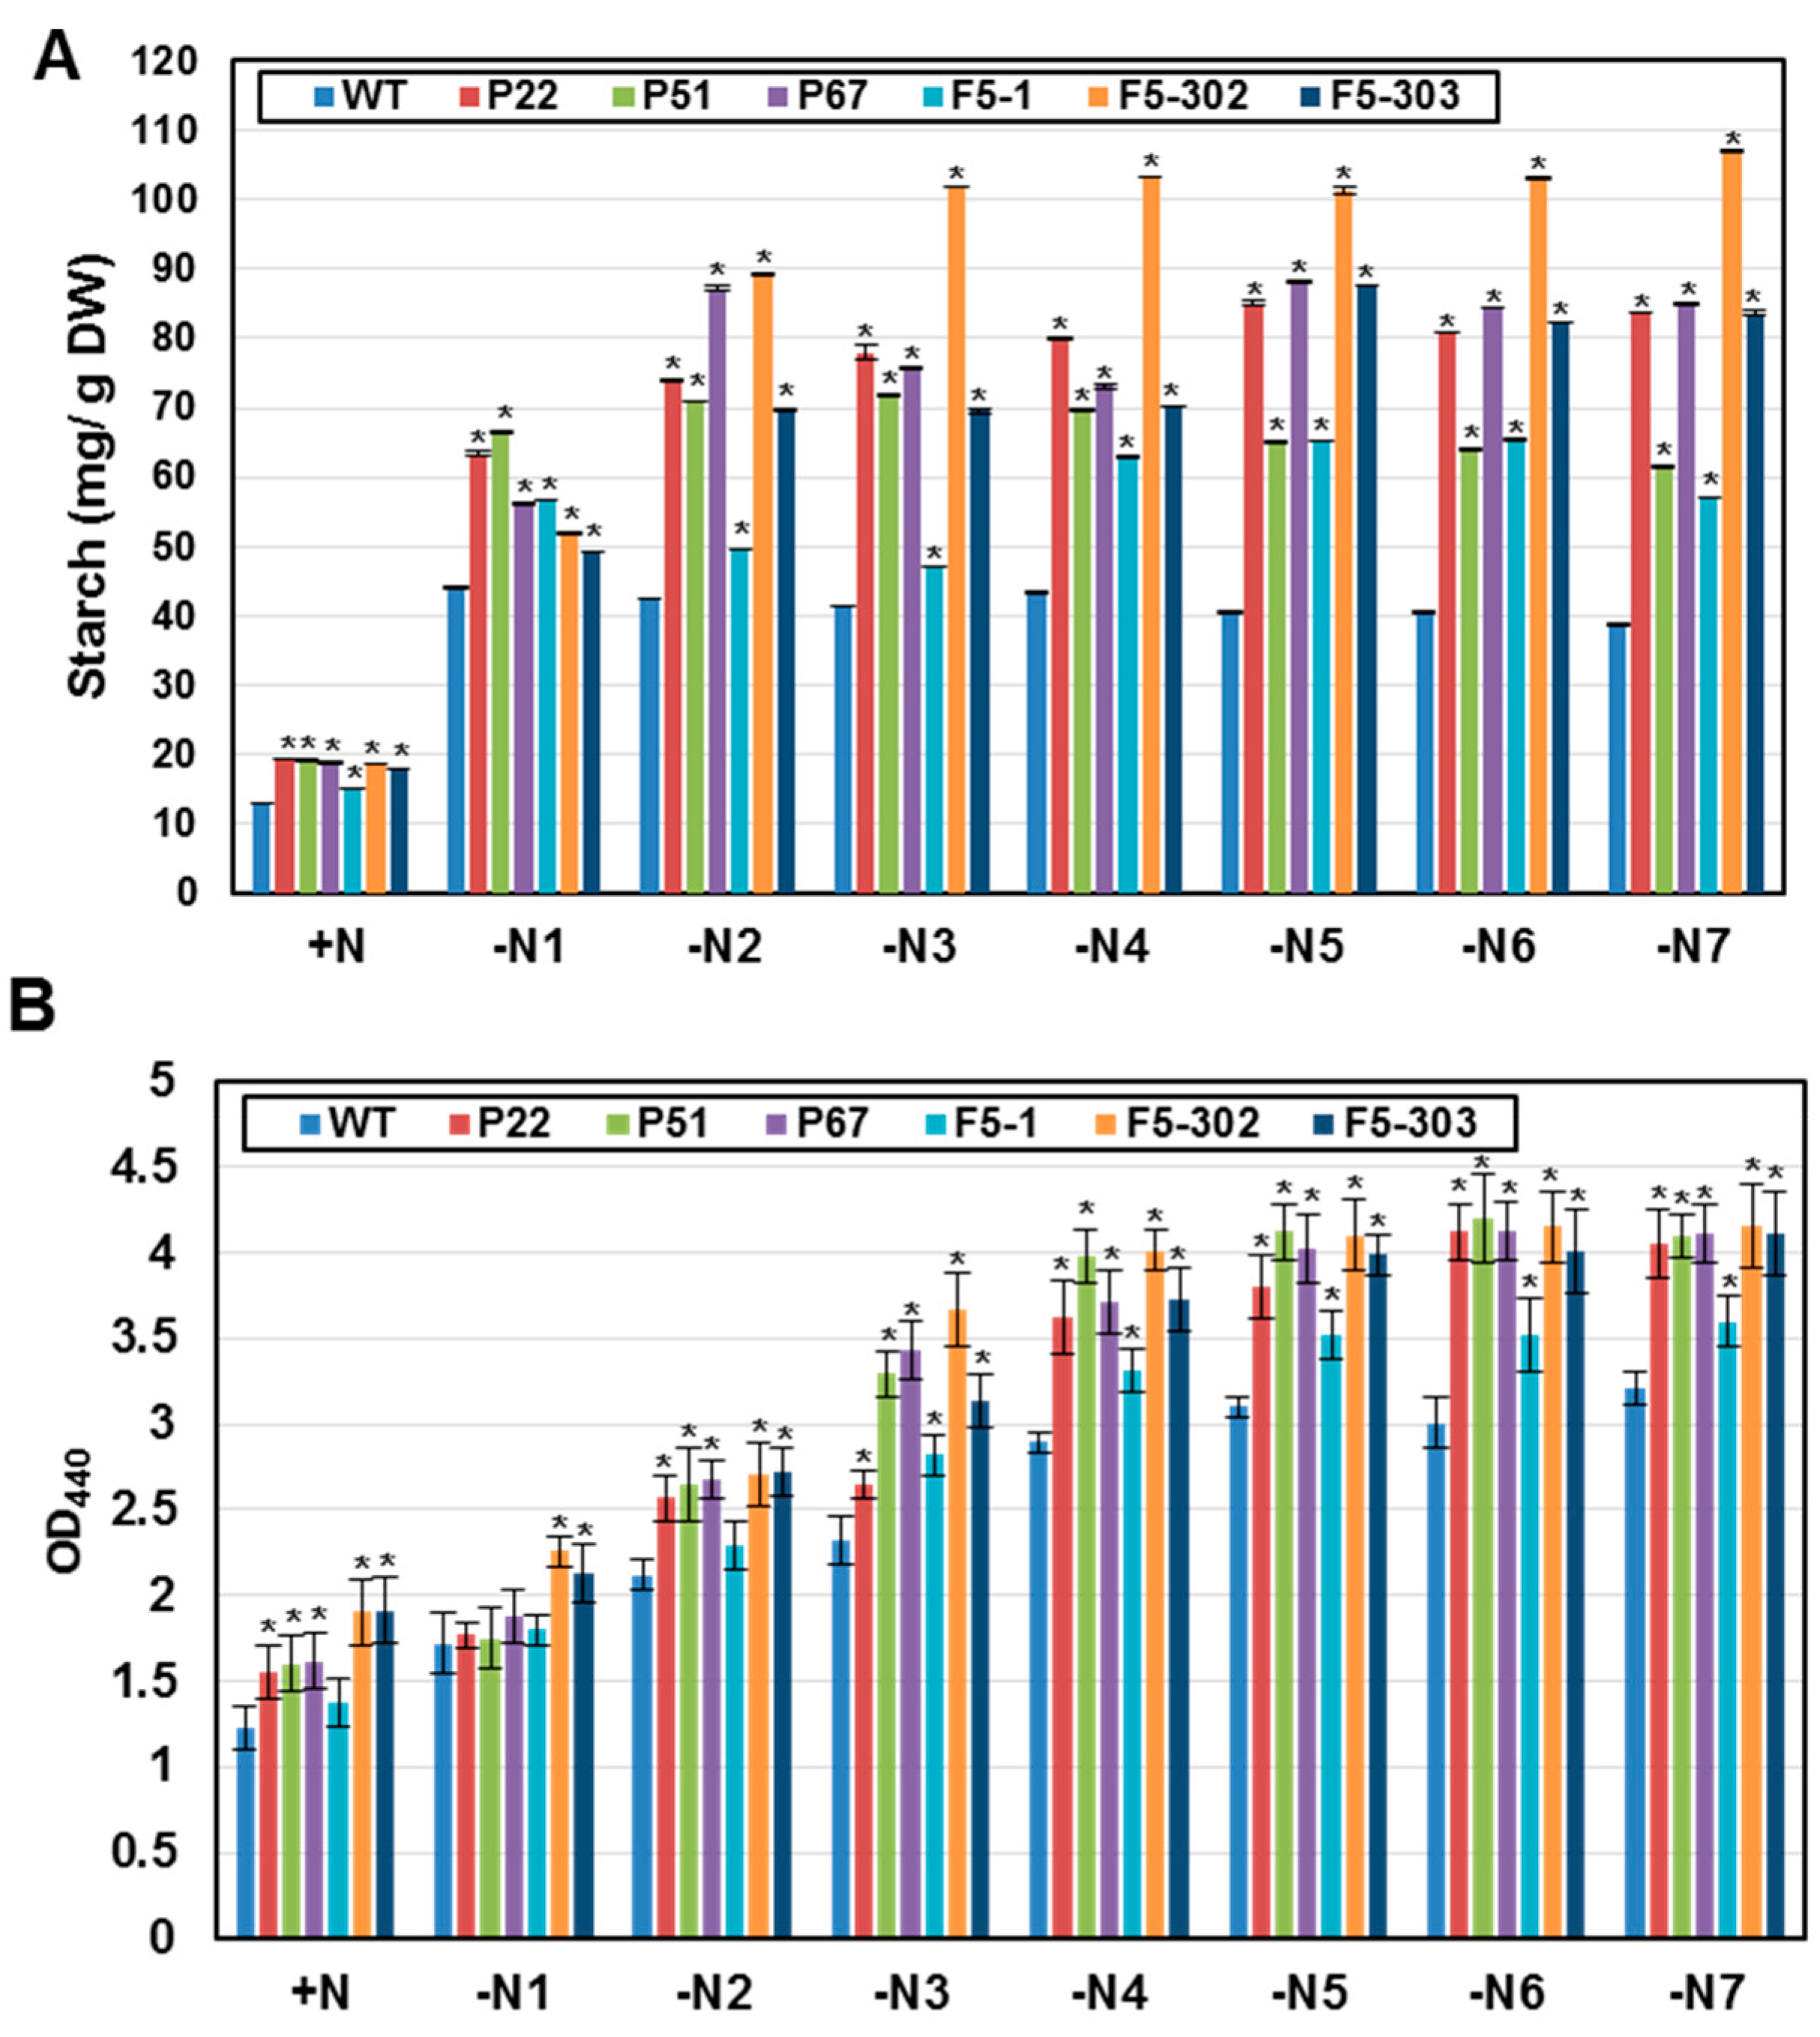
FDX is proposed to play a role in starch metabolism [29], and starch is known to accumulate during nitrogen depletion in Chlamydomonas [30]. To test whether ectopic expression of FDXs increased starch accumulation under nitrogen starvation, we measured the starch contents of PETF and FDX5 overexpressing transgenic lines after nitrogen starvation for various periods. The starch content increased by 60% relative to wild type in transgenic lines overexpressing either PETF or FDX5 in normal growth conditions (Table 1; Figure 4A). Nitrogen starvation-induced starch accumulation was observed in the wild-type line and in the transgenic lines (Table 1; Figure 4A). Compared to the wild type, PETF or FDX5 transgenic lines contained 1.7–2.7 times more starch after nitrogen starvation for three to seven days (Table 1; Figure 4A). These results indicated that overexpression of FDXs could enhance starch accumulation in Chlamydomonas.
Table 1. Starch contents (mg/g dry weight) of WT, PETF- and FDX5-overexpression lines.
Line+N−N1−N2−N3−N4−N5−N6−N7
WT13.05 ± 0.0644.13 ± 0.0542.50 ± 0.0541.33 ± 0.0343.33 ± 0.0940.53 ± 0.0440.53 ± 0.0638.77 ± 0.13
PETF overexpression lines
P2219.40 ± 0.1563.40 ± 0.3073.91 ± 0.1277.96 ± 1.0680.00 ± 0.2485.08 ± 0.3480.82 ± 0.0383.69 ± 0.11
P5119.13 ± 0.0366.46 ± 0.0770.82 ± 0.0871.74 ± 0.1269.69 ± 0.1665.14 ± 0.3063.84 ± 0.1061.43 ± 0.24
P6718.86 ± 0.0856.08 ± 0.1187.19 ± 0.3875.71 ± 0.1273.07 ± 0.2488.26 ± 0.2184.34 ± 0.0284.90 ± 0.06
FDX5 overexpression lines
F5-115.04 ± 0.0556.85 ± 0.0149.59 ± 0.0747.14 ± 0.0962.89 ± 0.1565.25 ± 0.1065.25 ± 0.1657.11 ± 0.08
F5-30218.60 ± 0.0252.97 ± 0.1889.13 ± 0.18101.79 ± 0.11103.30 ± 0.10101.31 ± 0.62103.21 ± 0.18106.88 ± 0.10
F5-30318.11 ± 0.0149.22 ± 0.1069.77 ± 0.1969.52 ± 0.3670.31 ± 0.0787.54 ± 0.0182.25 ± 0.1283.69 ± 0.21
+N indicates cells cultured in nitrogen-containing medium; −N1 to −N7 indicates cells cultured in nitrogen-free medium for one to seven days. Error bars indicate the SDs of five independent biological replicates.
Oil accumulation was also compared among wild type, PETF and FDX5 transgenic lines. Equal cell numbers of wild-type, two PETF transgenic lines, and two FDX5 transgenic lines, were incubated in nitrogen depletion medium for various periods, and relative lipid contents were compared. Quantitative assays showed that the lipid content was increased 13%–56% in P22, P51, P67, F5-302 and F5-303 cells compared with wild-type cells in normal growth conditions (Table 2; Figure 4B). After nitrogen starvation, lipids progressively increased in both the wild-type and transgenic lines; the increase ranged from 0.5 to 2.5 folds from day 1 to day 4 of nitrogen starvation (Table 2; Figure 4B), but the lipid levels remained approximately constant from day 4 to day 7 (Table 2; Figure 4B). These results indicate that both overexpression of PETF and FDX5 can promote oil accumulation in Chlamydomonas in either nitrogen-rich or -starved conditions.
Table 2. Relative lipid contents (OD440) of WT, PETF and FDX5 overexpression lines.
Line+N−N1−N2−N3−N4−N5−N6−N7
WT1.22 ± 0.121.72 ± 0.172.12 ± 0.082.31 ± 0.142.89 ± 0.063.10 ± 0.063.00 ± 0.153.21 ± 0.10
PETF overexpression lines
P221.56 ± 0.161.77 ± 0.072.57 ± 0.132.65 ± 0.083.63 ± 0.223.80 ± 0.194.12 ± 0.164.05 ± 0.20
P511.60 ± 0.161.75 ± 0.172.65 ± 0.213.29 ± 0.133.98 ± 0.164.12 ± 0.164.20 ± 0.254.10 ± 0.12
P671.61 ± 0.161.88 ± 0.152.68 ± 0.113.43 ± 0.173.71 ± 0.194.0 ± 0.204.13 ± 0.174.11 ± 0.16
FDX5 overexpression lines
F5-11.38 ± 0.141.80 ± 0.092.30 ± 0.142.82 ± 0.113.31 ± 0.133.52 ± 0.143.52 ± 0.213.60 ± 0.14
F5-3021.90 ± 0.192.26 ± 0.092.71 ± 0.193.67 ± 0.224.01 ± 0.124.10 ± 0.214.15 ± 0.214.16 ± 0.25
F5-3031.91 ± 0.192.12 ± 0.172.72 ± 0.143.13 ± 0.163.72 ± 0.193.99 ± 0.124.01 ± 0.244.11 ± 0.25
+N, indicate cells were cultured in nitrogen-containing medium; −N1 to −N7, indicate cells were cultured nitrogen-free medium for 1 to 7 days. Error bars indicate the SDs of five independent biological replicates.
Figure 4. Accumulated starch and lipid in two ferredoxin gene transgenic lines. Wild type (WT), PETF transgenic lines (P22, P51 and P67), and FDX5 transgenic lines (F5-1, F5-302 and F5-303) were grown in nitrogen-containing medium (+N) or nitrogen-free medium for 1 to 7 days (−N1 to −N7). Cells were collected and then (A) starch and (B) lipid contents were determined. Error bars indicate the SDs of five independent biological replicates and asterisks on the columns indicate significant differences from the WT based on Duncan’s multiple range test (p < 0.05).
Ijms 16 19308 g004

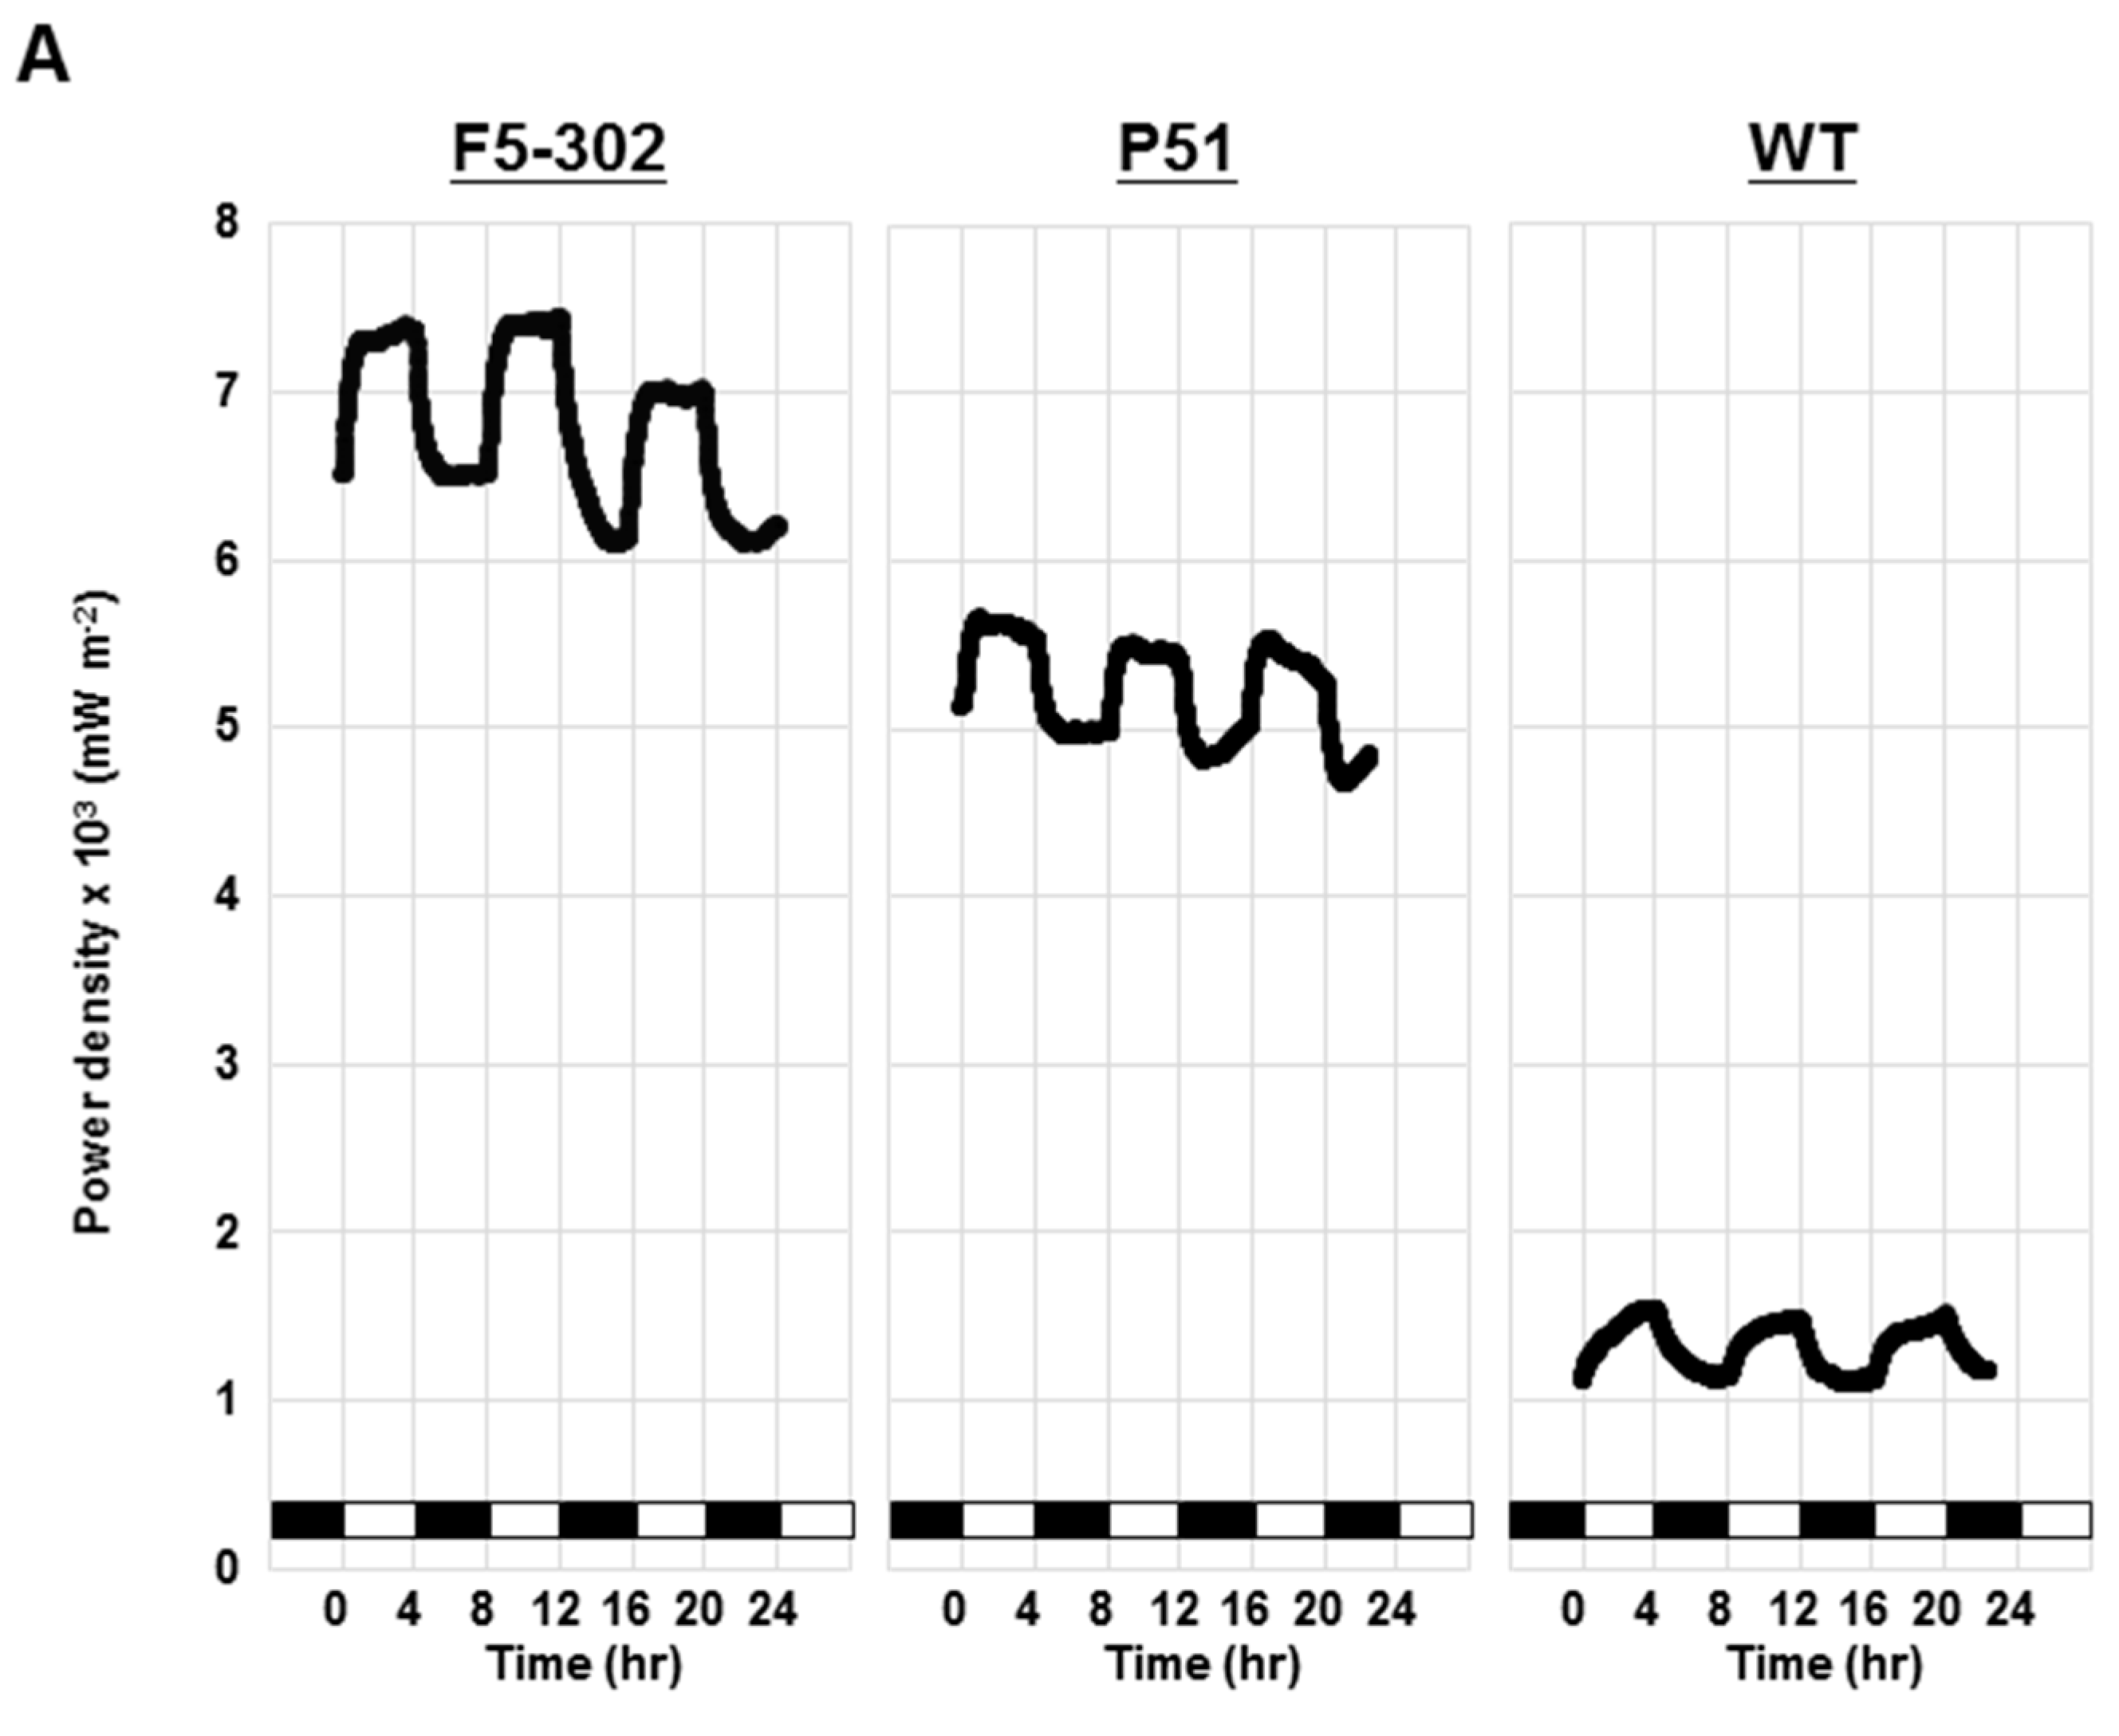
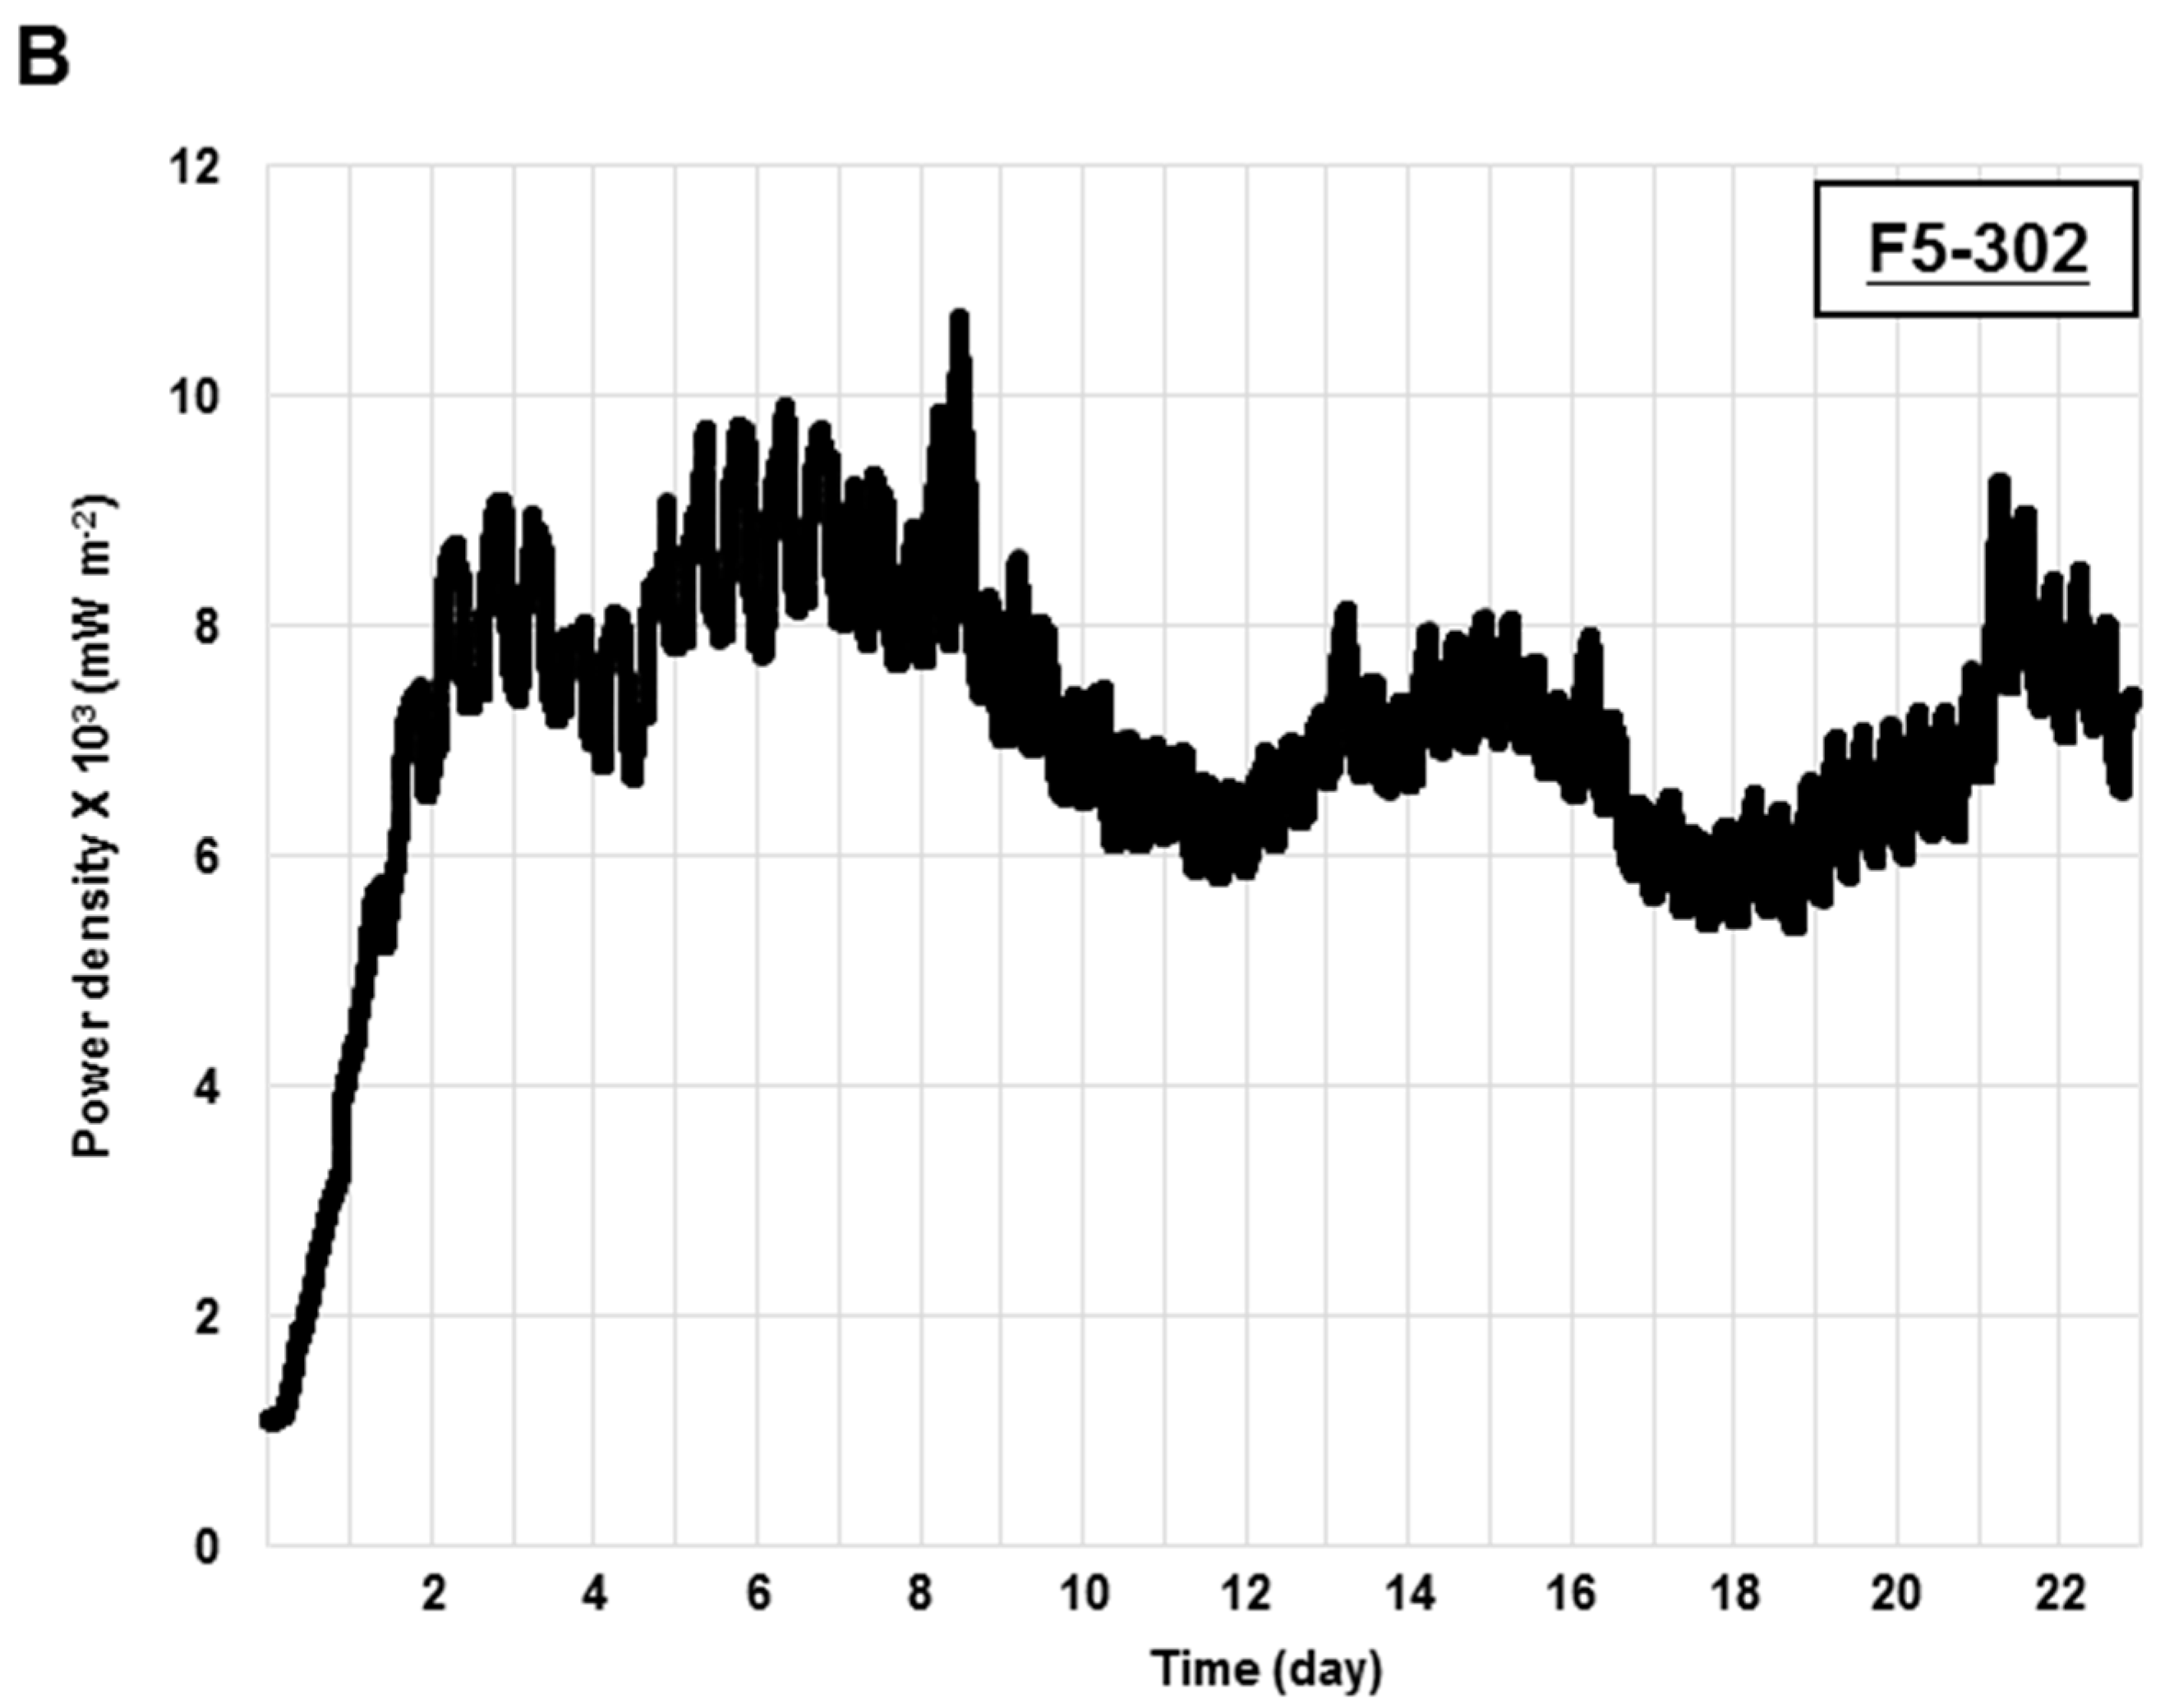
2.1.4. Application of Transgenic Chlamydomonas Ferredoxin Lines in a Photo Microbial Fuel Cell

FDXs are electron transfer proteins responsible for delivering reducing equivalents from photosystem I [13]. Electricity generation in photo microbial fuel cells (PMFC) was compared for the wild type, the PETF overexpression line P51 and the FDX5 overexpression line F5-302. Equal cell number of Chlamydomonas at the late-logarithmic growth phase was loaded in the anaerobic anode chamber and operated under 4 h light/4 h dark photoperiods. Electric current and voltage were detected every minute and the power density was calculated. The power density rose during light periods and declined during dark periods in all three Chlamydomonas lines (Figure 5A). The maximum power density generated by F5-302 was 0.0084 mW·m−2, and P51 was 0.0055 mW·m−2, both higher than the wild-type line (0.0015 mW·m−2) (Figure 5A). Meanwhile, light-dependent power density production was more effective in F5-302 than P51 and wild type (Figure 5A). Furthermore, long-term power density production from the F5-302 line in PMFC was examined. Mid-logarithmic Chlamydomonas cells were loaded in the anaerobic anode chamber and operated under 6 h light/6 h dark photoperiods for seven days to increase cell number, and then the photoperiod was switched to 4 h light/4 h dark. The power density was 0.001 mW·m−2 on day zero, and then increased progressively to 0.009 mW·m−2 by day three (Figure 5B). After day three, the power density maintained at a range of 0.0058–0.01 mW·m−2 for more than three weeks (Figure 5B), and light-dependent power density phenomena was detected in long-term PMFC with the F5-302 Chlamydomonas transgenic cell line (Figure 5B).
Figure 5. Electricity generated from Chlamydomonas in a photo microbial fuel cell (PMFC). (A) FDX5 transgenic line F5-302, PETF transgenic line P51, and Wild type (WT) were individually assessed in a PMFC containing 80 mM NaCl under a 4 h/4 h light/dark cycle. White/black bars indicate the light/dark cycle; (B) The power density generated by F5-302 was monitored for 23 days.
Ijms 16 19308 g005aIjms 16 19308 g005b

2.2. Discussion

Microalgae are considered a primary resource for third-generation biofuels, because they can produce biomass rapidly with simple cultivation requirements. Some microalgal strains can even be directly cultivated with flue gas and wastewater [31,32]. In order to use microalgae in biofuel production, scientists are screening strains highly tolerant to stressful environmental conditions. Under various stresses, excess ROS accumulates in cells, causing oxidative damage and generally leading to cell death. Thus, reduction of ROS level is a major biotechnology strategy to protect photosynthetic organisms from various abiotic stresses [33,34,35]. In adverse environmental conditions such as drought, salt, high temperature and excessive light, the main source of ROS production is in chloroplasts via the photosynthetic electron-transport chain (PETC) due to uneven electron flow. Therefore, avoidance of excess electrons overproduced by the PETC in stressed cells may reduce ROS production and prevent cellular damage. FDXs are electron distributers that transfer electrons originating from photosynthetic water oxidation to specific FDX-dependent enzymes in the chloroplast. In addition, FDXs can also transfer electrons to generate ascorbate, which is employed by ascorbate peroxidase (APX) to scavenge H2O2 [19,21,36,37]. Thus, overexpression of FDXs is a theoretical method to reduce ROS and improve abiotic stress tolerance. Recent evidences indicated that PETF and FDX5 directly interact with the cyanobacterial flavoprotein Flv3 homolog protein [38]. Flv3, a NAD(P)H: oxygen oxidoreducase in Sybechocystis sp., has been proposed to play a role in detoxification of oxidative compounds [39]. Previously, we demonstrated that overexpression of PETF, a major form of ferredoxin, decreases the ROS level and contributes to tolerance to heat stress in Chlamydomonas [24]. Protein binding properties between PETF and FDX5 have been demonstrated by a yeast-two hybrid system and pull-down experiments [38], implying a functional interaction between PETF and FDX5. In the present study, we provide evidence that ROS levels in the Chlamydomonas transgenic lines overexpressing either PETF or FDX5 were significantly reduced, resulting in improved tolerance to heat and salt stresses. Our investigation supports the hypothesis described above that the overexpression of FDXs decreases ROS levels and contributes to tolerance to abiotic stresses in Chlamydomonas.
Microalgae have chloroplasts that contain light-harvesting antenna complexes (LHCs) to capture light energy, and chloroplasts generate ROS during energy transfer steps of photosynthesis [40]. Down-regulation of LHC related proteins reduces photosynthetic efficiency. Accordingly, the reduction in expression of LHC in Chlamydomonas by RNAi technology results in a higher resistance to photodamage, and increases light penetration properties compared to that in non-transgenic cells [41]. FDXs accept electrons generated from photosystems and then transfer them to specific FDX-dependent enzymes. PETF is shown to interact physically with the light-harvesting protein LHCA5, involved in the formation of the LHCI super complex [38]. In the present study, we propose that PETF overexpression lines may transport excess electrons from photosystems more effectively than the nontransgenic line, reducing ROS levels and also preventing photoinhibition, thereby increasing the starch content. Given that FDX5 interacts with PETF, the results described in the discussion above in FDX5 overexpression lines may be mediated by PETF.
In this study, transgenic lines of Chlamydomonas overexpressing either the PETF or the FDX5 gene all showed higher starch accumulation than the wild type. In Chlamydomonas, PETF, the most abundant ferredoxin, has been shown to interact directly with FNR1, which can reduce NADP+ to the NADPH that is later used in the Calvin Cycle to assimilate CO2 [38,42]. Moreover, PETF and FDX5 can also interact directly with the starch branching enzymes (SBE2/3) [38] involved in starch synthesis. In addition, through interaction with FDX thioredoxin reductase (FTR), ferredoxin proteins donate electrons to thioredoxins (Trx) that activate ADP glucose pyrophosphorylase (AGPase), a Trx target enzyme, by formation of a disulfide bond between the two small subunits of the AGPase heterotetrameric complex, a key enzyme in starch synthesis [43,44]. Both PETF and FDX5 have been shown to interact with chloroplastic FTR [38].
Several enzymes, such as pyruvate dehydrogenase and fatty acid synthase, require ATP and NAD(P)H to run fatty acid biosynthesis [12]. The transgenic lines in this study had significantly higher lipid contents than the wild type. This could be linked with FDXs promoting NADPH production and CO2 assimilation, in turn, to increase lipid accumulation. Moreover, in vitro activity analyses indicated that FDXs provide electrons to fatty acid desaturases [45,46]. We will further investigate the mechanism of lipid enhancement by the PETF- and FDX5-overexpressing lines in future work.
Microbial fuel cells (MFCs) are a microbial electricity generation system that produces electric power from catalytic reactions of organic substrates and biomass. The design of better materials for MFCs, the optimization of conditions for growth and activity of microbial cells, and the screening of more electrochemically active microbes, are all areas of work that have been undertaken in a bid to enhance the generation of electric power by MFCs [11,47,48,49,50,51,52]. The photomicrobial fuel cells (PMFCs) by using photo-microorganisms can generate electro energy under photosynthesis without supplement of carbon source. Both PETF and FDX5 overexpression transgenic lines were applied in a PMFC and the electric power density was higher than for wild-type cells, indicating that these FDX transgenic lines have high electrochemical activities. It is possible that overexpression of FDXs can enhance electron transfer to the anode of the PMFC. Another possibility is that the FDX transgenic lines accumulate more biomass, such as starch, which can be converted into cytosolic NADPH by the pentose phosphate pathway. In turn, electrons transfer to the extracellular space by NADPH oxidases encoded by RBO1 (respiratory burst oxidase) and RBO2 [10] (Anderson et al., 2015). Interestingly, the FDX5 transgenic line exhibited higher electric power density than the wild-type line and PETF transgenic lines, implying that FDX5 is a major electron carrier in Chlamydomonas in anaerobic conditions when FDX5 is induced and FDX5 is stabled [16]. Future studies are required to determine the action of FDX5 in the PMFC.

3. Experimental Section

3.1. Cultivation of Chlamydomonas reinhardtii

The wild-type strain of Chlamydomonas reinhardtii (CC125) and transgenic PETF or FDX5 overexpression lines were grown in Tris-acetate-phosphate (TAP) liquid medium [53] for a 12 h photoperiod (with a light intensity of 125 µmol photons·m−2·s−1) at 25 °C. The cell density was adjusted to 3 × 10⁶ mL−1, and 1 mL of cell suspension was added into 99 mL of TAP with shaking at 150 rpm for liquid culture.

3.2. Construction of Plasmids

To construct a plasmid for constitutive expression of the FDX5 gene, the FDX5 cDNA fragment was amplified by reverse transcription polymerase chain reaction (RT-PCR) with primers cFDX5-F: 5ʹ-ACGGGCCCATGCTGTGCGCGCGCTCCCAG-3ʹ (ApaI site underlined) and cFDX5-R: 5ʹ-GCCATATGTTACTGGTGCTTGCCGTACTCG-3ʹ (NdeI site underlined). The PCR fragment was digested with ApaI and NdeI, and ligated into pHYG3-PETF [24] to generate pHYG3-FDX5, which contains the β2-tubulin promoter driving expression of the FDX5 gene. As a terminator, the 3ʹ-UTR of the rbcS2 gene (ribulose bisphosphate carboxylase small subunit) was amplified by PCR with rbcS3-F: 5ʹ-AACATATGCGCTCCGTGTAAATGGAGGC-3ʹ (NdeI site underlined) and rbcS3-R: 5ʹ-AACATATGTCTAGACGCTTCAAATACGCCCAGC-3ʹ (NdeI site underlined), digested with NdeI and ligated with pHYG3-FDX5 to produce pHYG3-FDX5-R. The same construction strategy was applied to produce plasmid pHYG3-PETF-R for expression of PETF.

3.3. Transformation of Chlamydomonas reinhardtii

C. reinhardtii strain CC125 cells were electroporated according to a method described previously [24]. Both pHYG3-PETF-R and pHYG3-FDX5-R were linearized by ScaI and then transferred into a 4 mm gap electroporation cuvette, respectively. For electroporation, the Gene Pulser Xcell™ system (Biorad, Hercules, CA, USA) was used, with parameters 2 kV·cm−1, 25 µF, and 500 Ω. Cells were screened on TAP plates containing 20 μg·mL−1 hygromycin. All putative PETF and FDX5 transgenic cell lines were confirmed by genomic PCR with specific primers to amplify the recombinant DNA fragment including the β-tubulin (B2T) promoter, FDX coding sequence and the rbcS2 terminator region (RBCS 3ʹUTR). These primers were B2TP-F (5ʹ-CTAGATCACTACCACTTCTACACAG-3ʹ) and P721 (5ʹ-GCGTATCACGAGGCCCTTTC-3ʹ).

3.4. Heat and Salt Treatment

For heat stress treatment, log phase of cells were centrifuged and then 3 × 10⁶ mL−1 cells were cultured in TAP medium. One mL of cell suspensions were subjected to treatment at 42 °C under light (125 µmol photons·m−2·s−1) for various periods, and then recovered for 72 h under continuous light at 25 °C. Cell survival rate was determined by trypan blue staining analysis. The cell suspension was mixed with an equal volume of 0.4% (w/v) trypan blue solution. The survival rate was determined by hemocytometer and calculated as (unstained living cell number)/(total cell number) × 100%.
For salt stress treatment, log phase of cells were centrifuged and then 3 × 10⁶ mL−1 cells were cultured in TAP medium containing different NaCl concentrations (0, 120, 160 and 240 mM) under light condition (125 µmol photons·m−2·s−1) for 12 h. Cell survival rate was determined as described as heat stress treatment.

3.5. Quantitative RT-PCR

Total RNA was extracted from log phase of Chlamydomonas cells (total 3 × 10⁷ cells) using a plant total RNA kit (Viogene, Taipei, Taiwan). Then, cDNA fragments were synthesized from 1 μg of total RNA using the Transcriptor First Strand cDNA Synthesis Kit (Roche, Penzberg, Germany). To measure the total PETF and FDX5 transcripts in PETF-transgenic, FDX5-transgenic and wild-type lines, quantitative PCR was performed using a PikoReal™ 96 Real-Time PCR System (Thermo Scientific, Waltham, MA, USA). Primers PETF-F (5ʹ-GCTATGCGCTCCACCTTC-3ʹ) and PETF-R (5ʹ-CGTCCAGGATGTAGGTGTCA-3ʹ) were designed to amplify PETF transcripts. Primers FDX5-F2 (5ʹ-CGGGCAAGACGAAGACTATGG-3ʹ) and FDX5-R2 (5ʹ-GGGTAGGCGAGCACATGAG-3ʹ) were designed to amplify FDX5 transcripts. CBLP (G-protein beta subunit-like polypeptide) transcripts were analyzed as an internal control using primers Re-Cblp-F and Re-Cblp-R as previously described [24].

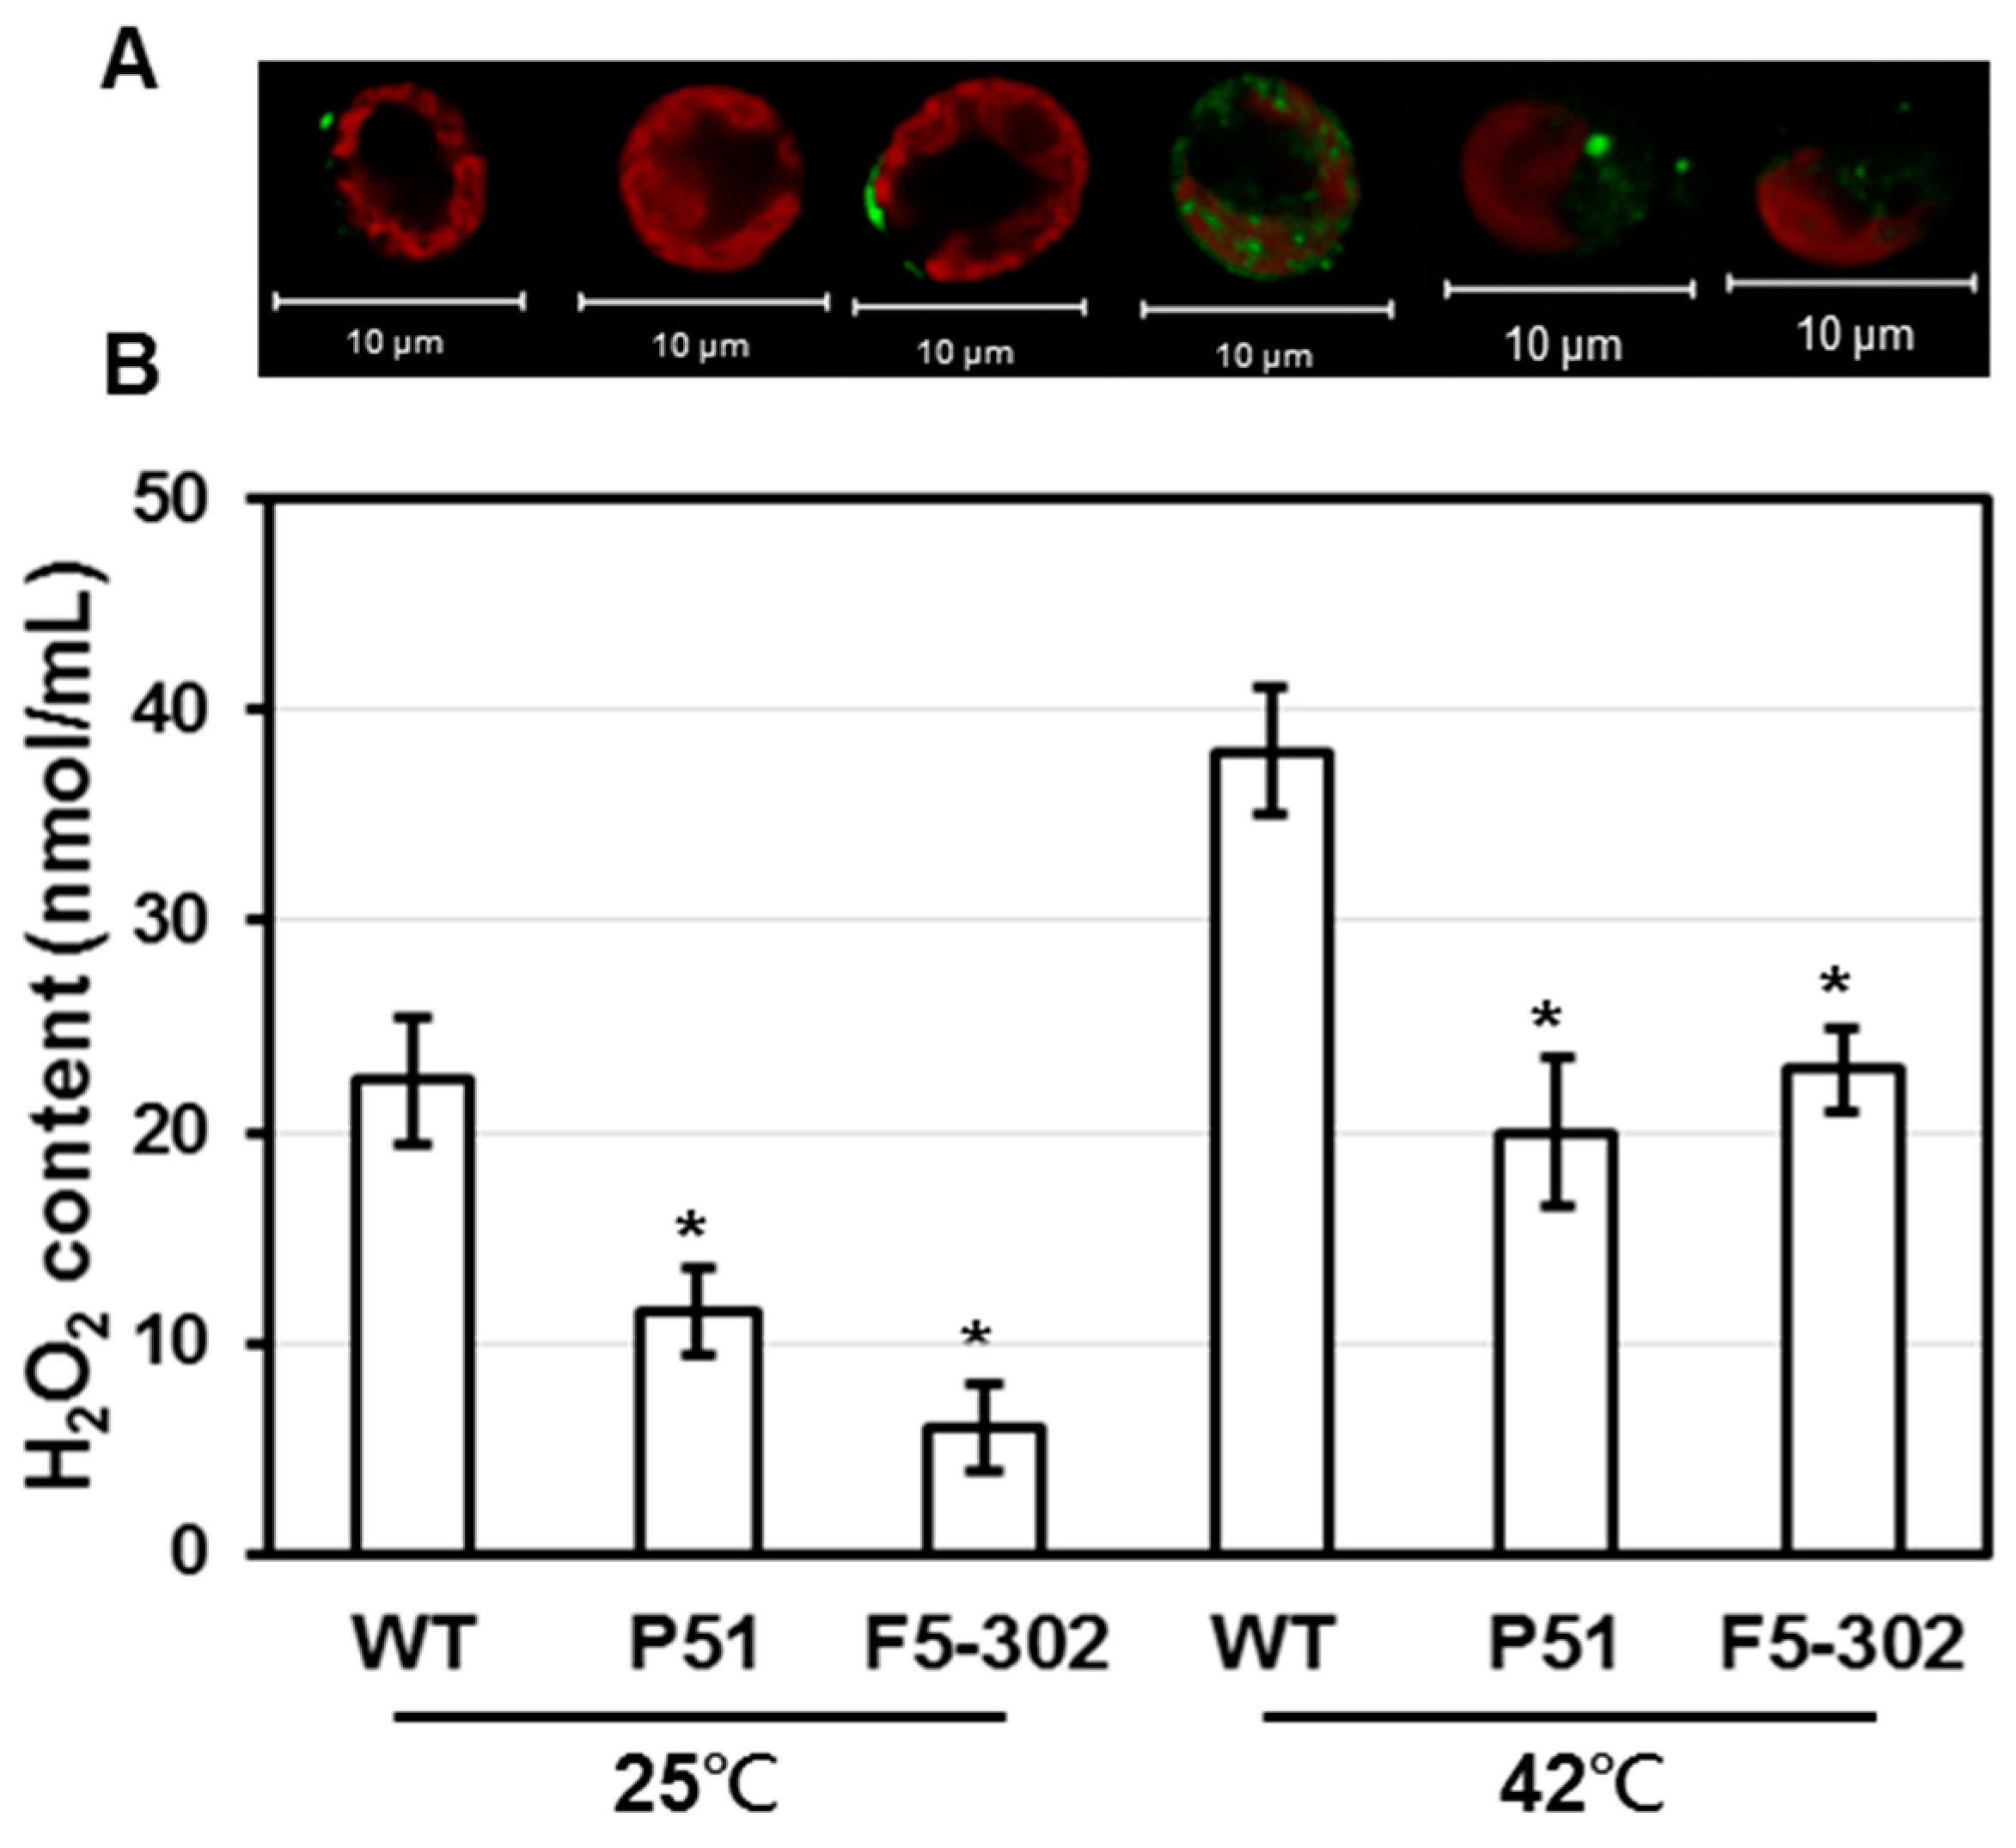
3.6. Detection of H2O2 and Reactive Oxygen Species (ROS)

For H2O2 measurement, an Amplex red hydrogen peroxide/peroxidase assay kit (Invitrogen, Carlsbad, CA, USA) was used. Log phase Chlamydomonas cells (total 3 × 10⁶) were collected by centrifugation and then frozen in liquid nitrogen, ground with a steel ball, and dissolved in 100 μL of 1 × reaction buffer from the assay kit. The mixture was centrifuged at 13,000× g for 5 min, and then the supernatant was used to measure cellular H2O2 concentration after horseradish peroxidase treatment at 25 °C for 30 min. The H2O2 concentrations were determined using a standard curve plotted from 0.2 to 1.0 μM H2O2 standards. Data were collected with five repeats.
To detect ROS, cells were incubated with 10 μM 2ʹ,7ʹ-dichlorodihydrofluorescein diacetate (H2DCFDA) and then observed using a Zeiss LSM 510 META confocal laser-scanning microscope (Carl Zeiss Microscopy GmbH, Jena, Germany). Fluorescent signals emitted from H2DCFDA and autofluorescence of chlorophyll were excited at 488 nm, and emitted signals were obtained at 500–530 and 650–710 nm, respectively.

3.7. Starch Quantitation

Total 3 × 10⁷ Chlamydomonas cells in log phase were cultured in 100 mL TAP and nitrogen starved-TAP medium for various periods. Cells were harvested by centrifugation and then freeze-dried. Sample dry weight was measured and then cells were resuspended in 80% (v/v) ethanol at least three times to remove chlorophyll, judged by the loss of green color. Samples were dried again at 70 °C and resuspended in 50 mM HClO4 to measure starch contents, as described previously [54].

3.8. Lipid Quantitation

To rapidly evaluate lipid levels, a colorimetric quantitation from algal cultures was applied as described [55], with slight modification. A total of 3 × 10⁷ Chlamydomonas cells in log phase were cultured in 10 mL TAP and nitrogen starved-TAP medium for various periods. Cells were pelleted by centrifugation and frozen at −20 °C. Whole cells were thawed in 200 μL of saponification reagent (25% methanol in 1 N NaOH), lysed with a stainless-steel ball and then heated evenly in a boiling water bath for 30 min. For colorimetric detection of cellular lipids, 200 μL of neutralization reagent (1 N HCl, 100 mM Tris pH 8.0) and 200 μL of copper reagent ((1 M triethanolamine):(1 N-acetic acid):(6.45% (w/v) Cu (NO3)2·3H2O) = 9:1:10) were added to each sample, and then mixed with 250 μL of chloroform. After centrifugation, the organic phase was obtained and then subjected to relative lipid content measurement as described [55].

3.9. Photo Microbial Fuel Cell System (PMFC)

A dual-chambered microbial fuel cell was fabricated using transparent poly-acrylic plastic plates. The two chambers were separated by a Nafion 211 membrane (Du Pont, Wilmington, DE, USA). The volume of each chamber was 70 mL. Two electrodes were graphite plates (each of 45.09 cm2) that were installed horizontally at opposite side of PMFC and a platinum wire was applied to connect the chambers to conduct electricity. Before the PMFC was set, the membrane and electrodes were pre-treated as described by Raman and Lan (2012); the electrodes were pre-treated with 1.0 M HCl for 1 h followed by 1.0 M NaOH for 1 h; the Nafion 211 membrane was pre-treated by sequentially boiling it in H2O2 (30% v/v) and deionized water, followed by soaking in 0.5M H2SO4 and then deionized water, each for 1 h. The anode chamber contained 3 × 10⁸ harvested algal cells in TAP medium with 80 mM NaCl, and was continuously stirred at 250 rpm using a magnetic stirrer under anaerobic condition. The cathode solution contained 0.1 M K3Fe(CN)6, as an electron acceptor, with 0.5 M K2HPO4 and 80 mM NaCl at pH 7. The PMFC was operated under 4 h of light (~30 µmol photons·m−2·s−1) and 4 h of darkness. The voltage and current across the external resistor (1 kΩ) were measured at 1 min intervals using a dual-channel data collection multi-meter (PROVA, Taipei, Taiwan). Power density (PD, mW·m−2) was calculated as PD = IV/area, where P = power, I = current (A), V = voltage (V).

Acknowledgments

We would like to thank Teng-Yung Feng, Yi-Hsien Lin and Chi-Wei Lan for their technical support and comments on this study. This work was supported by grants from the National Science Council of the Republic of China (both NSC98-2313-B-155-001 and NSC 99-2313-B-155-001-MY3 to Li-Fen Huang).

Author Contributions

Li-Fen Huang participated the whole experimaental designs, troubleshooting and data discussion. She also constructed the recombinant DNA plamids, and prepared the entire manuscript. Ji-Yu Lin carried out the starch and oil analysis, made heat and salt treatments and set up the PMFC tests. Kui-You Pan generated Chlmydomonas transgenic cell lines and carried out molecular ananlyses for transformants. Chun-Kai Huang and Ying-Kai Chu collected samples and performed the relative Q-RT-PCR in this srudy.

Conflicts of Interest

The authors declare no conflict of interest.

References

  1. Hariskos, I.; Posten, C. Biorefinery of microalgae—Opportunities and constraints for different production scenarios. Biotechnol. J. 2014, 9, 739–752. [Google Scholar] [CrossRef] [PubMed]
  2. Lopez Barreiro, D.; Zamalloa, C.; Boon, N.; Vyverman, W.; Ronsse, F.; Brilman, W.; Prins, W. Influence of strain-specific parameters on hydrothermal liquefaction of microalgae. Bioresour. Technol. 2013, 146, 463–471. [Google Scholar] [CrossRef] [PubMed]
  3. Atta, M.; Idris, A.; Bukhari, A.; Wahidin, S. Intensity of blue led light: A potential stimulus for biomass and lipid content in fresh water microalgae chlorella vulgaris. Bioresour. Technol. 2013, 148, 373–378. [Google Scholar] [CrossRef] [PubMed]
  4. Lee, T.H.; Chang, J.S.; Wang, H.Y. Current developments in high-throughput analysis for microalgae cellular contents. Biotechnol. J. 2013, 8, 1301–1314. [Google Scholar] [CrossRef] [PubMed]
  5. Posten, C.; Schaub, G. Microalgae and terrestrial biomass as source for fuels—A process view. J. Biotechnol. 2009, 142, 64–69. [Google Scholar] [CrossRef] [PubMed]
  6. Raja, R.; Hemaiswarya, S.; Kumar, N.A.; Sridhar, S.; Rengasamy, R. A perspective on the biotechnological potential of microalgae. Crit. Rev. Microbiol. 2008, 34, 77–88. [Google Scholar] [CrossRef] [PubMed]
  7. Rochaix, J.D. Chlamydomonas, a model system for studying the assembly and dynamics of photosynthetic complexes. FEBS Lett. 2002, 529, 34–38. [Google Scholar] [CrossRef]
  8. Hema, R.; Senthil-Kumar, M.; Shivakumar, S.; Chandrasekhara Reddy, P.; Udayakumar, M. Chlamydomonas reinhardtii, a model system for functional validation of abiotic stress responsive genes. Planta 2007, 226, 655–670. [Google Scholar] [CrossRef] [PubMed]
  9. Siaut, M.; Cuine, S.; Cagnon, C.; Fessler, B.; Nguyen, M.; Carrier, P.; Beyly, A.; Beisson, F.; Triantaphylides, C.; Li-Beisson, Y.; et al. Oil accumulation in the model green alga Chlamydomonas reinhardtii: Characterization, variability between common laboratory strains and relationship with starch reserves. BMC Biotechnol. 2011, 11, 7. [Google Scholar] [CrossRef] [PubMed]
  10. Anderson, A.; Laohavisit, A.; Blaby, I.K.; Bombelli, P.; Howe, C.J.; Merchant, S.S.; Davies, J.M.; Smith, A.G. Exploiting algal NADPH oxidase for biophotovoltaic energy. Plant Biotechnol. J. 2015. [Google Scholar] [CrossRef] [PubMed]
  11. Rosenbaum, M.; He, Z.; Angenent, L.T. Light energy to bioelectricity: Photosynthetic microbial fuel cells. Curr. Opin. Biotechnol. 2010, 21, 259–264. [Google Scholar] [CrossRef] [PubMed]
  12. Hanke, G.; Mulo, P. Plant type ferredoxins and ferredoxin-dependent metabolism. Plant Cell Environ. 2013, 36, 1071–1084. [Google Scholar] [CrossRef] [PubMed]
  13. Arnon, D.I. The discovery of ferredoxin: The photosynthetic path. Trends Biochem. Sci. 1988, 13, 30–33. [Google Scholar] [CrossRef]
  14. Schurmann, P.; Buchanan, B.B. The ferredoxin/thioredoxin system of oxygenic photosynthesis. Antioxid. Redox Signal. 2008, 10, 1235–1274. [Google Scholar] [CrossRef] [PubMed]
  15. Nigro, D.; Blanco, A.; Anderson, O.D.; Gadaleta, A. Characterization of ferredoxin-dependent glutamine-oxoglutarate amidotransferase (Fd-GOGAT) genes and their relationship with grain protein content QTL in wheat. PLoS ONE 2014, 9, e103869. [Google Scholar] [CrossRef] [PubMed]
  16. Jacobs, J.; Pudollek, S.; Hemschemeier, A.; Happe, T. A novel, anaerobically induced ferredoxin in Chlamydomonas reinhardtii. FEBS Lett. 2009, 583, 325–329. [Google Scholar] [CrossRef] [PubMed]
  17. Buchanan, B.B.; Arnon, D.I. Ferredoxins: Chemistry and function in photosynthesis, nitrogen fixation, and fermentative metabolism. Adv. Enzymol. Relat. Areas Mol. Biol. 1970, 33, 119–176. [Google Scholar] [PubMed]
  18. Rizhsky, L.; Liang, H.; Mittler, R. The water-water cycle is essential for chloroplast protection in the absence of stress. J. Biol. Chem. 2003, 278, 38921–38925. [Google Scholar] [CrossRef] [PubMed]
  19. Asada, K. The water–water cycle in chloroplasts: Scavenging of active oxygens and dissipation of excess photons. Annu. Rev. Plant Physiol. Plant Mol. Biol. 1999, 50, 601–639. [Google Scholar] [CrossRef] [PubMed]
  20. Takahashi, S.; Murata, N. How do environmental stresses accelerate photoinhibition? Trends Plant Sci. 2008, 13, 178–182. [Google Scholar] [CrossRef] [PubMed]
  21. Noctor, G.; Foyer, C.H. Ascorbate and glutathione: Keeping active oxygen under control. Annu. Rev. Plant Physiol. Plant Mol. Biol. 1998, 49, 249–279. [Google Scholar] [CrossRef] [PubMed]
  22. Tognetti, V.B.; Palatnik, J.F.; Fillat, M.F.; Melzer, M.; Hajirezaei, M.R.; Valle, E.M.; Carrillo, N. Functional replacement of ferredoxin by a cyanobacterial flavodoxin in tobacco confers broad-range stress tolerance. Plant Cell 2006, 18, 2035–2050. [Google Scholar] [CrossRef] [PubMed]
  23. Ceccoli, R.D.; Blanco, N.E.; Medina, M.; Carrillo, N. Stress response of transgenic tobacco plants expressing a cyanobacterial ferredoxin in chloroplasts. Plant Mol. Biol. 2011, 76, 535–544. [Google Scholar] [CrossRef] [PubMed]
  24. Lin, Y.H.; Pan, K.Y.; Hung, C.H.; Huang, H.E.; Chen, C.L.; Feng, T.Y.; Huang, L.F. Overexpression of ferredoxin, PETF, enhances tolerance to heat stress in Chlamydomonas reinhardtii. Int. J. Mol. Sci. 2013, 14, 20913–20929. [Google Scholar] [CrossRef] [PubMed]
  25. Terauchi, A.M.; Lu, S.F.; Zaffagnini, M.; Tappa, S.; Hirasawa, M.; Tripathy, J.N.; Knaff, D.B.; Farmer, P.J.; Lemaire, S.D.; Hase, T.; et al. Pattern of expression and substrate specificity of chloroplast ferredoxins from Chlamydomonas reinhardtii. J. Biol. Chem. 2009, 284, 25867–25878. [Google Scholar] [CrossRef] [PubMed]
  26. Winkler, M.; Hemschemeier, A.; Jacobs, J.; Stripp, S.; Happe, T. Multiple ferredoxin isoforms in Chlamydomonas reinhardtii—Their role under stress conditions and biotechnological implications. Eur. J. Cell Biol. 2010, 89, 998–1004. [Google Scholar] [CrossRef] [PubMed]
  27. Lambertz, C.; Hemschemeier, A.; Happe, T. Anaerobic expression of the ferredoxin-encoding FDX5 gene of Chlamydomonas reinhardtii is regulated by the crr1 transcription factor. Eukaryot. Cell 2010, 9, 1747–1754. [Google Scholar] [CrossRef] [PubMed]
  28. Zuo, Z.; Chen, Z.; Zhu, Y.; Bai, Y.; Wang, Y. Effects of NaCl and Na2CO3 stresses on photosynthetic ability of Chlamydomonas reinhardtii. Biologia 2014, 69, 1314–1322. [Google Scholar] [CrossRef]
  29. Zurbriggen, M.D.; Tognetti, V.B.; Fillat, M.F.; Hajirezaei, M.R.; Valle, E.M.; Carrillo, N. Combating stress with flavodoxin: A promising route for crop improvement. Trends Biotechnol. 2008, 26, 531–537. [Google Scholar] [CrossRef] [PubMed]
  30. Ball, S.G.; Dirick, L.; Decq, A.; Martiat, J.C.; Matagne, R.F. Physiology of starch storage in the monocellular alga Chlamydomonas reinhardtii. Plant Sci. 1990, 66, 1–9. [Google Scholar] [CrossRef]
  31. Jing, S.; Björn, P.; Michael, M. Removal of nitrogen and phosphorus from wastewater using microalgae immobilized on twin layers: An experimental study. J. Appl. Phycol. 2007, 19, 417–423. [Google Scholar]
  32. Chinnasamy, S.; Bhatnagar, A.; Hunt, R.W.; Das, K.C. Microalgae cultivation in a wastewater dominated by carpet mill effluents for biofuel applications. Bioresour. Technol. 2010, 101, 3097–3105. [Google Scholar] [CrossRef] [PubMed]
  33. Kumar, D.; Yusuf, M.A.; Singh, P.; Sardar, M.; Sarin, N.B. Modulation of antioxidant machinery in α-tocopherol-enriched transgenic brassica juncea plants tolerant to abiotic stress conditions. Protoplasma 2013, 250, 1079–1089. [Google Scholar] [CrossRef] [PubMed]
  34. Choe, Y.H.; Kim, Y.S.; Kim, I.S.; Bae, M.J.; Lee, E.J.; Kim, Y.H.; Park, H.M.; Yoon, H.S. Homologous expression of γ-glutamylcysteine synthetase increases grain yield and tolerance of transgenic rice plants to environmental stresses. J. Plant Physiol. 2013, 170, 610–618. [Google Scholar] [CrossRef] [PubMed]
  35. Kavitha, K.; George, S.; Venkataraman, G.; Parida, A. A salt-inducible chloroplastic monodehydroascorbate reductase from halophyte avicennia marina confers salt stress tolerance on transgenic plants. Biochimie 2010, 92, 1321–1329. [Google Scholar] [CrossRef] [PubMed]
  36. Mano, J.; Ohno, C.; Domae, Y.; Asada, K. Chloroplastic ascorbate peroxidase is the primary target of methylviologen-induced photooxidative stress in spinach leaves: Its relevance to monodehydroascorbate radical detected with in vivo ESR. Biochim. Biophys. Acta. 2001, 1504, 275–287. [Google Scholar] [CrossRef]
  37. Giacomelli, L.; Masi, A.; Ripoll, D.R.; Lee, M.J.; van Wijk, K.J. Arabidopsis thaliana deficient in two chloroplast ascorbate peroxidases shows accelerated light-induced necrosis when levels of cellular ascorbate are low. Plant Mol. Biol. 2007, 65, 627–644. [Google Scholar] [CrossRef] [PubMed]
  38. Peden, E.A.; Boehm, M.; Mulder, D.W.; Davis, R.; Old, W.M.; King, P.W.; Ghirardi, M.L.; Dubini, A. Identification of global ferredoxin interaction networks in Chlamydomonas reinhardtii. J. Biol. Chem. 2013, 288, 35192–35209. [Google Scholar] [CrossRef] [PubMed]
  39. Allahverdiyeva, Y.; Ermakova, M.; Eisenhut, M.; Zhang, P.; Richaud, P.; Hagemann, M.; Cournac, L.; Aro, E.M. Interplay between flavodiiron proteins and photorespiration in Synechocystis sp. PCC 6803. J. Biol. Chem. 2011, 286, 24007–24014. [Google Scholar] [CrossRef] [PubMed]
  40. Singh, A.; Nigam, P.S.; Murphy, J.D. Renewable fuels from algae: An answer to debatable land based fuels. Bioresour. Technol. 2011, 102, 10–16. [Google Scholar] [CrossRef] [PubMed]
  41. Mussgnug, J.H.; Thomas-Hall, S.; Rupprecht, J.; Foo, A.; Klassen, V.; McDowall, A.; Schenk, P.M.; Kruse, O.; Hankamer, B. Engineering photosynthetic light capture: Impacts on improved solar energy to biomass conversion. Plant Biotechnol. J. 2007, 5, 802–814. [Google Scholar] [CrossRef] [PubMed]
  42. Aliverti, A.; Pandini, V.; Pennati, A.; de Rosa, M.; Zanetti, G. Structural and functional diversity of ferredoxin-NADP+ reductases. Arch. Biochem. Biophys. 2008, 474, 283–291. [Google Scholar] [CrossRef] [PubMed]
  43. Hendriks, J.H.; Kolbe, A.; Gibon, Y.; Stitt, M.; Geigenberger, P. ADP-glucose pyrophosphorylase is activated by posttranslational redox-modification in response to light and to sugars in leaves of arabidopsis and other plant species. Plant Physiol. 2003, 133, 838–849. [Google Scholar] [CrossRef] [PubMed]
  44. Geigenberger, P. Regulation of starch biosynthesis in response to a fluctuating environment. Plant Physiol. 2011, 155, 1566–1577. [Google Scholar] [CrossRef] [PubMed]
  45. Schmidt, H.; Heinz, E. Involvement of ferredoxin in desaturation of lipid-bound oleate in chloroplasts. Plant Physiol. 1990, 94, 214–220. [Google Scholar] [CrossRef] [PubMed]
  46. Wada, H.; Schmidt, H.; Heinz, E.; Murata, N. In vitro ferredoxin-dependent desaturation of fatty acids in cyanobacterial thylakoid membranes. J. Bacteriol. 1993, 175, 544–547. [Google Scholar] [PubMed]
  47. Park, D.H.; Zeikus, J.G. Improved fuel cell and electrode designs for producing electricity from microbial degradation. Biotechnol. Bioeng. 2003, 81, 348–355. [Google Scholar] [CrossRef] [PubMed]
  48. Schroder, U.; Niessen, J.; Scholz, F. A generation of microbial fuel cells with current outputs boosted by more than one order of magnitude. Angew. Chem. 2003, 42, 2880–2883. [Google Scholar] [CrossRef] [PubMed]
  49. Feng, C.; Ma, L.; Li, F.; Mai, H.; Lang, X.; Fan, S. A polypyrrole/anthraquinone-2,6-disulphonic disodium salt (PPy/AQDS)-modified anode to improve performance of microbial fuel cells. Biosens. Bioelectron. 2010, 25, 1516–1520. [Google Scholar] [CrossRef] [PubMed]
  50. Niessen, J.; Schroder, U.; Harnisch, F.; Scholz, F. Gaining electricity from in situ oxidation of hydrogen produced by fermentative cellulose degradation. Lett. Appl. Microbiol. 2005, 41, 286–290. [Google Scholar] [CrossRef] [PubMed]
  51. Rosenbaum, M.; Schroder, U.; Scholz, F. Utilizing the green alga Chlamydomonas reinhardtii for microbial electricity generation: A living solar cell. Appl. Microbiol. Biotechnol. 2005, 68, 753–756. [Google Scholar] [CrossRef] [PubMed]
  52. Pham, C.A.; Jung, S.J.; Phung, N.T.; Lee, J.; Chang, I.S.; Kim, B.H.; Yi, H.; Chun, J. A novel electrochemically active and Fe(III)-Reducing bacterium phylogenetically related to aeromonas hydrophila, isolated from a microbial fuel cell. FEMS Microbiol. Lett. 2003, 223, 129–134. [Google Scholar] [CrossRef]
  53. Gorman, D.S.; Levine, R.P. Cytochrome f and plastocyanin: Their sequence in the photosynthetic electron transport chain of Chlamydomonas reinhardii. Proc. Natl. Acad. Sci. USA 1965, 54, 1665–1669. [Google Scholar] [CrossRef] [PubMed]
  54. Smith, A.M.; Zeeman, S.C. Quantification of starch in plant tissues. Nat. Protoc. 2006, 1, 1342–1345. [Google Scholar] [CrossRef] [PubMed]
  55. Wawrik, B.; Harriman, B.H. Rapid, colorimetric quantification of lipid from algal cultures. J. Microbiol. Methods 2010, 80, 262–266. [Google Scholar] [CrossRef] [PubMed]

