Article

Pathways Regulating Spheroid Formation of Human Follicular Thyroid Cancer Cells under Simulated Microgravity Conditions: A Genetic Approach

1
Plastic, Aesthetic and Hand Surgery, Otto-von-Guericke University Clinic, Leipziger Str. 44, 39120 Magdeburg, Germany
2
Max Planck Institute for Biochemistry, Am Klopferspitz 18, 82152 Martinsried, Germany
3
Institute of Biomedicine, Aarhus University, Wilhelm Meyers Allé 4, 8000 Aarhus C, Denmark
4
Medical Research Laboratory, Department of Clinical Medicine, Faculty of Health, Aarhus University, 8000 Aarhus C, Denmark
*
Author to whom correspondence should be addressed.
Int. J. Mol. Sci. 2016, 17(4), 528; https://doi.org/10.3390/ijms17040528
Submission received: 28 January 2016 / Revised: 18 March 2016 / Accepted: 28 March 2016 / Published: 8 April 2016
(This article belongs to the Special Issue Tumor Microenvironment and Metabolism)

Abstract

:
Microgravity induces three-dimensional (3D) growth in numerous cell types. Despite substantial efforts to clarify the underlying mechanisms for spheroid formation, the precise molecular pathways are still not known. The principal aim of this paper is to compare static 1g-control cells with spheroid forming (MCS) and spheroid non-forming (AD) thyroid cancer cells cultured in the same flask under simulated microgravity conditions. We investigated the morphology and gene expression patterns in human follicular thyroid cancer cells (UCLA RO82-W-1 cell line) after a 24 h-exposure on the Random Positioning Machine (RPM) and focused on 3D growth signaling processes. After 24 h, spheroid formation was observed in RPM-cultures together with alterations in the F-actin cytoskeleton. qPCR indicated more changes in gene expression in MCS than in AD cells. Of the 24 genes analyzed VEGFA, VEGFD, MSN, and MMP3 were upregulated in MCS compared to 1g-controls, whereas ACTB, ACTA2, KRT8, TUBB, EZR, RDX, PRKCA, CAV1, MMP9, PAI1, CTGF, MCP1 were downregulated. A pathway analysis revealed that the upregulated genes code for proteins, which promote 3D growth (angiogenesis) and prevent excessive accumulation of extracellular proteins, while genes coding for structural proteins are downregulated. Pathways regulating the strength/rigidity of cytoskeletal proteins, the amount of extracellular proteins, and 3D growth may be involved in MCS formation.

Graphical Abstract

1. Introduction

Altered gravity conditions, such as real or simulated microgravity (µg), offer new and unique approaches to cell biology in general and tissue engineering in particular. Research in Space and experiments using ground-based facilities, such as the fast rotating clinostat (FRC), the random positioning machine (RPM) or rotating wall vessel (RWV) have revealed microgravity-dependent alterations of extracellular matrix proteins and the cytoskeleton, changes in apoptosis, proliferation, and differentiation as well as differences in the growth behavior of human cells [1,2,3,4]. Moreover, microgravity has been shown to promote the scaffold-free growth of 3D multicellular constructs from a monolayer culture of a variety of different cell types, with striking resemblance to actual in vivo tissue in several cases [5,6,7].
During the last few years, we have focused on the behavior of malignant thyroid cells [8] under conditions of altered gravity and vibration [9]. We have exposed different healthy and malignant human thyroid cell lines to both real (on parabolic flight campaigns and on the SimBox/Shenzhou-8 Space Mission) and simulated (RPM) µg for different time periods [2,3,4,8,10,11,12,13,14]. These studies showed that healthy and malignant human thyroid cell lines share the capability to form 3D multicellular spheroids (MCS) after exposure to annulled gravity conditions for various time periods [10,11,12]. In general, the cell lines exhibited a similar behavior overall with some differences in detail concerning gene and protein expression as well as the speed of aggregation [2]. The MCS are of great interest for cancer research, because they provide the possibility to study cancer cells in vitro. They provide a 3D structure with a known cellular composition. In this state, the cells interact with each other in a 3D way like they do in vivo, but differently to being grown within monolayers. In addition, the spheroids′ cells show a much higher invasive potential than monolayer cells [15]. Therefore, by investigating formation and growth of MCS, it might be possible to learn about the formation of metastases and thus to find new, so far neglected targets for cancer therapy/suppression.
Based on the findings of our previous studies, the aim of this study was to further analyze candidate genes and proteins in MCS of human UCLA RO82-W-1 grown on a RPM after 24 h and identify pathways involved in MCS formation by employing both molecular biological (quantitative real-time PCR) as well as in silico (Partek analyses) methods.

2. Results and Discussion

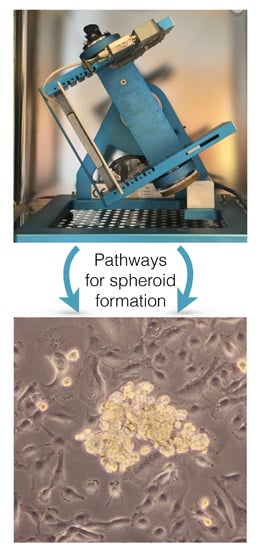
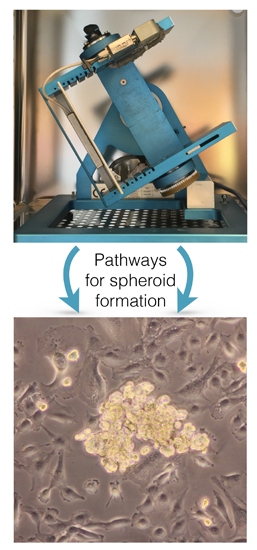
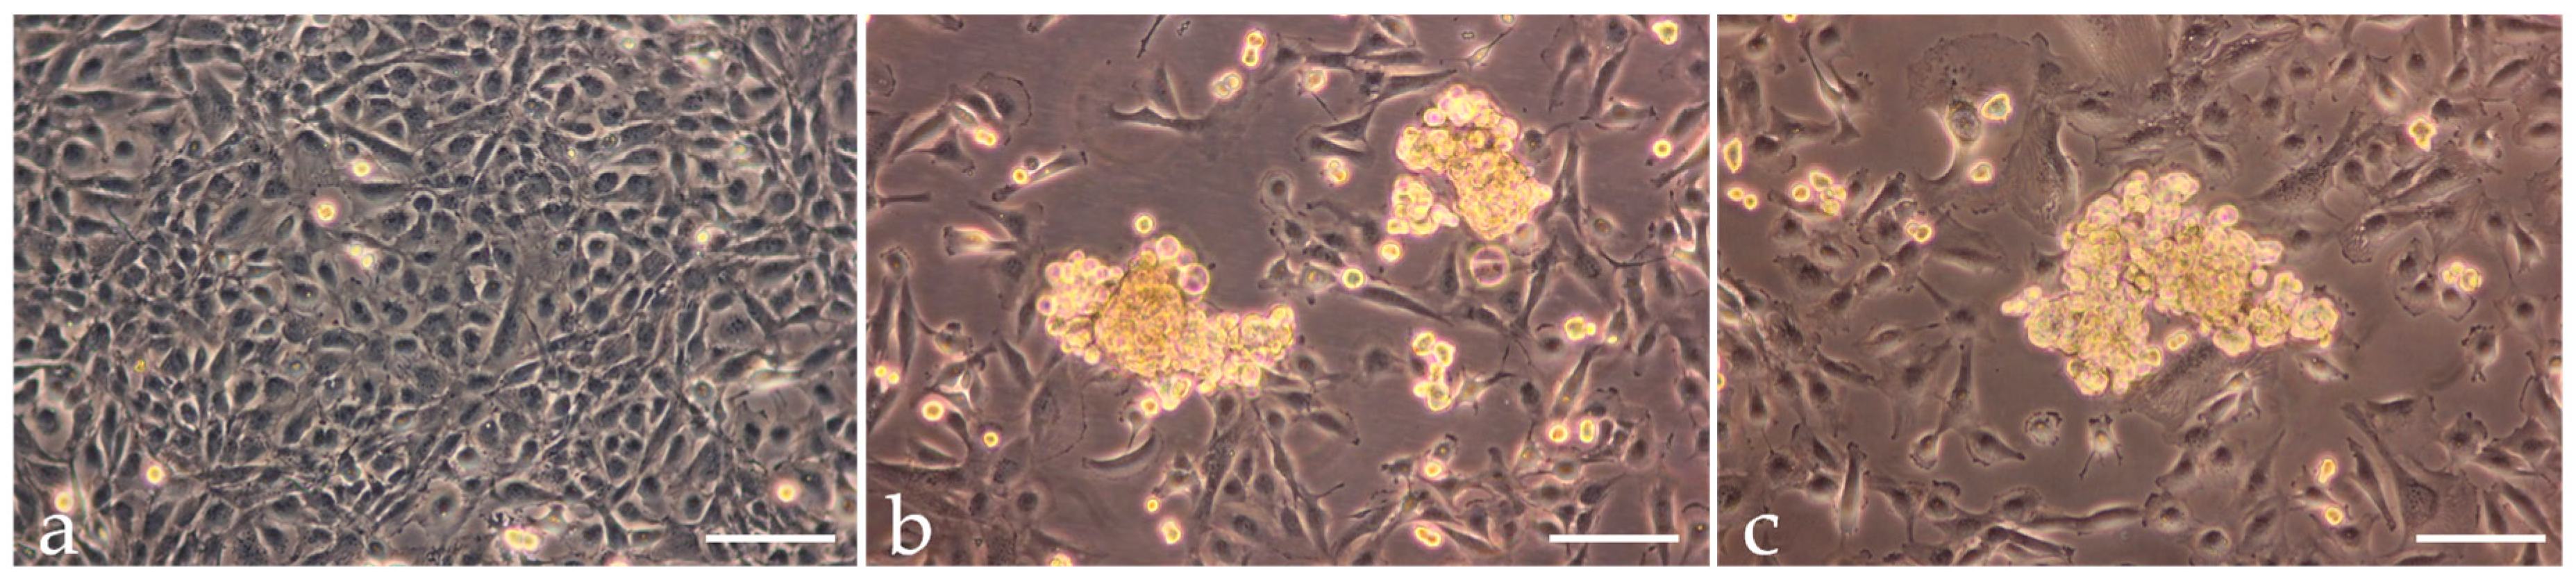
2.1. Spheroid Formation

Phase contrast microscopy revealed that the static control UCLA RO82-W-1 cells grew as a normal monolayer, when the cell culture flasks were placed next to the RPM in the incubator (Figure 1a). However, after a 24 h-exposure of UCLA RO82-W-1 follicular thyroid cancer cells to the RPM, two types of growth were observed: irrespectively of the culture dish used, one part of the cells grew as 3D aggregates, the other part as a two-dimensional monolayer (Figure 1b,c).
This process is well known and has been detected in populations of various types of cells including endothelial cells, chondrocytes, and thyrocytes [6]. It occurs by culturing normal and malignant cells and seems to be due to the effects of microgravity but not to healthy or malignant states of the cells [6,8,14]. Follicle formation can also be induced when the cells are cultured on agarose-coated dishes with a special follicle induction medium [16] or by using the liquid-overlay technique [12]. From these studies, we concluded that a set of proteins interacting properly with each other, drive a cell into a 3D kind of growth. This set is not specific for thyroid cells and does not comprise all proteins changeable under microgravity. For example, thyroid hormones and thyroglobulin are reduced as well as TSH receptors are changed when thyroid cells are cultured under microgravity conditions, while spheroid formation occurs even in their absence [3,17].
Moreover, in the adherent part of the RPM-exposed UCLA RO82-W-1 cell stress fibers are visible as well as lamellipodia, filopodia, and microvilli (Figure 2b), which cannot be detected in the corresponding 1g-control cells (Figure 2a). This is also in accordance with earlier studies performed on human cells exposed to microgravity, which demonstrated that the cytoskeletal proteins are a preferred target affected by conditions of real and simulated microgravity, irrespectively of whether a cell remains adherent or forms MCS [12,13,18,19].

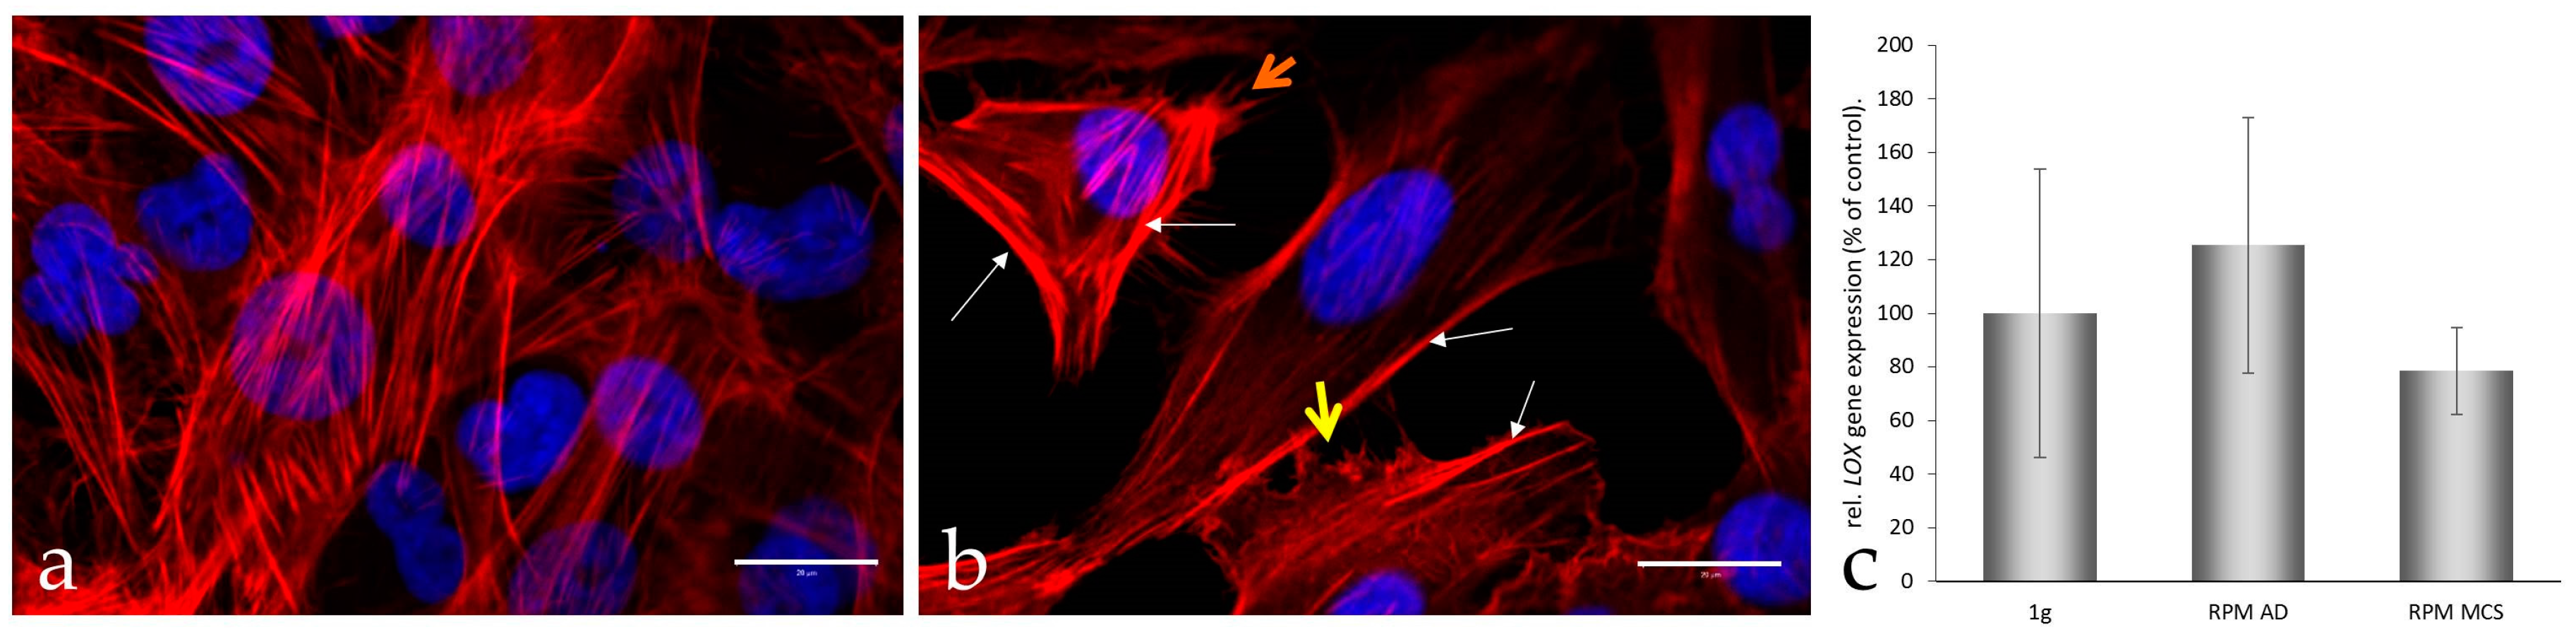
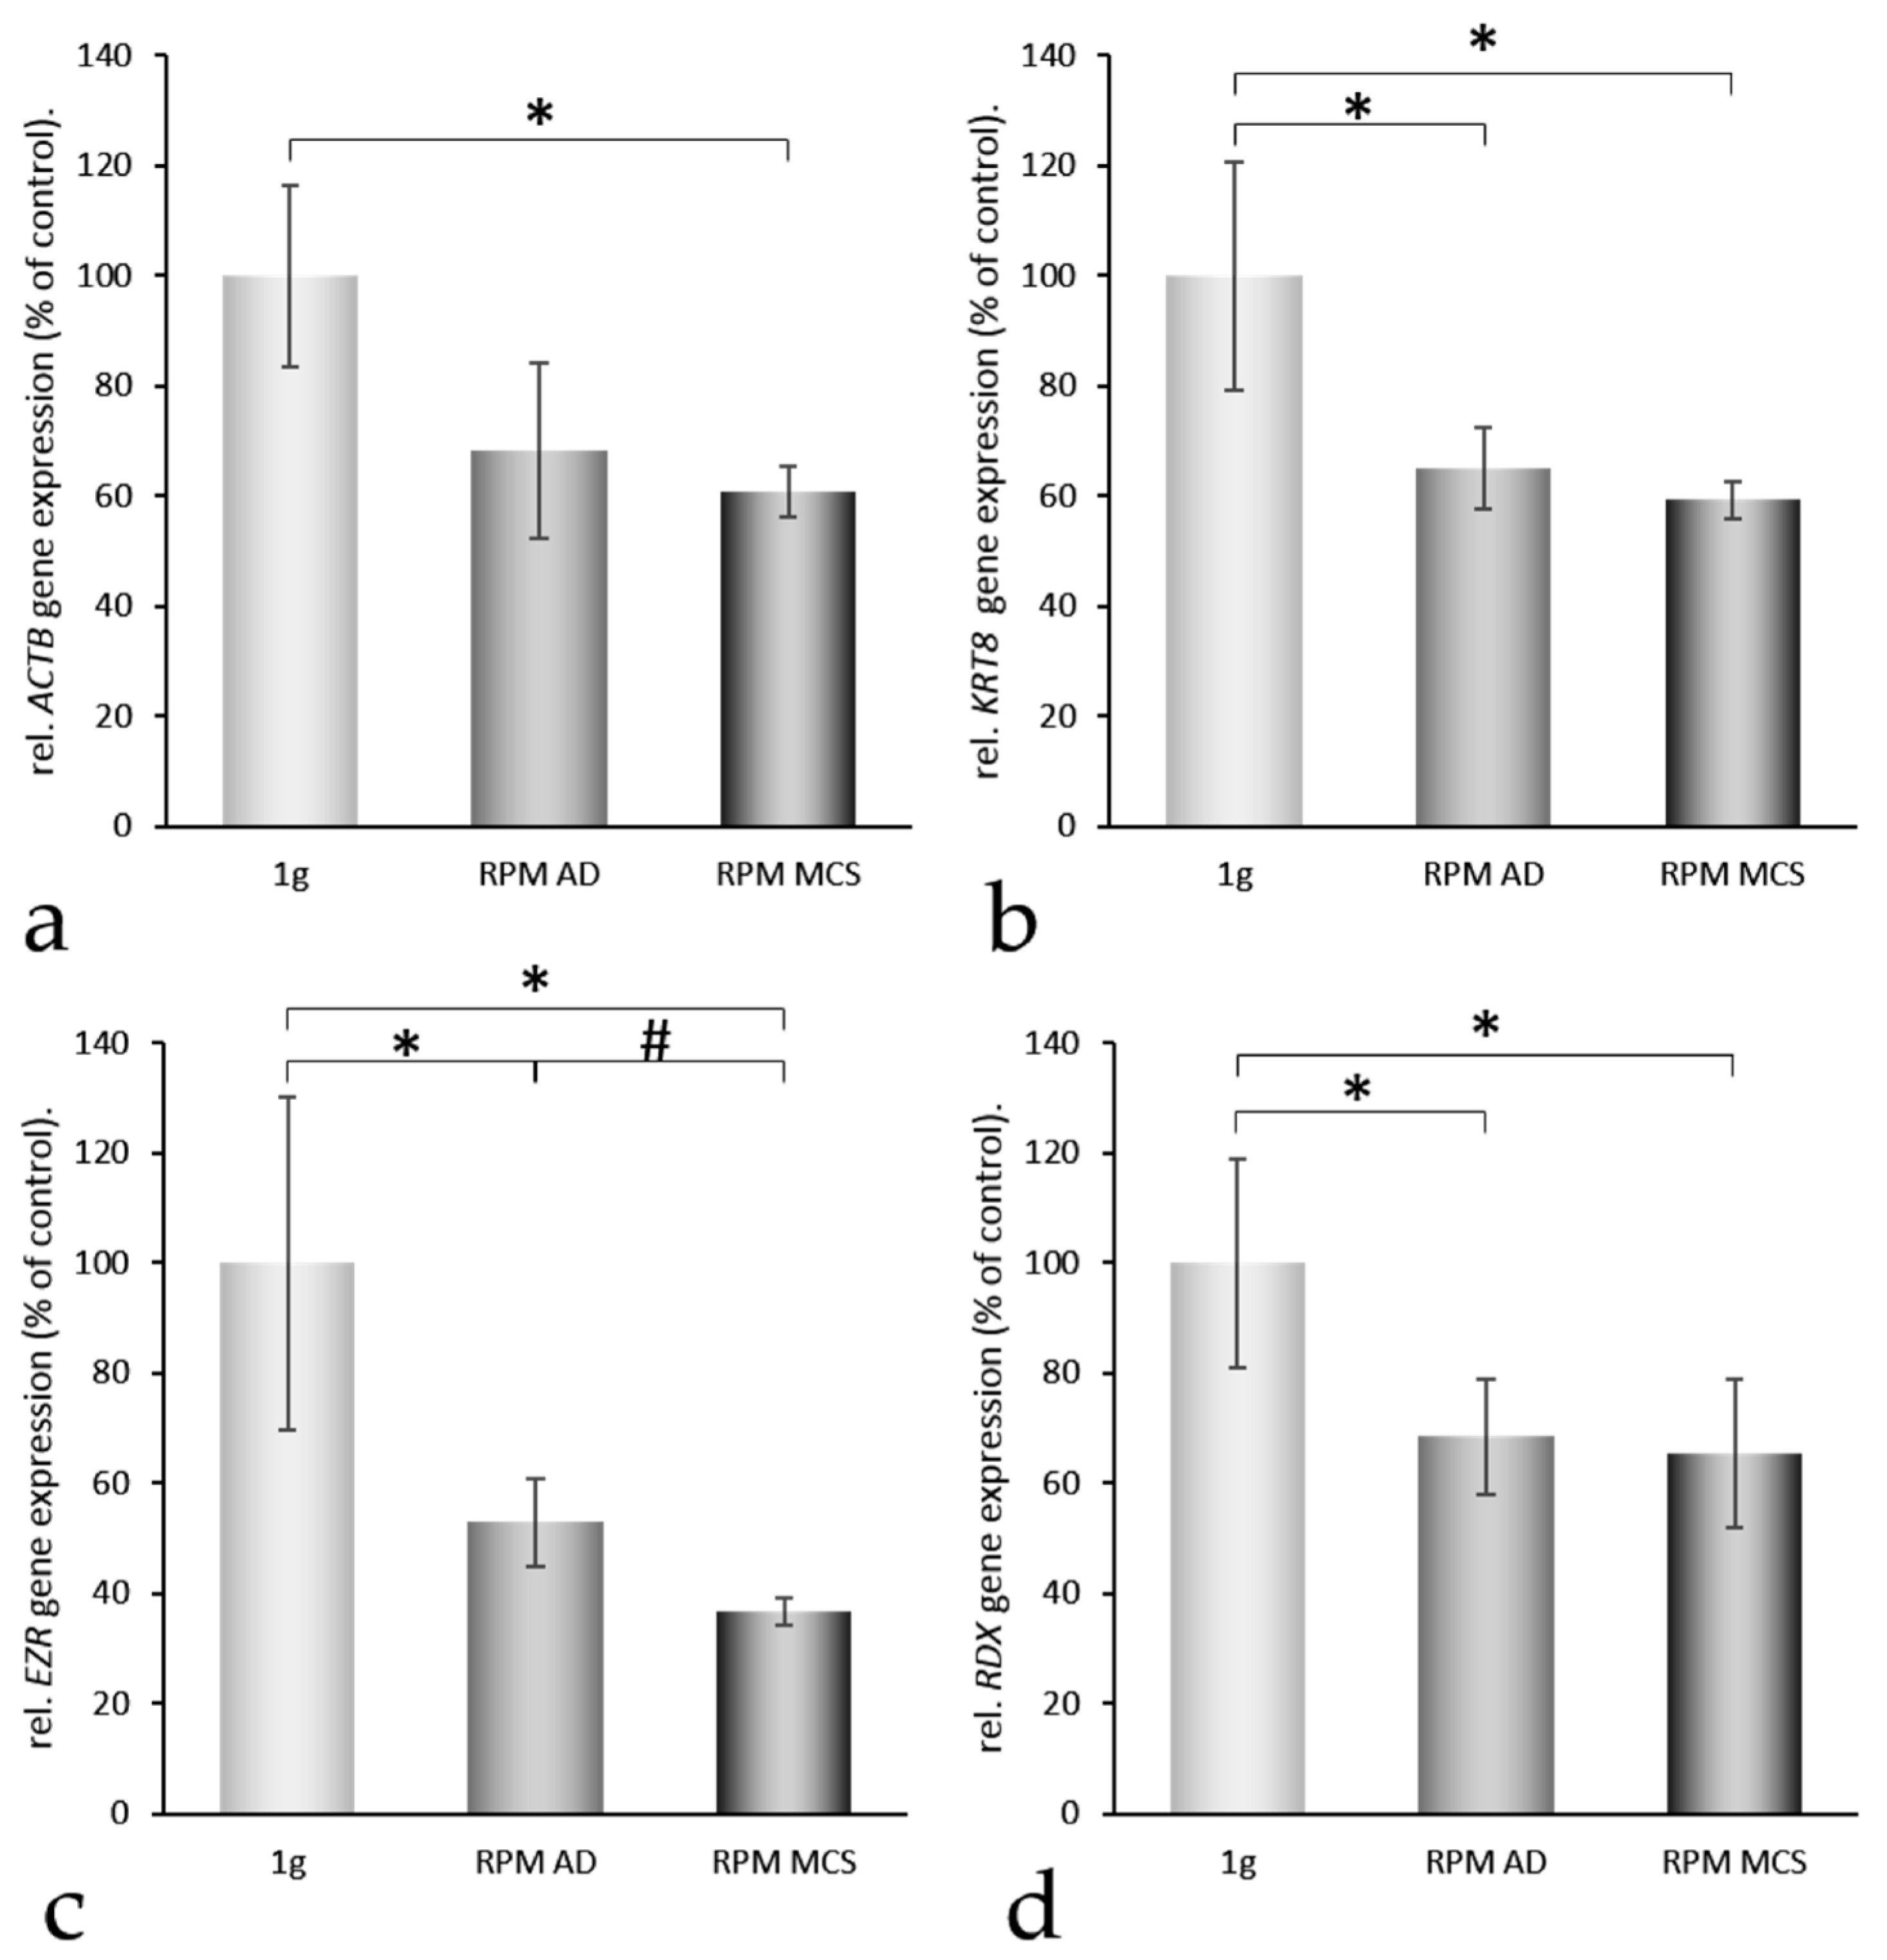
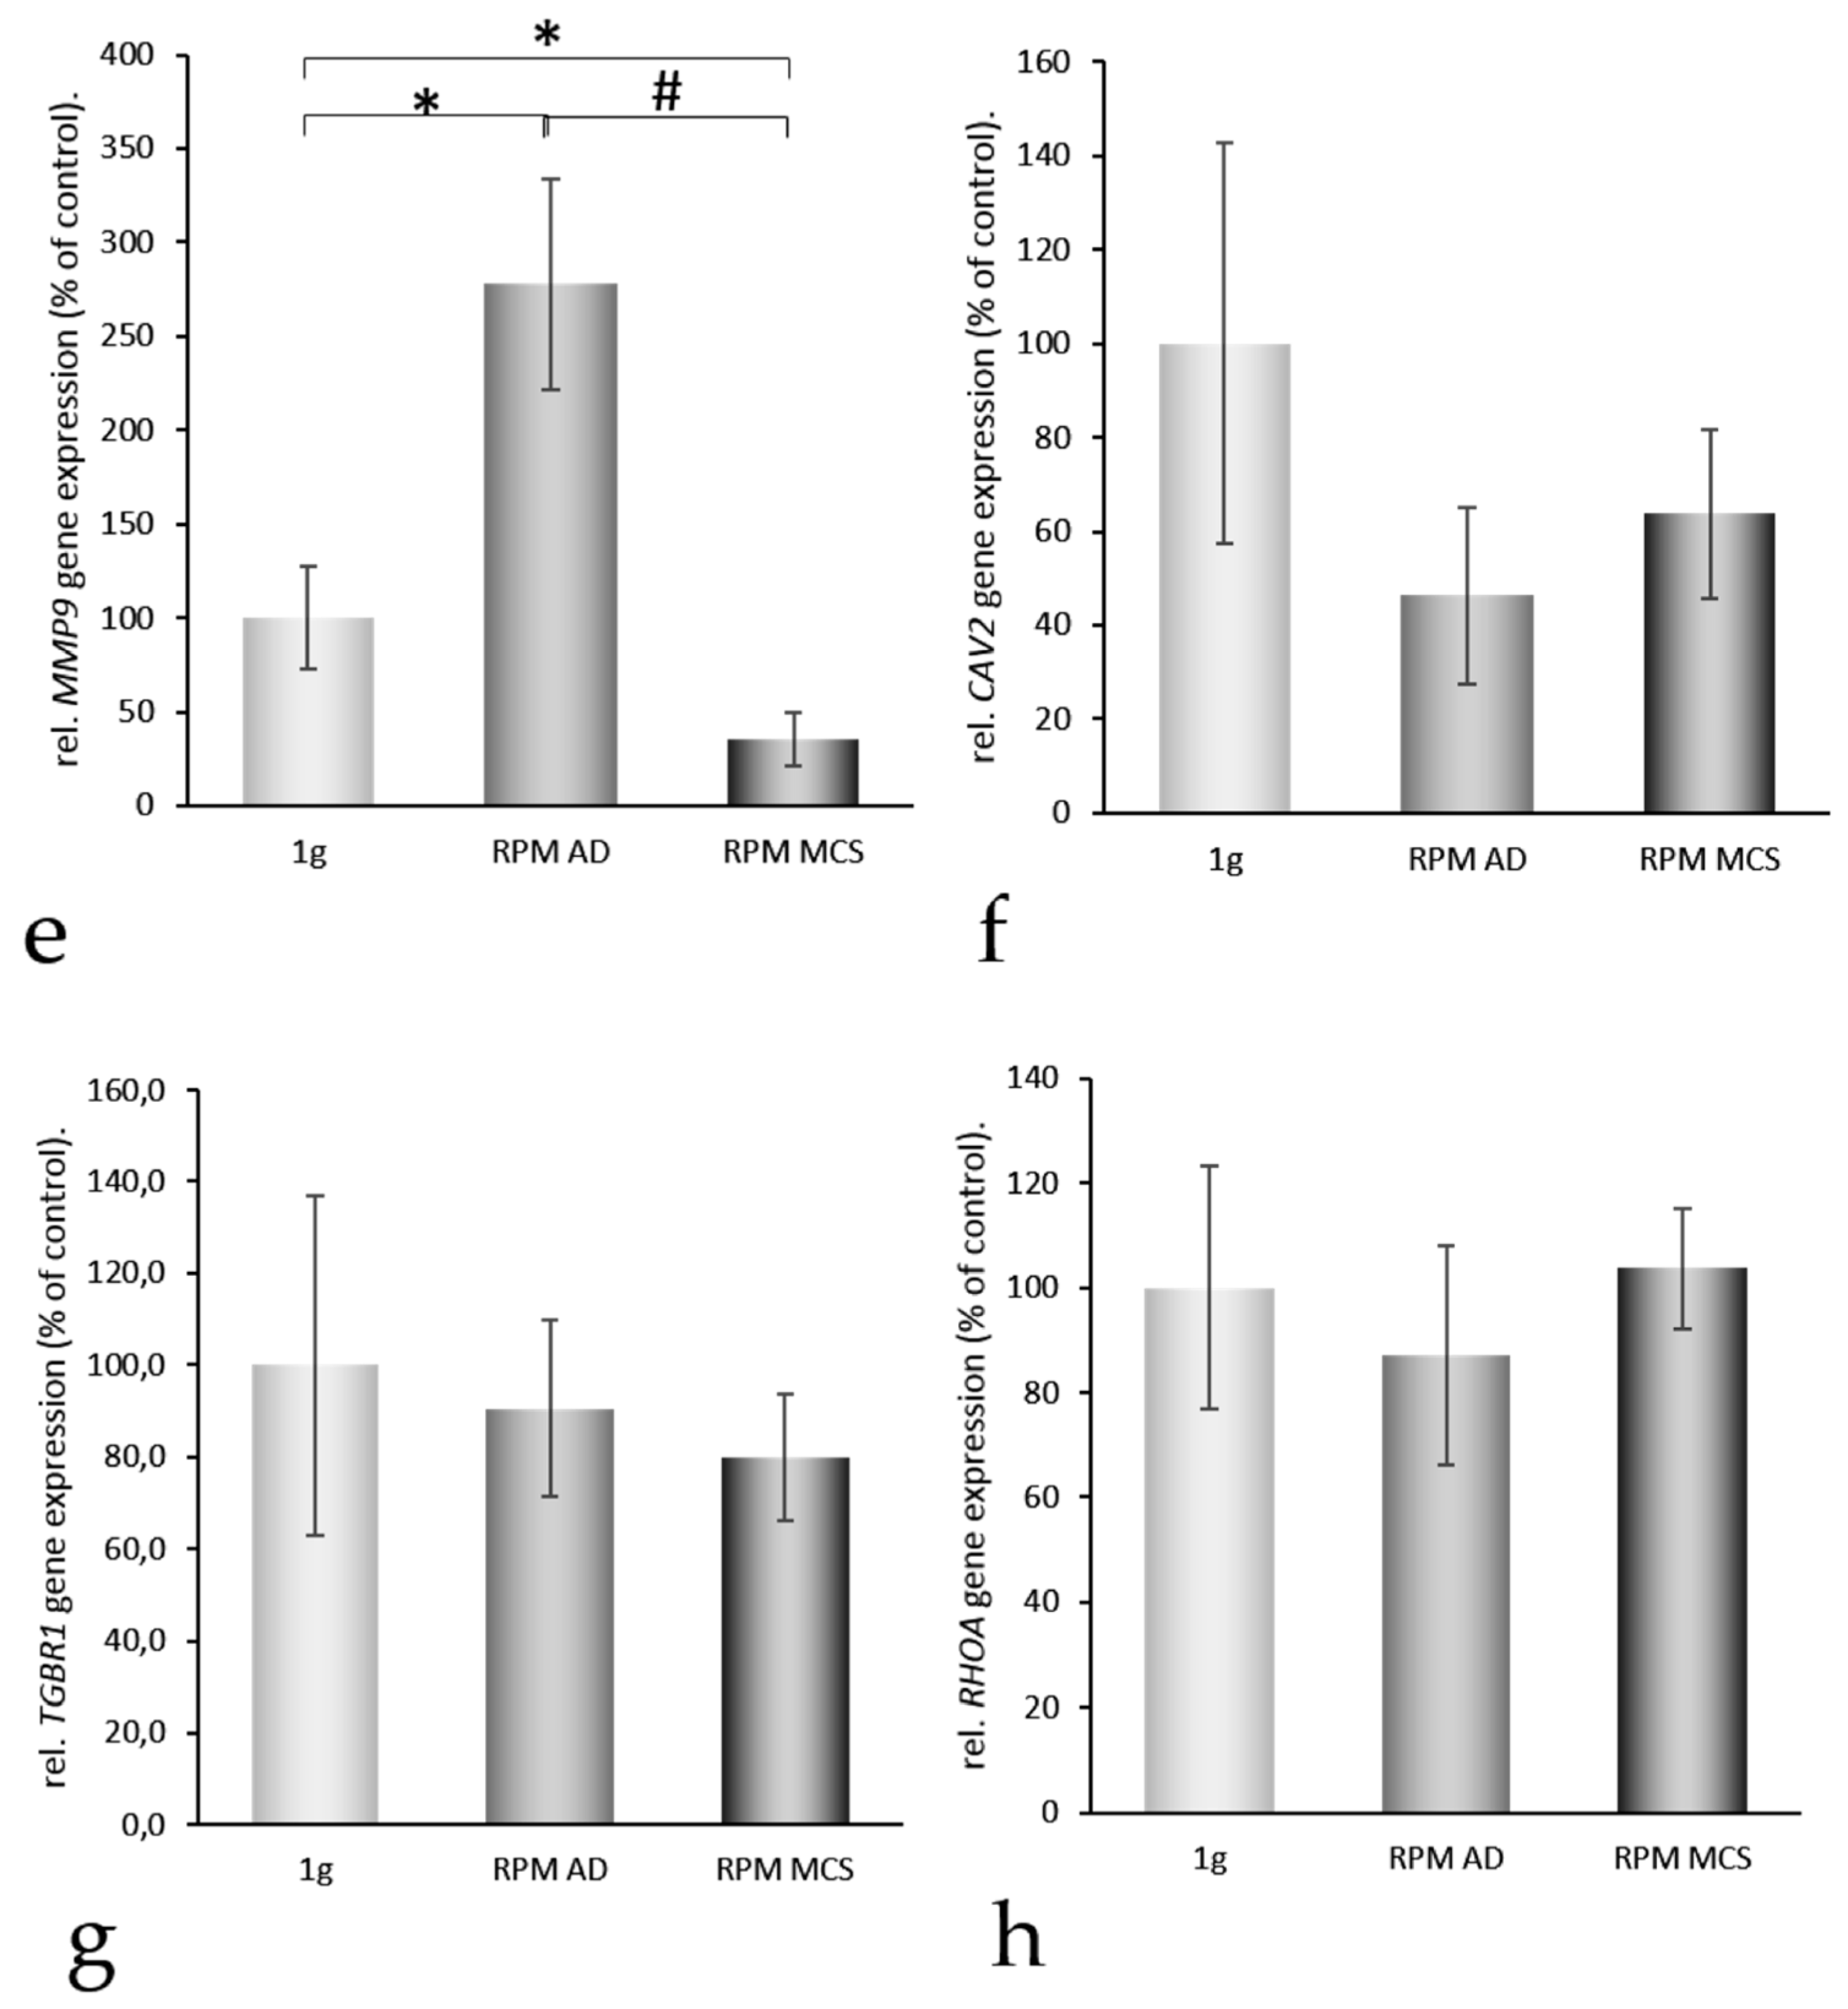
2.2. Impact of Simulated Microgravity on the Activation of Genes Coding for Selected Proteins

In order to find reasons for the transition of the cells from a two- to a three-dimensional kind of growth, we selected 24 genes (Table 1), which attracted attention in our earlier proteomic and genomic studies on spheroid formation of various types of cells [6,18,20]. The genes to be analyzed were selected from a number of preceding publications, where we found that cytoskeletal proteins change, that an overgrowth of extracellular proteins can prevent spheroid formation, that membrane proteins influence this process, and that nuclear proteins are activated [2,4,10,21]. These genes are coding for proteins belonging to three groups: (i) proteins establishing and regulating cell structures (Figure 3a–g); (ii) extracellular proteins regulating the cell behavior (Figure 2c, Figure 4 and Figure 5); and (iii) proteins involved in angiogenesis and signaling processes (Figure 3h, Figure 4 and Figure 5). A Pathway Studio analysis revealed that aside from TUBB, the expression of the genes is mutually controlled within the frame of a network (Figure 6). The proteins coded by these genes consisted of five membrane proteins, nine soluble factors, and nine extracellular proteins. They also form a network of regulation, which stretches across the membranes (Figure 7).
In order to examine the impact of an up- or downregulation of a given gene on the other members of the network, we determined the expression of the selected genes in cells exposed to the RPM or cultured under normal 1g-conditions. For this purpose, the mRNA expression of the genes was determined by qPCR after they had been cultured on (AD or MCS cells) or next (1g-controls) to the RPM for 24 h.
The actin cytoskeleton is involved in adhesion molecule clustering. Therefore, we investigated first the effects exerted by simulated microgravity on the mRNA expression of VCAM and cytoskeletal proteins. The gene expression of ACTB and ACTA2 was reduced in MCS and AD cells (Figure 3a,e) compared with 1g-controls. In addition, the gene expression of KRT8 and TUBB was downregulated in MCS (Figure 3b,f). Furthermore, the EZR mRNA was clearly decreased in RPM AD samples and further downregulated in MCS compared with 1g-samples (Figure 3c). RPM-exposure reduced the RDX gene expression significantly in both groups—AD and MCS (Figure 3d), whereas MSN decreased in AD, but was elevated in MCS (Figure 3g). There was a tendency of VCAM upregulation in AD cells and of a downregulation in MCS (Figure 3h). Taking together the results shown in Figure 3 clearly shows that the expression of the examined genes related to the cytoskeleton was downregulated during spheroid formation early within 24 h

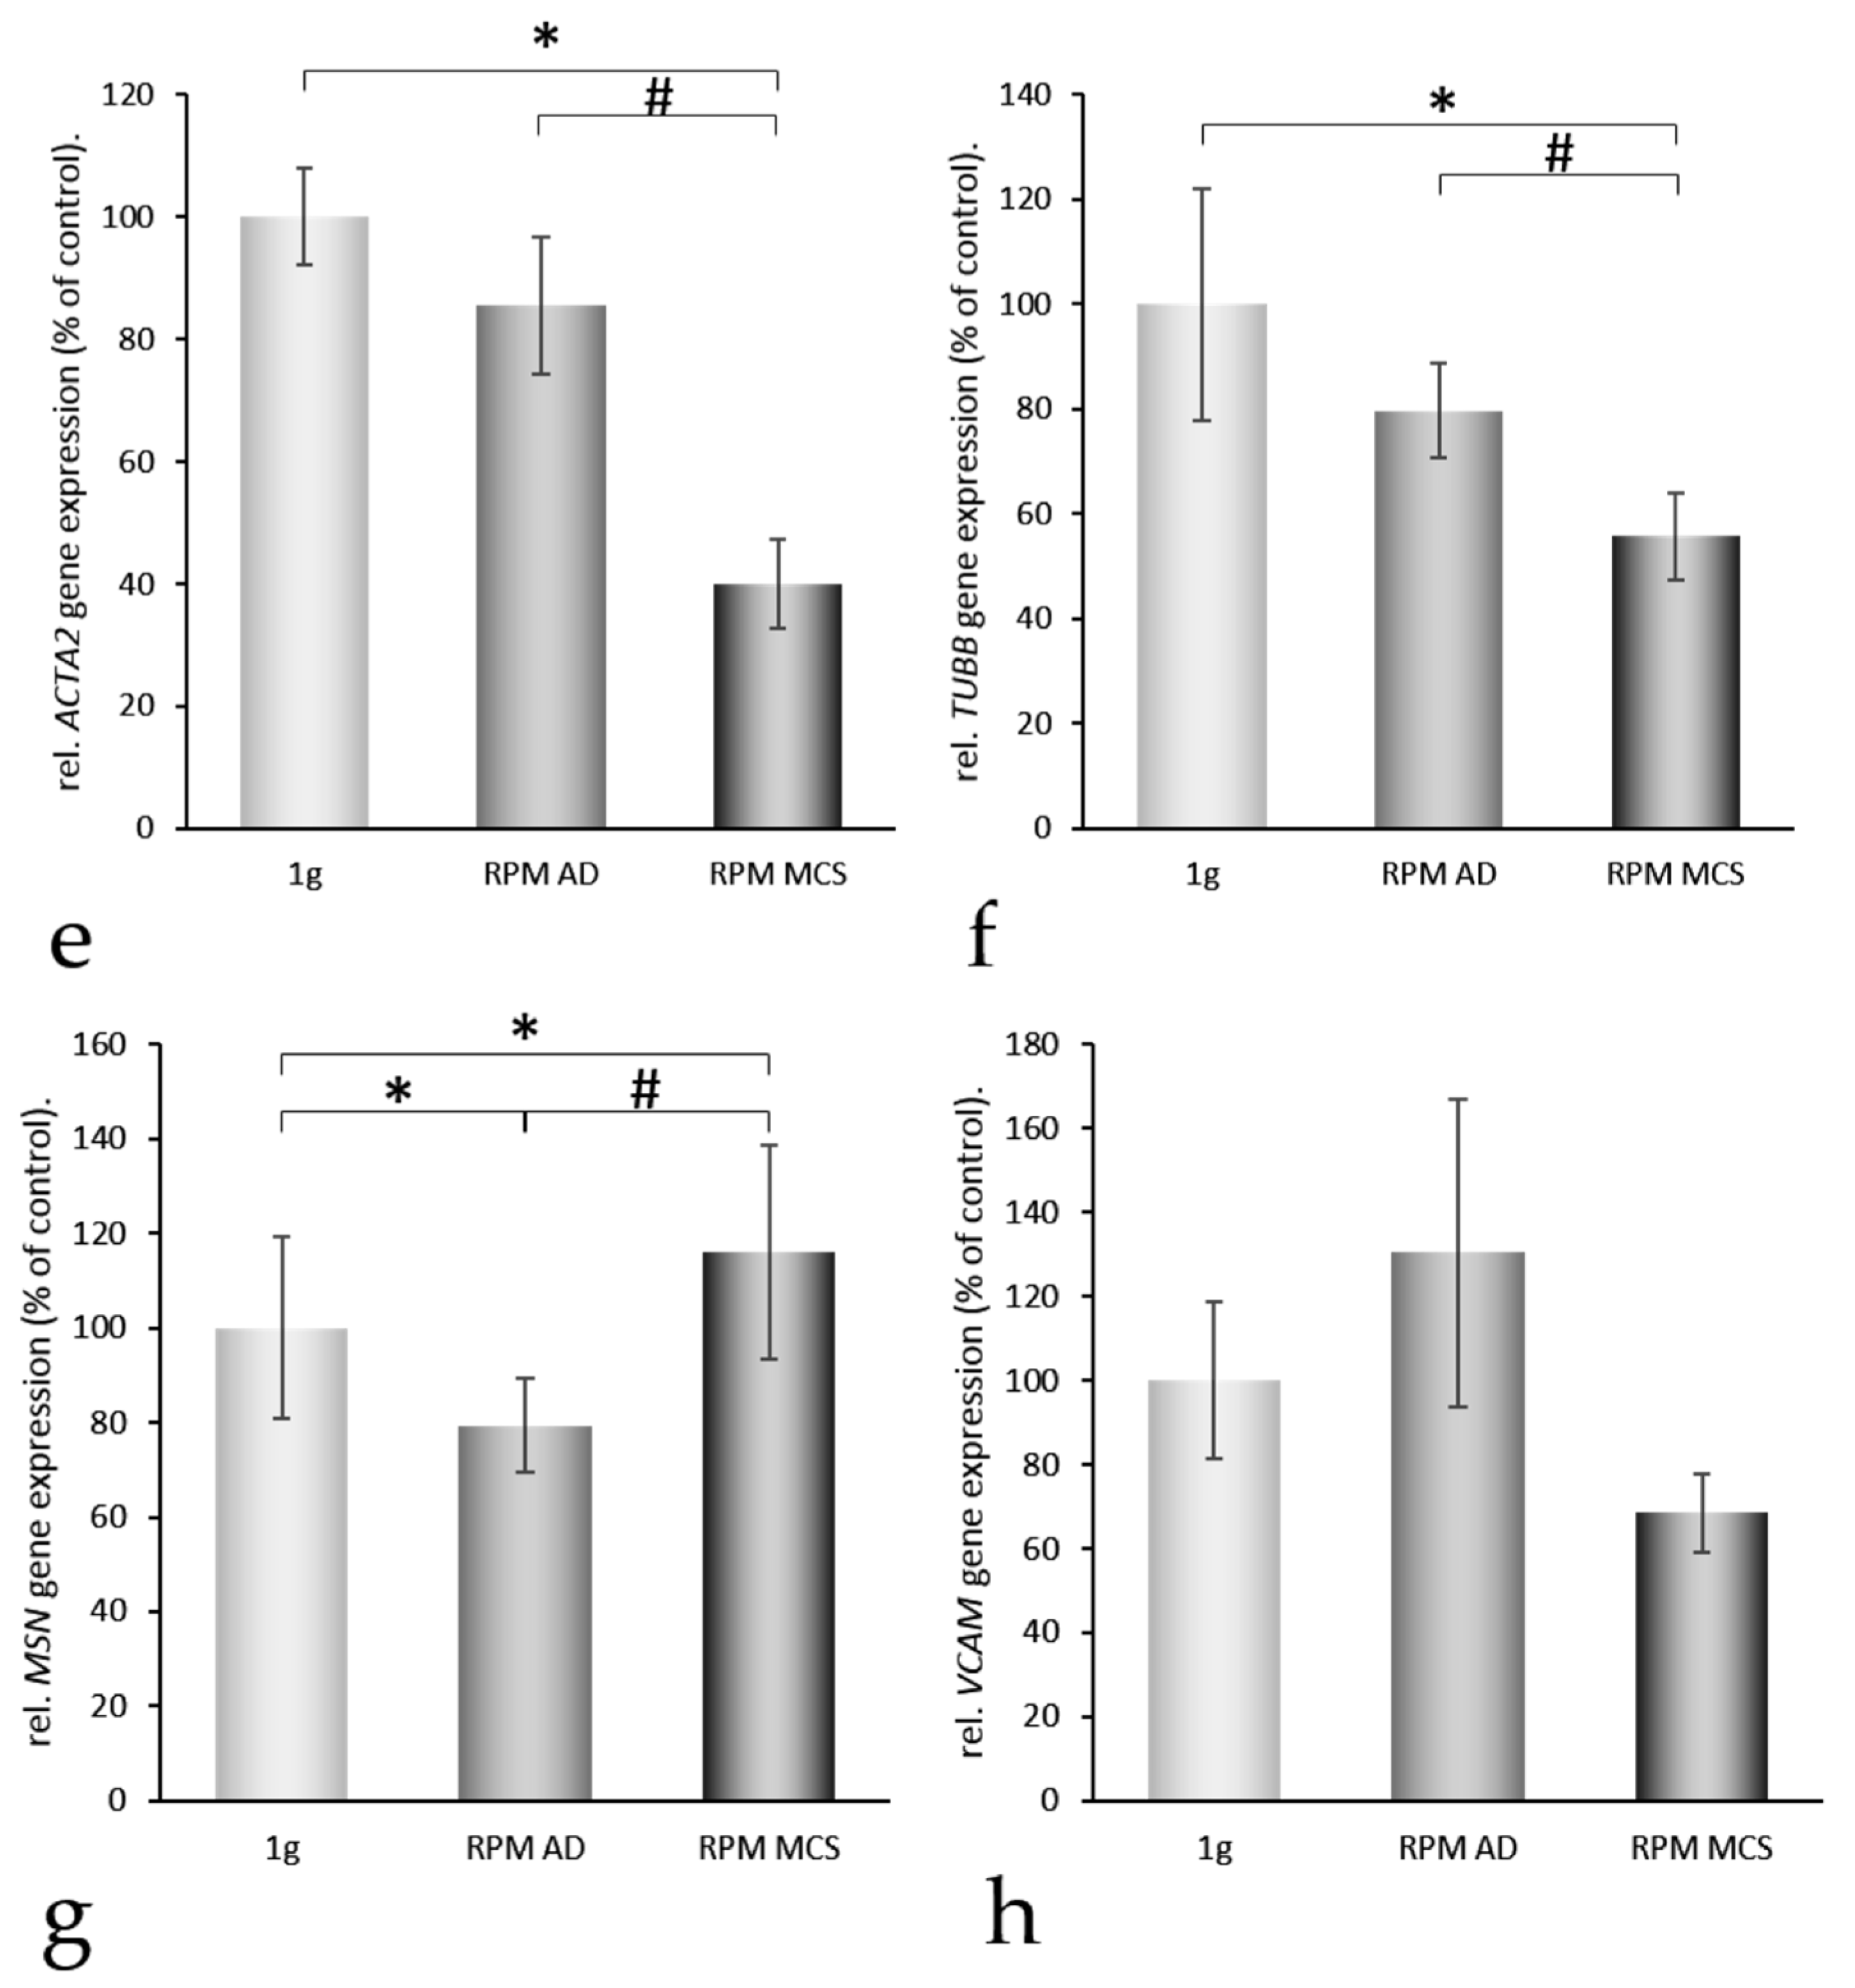
2.3. Three-Dimensional Growth Signaling Pathways

Nothing is known about the role of typical angiogenic factors in the early phases of MCS formation. Here we detected a 2.5-fold increase in the VEGFA gene expression in MCS samples (Figure 4a) and a 5-fold increase in VEGF protein released in the supernatant (Figure 4e). We could also find an upregulated gene expression of VEGFD in MCS samples of UCLA RO82-W-1 cells (Figure 4b). The VEGFR2 (FLK1) mRNA appeared to be slightly although not significantly downregulated in RPM-samples after 24 h (Figure 4f). The AKT1 gene expression remained unchanged (Figure 4c). Focusing on the protein kinase C (PKC) pathway, which is involved in cell proliferation and is affected during spheroid formation [10], we could measure a clear reduction of PRKCA mRNA after RPM-exposure in AD and MCS samples compared with corresponding static 1g-controls (Figure 4g). As a representative member of growth factors influencing cell proliferation we investigated possible changes in the connective tissue growth factor (CTGF) gene expression. After a 24 h-RPM-exposure, CTGF mRNA was downregulated (Figure 4d). Monocyte Chemoattractant Protein-1 (MCP-1) had been identified to play an important role in 3D formation under conditions of weightlessness [21]. The MCP1 gene expression was downregulated in MCS (Figure 4h), but remained unchanged in AD cells. Hence Figure 4 shows that two of the angiogenic-related genes (VEGFA, VEGFD) after RPM-exposure of the cells were upregulated.
We previously have shown that genes and proteins involved in the regulation of FTC-133 thyroid cancer cell proliferation and metastasis, such as VEGFA and VEGFD were similarly regulated under long-term RPM and spaceflight conditions (10 days microgravity) [4]. After 10 days in Space, we detected a reduced VEGFA mRNA in RPM AD cells and MCS cultures, as well as spaceflight AD cells and MCS cultures [4]. Interestingly, the VEGFD mRNA was increased in the RPM and in Space cultures of the Shenzhou-8 Space Mission [4], which is comparable to the 24 h-result in UCLA RO82-W-1 RPM samples.

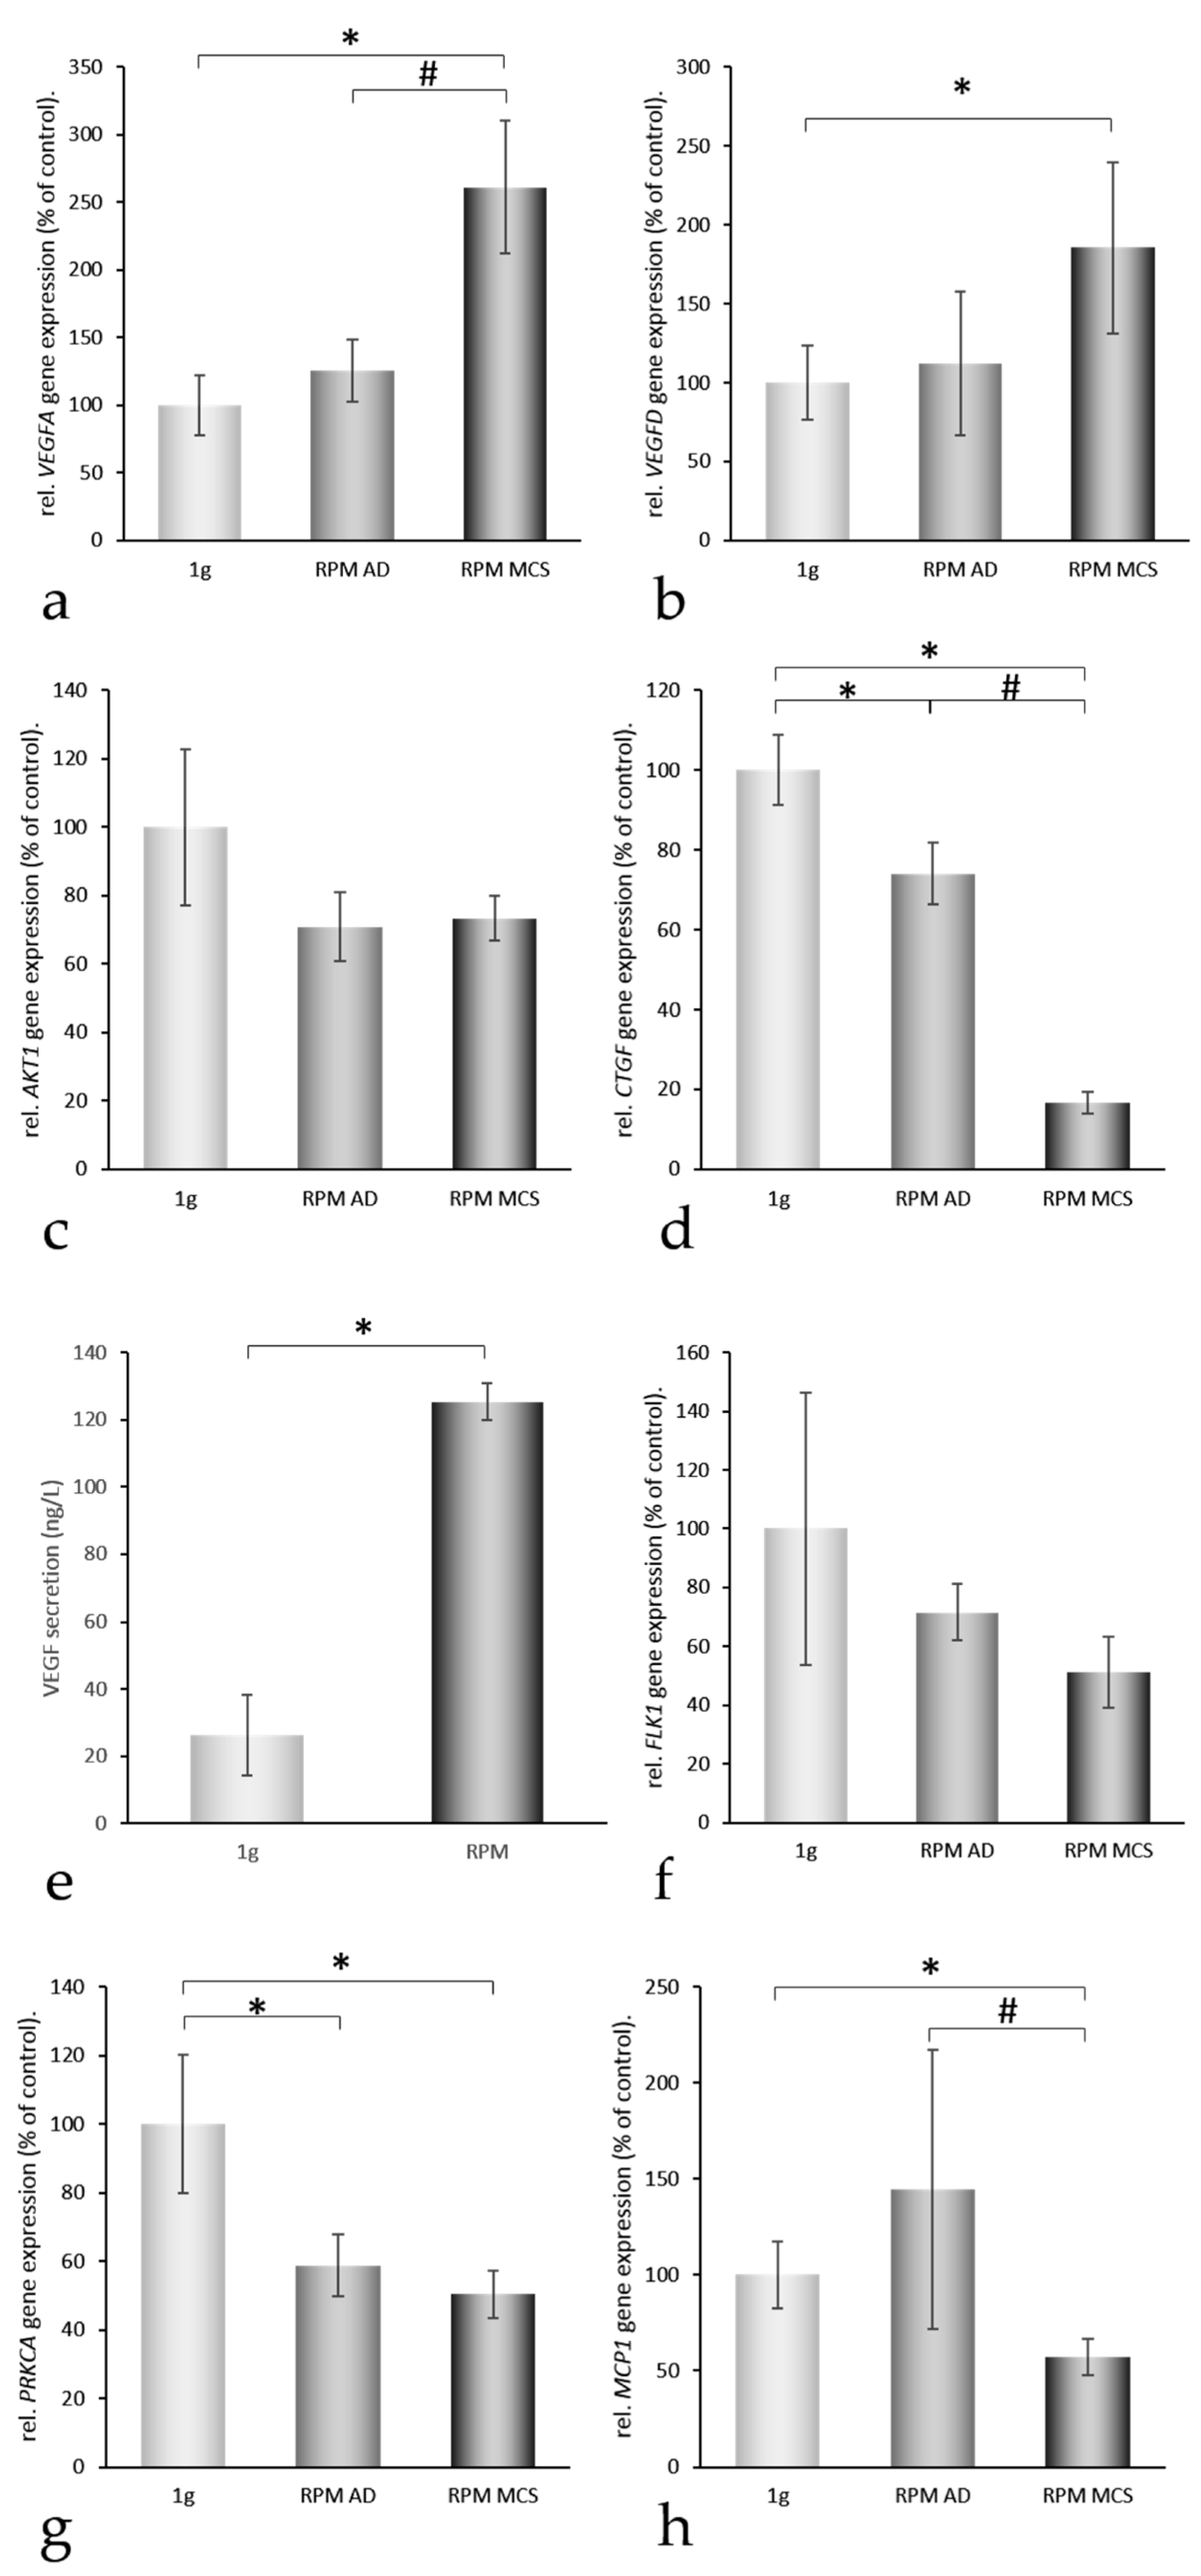
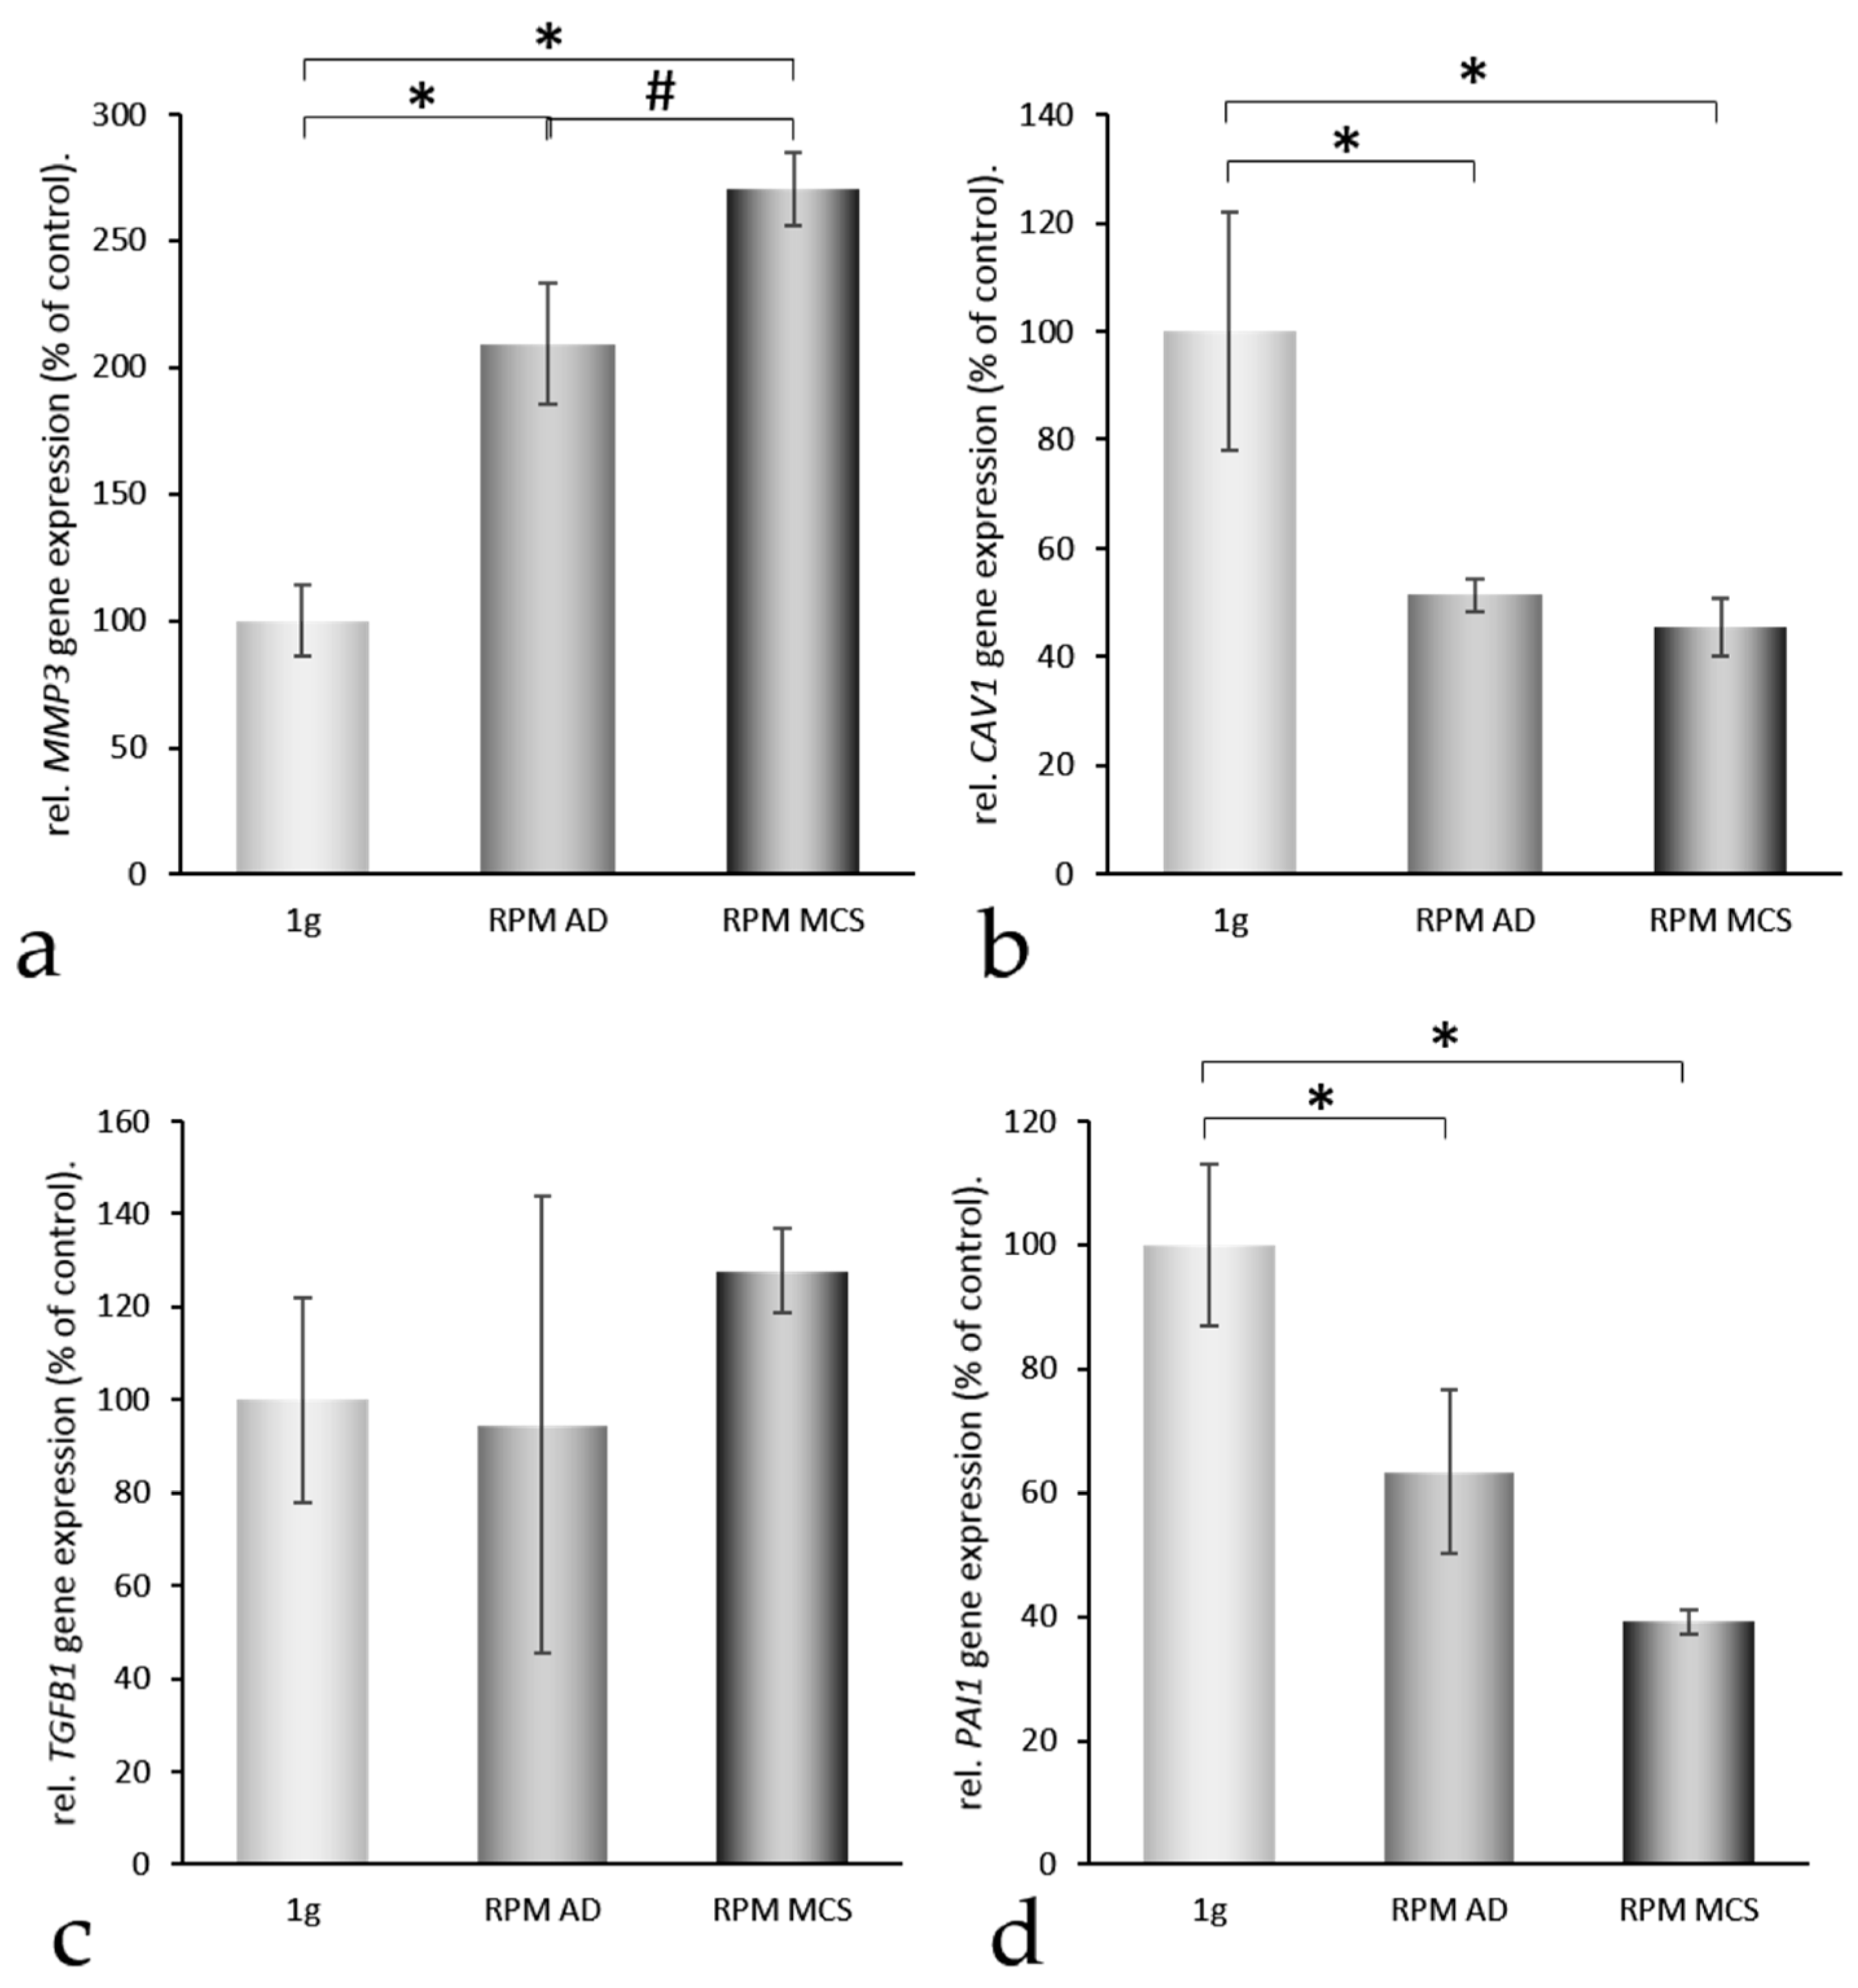
2.4. Factors Regulating the Amount of Extracellular Proteins

We described recently that the quantities of extracellular matrix (ECM) proteins play a decisive role in spheroid formation [22]. An increased ECM together with enhanced amounts of Caveolin-1, which scaffolds several proteins like PKC or KDR within the membrane [21,22] can cause a firm anchoring of the cells within the ECM and inhibits spheroid formation [22].
Therefore, we also studied gene alterations of the matrix metalloproteinases MMP3 and MMP9. They are known to play a role in regulating the amount of extracellular matrix proteins [23,24]. Both, MMP3 and MMP9 mRNAs were significantly elevated in AD cells (Figure 5a,e). MMP3 was further enhanced in MCS compared with 1g-controls, whereas MMP9 was blunted in MCS samples (Figure 5a,e). Caveolin-1 and -2 were both expressed by UCLA RO82-W-1 cells. The CAV1 mRNA was downregulated in AD and MCS (Figure 5b). A similar result was obtained for CAV2 (Figure 5f). Both TGFB1 and TGFBR1 gene expression remained unaltered (Figure 5c,g).
Recent pathway analyses demonstrated that enhanced concentrations of plasminogen might inhibit spheroid formation [21,22]. We measured the plasminogen activator inhibitor-1 (PAI1) gene expression. PAI1 was significantly downregulated in AD and MCS samples (Figure 5d), which may favor the degradation of extracellular plasminogen [25]. In addition, the RHOA mRNA was not altered after a 24 h-RPM-exposure (Figure 5h).

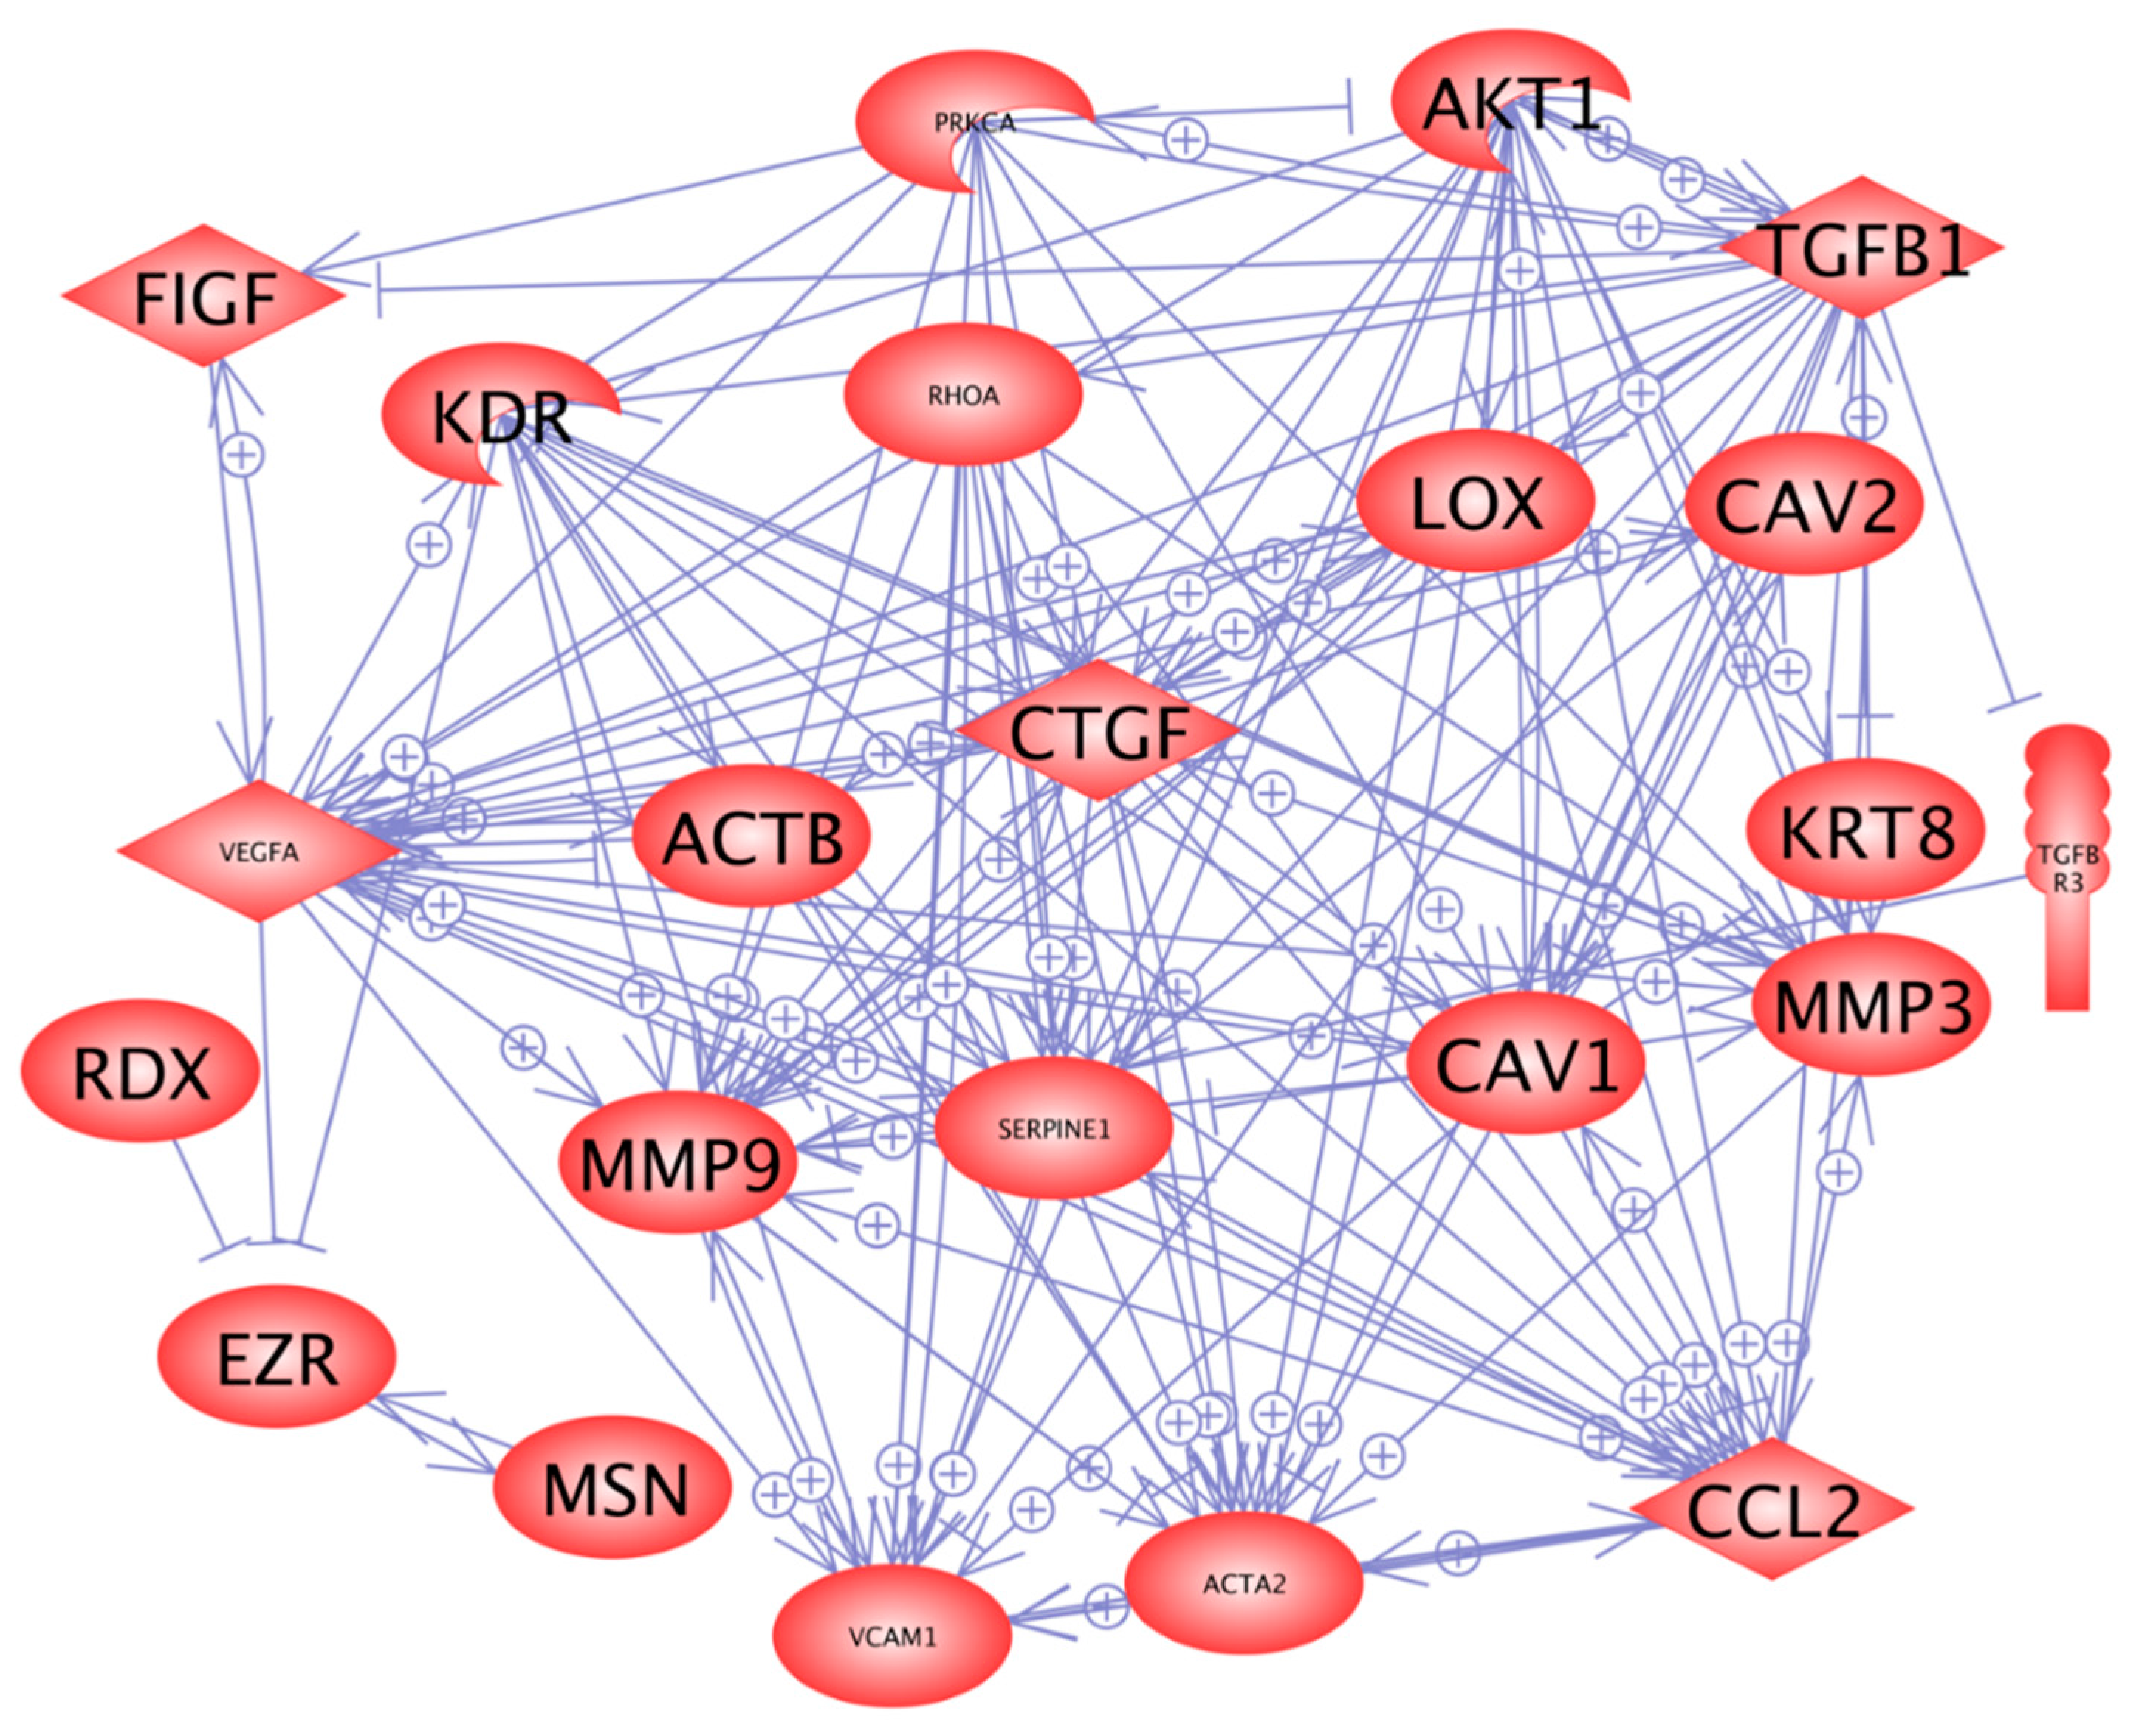
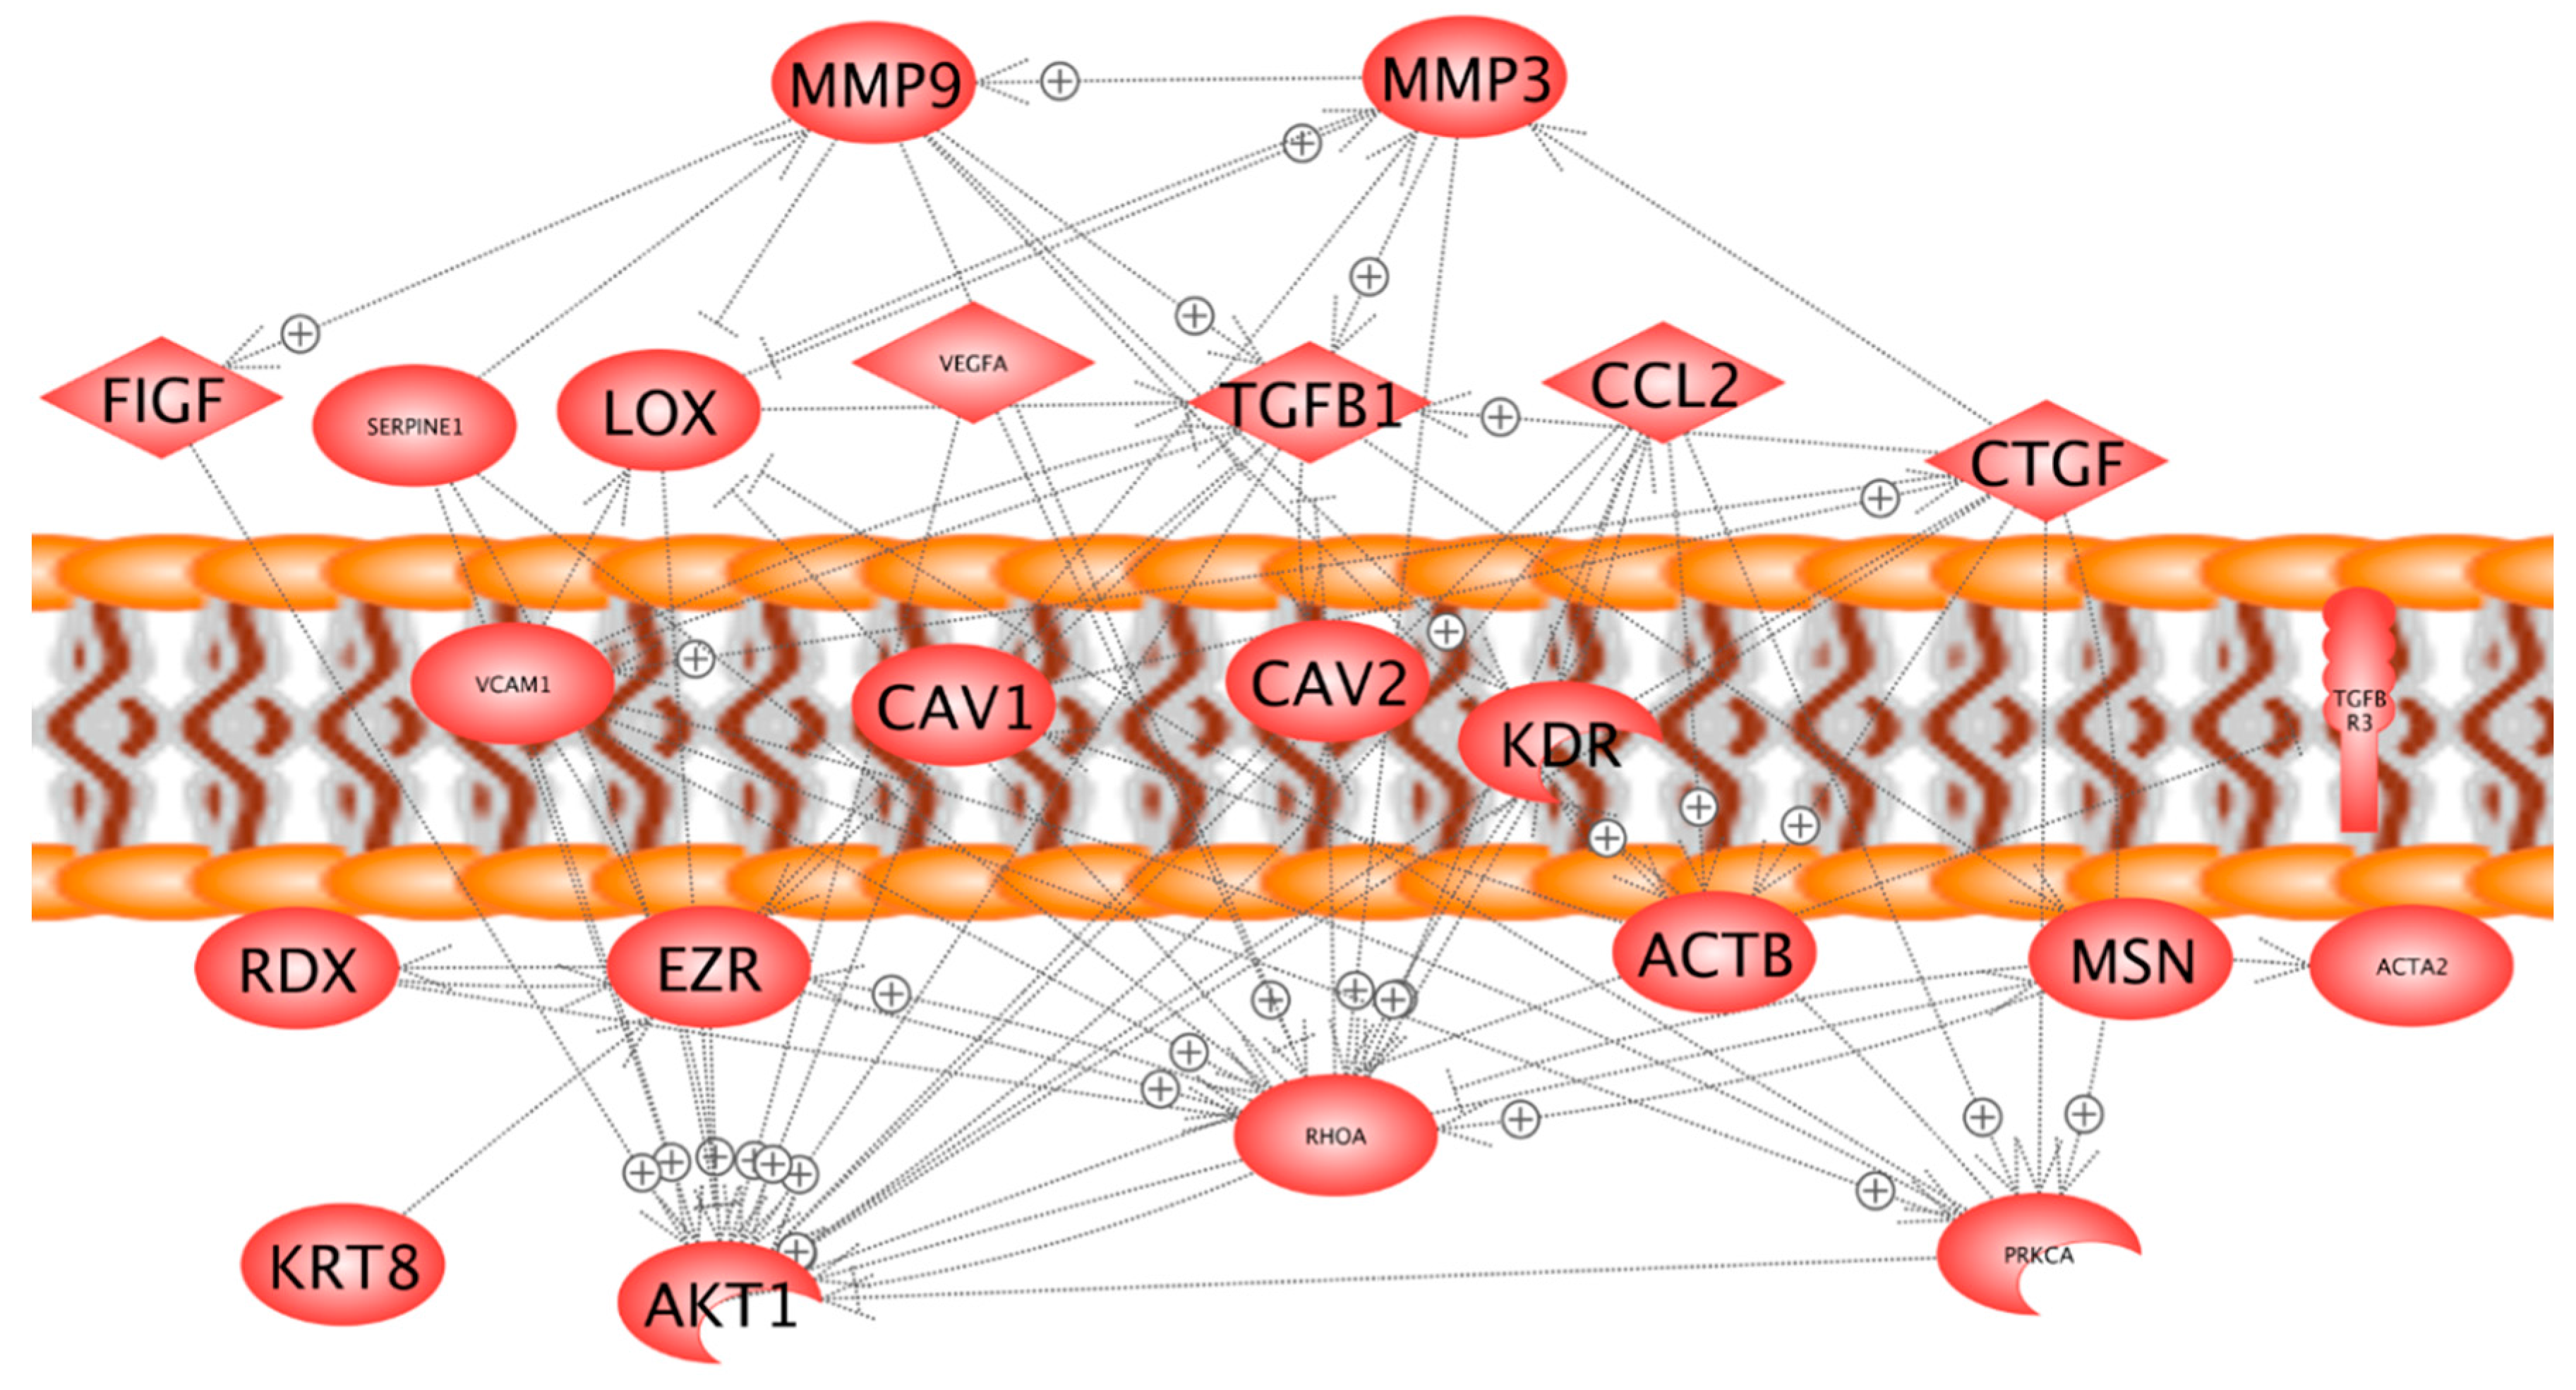
2.5. In Silico Search for Mutual Gene Regulation

Figure 3, Figure 4 and Figure 5 indicated that cells remaining adherent during the early 24 h of incubation kept 16 of the 24 genes investigated within the frame of not-significant variation, downregulated seven, and upregulated one. In contrast, cells growing three-dimensionally exerted three upregulated genes, downregulated 11, and kept only 10 within the frame of not-significant variation. In order to find reasons how the changes of the genes mentioned above may contribute to a transition from a two- to three-dimensional growth behavior of UCLA RO82-W-1 follicular thyroid cancer cells, we wanted to find relationships between the networks shown in Figure 6 and Figure 7 and the gene expression changes indicated in Figure 3, Figure 4 and Figure 5. The most significant upregulation was indicated for the VEGFA and VEGFD genes only in MCS cells (Figure 4a,b). A simultaneous upregulation of both genes had already been observed in de-differentiated human ovarian carcinomas [26]. Regarding VEGFA, not only the gene was upregulated, but also the quantities of VEGFA proteins released in the supernatant were enhanced (Figure 4e). This indicates that both AD cells and MCS cells grew on the RPM under enhanced concentrations of external VEGFA. However, only those cells, showing an upregulated VEGFA mRNA in combination with an elevated VEGFD mRNA after the first 24 h of RPM-exposure, formed spheroids (Figure 1).
In our system, i.e., in the presence of enhanced external VEGFA protein, the MCS-cells with enhanced simultaneous VEGFA and VEGFD mRNA expression showed a significant downregulation of the α/β-actin expression, while the AD cells kept their actin expression rates similar to the 1g-control cells. It has already been described that VEGF downregulates α/β-actin expression in retinal endothelial cells or in arterial smooth muscle cells after addition of external VEGFA [27,28]. The mechanism is unknown, but could include miR-205 and EZR mRNA production, as described by Li et al. [29].
The MMP3 expression is upregulated in AD cells and even more in MCS cells (Figure 5a). This corresponds to the observation of Saleh et al. who showed that the MMP3 gene expression in peripheral blood mononuclear cells is depending on their own expression of the VEGF gene as well as on plasma VEGF concentration [30]. In addition, MMP9 is upregulated (Figure 5e). VEGF is known to upregulate the expression of MMP9 in lung macrophages as long as a VEGFR-1 receptor is present on the surface [31]. The MMP9 expression may also be upregulated by MCP1 [32]. Its expression is elevated in AD cells, but lowered in MCS cells (Figure 5e).
Furthermore, the PAI-1 (Figure 5d) gene expression was downregulated in the presence of the enhanced VEGF, while TGFB1 (Figure 5c) gene expression remained unchanged. A similar VEGF effect was described for endothelial cells [33]. We recently found that plasminogen accumulation contributes to inhibition of spheroid formation [22]. Hence, an attenuation of the inhibition of plasminogen activators due to downregulation of PAI-1 could help to form spheroids [34].
Although it has been demonstrated in a number of studies that VEGF upregulates the FLK1 [34], we observed a slight but insignificant downregulation of the mRNA of FLK1 (Figure 4f). This might be explained by a decreased amount of CAV1, which scaffolds FLK1 [21,35] or by the presence of various VEGF-A isoforms. For example, the VEGF-A121 was found to have little effect on KDR expression [36]. Similarly, the VCAM expression depends on the isoforms of the VEGF surrounding the cells [37].
Furthermore, the LOX (monoamine oxidase lysyl oxidase) expression was not significantly changed under the conditions of elevated VEGF in microgravity (Figure 2c), although in ARPE-19 cells a VEGF-dependent increase of enzyme activity as well as the mRNA expression of LOX was found [38]. Interestingly, a slight but insignificant increase of LOX mRNA was found in AD cells, while LOX was simultaneously decreased in MCS cells (Figure 2c). This is in accordance to our earlier hypothesis that a removal of LOX favors spheroid formation [39]. It is known that LOX is involved in several steps of metastasis and it might be an interesting protein to be investigated in co-culture experiments with endothelial cells in the future.
It is described in the literature that VEGF upregulates CCL-2 as well as the CTGF gene expression [40,41]. In AD cells we found that CTGF was slightly downregulated, but MCP1 is upregulated insignificantly though. In MCS cells both types of genes were further downregulated. This result suggests that AD and MCS respond differently to VEGF.
This study was designed to investigate the underlying mechanisms for 3D growth on the RPM. The study revealed that during exposure to microgravity the UCLA RO82-W-1 cell population splits in adherent and three-dimensionally growing cells. This observation fits to results obtained by others as well as by our group. For example, when cultured on the RPM murine osteoblasts and human breast cancer cells split into two populations with different phenotypes, respectively [42,43]. We previously described malignant FTC-133 thyroid cancer cells, healthy chondrocytes, or endothelial cells growing in one culture flask simultaneously in a two- or a three-dimensional manner [2,3,6,8,44].
Interestingly, only seven of the 24 genes investigated showed significantly different gene expression levels in AD and MCS cells. This finding suggests that neighboring cells of one culture change distinct genes in different ways. Attempts were made to explain the split of cell population into different sub-populations, stressing the phenomenon of bifurcation [43,45,46,47]. The authors of this hypothesis suggest that the cells, when exposed to microgravity, come into a state in which very small secondary effects, such as gene variations observed in single cell transcriptomes of a seemingly homogenous population, may trigger the development of single cells into different directions [48]. In our earlier experiments, flow cytometry measurements repeatedly indicated considerable variations of the number of distinct antigens at the cell surfaces. Cell electrophoretic studies showed that the overall surface charge density varies from cell to cell in a way that two distinct cell populations emerge [49,50]. In addition, we found that the glycolytic enzyme alpha-enolase was differently expressed in different cells of a population [51]. Therefore, the task remains to examine the accumulation of extracellular proteins, whose overexpression prevent spheroid formation in a whole culture, in regard to individual cells and to study whether different accumulation of the proteins described recently could prevent spheroid formation on an individual cell basis [22]. This way, we will learn whether MCS cells stem from those cells being driven out from the monolayer by microgravity but not by normal gravity, because of their lower accumulation of extracellular matrix proteins than that of their neighbors.
In accordance with earlier investigations performed on human follicular thyroid cells exposed to microgravity, these experiments also suggest that the cytoskeletal proteins and their organizers ezrin, radixin, and moesin [52] are a preferred target affected by conditions of real and simulated microgravity [13,19]. Together they organize and maintain the cell cortex as well as the interface between the extracellular environment/cell membrane, the cytoskeleton, and cytoplasm. They achieve this by interactions with both membrane and filamentous actin or by linking receptors to further signaling components. Moreover, they are involved in the regulation of several signaling pathways [53]. Besides moesin, the genes of all analyzed cytoskeletal proteins were downregulated. As one can assume that both adherent and MCS cells are exposed to similar mechanical forces, it seems reasonable that mechanical forces are not the only factors, affecting the cytoskeleton. However, mechanical forces could be more effective in changing the cell’s phenotype, if the quantity of actin or ezrin is reduced [54,55,56].
α and β actins as well as ezrin, which are cytoskeletal key factors, might be downregulated by VEGF. The most interesting result was that VEGFA and VEGFD were significantly upregulated only in MCS cells. We do not know the causes of the VEGF upregulation, as all the factors shown in Figure 6 ((+) sign on arrow) to favor upregulation of VEGF remained in RPM-exposed cells either similar (AKT-1, TGFB1, RHOA) or were significantly downregulated (PAI-1, MCP-1) as compared to the 1g-controls. Interestingly, CTGF was downregulated in AD cells by 25% and in MCS cells by 85%. A downregulation of CTGF may enhance the bioavailability of VEGF within the spheroids, because CTGF binding can neutralize VEGF activity [57]. VEGF regulates vascularization in wound healing by challenging outgrowth of endothelial cells [58], but also has a great influence on cancer development and metastasis [59]. It is known that an increase in VEGFA indicates neoangiogenesis, low-differentiation and progression in cancer [59,60]. In addition, VEGF production is modified, when cells grow under microgravity [61]. We had recently demonstrated that microgravity-exposure of FTC-133 thyroid cancer cells for 10 days in Space and on the RPM induced a downregulation of VEGFA, but an upregulation of VEGFD [4]. VEGFA and VEGFD exert differently strong effects on their target cells and by competing for the equal receptor-binding site VEGFD may fine-tune the VEGFA activities [62]. Hence, both VEGFs seem to play different roles in wound healing, tumor progression and microgravity-induced reactions. In 2012 Nersita et al. [63] reported a low level of VEGFD in metastatic thyroid carcinomas, which may indicate that VEGFA effects are not regulated anymore [63].
It was demonstrated in human endothelial cells (EA.hy926 cell line) that these cells also produced more than normal amounts of VEGF and FLK-1 by themselves [44]. VEGF was increased after a 4 h-RPM-exposure and was further elevated after 12 h [44]. In addition, an RPM-exposure of the EAhy926 endothelial cells early induced FLK-1 protein (within 4 h). This increase was further elevated after a 12 h-RPM-exposure [44]. Interestingly, the external application of 10ng/mL VEGF to the culture medium reduced the amount of synthesized VEGF protein [44]. Furthermore, EAhy926 cells incubated for seven days either under 1g-conditions or under s-μg revealed a clear increase in the VEGF expression of RPM-exposed cells compared with 1g-controls [61]. In this long-term experiment, it could be demonstrated that external VEGF (10 ng/mL) did not induce a further elevation of VEGF [61]. Gravitational unloading alone stimulated the endothelial cells to synthesize VEGF early. The EA.hy926 cell line is a human umbilical vein cell line, established by fusing primary human umbilical vein cells with a thioguanine-resistant clone of A549 lung carcinoma cells by exposure to polyethylene glycol [64]. Cancer cells are able to fuse spontaneously with endothelial cells to form hybrid cells, facilitating the cells traversing the endothelial barrier to form metastases [65]. These characteristics will help to increase our knowledge in the processes of angiogenesis or metastasis with the aim of finding future drug targets for cancer therapy. In future studies, it is a matter of interest to investigate the impact of conditioned medium of microgravity-related cancer cells on endothelial cells or by a co-culture assay.
MMP3 had shown to be upregulated under microgravity. The MMP3 gene product can have several functions. First, it may be located within the nucleus of cells like chondrocytes and activate transcription enhancers, which may e.g., in chondrocytes activate the transcription of CTGF genes [66]. This pathway seems not to be active in our system, because the CTGF gene is downregulated at enhanced transcription of MMP3 (Figure 4 and Figure 5). It is more probable that MMP3 degrades the VEGFR or digests products of the extracellular matrix [67]. In a recent spaceflight experiment, we found that an elevated protein accumulation in the extracellular space could detain 3D formation, while profilin-1 was phosphorylated in Space [22]. Hence, elevated MMP3 may favor the degradation of proteins surrounding the cells and in this way support spheroid formation.
CTGF is involved in the spheroid formation of FTC-133 thyroid cancer cells in Space [11]. The CTGF mRNA expression was enhanced by annulling gravity in space-flown samples, suggesting a key role of this growth factor in continuing 3D growth type [11]. A reduced CTGF mRNA expression in 3D aggregates compared to adherent cells was observed on the two devices [68]. In vitro, CTGF has been shown to stimulate ECM production, chemotaxis, proliferation, and integrin expression and has been implicated in various biological processes, such as cell proliferation, migration, angiogenesis, and tumorigenesis [69]. It has also been shown that CTGF expression level was elevated in primary papillary thyroid carcinoma samples and was correlated with clinical features, such as metastasis, tumor size, or the clinical stage [70]. After 24 h on the RPM, CTGF was downregulated in UCLA RO82-W-1 cells. Therefore, the importance of CTGF in spheroid formation of thyroid cancer cells has to be further investigated in the future.
In vitro, the protein kinase C-α (PRKCA) is involved in the control of human medullar thyroid carcinoma cell proliferation and survival by modulating apoptosis [71]. PRKCA gene expression was downregulated by vibration in human thyroid cells. In this experiment, it was also downregulated. A factor triggering this downregulation could not be seen in our experiments. However, it is known that PRKCA initiates upregulation of CAV1 or CTGF [72,73]. Therefore, one might conclude that PRKCA expressed as found in our experiments may not be capable to enforce upregulation of CAV1 or CTGF genes [21]. It appears worthwhile to study the PRKCA effects on CAV1 expression because of the capability of CAV1 to inhibit the cellular sheering out of a monolayer in cancer cells [21].

3. Experimental Section

3.1. Cells

The UCLA RO82-W-1 cell line was used in this study and purchased from Sigma-Aldrich Chemie (Munich, Germany). The cell line was derived from the metastases of a follicular carcinoma in a female patient. The primary tumor released thyroglobulin (>10,000 ng/mL), but the uptake of I131 was less than 2%. Immunoperoxidase staining revealed thyroglobulin-positivity within the cells. The cell line was tumorigenous in nude mice [74]. The cells were cultured in RPMI-1640 medium containing 100 μM sodium pyruvate and 2 mM·l-glutamine, supplemented with 10% fetal calf serum (FCS), 100 U/mL penicillin and 100 µg/mL streptomycin (all Invitrogen, Eggenstein, Germany).

3.2. Random Positioning Machine

30 T25 culture flasks were seeded with 1 × 10⁶ UCLA RO82-W-1 cells each and incubated over night at 37 °C and 5% CO2 in an incubator to ensure attachment of the cells to the bottom of the culture flask. The next day, the flasks were completely filled with medium carefully avoiding air bubbles. 15 T25 were fixed on the RPM, as close as possible to the center of the platform, which was then rotated at a speed of 60 °/s in real random mode. The RPM was positioned in a commercially available incubator set at 37 °C and supplied with 5% CO2. 15 T25 culture flasks for 1g-ground control cultures grown in parallel in identical equipment were kept statically in the same incubator as the RPM.

3.3. F-Actin Staining

UCLA RO82-W-1 cells were seeded into slide flasks (BD, Heidelberg, Germany) and placed in an incubator (37 °C, 5% CO2) overnight, until they attached to the slides. The next day, the slide flasks were completely filled with medium avoiding air bubbles, sealed with parafilm, and placed on the RPM for 24 h. F-actin was visualized by means of rhodamine-phalloidin staining (Molecular Probes®, Eugene, OR, USA). The method was described earlier in detail [75,76].

3.4. RNA Isolation

Directly after the experiments, the cells were fixed with RNAlater (Thermo Fisher Scientific, Roskilde, Denmark). For harvesting of the cells, RNAlater was replaced by PBS (Invitrogen, Darmstadt, Germany). The method was published recently in detail [75,77].

3.5. Quantitative Real Time PCR

We employed the real-time quantitative RT PCR to quantify expression levels of the genes of interest. Appropriate primers with a Tm of about 60 °C were designed with the Primer Express® (Version 2.0.0, Applied Biosystems, Foster City, CA, USA) software. The primers were synthesized by TIB Molbiol (Berlin, Germany) and listed in Table 1. The method was published recently in detail [75,77].

3.6. Pathway Studio Analysis

Pathway Studio v11 was purchased from Elsevier Research Solutions, Amsterdam, The Netherlands. This program was used online [78]. To start an analysis, the SwissProt numbers of the proteins of interest were entered.

3.7. Statistics

All statistical analyses were performed using SPSS 21.0 (SPSS, Inc., Chicago, IL, USA, 2012). The data was analyzed with the Mann–Whitney U test. To account for multiple comparisons, a Kruskal–Wallis Test was performed beforehand, and Bonferroni corrections were applied. The data was expressed as means ± standard deviation (SD). Differences were considered significant at p < 0.05.

4. Conclusions

This is the first study, using pathway analyses programs to investigate the molecular mechanisms responsible for 3D growth of follicular thyroid cancer cells grown under conditions of simulated microgravity for 24 h on the RPM. Earlier studies have shown, that human and rat benign thyroid cells as well as cancer cells in vitro and in vivo respond to microgravity conditions and induce a variety of changes in these cells [3,8,17,79,80,81,82,83,84,85,86]. This response might give important hints for cancer research on Earth [87].
The appearance of the two distinct cell populations, adherent cells and MCS, fits very well to the phenomenon of the bifurcation point. It remains unclear if initially a shift in the phenotype leads to a change in gene expression or if the differential gene expression leads to the shift in the phenotype, but it is very certain that both can influence each other. We still do not know, which one of the differentially expressed genes is the very first step triggered by the removal of gravity. However, we recognized, that in the cells with an upregulated VEGFA and VEGFD mRNA, spheroid formation could be favored, because upregulated MMP-3 mRNA and simultaneously downregulated PAI1 mRNA favor the degradation of the extracellular proteins and reduction of actin and ezrin proteins. These changes may facilitate a transition of the phenotypes, while the PRKCA mRNA expression is too low to enforce upregulation of CAV-1 and MCP1.

Acknowledgments

This study was funded by the German Space Agency (Deutsches Zentrum für Luft- und Raumfahrt (DLR); BMWi grant 50WB1524). The authors would like to thank Jayashree Sahana for her excellent technical assistance.

Author Contributions

Daniela Grimm, Manfred Infanger, Stefan Riwaldt, and Johann Bauer conceived and designed the experiments. Stefan Riwaldt, Lasse Slumstrup, Sascha Kopp, Anita Dittrich, Nils E. Magnusson, and Daniela Grimm performed the experiments. Daniela Grimm, Marcus Wehland, Johann Bauer, and Thomas J. Corydon analyzed the data. Stefan Riwaldt, Daniela Grimm, Marcus Wehland, Jessica Pietsch, Elisabeth Warnke, Thomas J. Corydon, and Johann Bauer wrote the paper.

Conflicts of Interest

The authors declare no conflict of interest.

Abbreviation

ACTA2Actin aortic smooth muscle (P62736)
ACTBActin cytoplasmic 1 (P60709)
ADAdherent
AKT1RAC-α serine/threonine-protein kinase (P31749)
CAV1Caveolin-1 (Q03135)
CAV2Caveolin-2 (P51636)
CCL2C–C motif chemokine 2 (P13500)
CTGFConnective tissue growth factor (P29279)
EZREzrin (P15311)
FIGF or VEGFDVascular endothelial growth factor D (O43915)
FLK1 or KDRVascular endothelial growth factor receptor 2 (P35968)
KRT8Keratin type II cytoskeletal 8 (P05787)
LOXProtein-lysine 6-oxidase (P28300)
MCSMulticellular spheroids
MCTSMulticellular tumor spheroid
MMP-3Matrix metalloproteinase-3 or Stromelysin-1 (P08254)
MMP-9Matrix metalloproteinase-9 (P14780)
MSNMoesin (P26038)
PRKCAProtein kinase C alpha type (P17252)
qPCRQuantitative real-time PCR
RDXRadixin (P35241)
RHOAprotein: Ras homolog gene family, member A; gene: Transforming protein RhoA (P61586)
RPMRandom Positioning Machine
RWVRotating Wall Vessel
SERPINE1Plasminigen activator inhibitor 1 (P05121)
TGFB1Transforming growth factor β-1 (P01137)
TGFBR1Transforming growth factor beta receptor type 1 (P36897)
TGFBR3Transforming growth factor beta receptor type 3 (Q03167)
TUBBTubulin β (P07437)
VCAM1Vascular cellular adhesion protein 1 (P19320)
VEGFAVascular endothelial growth factor A (P15692)

References

  1. Pietsch, J.; Kussian, R.; Sickmann, A.; Bauer, J.; Weber, G.; Nissum, M.; Westphal, K.; Egli, M.; Grosse, J.; Schonberger, J.; et al. Application of free-flow ief to identify protein candidates changing under microgravity conditions. Proteomics 2010, 10, 904–913. [Google Scholar] [CrossRef] [PubMed]
  2. Pietsch, J.; Sickmann, A.; Weber, G.; Bauer, J.; Egli, M.; Wildgruber, R.; Infanger, M.; Grimm, D. A proteomic approach to analysing spheroid formation of two human thyroid cell lines cultured on a random positioning machine. Proteomics 2011, 11, 2095–2104. [Google Scholar] [CrossRef] [PubMed]
  3. Grimm, D.; Bauer, J.; Kossmehl, P.; Shakibaei, M.; Schoberger, J.; Pickenhahn, H.; Schulze-Tanzil, G.; Vetter, R.; Eilles, C.; Paul, M.; et al. Simulated microgravity alters differentiation and increases apoptosis in human follicular thyroid carcinoma cells. FASEB J. 2002, 16, 604–606. [Google Scholar] [CrossRef] [PubMed]
  4. Ma, X.; Pietsch, J.; Wehland, M.; Schulz, H.; Saar, K.; Hubner, N.; Bauer, J.; Braun, M.; Schwarzwalder, A.; Segerer, J.; et al. Differential gene expression profile and altered cytokine secretion of thyroid cancer cells in space. FASEB J. 2014, 28, 813–835. [Google Scholar] [CrossRef] [PubMed]
  5. Grimm, D.; Infanger, M.; Westphal, K.; Ulbrich, C.; Pietsch, J.; Kossmehl, P.; Vadrucci, S.; Baatout, S.; Flick, B.; Paul, M.; et al. A delayed type of three-dimensional growth of human endothelial cells under simulated weightlessness. Tissue Eng. A 2009, 15, 2267–2275. [Google Scholar] [CrossRef] [PubMed]
  6. Grimm, D.; Wehland, M.; Pietsch, J.; Aleshcheva, G.; Wise, P.; van Loon, J.; Ulbrich, C.; Magnusson, N.E.; Infanger, M.; Bauer, J. Growing tissues in real and simulated microgravity: New methods for tissue engineering. Tissue Eng. B 2014, 20, 555–566. [Google Scholar] [CrossRef] [PubMed]
  7. Ma, X.; Wehland, M.; Schulz, H.; Saar, K.; Hubner, N.; Infanger, M.; Bauer, J.; Grimm, D. Genomic approach to identify factors that drive the formation of three-dimensional structures by EA.hy926 endothelial cells. PLoS ONE 2013, 8, e64402. [Google Scholar] [CrossRef] [PubMed]
  8. Kopp, S.; Warnke, E.; Wehland, M.; Aleshcheva, G.; Magnusson, N.E.; Hemmersbach, R.; Corydon, T.J.; Bauer, J.; Infanger, M.; Grimm, D. Mechanisms of three-dimensional growth of thyroid cells during long-term simulated microgravity. Sci. Rep. 2015, 5. [Google Scholar] [CrossRef] [PubMed]
  9. Ma, X.; Wehland, M.; Aleshcheva, G.; Hauslage, J.; Waßer, K.; Hemmersbach, R.; Infanger, M.; Bauer, J.; Grimm, D. Interleukin-6 expression under gravitational stress due to vibration and hypergravity in follicular thyroid cancer cells. PLoS ONE 2013, 8, e68140. [Google Scholar] [CrossRef] [PubMed]
  10. Grosse, J.; Wehland, M.; Pietsch, J.; Schulz, H.; Saar, K.; Hubner, N.; Eilles, C.; Bauer, J.; Abou-El-Ardat, K.; Baatout, S.; et al. Gravity-sensitive signaling drives 3-dimensional formation of multicellular thyroid cancer spheroids. FASEB J. 2012, 26, 5124–5140. [Google Scholar] [CrossRef] [PubMed]
  11. Pietsch, J.; Ma, X.; Wehland, M.; Aleshcheva, G.; Schwarzwälder, A.; Segerer, J.; Birlem, M.; Horn, A.; Bauer, J.; Infanger, M.; et al. Spheroid formation of human thyroid cancer cells in an automated culturing system during the shenzhou-8 space mission. Biomaterials 2013, 34, 7694–7705. [Google Scholar] [PubMed]
  12. Svejgaard, B.; Wehland, M.; Ma, X.; Kopp, S.; Sahana, J.; Warnke, E.; Aleshcheva, G.; Hemmersbach, R.; Hauslage, J.; Grosse, J.; et al. Common effects on cancer cells exerted by a random positioning machine and a 2d clinostat. PLoS ONE 2015, 10, e0135157. [Google Scholar] [CrossRef] [PubMed]
  13. Ulbrich, C.; Pietsch, J.; Grosse, J.; Wehland, M.; Schulz, H.; Saar, K.; Hübner, N.; Hauslage, J.; Hemmersbach, R.; Braun, M.; et al. Differential gene regulation under altered gravity conditions in follicular thyroid cancer cells: Relationship between the extracellular matrix and the cytoskeleton. Cell. Physiol. Biochem. 2011, 28, 185–198. [Google Scholar] [CrossRef] [PubMed]
  14. Warnke, E.; Kopp, S.; Wehland, M.; Hemmersbach, R.; Bauer, J.; Pietsch, J.; Infanger, M.; Grimm, D. Thyroid cells exposed to simutalted microgravity conditions—Comparison of the fast roating clinostat and the random position maschine. Microgravity Sci. Technol. 2015. [Google Scholar] [CrossRef]
  15. Faute, M.A.D.; Laurent, L.; Ploton, D.; Poupon, M.-F.; Jardillier, J.-C.; Bobichon, H. Distinctive alterations of invasiveness, drug resistance and cell-cell organization in 3D-cultures of MCF-7, a human breast cancer cell line, and its multidrug resistant variant. Clin. Exp. Metastasis 2002, 19, 161–168. [Google Scholar] [CrossRef]
  16. Kogai, T.; Curcio, F.; Hyman, S.; Cornford, E.M.; Brent, G.A.; Hershman, J.M. Induction of follicle formation in long-term cultured normal human thyroid cells treated with thyrotropin stimulates iodide uptake but not sodium/iodide symporter messenger rna and protein expression. J. Endocrinol. 2000, 167, 125–135. [Google Scholar] [CrossRef] [PubMed]
  17. Albi, E.; Ambesi-Impiombato, F.S.; Peverini, M.; Damaskopoulou, E.; Fontanini, E.; Lazzarini, R.; Curcio, F.; Perrella, G. Thyrotropin receptor and membrane interactions in FRTL-5 thyroid cell strain in microgravity. Astrobiology 2011, 11, 57–64. [Google Scholar] [CrossRef] [PubMed]
  18. Grimm, D.; Pietsch, J.; Wehland, M.; Richter, P.; Strauch, S.M.; Lebert, M.; Magnusson, N.E.; Wise, P.; Bauer, J. The impact of microgravity-based proteomics research. Expert Rev. Proteom. 2014, 11, 465–476. [Google Scholar] [CrossRef] [PubMed]
  19. Grimm, D.; Wise, P.; Lebert, M.; Richter, P.; Baatout, S. How and why does the proteome respond to microgravity? Expert Rev. Proteom. 2011, 8, 13–27. [Google Scholar] [CrossRef] [PubMed]
  20. Pietsch, J.; Bauer, J.; Egli, M.; Infanger, M.; Wise, P.; Ulbrich, C.; Grimm, D. The effects of weightlessness on the human organism and mammalian cells. Curr. Mol. Med. 2011, 11, 350–364. [Google Scholar] [CrossRef] [PubMed]
  21. Riwaldt, S.; Bauer, J.; Pietsch, J.; Braun, M.; Segerer, J.; Schwarzwälder, A.; Corydon, T.; Infanger, M.; Grimm, D. The importance of caveolin-1 as key-regulator of three-dimensional growth in thyroid cancer cells cultured under real and simulated microgravity conditions. Int. J. Mol. Sci. 2015, 16, 28296–28310. [Google Scholar] [CrossRef] [PubMed]
  22. Riwaldt, S.; Pietsch, J.; Sickmann, A.; Bauer, J.; Braun, M.; Segerer, J.; Schwarzwälder, A.; Aleshcheva, G.; Corydon, T.J.; Infanger, M.; et al. Identification of proteins involved in inhibition of spheroid formation under microgravity. Proteomics 2015, 15, 2945–2952. [Google Scholar] [CrossRef] [PubMed]
  23. Kanbe, N.; Tanaka, A.; Kanbe, M.; Itakura, A.; Kurosawa, M.; Matsuda, H. Human mast cells produce matrix metalloproteinase 9. Eur J. Immunol. 1999, 29, 2645–2649. [Google Scholar] [CrossRef]
  24. Kim, E.M.; Hwang, O. Role of matrix metalloproteinase-3 in neurodegeneration. J. Neurochem. 2011, 116, 22–32. [Google Scholar] [CrossRef] [PubMed]
  25. Plow, E.F.; Herren, T.; Redlitz, A.; Miles, L.A.; Hoover-Plow, J.L. The cell biology of the plasminogen system. FASEB J. 1995, 9, 939–945. [Google Scholar] [PubMed]
  26. Bolat, F.; Gumurdulu, D.; Erkanli, S.; Kayaselcuk, F.; Zeren, H.; Ali Vardar, M.; Kuscu, E. Maspin overexpression correlates with increased expression of vascular endothelial growth factors A, C, and D in human ovarian carcinoma. Pathol.-Res. Pract. 2008, 204, 379–387. [Google Scholar] [CrossRef] [PubMed]
  27. Butler, S.M.; Abrassart, J.M.; Hubbell, M.C.; Adeoye, O.; Semotiuk, A.; Williams, J.M.; Mata-Greenwood, E.; Khorram, O.; Pearce, W.J. Contributions of VEGF to age-dependent transmural gradients in contractile protein expression in ovine carotid arteries. Am. J. Physiol. Cell Physiol. 2011, 301, C653–C666. [Google Scholar] [CrossRef] [PubMed]
  28. Wisniewska-Kruk, J.; Hoeben, K.A.; Vogels, I.M.C.; Gaillard, P.J.; Van Noorden, C.J.F.; Schlingemann, R.O.; Klaassen, I. A novel co-culture model of the blood-retinal barrier based on primary retinal endothelial cells, pericytes and astrocytes. Exp. Eye Res. 2012, 96, 181–190. [Google Scholar] [CrossRef] [PubMed]
  29. Li, J.; Li, L.; Li, Z.; Gong, G.; Chen, P.; Liu, H.; Wang, J.; Liu, Y.; Wu, X. The role of miR-205 in the VEGF-mediated promotion of human ovarian cancer cell invasion. Gynecol. Oncol. 2015, 137, 125–133. [Google Scholar] [CrossRef] [PubMed]
  30. Saleh, A.; Stathopoulou, M.G.; Dade, S.; Ndiaye, N.C.; Azimi-Nezhad, M.; Murray, H.; Masson, C.; Lamont, J.; Fitzgerald, P.; Visvikis-Siest, S. Angiogenesis related genes NOS3, CD14, MMP3 and IL4R are associated to VEGF gene expression and circulating levels in healthy adults. BMC Med. Genet. 2015, 16. [Google Scholar] [CrossRef] [PubMed]
  31. Hiratsuka, S.; Nakamura, K.; Iwai, S.; Murakami, M.; Itoh, T.; Kijima, H.; Shipley, J.M.; Senior, R.M.; Shibuya, M. MMP9 induction by vascular endothelial growth factor receptor-1 is involved in lung-specific metastasis. Cancer Cell 2002, 2, 289–300. [Google Scholar] [CrossRef]
  32. Tang, C.-H.; Tsai, C.-C. CCL2 increases MMP-9 expression and cell motility in human chondrosarcoma cells via the Ras/Raf/MEK/ERK/NF-κB signaling pathway. Biochem. Pharmacol. 2012, 83, 335–344. [Google Scholar] [CrossRef] [PubMed]
  33. Yamauchi, K.; Nishimura, Y.; Shigematsu, S.; Takeuchi, Y.; Nakamura, J.; Aizawa, T.; Hashizume, K. Vascular endothelial cell growth factor attenuates actions of transforming growth factor-β in human endothelial cells. J. Biol. Chem. 2004, 279, 55104–55108. [Google Scholar] [CrossRef] [PubMed]
  34. Liekens, S.; de Clercq, E.; Neyts, J. Angiogenesis: Regulators and clinical applications. Biochem. Pharmacol. 2001, 61, 253–270. [Google Scholar] [CrossRef]
  35. Hata, Y.; Rook, S.L.; Aiello, L.P. Basic fibroblast growth factor induces expression of VEGF receptor KDR through a protein kinase C and p44/p42 mitogen-activated protein kinase-dependent pathway. Diabetes 1999, 48, 1145–1155. [Google Scholar] [CrossRef] [PubMed]
  36. Cipriani, P.; di Benedetto, P.; Capece, D.; Zazzeroni, F.; Liakouli, V.; Ruscitti, P.; Pantano, I.; Berardicurti, O.; Carubbi, F.; Alesse, E.; et al. Impaired Cav-1 expression in SSc mesenchymal cells upregulates VEGF signaling: A link between vascular involvement and fibrosis. Fibrogen. Tissue Repair 2014, 7. [Google Scholar] [CrossRef] [PubMed]
  37. Fearnley, G.W.; Odell, A.F.; Latham, A.M.; Mughal, N.A.; Bruns, A.F.; Burgoyne, N.J.; Homer-Vanniasinkam, S.; Zachary, I.C.; Hollstein, M.C.; Wheatcroft, S.B.; et al. VEGF-A isoforms differentially regulate ATF-2-dependent VCAM-1 gene expression and endothelial-leukocyte interactions. Mol. Biol. Cell 2014, 25, 2509–2521. [Google Scholar] [CrossRef] [PubMed]
  38. Coral, K.; Madhavan, J.; Pukhraj, R.; Angayarkanni, N. High glucose induced differential expression of lysyl oxidase and its isoform in ARPE-19 cells. Curr. Eye Res. 2013, 38, 194–203. [Google Scholar] [CrossRef] [PubMed]
  39. Bauer, J.; Wehland, M.; Pietsch, J.; Sickmann, A.; Weber, G.; Grimm, D. Annotated gene and proteome data support recognition of interconnections between the results of different experiments in space research. Microgravity Sci. Technol. 2015. [Google Scholar] [CrossRef]
  40. Blom, I.E.; Goldschmeding, R.; Leask, A. Gene regulation of connective tissue growth factor: New targets for antifibrotic therapy? Matrix Biol. 2002, 21, 473–482. [Google Scholar] [CrossRef]
  41. Marumo, T.; Schini-Kerth, V.B.; Busse, R. Vascular endothelial growth factor activates nuclear factor-κB and induces monocyte chemoattractant protein-1 in bovine retinal endothelial cells. Diabetes 1999, 48, 1131–1137. [Google Scholar] [CrossRef] [PubMed]
  42. Masiello, M.G.; Cucina, A.; Proietti, S.; Palombo, A.; Coluccia, P.; D’Anselmi, F.; Dinicola, S.; Pasqualato, A.; Morini, V.; Bizzarri, M. Phenotypic switch induced by simulated microgravity on MDA-MB-231 breast cancer cells. BioMed Res. Int. 2014, 2014. [Google Scholar] [CrossRef] [PubMed]
  43. Testa, F.; Palombo, A.; Dinicola, S.; D’Anselmi, F.; Proietti, S.; Pasqualato, A.; Masiello, M.G.; Coluccia, P.; Cucina, A.; Bizzarri, M. Fractal analysis of shape changes in murine osteoblasts cultured under simulated microgravity. Rend. Fis. Acc. Lincei 2014, 25, 39–47. [Google Scholar] [CrossRef]
  44. Infanger, M.; Kossmehl, P.; Shakibaei, M.; Baatout, S.; Witzing, A.; Grosse, J.; Bauer, J.; Cogoli, A.; Faramarzi, S.; Derradji, H.; et al. Induction of three-dimensional assembly and increase in apoptosis of human endothelial cells by simulated microgravity: Impact of vascular endothelial growth factor. Apoptosis 2006, 11, 749–764. [Google Scholar] [CrossRef] [PubMed]
  45. Kondepudi, D.K.; Storm, P.B. Gravity detection through bifurcation. Adv. Space Res. 1992, 12, 7–14. [Google Scholar] [CrossRef]
  46. Mesland, D.A. Possible actions of gravity on the cellular machinery. Adv. Space Res. 1992, 12, 15–25. [Google Scholar] [CrossRef]
  47. Tabony, J. Morphological bifurcations involving reaction-diffusion processes during microtubule formation. Science 1994, 264, 245–248. [Google Scholar] [CrossRef] [PubMed]
  48. Junker, J.P.; van Oudenaarden, A. Every cell is special: Genome-wide studies add a new dimension to single-cell biology. Cell 2014, 157, 8–11. [Google Scholar] [CrossRef] [PubMed]
  49. Schonberger, J.; Bauer, J.; Spruss, T.; Weber, G.; Chahoud, I.; Eilles, C.; Grimm, D. Establishment and characterization of the follicular thyroid carcinoma cell line ML-1. J. Mol. Med. 2000, 78, 102–110. [Google Scholar] [CrossRef] [PubMed]
  50. Weber, G.; Grimm, D.; Bauer, J. Application of binary buffer systems to free flow cell electrophoresis. Electrophoresis 2000, 21, 325–328. [Google Scholar] [CrossRef]
  51. Pietsch, J.; Sickmann, A.; Weber, G.; Bauer, J.; Egli, M.; Wildgruber, R.; Infanger, M.; Grimm, D. Metabolic enzyme diversity in different human thyroid cell lines and their sensitivity to gravitational forces. Proteomics 2012, 12, 2539–2546. [Google Scholar] [CrossRef] [PubMed]
  52. Tsukita, S.; Yonemura, S. Cortical actin organization: Lessons from ERM (ezrin/radixin/moesin) proteins. J. Biol. Chem. 1999, 274, 34507–34510. [Google Scholar] [CrossRef] [PubMed]
  53. Corydon, T.J.; Kopp, S.; Wehland, M.; Braun, M.; Schutte, A.; Mayer, T.; Hulsing, T.; Oltmann, H.; Schmitz, B.; Hemmersbach, R.; et al. Alterations of the cytoskeleton in human cells in space proved by life-cell imaging. Sci. Rep. 2016, 6. [Google Scholar] [CrossRef] [PubMed]
  54. Haynes, J.; Srivastava, J.; Madson, N.; Wittmann, T.; Barber, D.L. Dynamic actin remodeling during epithelial-mesenchymal transition depends on increased moesin expression. Mol. Biol. Cell 2011, 22, 4750–4764. [Google Scholar] [CrossRef] [PubMed]
  55. Neisch, A.L.; Fehon, R.G. Ezrin, radixin and moesin: Key regulators of membrane–cortex interactions and signaling. Curr. Opin. Cell Biol. 2011, 23, 377–382. [Google Scholar] [CrossRef] [PubMed]
  56. Yang, H.-S.; Hinds, P.W. Increased ezrin expression and activation by CDK5 coincident with acquisition of the senescent phenotype. Mol. Cell 2003, 11, 1163–1176. [Google Scholar] [CrossRef]
  57. Inoki, I. Connective tissue growth factor binds vascular endothelial growth factor (VEGF) and inhibits VEGF-induced angiogenesis. FASEB J. 2001, 16, 219–221. [Google Scholar] [CrossRef] [PubMed]
  58. Bao, P.; Kodra, A.; Tomic-Canic, M.; Golinko, M.S.; Ehrlich, H.P.; Brem, H. The role of vascular endothelial growth factor in wound healing. J. Surg. Res. 2009, 153, 347–358. [Google Scholar] [CrossRef] [PubMed]
  59. Grimm, D.; Bauer, J.; Schoenberger, J. Blockade of neoangiogenesis, a new and promising technique to control the growth of malignant tumors and their metastases. Curr. Vasc. Pharmacol. 2009, 7, 347–357. [Google Scholar] [CrossRef] [PubMed]
  60. Bass, M.B.; Sherman, S.I.; Schlumberger, M.J.; Davis, M.T.; Kivman, L.; Khoo, H.-M.; Notari, K.H.; Peach, M.; Hei, Y.-J.; Patterson, S.D. Biomarkers as predictors of response to treatment with motesanib in patients with progressive advanced thyroid cancer. J. Clin. Endocrinol. Metab. 2010, 95, 5018–5027. [Google Scholar] [CrossRef] [PubMed]
  61. Grimm, D.; Bauer, J.; Ulbrich, C.; Westphal, K.; Wehland, M.; Infanger, M.; Aleshcheva, G.; Pietsch, J.; Ghardi, M.; Beck, M.; et al. Different responsiveness of endothelial cells to vascular endothelial growth factor and basic fibroblast growth factor added to culture media under gravity and simulated microgravity. Tissue Eng. A 2010, 16, 1559–1573. [Google Scholar] [CrossRef] [PubMed]
  62. George, M.L.; Tutton, M.G.; Janssen, F.; Arnaout, A.; Abulafi, A.M.; Eccles, S.A.; Swift, R.I. VEGF-A, VEGF-C, and VEGF-D in colorectal cancer progression. Neoplasia 2001, 3, 420–427. [Google Scholar] [CrossRef] [PubMed]
  63. Nersita, R.; Matrone, A.; Klain, M.; Scavuzzo, F.; Vitolo, G.; Abbondanza, C.; Carlino, M.V.; Giacco, V.; Amato, G.; Carella, C. Decreased serum vascular endothelial growth factor-D levels in metastatic patients with differentiated thyroid carcinoma. Clin. Endocrinol. 2011, 76, 142–146. [Google Scholar] [CrossRef] [PubMed]
  64. Edgell, C.J.; McDonald, C.C.; Graham, J.B. Permanent cell line expressing human factor VIII-related antigen established by hybridization. Proc. Natl. Acad. Sci. USA 1983, 80, 3734–3737. [Google Scholar] [CrossRef] [PubMed]
  65. Lu, Z.J.; Ren, Y.Q.; Wang, G.P.; Song, Q.; Li, M.; Jiang, S.S.; Ning, T.; Guan, Y.S.; Yang, J.L.; Luo, F. Biological behaviors and proteomics analysis of hybrid cell line Eahy926 and its parent cell line A549. J. Exp. Clin. Cancer Res. 2009, 28. [Google Scholar] [CrossRef] [PubMed]
  66. Mannello, F.; Medda, V. Nuclear localization of matrix metalloproteinases. Prog. Histochem. Cytochem. 2012, 47, 27–58. [Google Scholar] [CrossRef] [PubMed]
  67. Werle, M.J.; VanSaun, M. Activity dependent removal of agrin from synaptic basal lamina by matrix metalloproteinase 3. J. Neurocytol. 2003, 32, 905–913. [Google Scholar] [CrossRef] [PubMed]
  68. Warnke, E.; Pietsch, J.; Wehland, M.; Bauer, J.; Infanger, M.; Gorog, M.; Hemmersbach, R.; Braun, M.; Ma, X.; Sahana, J.; et al. Spheroid formation of human thyroid cancer cells under simulated microgravity: A possible role of ctgf and cav1. Cell Commun. Signal. 2014, 12. [Google Scholar] [CrossRef] [PubMed]
  69. Chu, C.-Y.; Chang, C.-C.; Prakash, E.; Kuo, M.-L. Connective tissue growth factor (CTGF) and cancer progression. J. Biomed. Sci. 2008, 15, 675–685. [Google Scholar] [CrossRef] [PubMed]
  70. Cui, L.; Zhang, Q.; Mao, Z.; Chen, J.; Wang, X.; Qu, J.; Zhang, J.; Jin, D. CTGF is overexpressed in papillary thyroid carcinoma and promotes the growth of papillary thyroid cancer cells. Tumor Biol. 2011, 32, 721–728. [Google Scholar] [CrossRef] [PubMed]
  71. Molè, D.; Gentilin, E.; Gagliano, T.; Tagliati, F.; Bondanelli, M.; Pelizzo, M.R.; Rossi, M.; Filieri, C.; Pansini, G.; degli Uberti, E.C.; et al. Protein kinase C: A putative new target for the control of human medullary thyroid carcinoma cell proliferation in vitro. Endocrinology 2012, 153, 2088–2098. [Google Scholar] [CrossRef] [PubMed]
  72. He, Z.; Way, K.J.; Arikawa, E.; Chou, E.; Opland, D.M.; Clermont, A.; Isshiki, K.; Ma, R.C.W.; Scott, J.A.; Schoen, F.J.; et al. Differential regulation of angiotensin II-induced expression of connective tissue growth factor by protein kinase C isoforms in the myocardium. J. Biol. Chem. 2005, 280, 15719–15726. [Google Scholar] [CrossRef] [PubMed]
  73. Tourkina, E.; Gooz, P.; Pannu, J.; Bonner, M.; Scholz, D.; Hacker, S.; Silver, R.M.; Trojanowska, M.; Hoffman, S. Opposing effects of protein kinase C and protein kinase C on collagen expression by human lung fibroblasts are mediated via MEK/ERK and caveolin-1 signaling. J. Biol. Chem. 2005, 280, 13879–13887. [Google Scholar] [CrossRef] [PubMed]
  74. Estour, B.; Herle, A.J.; Juillard, G.J.F.; Totanes, T.L.; Sparkes, R.S.; Giuliano, A.E.; Klandorf, H. Characterization of a human follicular thyroid carcinoma cell line (UCLA RO 82 W-1). Virchows Arch. B Cell Pathol. Mol. Pathol. 1989, 57, 167–174. [Google Scholar] [CrossRef]
  75. Aleshcheva, G.; Sahana, J.; Ma, X.; Hauslage, J.; Hemmersbach, R.; Egli, M.; Infanger, M.; Bauer, J.; Grimm, D. Changes in morphology, gene expression and protein content in chondrocytes cultured on a random positioning machine. PLoS ONE 2013, 8, e79057. [Google Scholar] [CrossRef] [PubMed]
  76. Aleshcheva, G.; Wehland, M.; Sahana, J.; Bauer, J.; Corydon, T.J.; Hemmersbach, R.; Frett, T.; Egli, M.; Infanger, M.; Grosse, J.; et al. Moderate alterations of the cytoskeleton in human chondrocytes after short-term microgravity produced by parabolic flight maneuvers could be prevented by upregulation of BMP-2 and SOX-9. FASEB J. 2015, 29, 2303–2314. [Google Scholar] [CrossRef] [PubMed]
  77. Wehland, M.; Aleshcheva, G.; Schulz, H.; Saar, K.; Hubner, N.; Hemmersbach, R.; Braun, M.; Ma, X.; Frett, T.; Warnke, E.; et al. Differential gene expression of human chondrocytes cultured under short-term altered gravity conditions during parabolic flight maneuvers. Cell Commun. Signal. 2015, 13. [Google Scholar] [CrossRef] [PubMed]
  78. Thomas, S.; Bonchev, D. A survey of current software for network analysis in molecular biology. Hum. Genom. 2010, 4, 353–360. [Google Scholar] [CrossRef]
  79. Meli, A.; Perrella, G.; Curcio, F.; Hemmersbach, R.; Neubert, J.; Impiombato, F.A. Response to thyrotropin of normal thyroid follicular cell strain FRTL5 in hypergravity. Biochimie 1999, 81, 281–285. [Google Scholar] [CrossRef]
  80. Meli, A.; Perrella, G.; Curcio, F.; Impiombato, F.A. Response to hypergravity of normal in vitro cultured follicular cells from thyroid. Acta Astronaut. 1998, 42, 465–472. [Google Scholar] [CrossRef]
  81. Albi, E.; Curcio, F.; Spelat, R.; Lazzarini, A.; Lazzarini, R.; Cataldi, S.; Loreti, E.; Ferri, I.; Ambesi-Impiombato, F.S. Loss of parafollicular cells during gravitational changes (microgravity, hypergravity) and the secret effect of pleiotrophin. PLoS ONE 2012, 7, e48518. [Google Scholar] [CrossRef] [PubMed]
  82. Albi, E.; Curcio, F.; Spelat, R.; Lazzarini, A.; Lazzarini, R.; Loreti, E.; Ferri, I.; Ambesi-Impiombato, F.S. Observing the mouse thyroid sphingomyelin under space conditions: A case study from the mds mission in comparison with hypergravity conditions. Astrobiology 2012, 12, 1035–1041. [Google Scholar] [CrossRef] [PubMed]
  83. Martin, A.; Zhou, A.; Gordon, R.E.; Henderson, S.C.; Schwartz, A.E.; Friedman, E.W.; Davies, T.F. Thyroid organoid formation in simulated microgravity: Influence of keratinocyte growth factor. Thyroid 2000, 10, 481–487. [Google Scholar] [PubMed]
  84. Masini, M.A.; Albi, E.; Barmo, C.; Bonfiglio, T.; Bruni, L.; Canesi, L.; Cataldi, S.; Curcio, F.; D’Amora, M.; Ferri, I.; et al. The impact of long-term exposure to space environment on adult mammalian organisms: A study on mouse thyroid and testis. PLoS ONE 2012, 7, e35418. [Google Scholar] [CrossRef] [PubMed]
  85. Albi, E.; Curcio, F.; Lazzarini, A.; Floridi, A.; Cataldi, S.; Lazzarini, R.; Loreti, E.; Ferri, I.; Ambesi-Impiombato, F.S. How microgravity changes galectin-3 in thyroid follicles. Biomed Res. Int. 2014, 2014, 652863. [Google Scholar] [CrossRef] [PubMed]
  86. Albi, E.; Curcio, F.; Lazzarini, A.; Floridi, A.; Cataldi, S.; Lazzarini, R.; Loreti, E.; Ferri, I.; Ambesi-Impiombato, F.S. A firmer understanding of the effect of hypergravity on thyroid tissue: Cholesterol and thyrotropin receptor. PLoS ONE 2014, 9, e98250. [Google Scholar] [CrossRef] [PubMed]
  87. Becker, J.L.; Souza, G.R. Using space-based investigations to inform cancer research on earth. Nat. Rev. Cancer 2013, 13, 315–327. [Google Scholar] [CrossRef] [PubMed]
Figure 1. Phase contrast microscopic pictures of UCLA RO82-W-1 1g-control cells (a), and RO82-W-1 cells cultivated on the Random Positioning Machine (RPM) in slides flasks; (b) and T25 cell culture flasks; (c) for 24 h. Control cells remained adherent and formed a (sub)confluent monolayer (a). In both RPM-samples, some cells remained adherent, while others detached forming 3D spheroids of similar size, thus constituting two distinct cell populations (b,c). Scale bars = 100 µm.
Ijms 17 00528 g001
Figure 2. Actin cytoskeleton network visualization and LOX gene expression analysis. Rhodamine-phalloidin staining of UCLA RO82-W-1 cells exposed to 1g (a) and altered gravity on the RPM; (b) for 24 h. White arrows designate stress fibers accumulating at the cell borders, the yellow arrow shows lamellipodia and filopodia, the orange one microvilli. Quantitative rtPCR analyses of the LOX gene expression in 1g-control cells, RPM-adherent cells (AD) and RPM-multicellular spheroids (MCS) cells after a 24 h-culture (c). Scale bars = 20 µm (a and b in bottom right corner).
Ijms 17 00528 g002
Figure 3. Quantitative real-time PCR of genes of cytoskeletal proteins (Genes of interest I): After 24 h, 1g-control, RPM-adherent (AD) and RPM-multicellular spheroids (MCS) were analyzed for their ACTB (a); KRT8 (b); EZR (c); RDX (d); ACTA2 (e); TUBB (f); MSN (g); and VCAM (h) gene expression levels. * = p < 0.05 vs. 1g; # = p < 0.05 vs. RPM AD.
Ijms 17 00528 g003aIjms 17 00528 g003b
Figure 4. Quantitative real-time PCR of genes of interest II and VEGF secretion. After 24 h, 1g-control, RPM-adherent (AD) and RPM-multicellular spheroids (MCS) were analyzed for their VEGFA (a); VEGFD (b); AKT1 (c); CTGF (d); FLK1 (f); PRKCA (g); and MCP1 (h) gene expression levels. In addition, VEGF secretion into the culture medium was determined (e) * = p < 0.05 vs. 1g; # = p < 0.05 vs. RPM AD.
Ijms 17 00528 g004
Figure 5. Quantitative real-time PCR of genes of interest III. After 24 h, 1g-control, RPM-adherent (AD) and RPM-multicellular spheroids (MCS) were analyzed for their MMP3 (a); CAV1 (b); TBFB1 (c); PAI1 (d); MMP9 (e); CAV2 (f); TGFBR1 (g) and RHOA (h) gene expression levels. * = p < 0.05 vs. 1g; # = p < 0.05 vs. RPM AD.
Ijms 17 00528 g005aIjms 17 00528 g005b
Figure 6. Mutual regulation network at gene expression level. FIGF-vascular endothelial growth factor D; KDR-kinase insert domain receptor; SERPINE1-plasminogen-activator inhibitor-1.
Ijms 17 00528 g006
Figure 7. Mutual regulation network at protein level and cellular localization of identified proteins.
Ijms 17 00528 g007
Table 1. Primer used for quantitative real-time PCR.
GeneF-PrimerSequenceR-PrimerSequence
18S rRNA18S-FGGAGCCTGCGGCTTAATTT18S-RCAACTAAGAACGGCCATGCA
ACTA2ACTA2-FGAGCGTGGCTATTCCTTCGTACTA2-RTTCAAAGTCCAGAGCTACATAACACAGT
ACTBACTB-FTGCCGACAGGATGCAGAAGACTB-RGCCGATCCACACGGAGTACT
AKT1AKT1-FCTTCTATGGCGCTGAGATTGTGAKT1-RCAGCATGAGGTTCTCCAGCT
CAV1CAV1-FCCTCCTCACAGTTTTCATCCACAV1-RTGTAGATGTTGCCCTGTTCC
CAV2CAV2-FGATCCCCACCGGCTCAACCAV2-RCACCGGCTCTGCGATCA
CTGFCTGF-FACAAGGGCCTCTTCTGTGACTTCTGF-FGGTACACCGTACCACCGAAGAT
EZREZR-FGCAATCCAGCCAAATACAACTGEZR-RCCACATAGTGGAGGCCAAAGTAC
FLK1FLK1-FTCTTCTGGCTACTTCTTGTCATCATCFLK1-RGATGGACAAGTAGCCTGTCTTCAGT
KRT8KRT8-FGATCTCTGAGATGAACCGGAACAKRT8-RGCTCGGCATCTGCAATGG
LOXLOX-FTGGGAATGGCACAGTTGTCALOX-RAGCCACTCTCCTCTGGGTGTT
MCP1MCP1-FGCTATAGAAGAATCACCAGCAGCAAMCP1-RTGGAATCCTGAACCCACTTCTG
MMP3MMP3-FACAAAGGATACAACAGGGACCAAMMP3-RTAGAGTGGGTACATCAAAGCTTCAGT
MMP9MMP9-FCCTGGAGACCTGAGAACCAATCMMP9-RTTCGACTCTCCACGCATCTCT
MSNMSN-FGAAATTTGTCATCAAGCCCATTGMSN-RCCATGCACAAGGCCAAGAT
PAI1PAI1-FAGGCTGACTTCACGAGTCTTTCAPAI1-RCACTCTCGTTCACCTCGATCTTC
PRKCAPRKCA-FTGGGTCACTGCTCTATGGACTTATCPRKCA-RCGCCCCCTCTTCTCAGTGT
RDXRDX-FGAAAATGCCGAAACCAATCAARDX-RGTATTGGGCTGAATGGCAAATT
RHOARHOA-FCGTTAGTCCACGGTCTGGTCRHOA-RGCCATTGCTCAGGCAACGAA
TGFB1TGFB1-FCACCCGCGTGCTAATGGTTGFB1-RAGAGCAACACGGGTTCAGGTA
TGFBR1TGFBR1-FCGCACTGTCATTCACCATCGTGFBR1-RCACGGAACCACGAACGTTC
TUBBTUBB-FCTGGACCGCATCTCTGTGTACTACTUBB-RGACCTGAGCGAACAGAGTCCAT
VCAMVCAM-FCATGGAATTCGAACCCAAACAVCAM-RGGCTGACCAAGACGGTTGTATC
VEGFAVEGFA-FGCGCTGATAGACATCCATGAACVEGFA-RCTACCTCCACCATGCCAAGTG
VEGFDVEGFD-FTGCAGGAGGAAAATCCACTTGVEGFD-RCTCGCAACGATCTTCGTCAA
ACTA2: α-actin-2; ACTB: Actin β; AKT1: Nuclear factor NF-κ-B activator 1; CAV1: Caveolin 1; CAV2: Caveolin 2; CTGF: Connective tissue growth factor; EZR: Ezrin; FLK1: Vascular endothelial growth factor receptor 2; KRT8: Cytokeratin-8; LOX: Oxidized low-density lipoprotein receptor 1; MCP1: Monocyte chemotactic protein 1; MMP3: Matrix metalloproteinase-3; MMP9: Matrix metalloproteinase-9; MSN: Moesin; PAI1: Plasminogen activator inhibitor 1; PRKCA: Protein kinase C alpha type; RDX: Radixin; RHOA: Ras homolog gene family, member A; TGFB1: Transforming growth factor β-1; TGFBR1: TGF-β receptor type-1; TUBB: Tubulin β, VCAM: Vascular cell adhesion protein 1; VEGFA: Vascular endothelial growth factor A; VEGFD: Vascular endothelial growth factor D; F: Forward; R: Reverse. All sequences are given in 5′–3′ direction.

