
Serum Interleukin-18, Fetuin-A, Soluble Intercellular Adhesion Molecule-1, and Endothelin-1 in Ankylosing Spondylitis, Psoriatic Arthritis, and SAPHO Syndrome


Abstract
:
1. Introduction
2. Results
2.1. Markers of Endothelial Function and Disease Activity in SpA
2.2. Markers of Endothelial Function and HLA-B27 in SpA
2.3. Markers of Endothelial Function and BMI and WHR in SpA
2.4. Markers of Endothelial Function and Lipid Profile in SpA
2.5. Markers of Endothelial Function, Treatment, and Comorbidities in SpA
3. Discussion
4. Materials and Methods
5. Conclusions
Acknowledgments
Author Contributions
Conflicts of Interest
References
- Peters, M.J.; van der Horst-Bruinsma, I.E.; Dijkmans, B.A.; Nurmohamed, M.T. Cardiovascular risk profile of patients with spondylarthropathies, particularly ankylosing spondylitis and psoriatic arthritis. Semin. Arthritis Rheum. 2004, 34, 585–592. [Google Scholar] [CrossRef] [PubMed]
- Divecha, H.; Sattar, N.; Rumley, A.; Cherry, L.; Lowe, G.D.; Sturrock, R. Cardiovascular risk parameters in men with ankylosing spondylitis in comparison with non-inflammatory control subjects: Relevance of systemic inflammation. Clin. Sci. 2005, 109, 171–176. [Google Scholar] [CrossRef] [PubMed]
- Han, C.; Robinson, D.W., Jr.; Hackett, M.V.; Paramore, L.C.; Fraeman, K.H.; Bala, M.V. Cardiovascular disease and risk factors in patients with rheumatoid arthritis, psoriatic arthritis, and ankylosing spondylitis. J. Rheumatol. 2006, 33, 2167–2672. [Google Scholar] [PubMed]
- Hahn, B.H.; Grossman, J.; Chen, W.; McMahon, M. The pathogenesis of atherosclerosis in autoimmune rheumatic diseases: Roles of inflammation and dyslipidemia. J. Autoimmun. 2007, 28, 69–75. [Google Scholar] [CrossRef] [PubMed]
- Malesci, D.; Niglio, A.; Mennillo, G.A.; Buono, R.; Valentini, G.; La Montagna, G. High prevalence of metabolic syndrome in patients with ankylosing spondylitis. Clin. Rheumatol. 2007, 26, 710–714. [Google Scholar] [CrossRef] [PubMed]
- Sidiropoulos, P.I.; Karvounaris, S.A.; Boumpas, D.T. Metabolic syndrome in rheumatic diseases: Epidemiology, pathophysiology, and clinical implications. Arthritis Res. Ther. 2008, 10, 207. [Google Scholar] [CrossRef] [PubMed]
- Mok, C.C.; Ko, G.T.; Ho, L.Y.; Yu, K.L.; Chan, P.T.; To, C.H. Prevalence of atherosclerotic risk factors and the metabolic syndrome in patients with chronic inflammatory arthritis. Arthritis Care Res. (Hoboken) 2011, 63, 195–202. [Google Scholar] [CrossRef] [PubMed]
- Semb, A.G.; Kvien, T.K.; DeMicco, D.A.; Fayyad, R.; Wun, C.C.; LaRosa, J.; Betteridge, J.; Pedersen, T.R.; Holme, I. Prediction of cardiovascular events in patients with ankylosing spondylitis and psoriatic arthritis: Role of lipoproteins in a high-risk population. J. Rheumatol. 2012, 39, 1433–1440. [Google Scholar] [CrossRef] [PubMed]
- Papagoras, C.; Markatseli, T.E.; Saougou, I.; Alamanos, Y.; Zikou, A.K.; Voulgari, P.V.; Kiortsis, D.N.; Drosos, A.A. Cardiovascular risk profile in patients with spondyloarthritis. J. Bone Spine 2014, 8, 57–63. [Google Scholar] [CrossRef] [PubMed]
- Van Der Linden, S.; Valkenburg, H.A.; Cats, A. Evaluation of diagnostic criteria for ankylosing spondylitis. A proposal for modification of the New York criteria. Arthritis Rheum. 1984, 27, 361–368. [Google Scholar] [CrossRef] [PubMed]
- Taylor, W.; Gladman, D.; Helliwell, P.; Marchesoni, A.; Mease, P.; Mielants, H.; CASPAR Study Group. Classification criteria for psoriatic arthritis: Development of new criteria from a large international study. Arthritis Rheum. 2006, 54, 2665–2673. [Google Scholar] [CrossRef] [PubMed]
- Kahn, M.F.; Khan, M.A. The SAPHO—Syndrome. Baillieres Clin. Rheumatol. 1994, 8, 333–362. [Google Scholar] [CrossRef]
- Mallat, Z.; Corbaz, A.; Scoazec, A.; Besnard, S.; Lesèche, G.; Chvatchko, Y.; Tedqui, A. Expression of interleukin-18 in human atherosclerotic plaques and relation to plaque instability. Circulation 2001, 104, 1598–1603. [Google Scholar] [CrossRef] [PubMed]
- Blankenberg, S.; Luc, G.; Ducimetière, P.; Arveiler, D.; Ferrières, J.; Amouyel, P.; Evans, A.; Cambien, F.; Tiret, L. Interleukin-18 and the risk of coronary heart disease in European men: The Prospective Epidemiological Study of Myocardial Infarction (PRIME). Circulation 2003, 108, 2453–2459. [Google Scholar] [CrossRef] [PubMed]
- Maksimowicz-McKinnon, K.; Bhatt, D.L.; Calabrese, L.H. Recent advances in vascular inflammation: C-reactive protein and other inflammatory biomarkers. Curr. Opin. Rheumatol. 2004, 16, 18–24. [Google Scholar] [CrossRef] [PubMed]
- Reynolds, J.L.; Skepper, J.N.; McNair, R.; Kasama, T.; Gupta, K.; Weissberg, P.L.; Jahnen-Dechent, W.; Shanahan, C.M. Multifunctional roles for serum protein fetuin-a in inhibition of human vascular smooth muscle cell calcification. J. Am. Soc. Nephrol. 2005, 16, 2920–2930. [Google Scholar] [CrossRef] [PubMed]
- Bohm, F.; Pernow, J. The importance of endothelin-1 for vascular dysfunction in cardiovascular disease. Cardiovasc. Res. 2007, 76, 8–18. [Google Scholar] [CrossRef] [PubMed]
- Jahnen-Dechent, W.; Heiss, A.; Schäfer, C.; Ketteler, M. Fetuin-A regulation of calcified matrix metabolism. Circ. Res. 2011, 108, 1494–509. [Google Scholar] [CrossRef] [PubMed]
- Badimon, I.; Romero, J.C.; Cubedo, J. Circulating biomarkers. Thromb. Res. 2012, 130, S12–S15. [Google Scholar] [CrossRef] [PubMed]
- Brylka, L.; Jahnen-Dechent, W. The role of fetuin-A in physiological and pathological mineralization. Calcif. Tissue Int. 2013, 93, 355–364. [Google Scholar] [CrossRef] [PubMed]
- Przepiera-Będzak, H.; Fischer, K.; Brzosko, M. Serum IL-6 and IL-23 levels and their correlation with angiogenic cytokines and disease activity in ankylosing spondylitis, psoriatic arthritis, and SAPHO syndrome. Mediat. Inflamm. 2015, 2015, 785705. [Google Scholar] [CrossRef] [PubMed]
- Caliskan, M.; Erdogan, D.; Gullu, H.; Yilmaz, S.; Gursoy, Y.; Yildirir, A.; Yucel, E.; Muderrisoglu, H. Impaired coronary microvascular and left ventricular diastolic functions in patients with ankylosing spondylitis. Atherosclerosis 2008, 196, 306–312. [Google Scholar] [CrossRef] [PubMed]
- Drouart, M.; Saas, P.; Billot, M.; Cedoz, J.P.; Tiberghien, P.; Wendling, D.; Toussirot, É. High serum vascular endothelial growth factor correlates with disease activity of spondylarthropaties. Clin. Exp. Immunol. 2003, 132, 158–162. [Google Scholar] [CrossRef] [PubMed]
- Przepiera-Będzak, H.; Fischer, K.; Brzosko, M. Serum levels of angiogenic cytokines in psoriatic arthritis and SAPHO syndrome. Polskie Arch. Med. Wewn. 2013, 123, 297–302. [Google Scholar]
- Poddubnyy, D.; Conrad, K.; Haibel, H.; Syrbe, U.; Appel, H.; Braun, J.; Rudwaleit, M.; Sieper, J. Elevated serum level of the vascular endothelial growth factor predicts radiographic spinal progression in patients with axial spondyloarthritis. Ann. Rheum. Dis. 2014, 73, 2137–2143. [Google Scholar] [CrossRef] [PubMed]
- Przepiera-Będzak, H.; Fischer, K.; Brzosko, M. Serum VEGF, EGF, basic FGF, and acidic FGF levels and their association with disease activity and extra‑articular symptoms in ankylosing spondylitis. Polskie Arch. Med. Wewn. 2016, 126, 290–292. [Google Scholar] [CrossRef] [PubMed]
- Sari, I.; Okan, T.; Akar, S.; Cece, H.; Altay, C.; Secil, M.; Onen, F.; Akkoc, N. Impaired endothelial function in patients with ankylosing spondylitis. Rheumatology (Oxford) 2006, 45, 283–286. [Google Scholar] [CrossRef] [PubMed]
- Rooney, T.; Murphy, E.; Benito, M.; Roux-Lombard, P.; FitzGerald, O.; Dayer, J.M.; Bresnihan, B. Synovial tissue interleukin-18 expression and the response to treatment in patients with inflammatory arthritis. Ann. Rheum. Dis. 2004, 63, 1393–1398. [Google Scholar] [CrossRef] [PubMed]
- Hurtado-Nedelec, M.; Chollet-Martin, S.; Nicaise-Roland, P.; Grootenboer-Mignot, S.; Ruimy, R.; Meyer, O.; Hayem, G. Characterization of the immune response in the synovitis, acne, pustulosis, hyperostosis, osteitis (SAPHO) syndrome. Rheumatology 2008, 47, 1160–1167. [Google Scholar] [CrossRef] [PubMed]
- Sari, I.; Kebapcilar, L.; Taylan, A.; Bilgir, O.; Kozaci, D.L.; Yildiz, Y.; Yuksel, A.; Gunay, N.; Akkoc, N. Fetuin-A and interleukin-18 levels in ankylosing spondylitis. Int. J. Rheum. Dis. 2010, 13, 75–81. [Google Scholar] [CrossRef] [PubMed]
- Surdacki, A.; Sulicka, J.; Korkosz, M.; Mikolajczyk, T.; Telesinska-Jasiówka, D.; Klimek, E.; Kierzkowska, I.; Guzik, T.; Grodzicki, T.K. Blood monocyte heterogeneity and markers of endothelial activation in ankylosing spondylitis. J. Rheumatol. 2014, 41, 481–489. [Google Scholar] [CrossRef] [PubMed]
- Tuylu, T.; Sari, I.; Solmaz, D.; Kozaci, D.L.; Akar, S.; Gunay, N.; Onen, F.; Akkoc, N. Fetuin-A is related to syndesmophytes in patients with ankylosing spondylitis: A case control study. Clinics (Sao Paulo) 2014, 69, 688–693. [Google Scholar] [CrossRef]
- Wang, J.; Sun, C.; Gerdes, N.; Liu, C.; Liao, M.; Liu, J.; Shi, A.; He, A.; Zhou, Y.; Sukhova, G.K.; et al. Interleukin 18 function in atherosclerosis is mediated by the interleukin 18 receptor and the Na–Cl co-transporter. Nat. Med. 2015, 21, 820–826. [Google Scholar] [CrossRef] [PubMed]
- Wendling, D.; Racadot, E.; Augé, B.; Toussirot, E. Soluble intercellular adhesion molecule 1 in spondylarthropathies. Clin. Rheumatol. 1998, 17, 202–204. [Google Scholar] [CrossRef] [PubMed]
- Sari, I.; Kebapcilar, L.; Alacacioglu, A.; Bilgir, O.; Yildiz, Y.; Taylan, A.; Yuksel, A.; Kozaci, D.L. Increased levels of asymmetric dimethylarginine (ADMA) in patients with ankylosing spondylitis. Intern. Med. 2009, 48, 1363–1368. [Google Scholar] [CrossRef] [PubMed]
- Ashcroft, D.M.; Li Wan Po, A.; Williams, H.C.; Griffiths, C.E.M. Clinical measures of disease severity and outcome in psoriasis: A critical appraisal of their quality. Dr. J. Dermatol. 1999, 141, 185–191. [Google Scholar] [CrossRef]
- Garrett, S.; Jenkinson, T.; Kennedy, L.G.; Whitelock, H.; Gaisford, P.; Calin, A. A new approach to defining disease status in ankylosing spondylitis: The bath ankylosing spondylitis disease activity index. J. Rheumatol. 1994, 21, 2286–2291. [Google Scholar] [PubMed]


| Assessed Parameter | SpA Patients (n = 191) Mean ± SD Median (Q1, Q3) | AS Patients (n = 81) Mean ± SD Median (Q1, Q3) | PsA Patients (n = 76) Mean ± SD Median (Q1, Q3) | SAPHO Syndrome Patients (n = 34) Mean ± SD Median (Q1, Q3) | Controls (n = 30) Mean ± SD Median (Q1, Q3) |
|---|---|---|---|---|---|
| Age (years) | 48.3 ± 13.1 | 44.7 ± 13.2 | 50.8 ± 12.7 | 51.7 ± 12.0 | 43.5 ± 9.4 |
| Sex | F. 94, M. 97 | F. 20, M. 61 | F. 43, M. 33 | F. 31, M. 3 | F. 19, M. 11 |
| Disease duration (years) | 5.0 (2.0, 10.0) | 10.0 (5.0, 15.0) | 4.0 (2.0, 8.0) | 2.0 (1.0, 5.0) | 0 |
| Peripheral arthritis, n (%) | 97 (50.8%) | 31 (38.3%) | 61 (80.3%) | 5 (14.7%) | 0 |
| AAU, n (%) | 27 (14.1%) | 27 (33.3%) | 0 (0%) | 0 (0%) | 0 |
| IBD, n (%) | 8 (4.2%) | 8 (9.9%) | 0 | 0 | 0 |
| VAS pain (mm) | 51.4 ± 24.9 | 59.4 ± 26.8 | 44.9 ± 22.0 | 46.9 ± 20.7 | 0 |
| BASDAI | 4.2 ± 2.8 | 5.5 ± 2.6 | 2.8 ± 2.4 | 4.2 ± 2.5 | 0 |
| ASDAS-ESR | 2.4 (12.8, 3.2) | 2.55 (2.0, 3.25) | 1.8 (1.6, 2.2) | - | - |
| DAS28 | 4.24 (3.76, 4.54) | - | 4.24 (3.76, 4.54) | - | - |
| PASI | 1.0 (0.0, 3.3) | 0 | 1.0 (0.0, 3.3) | 0 | 0 |
| HLA-B27 number positive/number assessed (%) | 91/151 (60.3%) | 75/78 (96.1%) | 13/51 (25.4%) | 3/22 (13.6%) | 0 |
| CRP (mg/L) | 5.5 (2.1, 12.3) | 6.7 (3.5, 13.6) | 4.1 (1.7, 10.2) | 4.3 (1.0, 12.4) | 0.0 |
| ESR (mm/h) | 14.0 (6.0, 25.0) | 12.0 (5.0, 26.0) | 13.0 (6.0, 22.0) | 19.0 (6.0, 32.0) | 9.0 (2.0, 16.0) |
| IL-6 (pg/mL) | 3.3 (1.5, 6.6) | 4.06 (1.8, 7.92) | 2.79 (1.47, 6.35) | 2.5 (1.0, 6.61) | 1.15 (0.6, 1.5) |
| IL-23 (pg/mL) | 0.3 (0.0, 2.0) | 0.3 (0.0, 2.0) | 0.0 (0.0, 1.4) | 0.0 (0.0, 0.3) | 0.0 (0.0, 0.0) |
| VEGF (pg/mL) | 347.4 (226.0, 562.2) | 351.2 (223.2, 572.1) | 343.5 (220.2, 666.4) | 320.0 (240.0, 375.0) | 270.0 (180.0, 445.0) |
| EGF (pg/mL) | 104.0 (68.0, 182.0) | 96.0 (68.0, 182.0) | 126.0 (66.0, 196.0) | 93.0 (58.0, 168.0) | 81. 0 (38.0, 134.0) |
| Hypertension | 47 (24.6%) | 25 (30.9%) | 13 (17.1%) | 9 (26.5%) | 0 |
| Diabetes | 6 (31.4%) | 2 (2.5%) | 1 (1.3%) | 3 (8.8%) | 0 |
| IHD | 19 (9.9%) | 10 (12.3%) | 7 (9.2%) | 2 (5.9%) | 0 |
| Smoking | 24 (12.6%) | 12 (14.8%) | 3 (3.7%) | 9 (26.5%) | 0 |
| BMI | 26.4 ± 4.1 | 26.0 ± 4.0 | 26.9 ± 4.2 | 26.8 ± 4.6 | 24.2 ± 3.4 |
| WHR | 0.88 ± 0.07 | 0.89 ± 0.08 | 0.88 ± 0.07 | 0.85 ± 0.06 | - |
| Total cholesterol (mmol/L) | 209.8 ± 40.6 | 200.0 ± 38.2 | 217.4 ± 41.5 | 218.1 ± 40.8 | 229.0 ± 40.0 |
| HDL cholesterol (mmol/L) | 59.5 ± 17.4 | 58.8 ± 17.7 | 59.4 ± 18.3 | 61.6 ± 15.3 | 62.5 ± 10.1 |
| LDL cholesterol (mmol/L) | 127.7 ± 37.0 | 121.1 ± 34.5 | 132.1 ± 40.0 | 135.1 ± 35.8 | 139.2 ± 33.8 |
| Triglyceride (mmol/L) | 129.1 ± 69.3 | 115.2 ± 63.3 | 143.5 ± 71.3 | 133.9 ± 75.6 | 135.8 ± 60.3 |
| NSAIDs only | 46 (24.1%) | 25 (30.9%) | 16 (21.1%) | 5 (14.7%) | 0 (0%) |
| NSADSs with sulfasalazine | 90 (47.1%) | 47 (58%) | 31 (40.8%) | 12 (35.3%) | 0 (0%) |
| NSAIDS with methotrexate | 51 (26.7%) | 9 (11.1%) | 25 (32.9%) | 17 (50.0%) | 0 (0%) |
| NSAIDS with methotrexate and cyclosporine | 4 (2.1%) | 0 (0%) | 4 (5.3%) | 0 (0%) | 0 (0%) |
| Hypertensive drugs | 47 (24.6%) | 25 (30.9%) | 13 (17.1%) | 9 (26.5%) | 0 (0%) |
| Assessed Parameter | SpA Patients (n = 191) Mean ± SD Median (Q1, Q3) | p-Value | * p-Value | AS Patients (n = 81) Mean ± SD Median (Q1, Q3) | p-Value | * p-Value | PsA Patients (n = 76) Mean ± SD Median (Q1, Q3) | p-Value | * p-Value | SAPHO Syndrome Patients (n = 34) Mean ± SD Median (Q1, Q3) | p-Value | * p-Value | Controls (n = 30) Mean ± SD Median (Q1, Q3) |
|---|---|---|---|---|---|---|---|---|---|---|---|---|---|
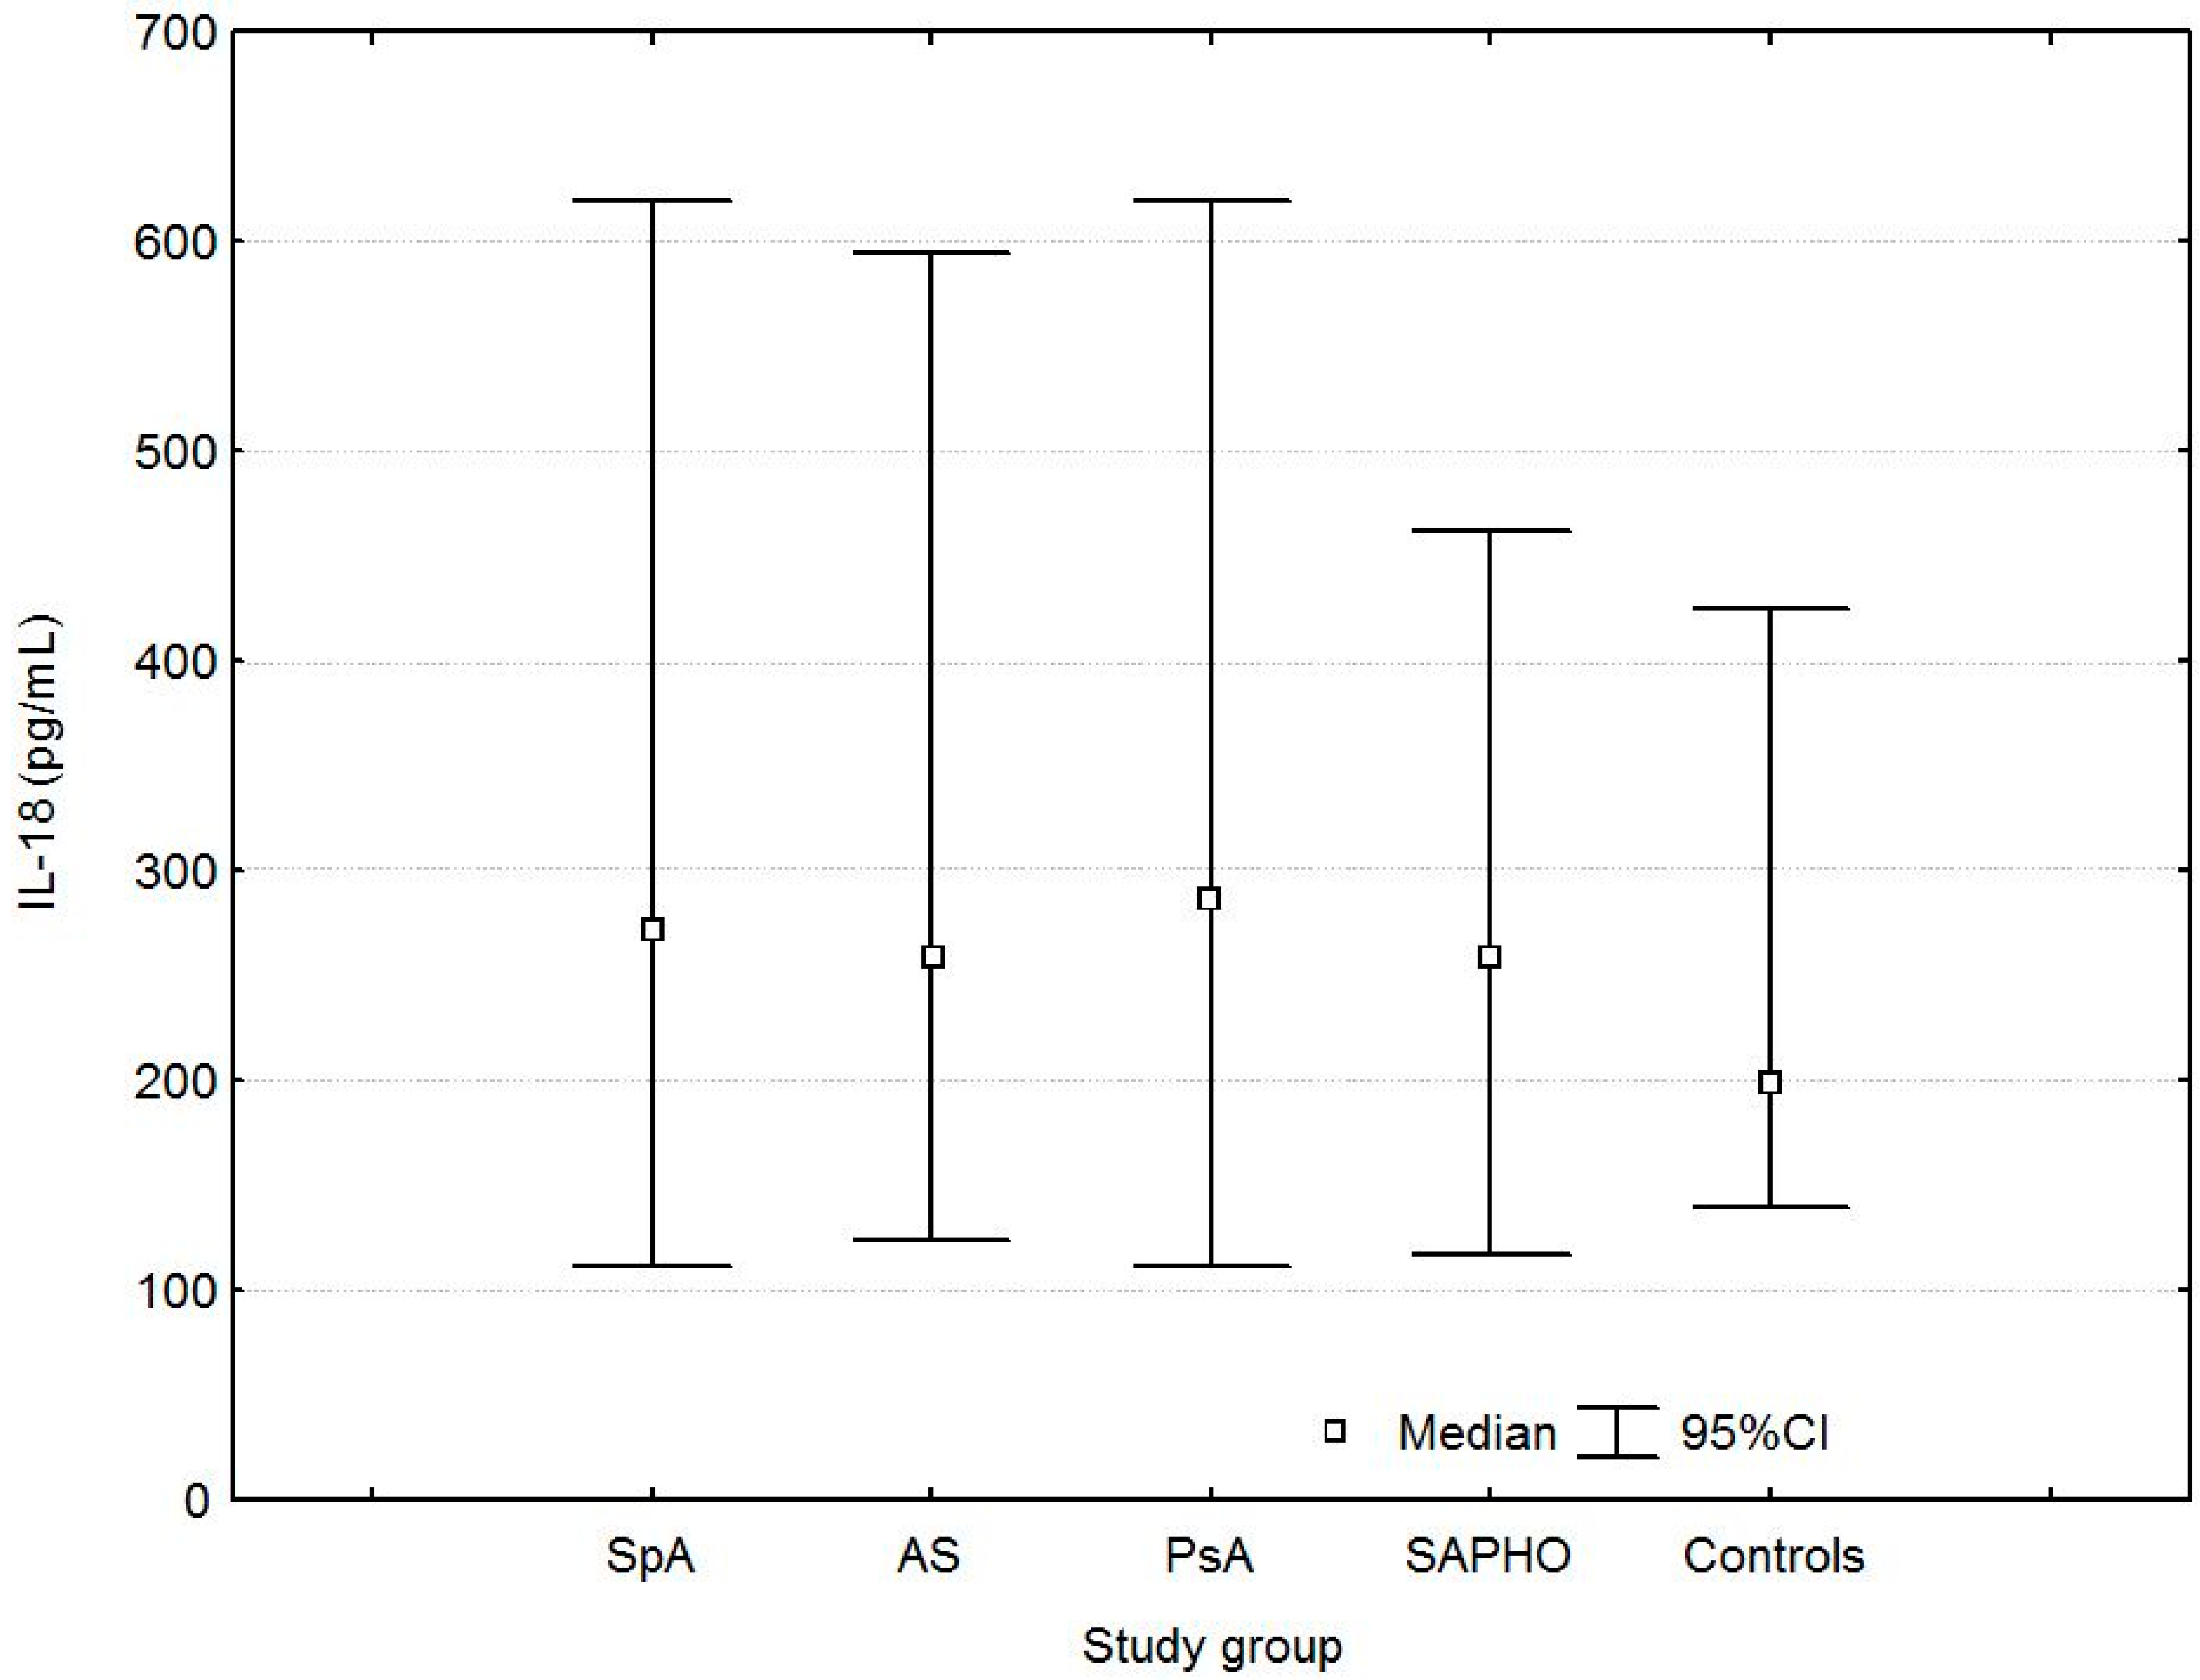
| IL-18 (pg/mL) | 271.8 (207.3, 373.9) | 0.0003 | 0.0116 | 259.7 (210.1, 372.3) | 0.001 | 0.03 | 286.0 (219.6, 383.2) | 0.0003 | 0.01 | 259.4 (193.3, 339.0) | 0.01 | 0.01 | 198.9 (165.1, 271.5) |
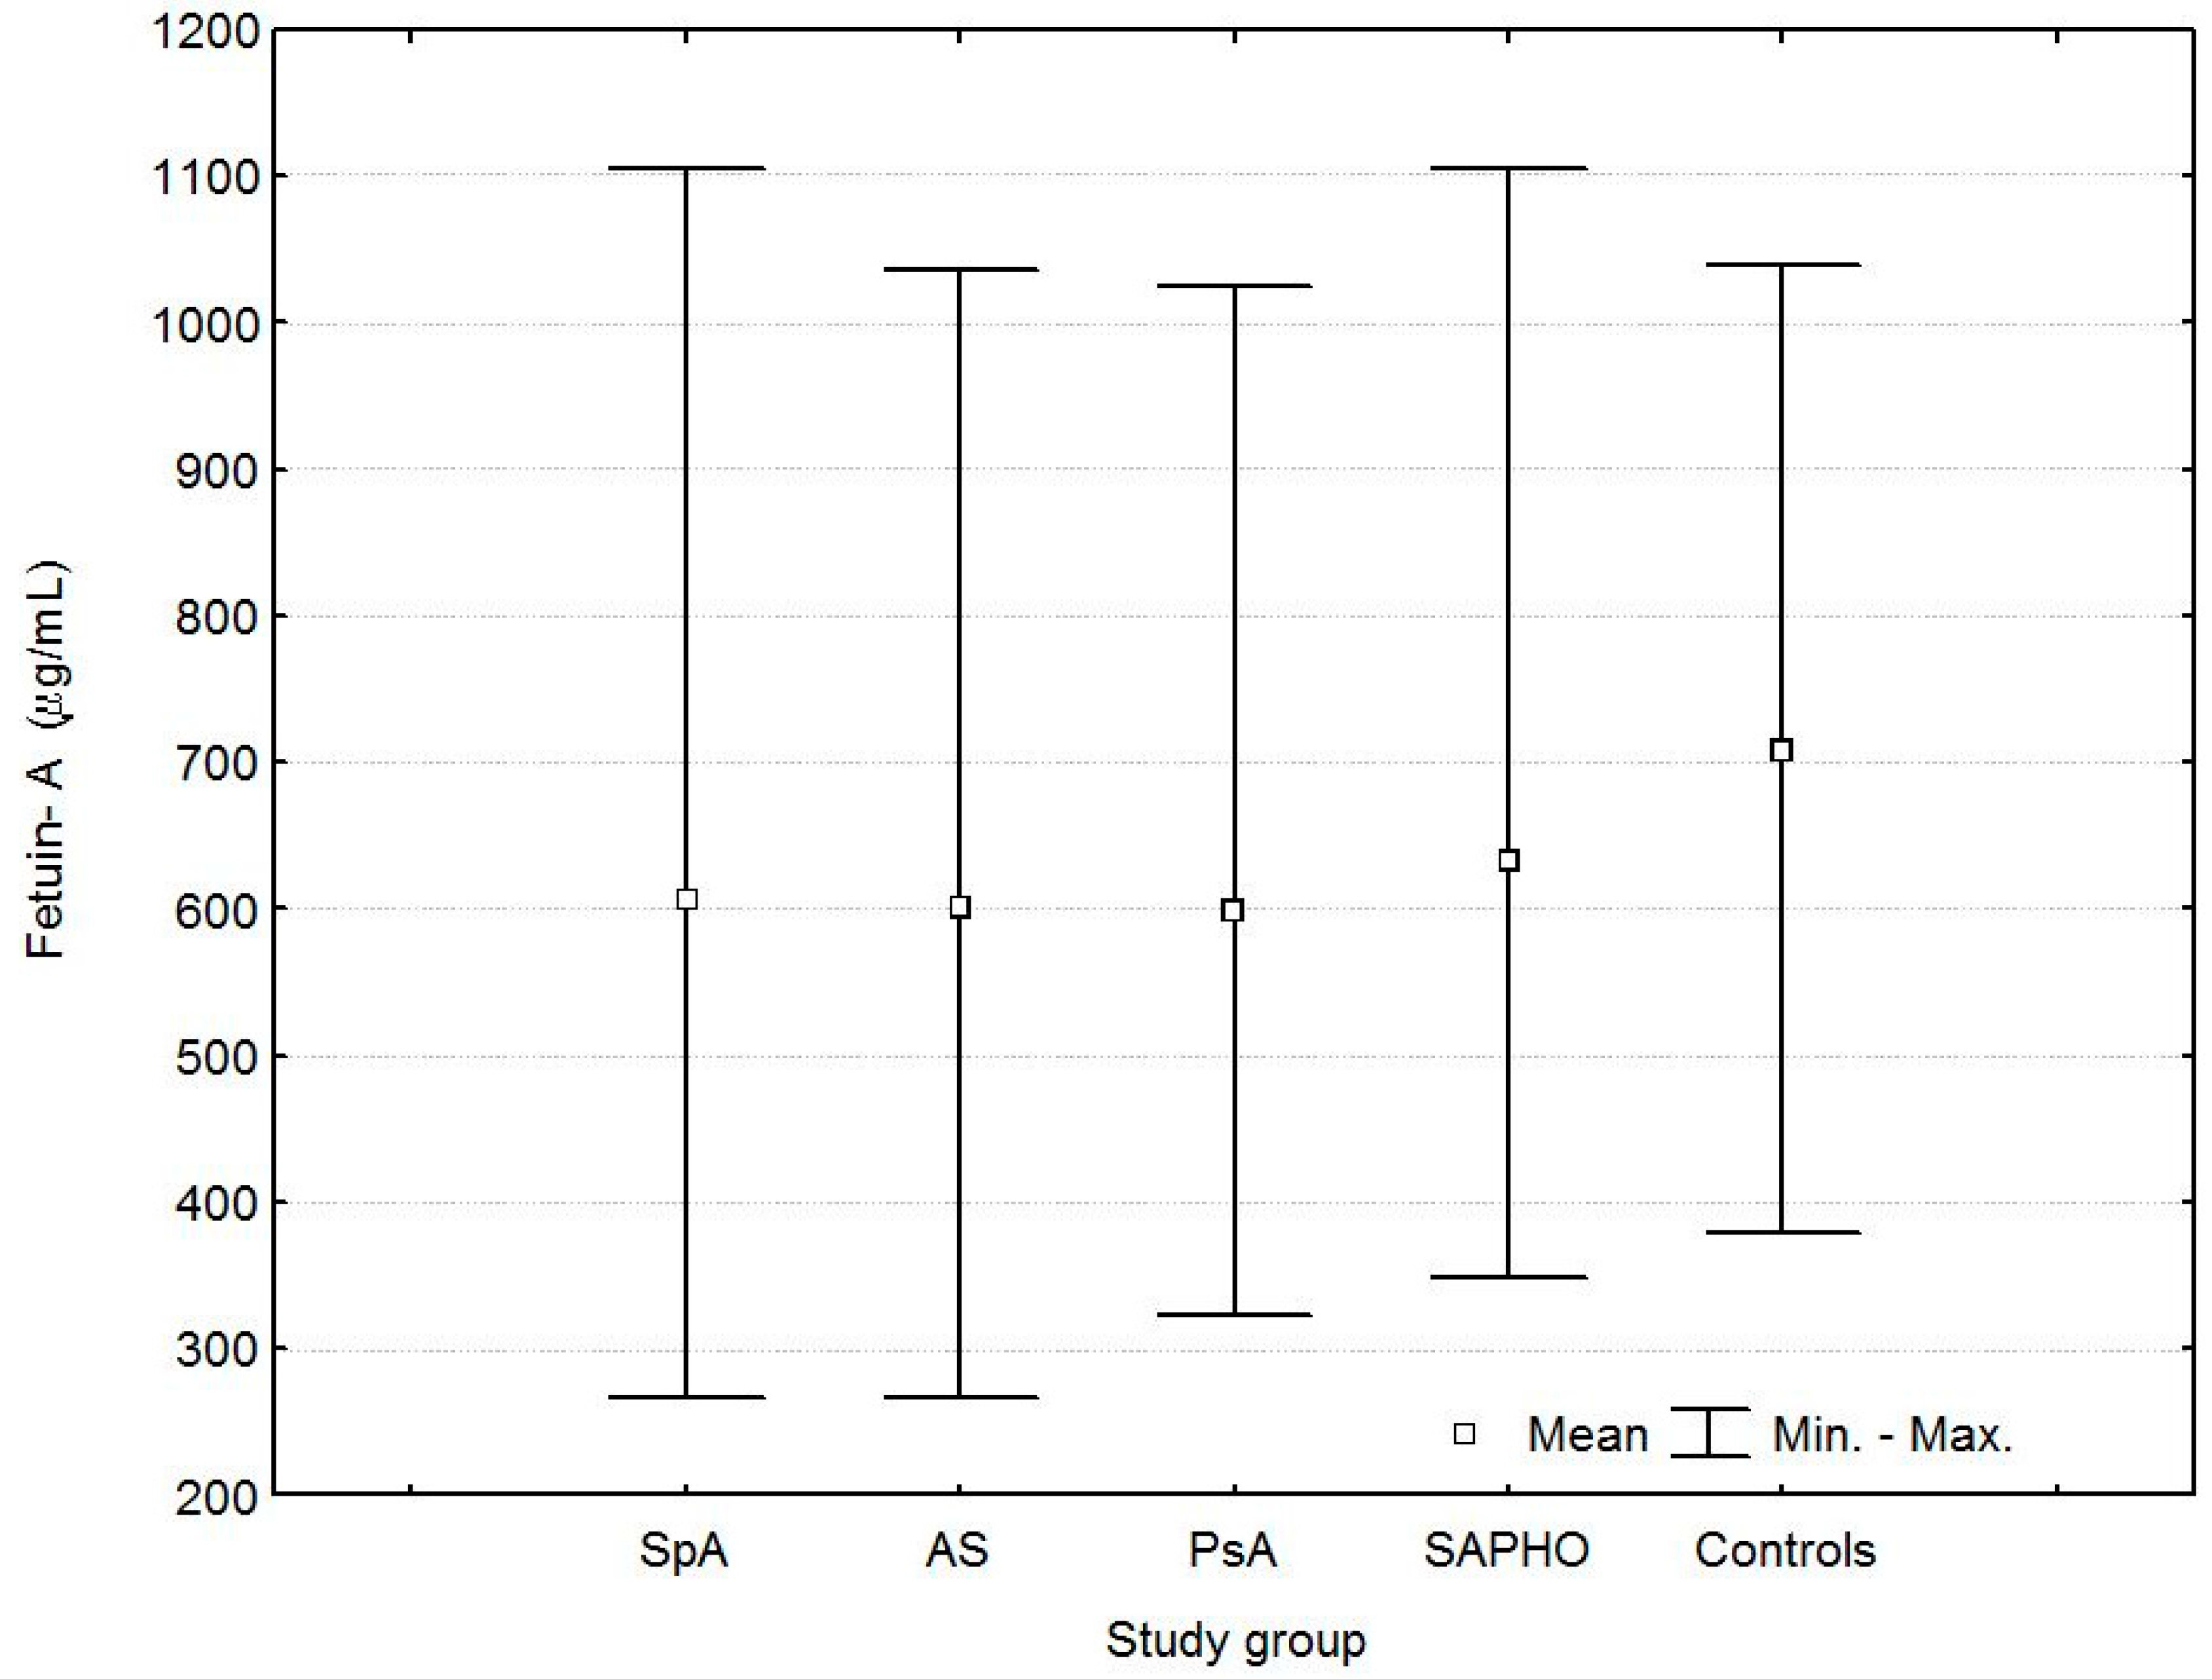
| Fetuin-A (µg/mL) | 606.0 ± 155.3 | 0.001 | 0.0059 | 601.0 ± 147.8 | 0.001 | 0.1 | 599.5 ± 152.7 | 0.001 | 0.004 | 632.2 ± 179.0 | 0.08 | 0.1 | 709.1 ± 169.3 |
| sICAM-1 (ng/mL) | 234.4 ± 61.9 | 0.2 | 0.6710 | 228.8 ± 57.8 | 0.5 | 0.7 | 237.9 ± 63.4 | 0.2 | 0.6 | 239.7 ± 68.7 | 0.2 | 0.7 | 220.0 ± 69.9 |
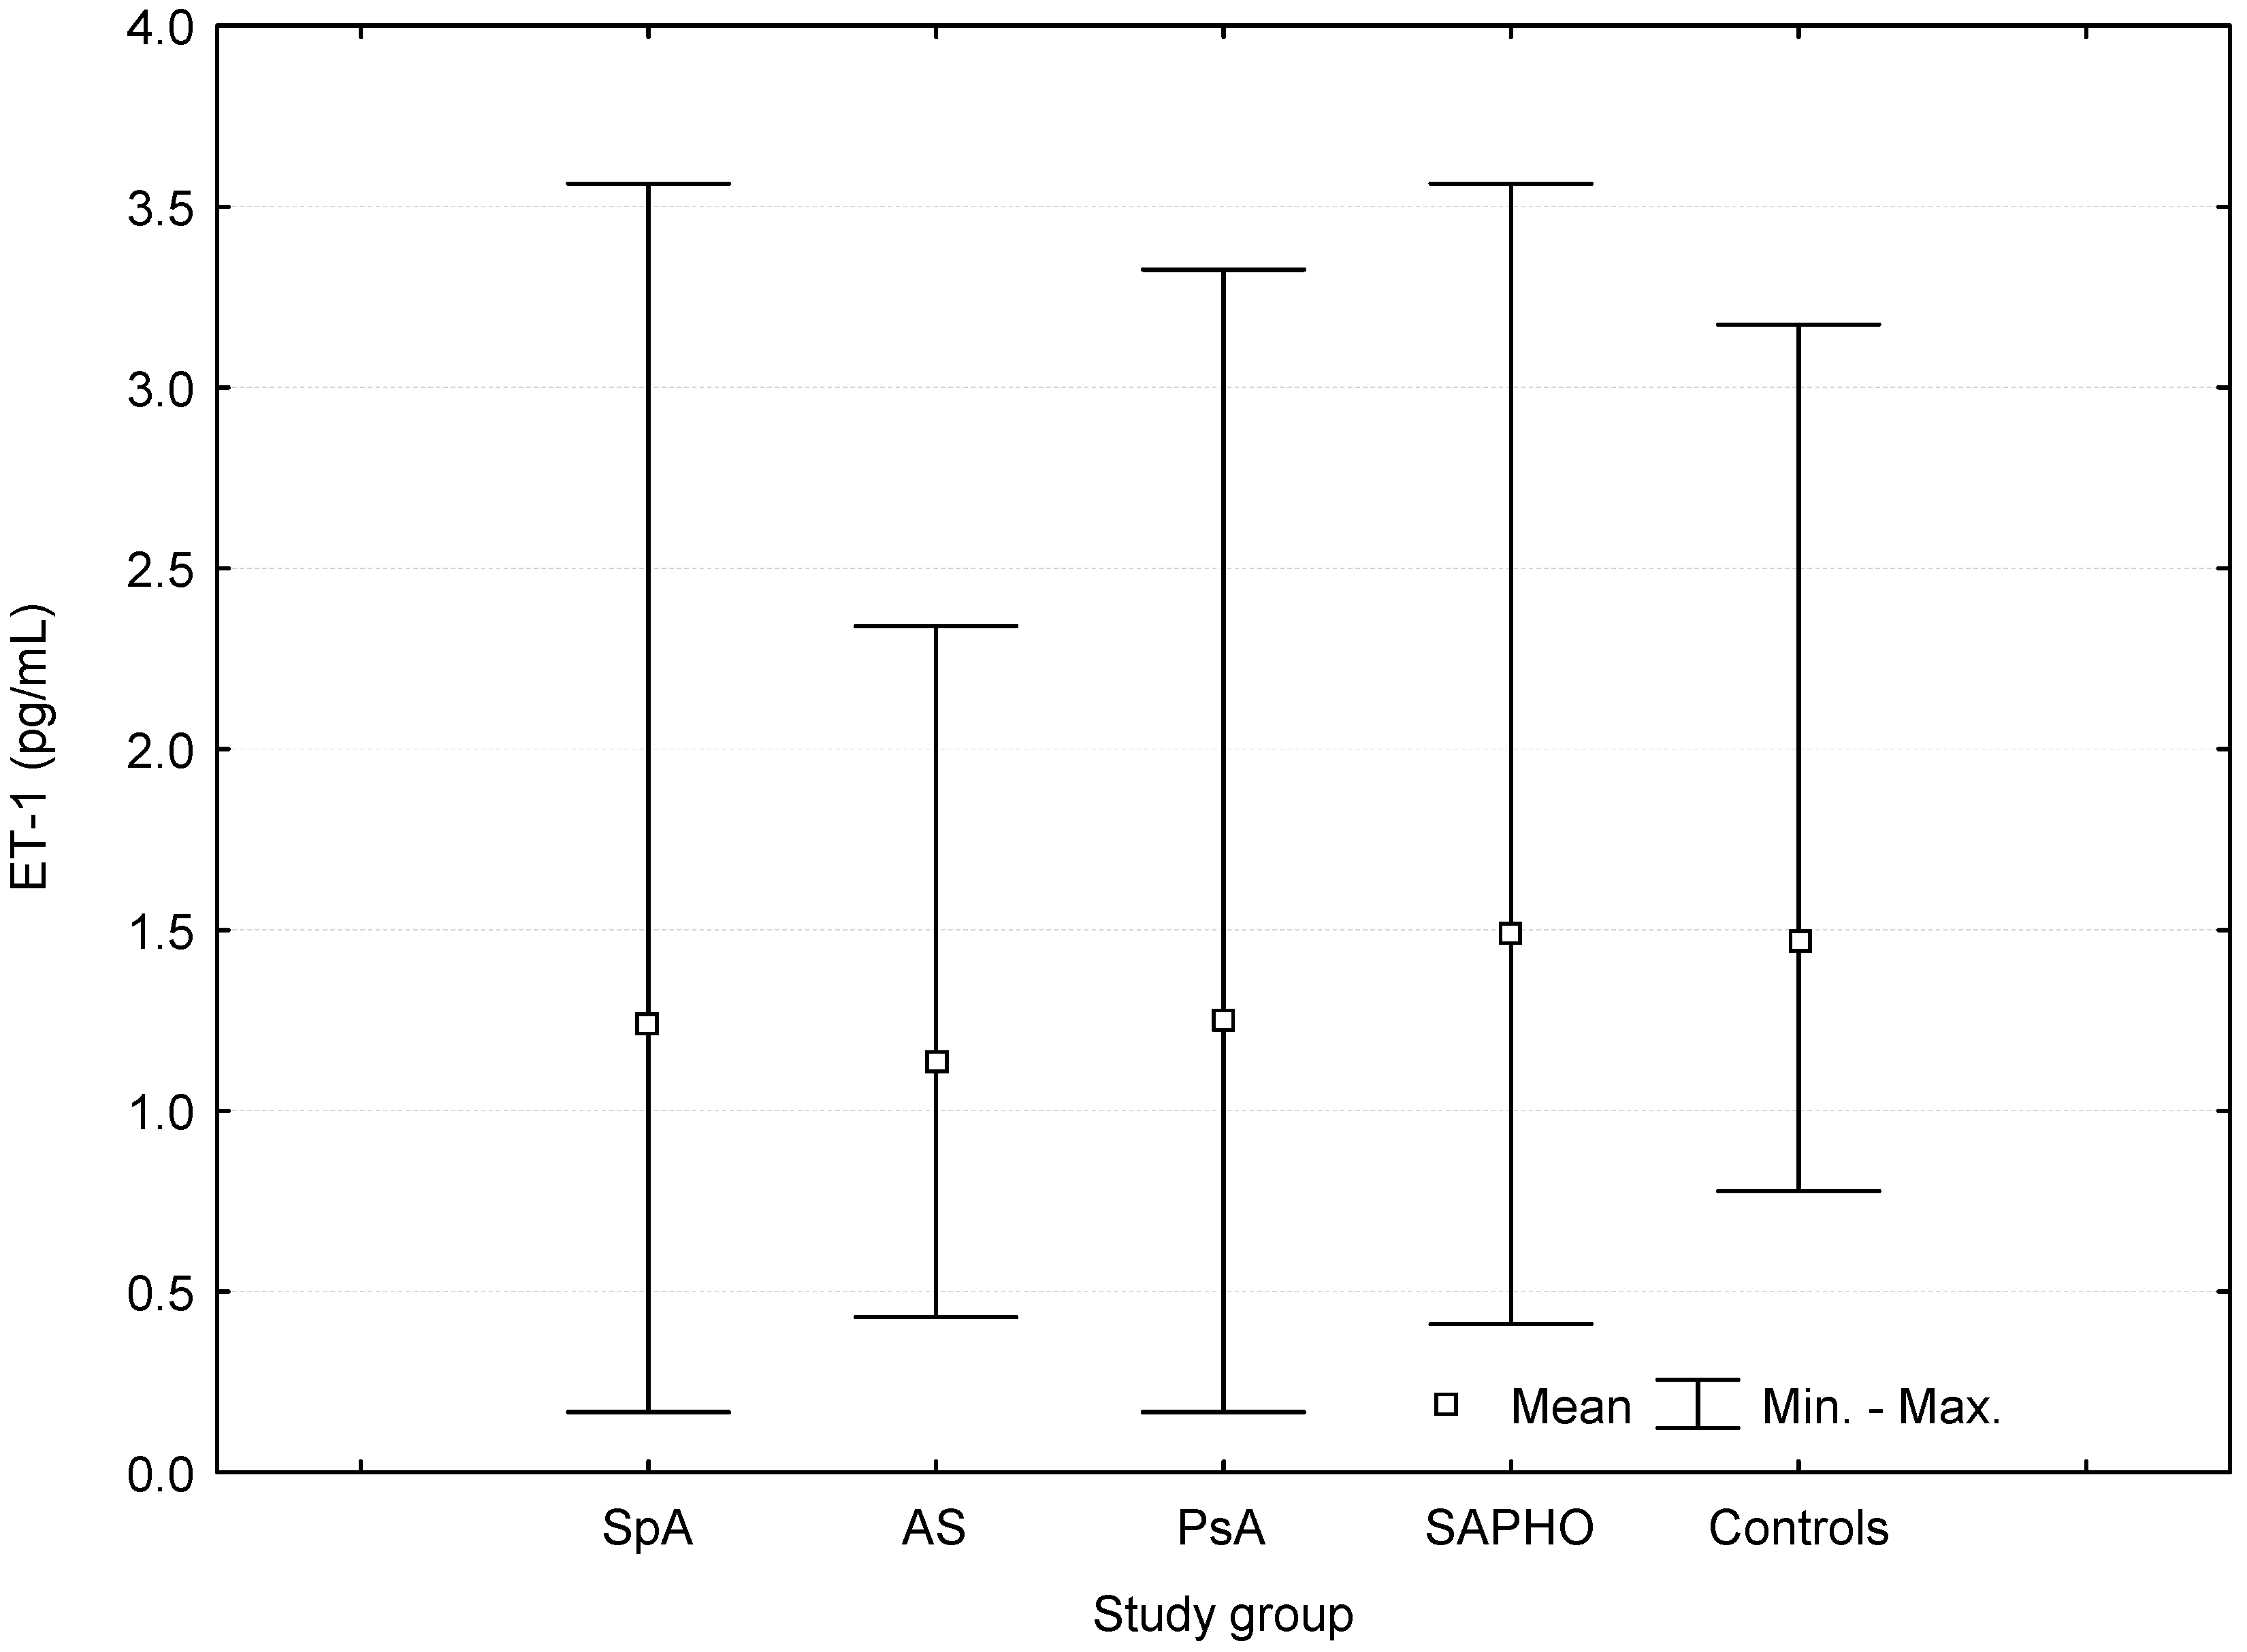
| ET-1 (pg/mL) | 1.24 ± 0.53 | 0.03 | 0.0213 | 1.13 ± 0.38 | 0.0005 | 0.0003 | 1.25 ± 0.58 | 0.08 | 0.02 | 1.49 ± 0,64 | 0.87 | 0.82 | 1.47 ± 0.57 |
| Covariates | IL-18 ≥ 227.45 pg/mL | Fetuin-A ≤ 608.5 µg/mL | sICAM-1 ≥ 172.95 ng/mL | ET-1 ≤ 1.081 pg/mL | ||||
|---|---|---|---|---|---|---|---|---|
| OR (95% CI) | p | OR (95% CI) | p | OR (95% CI) | p | OR (95% CI) | p | |
| SpA | 3.22 (1.37–7.55) | 0.007 | 4.14 (1.59–10.81) | 0.004 | 2.7 (1.07–6.78) | 0.03 | 6.73 (2.13–21.27) | 0.001 |
| AS | 2.31 (0.84–6.32) | 0.1 | 2.63 (0.87–7.92) | 0.09 | 3.75 (1.03–13.74) | 0.04 | 10.24 (2.89–36.23) | <0.0001 |
| PsA | 4.07 (1.53–10.82) | 0.005 | 5.5 (1.91–15.91) | 0.002 | 3.08 (1.03–9.23) | 0.04 | 7.01 (2.02–24.34) | 0.002 |
| SAPHO | 3.08 (0.98–9.65) | 0.05 | 3.89 (1.12–13.56) | 0.03 | 1.87 (0.55–6.41) | 0.3 | 3.07 (0.69–13.73) | 0.142 |
© 2016 by the authors; licensee MDPI, Basel, Switzerland. This article is an open access article distributed under the terms and conditions of the Creative Commons Attribution (CC-BY) license (http://creativecommons.org/licenses/by/4.0/).
Share and Cite
Przepiera-Będzak, H.; Fischer, K.; Brzosko, M. Serum Interleukin-18, Fetuin-A, Soluble Intercellular Adhesion Molecule-1, and Endothelin-1 in Ankylosing Spondylitis, Psoriatic Arthritis, and SAPHO Syndrome. Int. J. Mol. Sci. 2016, 17, 1255. https://doi.org/10.3390/ijms17081255
Przepiera-Będzak H, Fischer K, Brzosko M. Serum Interleukin-18, Fetuin-A, Soluble Intercellular Adhesion Molecule-1, and Endothelin-1 in Ankylosing Spondylitis, Psoriatic Arthritis, and SAPHO Syndrome. International Journal of Molecular Sciences. 2016; 17(8):1255. https://doi.org/10.3390/ijms17081255
Chicago/Turabian StylePrzepiera-Będzak, Hanna, Katarzyna Fischer, and Marek Brzosko. 2016. "Serum Interleukin-18, Fetuin-A, Soluble Intercellular Adhesion Molecule-1, and Endothelin-1 in Ankylosing Spondylitis, Psoriatic Arthritis, and SAPHO Syndrome" International Journal of Molecular Sciences 17, no. 8: 1255. https://doi.org/10.3390/ijms17081255