Article

Glycerin-Induced Conformational Changes in Bombyx mori Silk Fibroin Film Monitored by 13C CP/MAS NMR and 1H DQMAS NMR

Department of Biotechnology, Tokyo University of Agriculture and Technology, Koganei, Tokyo 184-8488, Japan
*
Author to whom correspondence should be addressed.
Int. J. Mol. Sci. 2016, 17(9), 1517; https://doi.org/10.3390/ijms17091517
Submission received: 15 June 2016 / Revised: 12 August 2016 / Accepted: 30 August 2016 / Published: 9 September 2016
(This article belongs to the Special Issue Silk-Based Materials: From Production to Characterization)

Abstract

:
In order to improve the stiff and brittle characteristics of pure Bombyx mori (B. mori) silk fibroin (SF) film in the dry state, glycerin (Glyc) has been used as a plasticizer. However, there have been very limited studies on the structural characterization of the Glyc-blended SF film. In this study, 13C Cross Polarization/Magic Angle Spinning nuclear magnetic resonance (CP/MAS NMR) was used to monitor the conformational changes in the films by changing the Glyc concentration. The presence of only 5 wt % Glyc in the film induced a significant conformational change in SF where Silk I* (repeated type II β-turn and no α-helix) newly appeared. Upon further increase in Glyc concentration, the percentage of Silk I* increased linearly up to 9 wt % Glyc and then tended to be almost constant (30%). This value (30%) was the same as the fraction of Ala residue within the Silk I* form out of all Ala residues of SF present in B. mori mature silkworm. The 1H DQMAS NMR spectra of Glyc-blended SF films confirmed the appearance of Silk I* in the Glyc-blended SF film. A structural model of Glyc-SF complex including the Silk I* form was proposed with the guidance of the Molecular Dynamics (MD) simulation using 1H–1H distance constraints obtained from the 1H Double-Quantum Magic Angle Spinning (DQMAS) NMR spectra.

Graphical Abstract

1. Introduction

Silk fibroin (SF) from Bombyx mori (B. mori) is a well-known and highly prized material for textiles. Recently, SF has also been used as a promising biomaterial because of the combination of high strength and toughness together with excellent biocompatibility [1,2,3,4,5]. However, in order to produce effective biomaterials, it is important to improve the shortcomings of SF. For example, SF film tends to become stiff and brittle in the dry state over time, exhibiting high tensile strength but low elongation [6]. In addition, although alcohols such as methanol have been widely used for the treatment of water-soluble SF, methanol induces further stiffness and reduces the biodegradability of SF [1,3,7]. These shortcomings hinder extensive use of SF in biomaterials.
Glycerin (Glyc), a well-known moisturizing agent and plasticizer, has been used to improve the SF properties. Kawahara et al. [8] reported an improvement in the properties of SF film by immersing it in a 10% Glyc aqueous solution. More detailed studies of the improvement of the mechanical properties of the SF films by blending with Glyc were reported by Lu et al. [9]. They showed that Glyc-blended SF films were significantly softer in the dry states, and therefore Glyc should be one of the candidates to overcome the stiffness problem. Pei et al. [10] reported that Glyc induced SF crystallization in the lyophilization process, thereby providing freeze-dried scaffolds with water stability. Compared with salt-leached and methanol-annealed SF scaffolds, the films became softer and enhanced the degradation of the SF scaffold.
It is important to characterize the structure of the Glyc-blend SF films in detail in order to facilitate the widespread use of biomaterials, but only few studies have been reported thus far. Noticeable conformational changes of SF films caused by mixing with Glyc were observed by Fourier transform infrared spectroscopy (FTIR), X-ray diffraction (XRD) and differential scanning calorimetry (DSC) [9,10]. Nuclear magnetic resonance (NMR) gave detailed pictures of the structure and dynamics of SF using both solid and solution state measurements [11,12]. The 13C and 1H conformation-dependent NMR chemical shifts provided information on the local conformations of amino acid residues and the fraction of each conformation when several conformations were present. Both empirical and quantum chemical studies were reported to use these conformation-dependent chemical shifts for structural determination of proteins and protein-ligand interactions [13,14,15,16,17,18,19]. Several solid-state NMR techniques were developed to determine the structure of peptides, polypeptides and proteins, including the SF structure [11,20,21,22,23].
In this paper, the Glyc-induced conformational changes in Glyc-blended SF film were monitored by 13C Cross Polarization/Magic Angle Spinning (CP/MAS) NMR using conformation-dependent NMR chemical shifts and peak deconvolution. In addition, 1H Double-Quantum Magic Angle Spinning (DQMAS) NMR [12,24,25,26,27,28,29,30,31,32] was used to confirm the appearance of Silk I* in the Glyc-blended SF film. A structural model of Glyc-SF complex was proposed using Molecular Dynamics (MD) simulation on the basis of the information obtained from 1H DQMAS NMR on the 1H–1H inter-atomic distances in the Glyc-SF complex having the Silk I* structure.

2. Results and Discussion

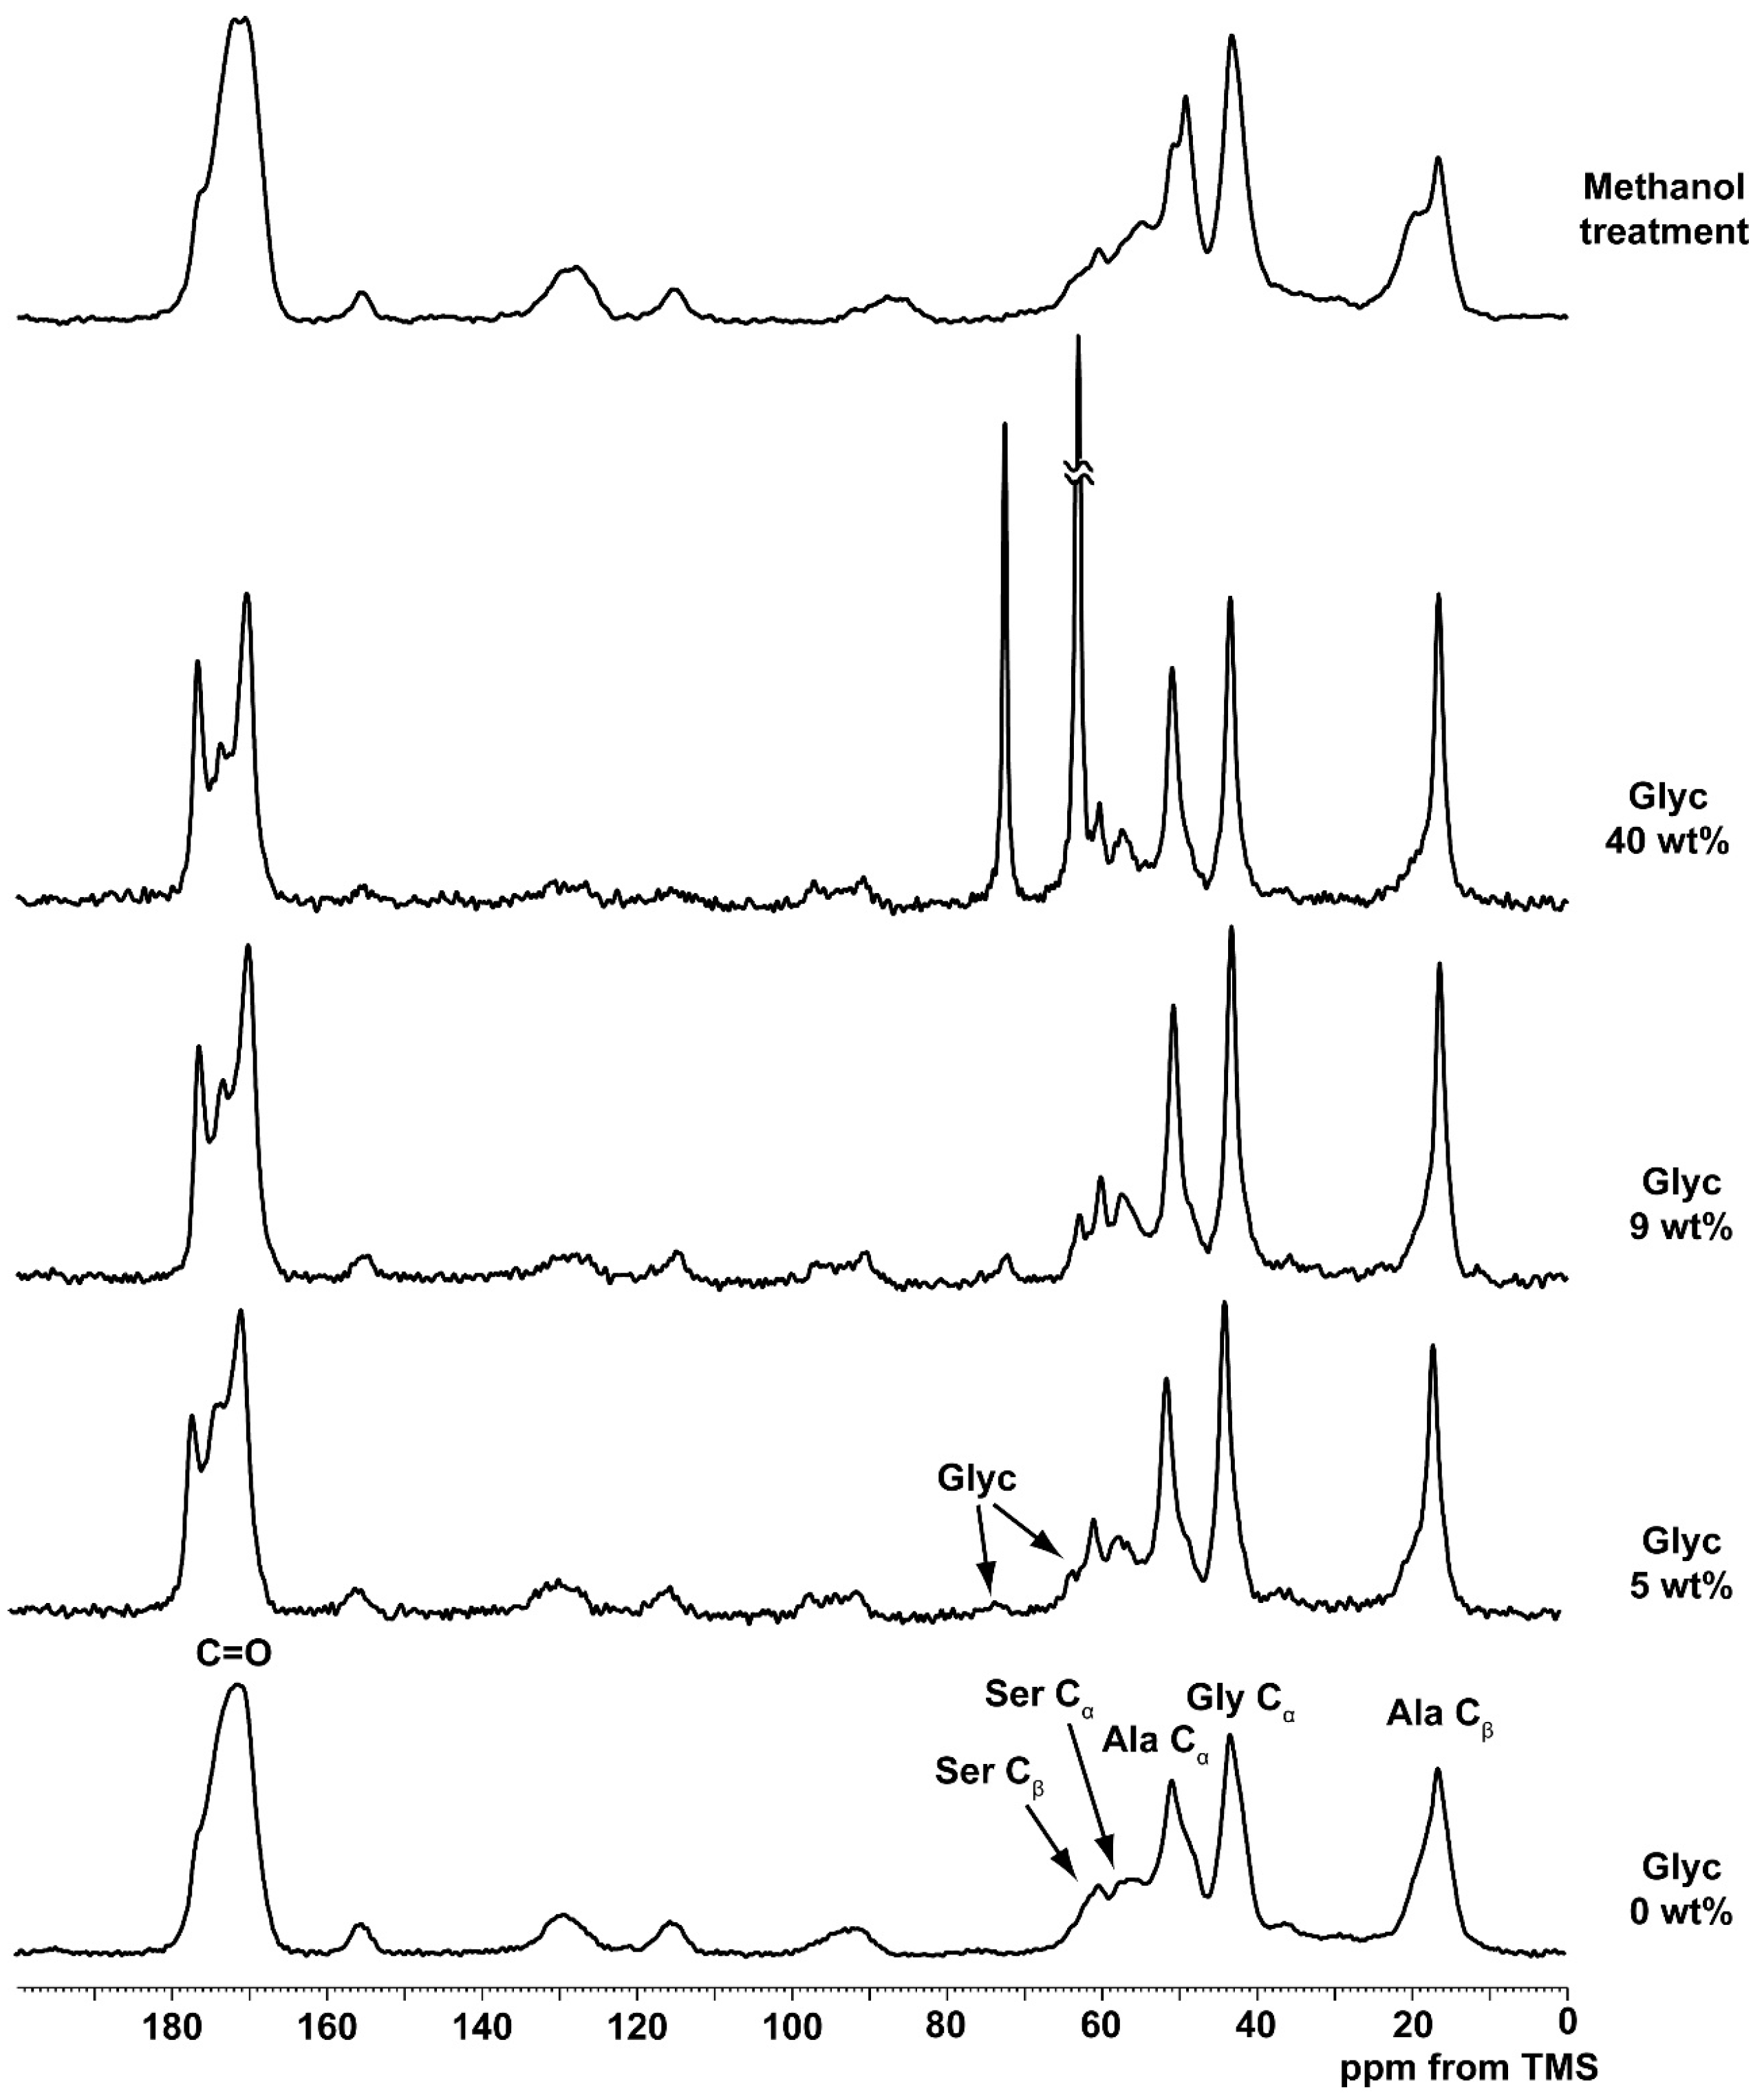
2.1. 13C Cross Polarization/Magic Angle Spinning Nuclear Magnetic Resonance (CP/MAS NMR) Spectra of Silk Fibroin (SF) and Glycerin (Glyc)-Blended SF Films

Figure 1 shows 13C CP/MAS NMR spectra of pure SF and Glyc-blended SF films with different Glyc concentrations of 5, 9, 40 wt % and pure SF film treated by methanol. Together with the peaks of SF, two small peaks assigned to Glyc were observed at 62.9 ppm (CH2) and 72.3 ppm (CH) even in 5 wt % Glyc-blended SF film. A further assignment of SF peaks to several conformations was performed with 13C conformation-dependent chemical shifts [13,14,17,20,21,22,33]. The 13C chemical shifts of random coil, Silk II and Silk I of Glyc-blended SF films are summarized in Table 1 together with 1H chemical shift data [32].
Without Glyc, the conformation of regenerated SF film was roughly random coil according to the Ala Cβ chemical shift of 16.5 ppm, although there was a significant amount of β-sheet structure as mentioned below. By adding 5 wt % Glyc to SF, sharp Cβ Ala (16.5 ppm) and C=O (177.0 ppm) peaks were newly observed together with Ser Cβ (60.7 ppm) peak [12,13,33], indicating the partial generation of Silk I* form. At least 5 wt % Glyc concentration was enough to produce Silk I* form in SF through the strong interaction between SF and Glyc molecules in the dry state. The sample preparations of the Glyc-blended SF films and their NMR observations were repeated at least two times and confirmed the results.
Here, we start from the definition of Silk I* form is different from the Silk I structure; the details have been reported elsewhere [12,34]. Briefly, Silk I is defined as the solid state structure of SF stored in the middle silk glands after drying without any external forces. It is a soluble form that remains stable and non-viscous up to high concentrations without precipitating, this presumably being essential for the secretion of mature silk fibers [6,35,36]. According to solid state NMR spectra, the solid state Silk I contains random coil regions, together with regions having a well-defined ordered structure [13,14,33,34]. These ordered regions are defined as Silk I* [12,34]. Silk I* comes from the amino acid residues with the sequence (AGSGAG)n. However, it is important to point out that not all of the (AGSGAG)n residues form Silk I*. A detailed recent analysis of 13C solid state NMR spectra of 13C selectively labeled SF [34] indicated that only longer (AGSGAG)n regions contribute to Silk I*. This is entirely consistent with the hypothesis that Silk I* acts as a nucleus for the formation of Silk II structure during spinning of the silk fiber.
In this work, we aimed to interpret the structure of the Silk I* form in SF. The Silk I* is a repeated β-turn type II structure which was proposed to give the torsion angles, (φ, ψ) = (−62°, 125°) for Ala residues and (φ, ψ) = (77°, 10°) for Gly residues of poly(Ala-Gly) chain, thereby satisfying both solid state NMR and X-ray diffraction data. (The unit cell was orthorhombic and the space group was P212121, and the lattice constants were a = 4.65 Å, b = 14.24 Å and c = 8.88 Å, α = β = γ = 90°) [20,21,32]. The intra- and inter-molecular hydrogen bonding was formed alternatively along the chain. As noted earlier, the Silk I* form of longer (AGSGAG)n sequences appeared as a result of the interaction between SF and Glyc molecules. A structural model for the complex of Glyc-SF having Silk I* form will be shown in Section 3.6.
Lu et al. [9] claimed the appearance of α-helix conformation in SF induced by the interaction between Glyc and SF molecules on the basis of Infrared spectroscopy (IR) analysis. However, from the results of NMR work mentioned above, it is clear that the newly appeared conformation was the Silk I* form, not α-helix. Many researchers other than Lu et al. in the field of SF research also reported the appearance of α-helix in SF from IR or Raman data of SF using automated analysis carried out with commercial software (for example, Opus 6.5 software, Bruker Optics Corp., Billerica, MA, USA). If there are poly(Ala) sequences in B. mori SF (as in the case of a wild-type silkworm, Samia cynthia ricini [11,35]), the sequences are expected to form α-helix. However, there are no poly(Ala) sequences in B. mori SF [37]. If the Ala residue forms the α-helical structure together with other amino acid residues, the Ala Cβ peak should appear at 15 ppm in the 13C NMR spectrum. (It is known from the 13C conformation-dependent chemical shifts empirically and theoretically that the 13C chemical shifts of the amino acid residues reflect the secondary structure in the vicinity of the residues [11,20,21,22,23]). However, Ala Cβ peak in this case appeared at 16.5 ppm for Silk I* form and not at 15 ppm. In addition, α-helix was clearly absent by comparing the observed 2D spin-diffusion NMR spectral patterns of (AG)6A[1-13C]G14[1-13C]A15G(AG)7 and (AG)7[1-13C]A15[1-13C]G16(AG)7 for the determinations of the torsion angles Ala15(φ, ψ) and Gly14(φ, ψ) in (AG)15, respectively, with the calculated patterns assuming the α-helix structure [21]. Indeed, Percot et al. had pointed out that discrimination between regular (α) and disordered (β-turn) helical conformations would be difficult from the Raman data [38,39]. In addition, the circular dichroism (CD) study of the concentrated SF in the middle silk gland of B. mori silkworm also gave α-helix-like structure [40,41]. We believe this confusion comes from the “special” structure of the Silk I* form. In our view, a theoretical approach involving IR, Raman and CD spectral patterns in view of the atomic coordinates of poly(Ala-Gly) with the repeated type II β-turn structure should give a solution to this problem.
As shown in Figure 1, at 9 wt % Glyc concentration the fraction of Silk I* increased slightly as evidenced by the intensity increase of the C=O (177.0 ppm) carbon peak. With further increase of Glyc concentration, the spectral change was very small as shown in the 13C CP/MAS NMR spectrum of Glyc(40 wt %)-blended SF film. These spectral patterns were quite different from the 13C CP/MAS NMR spectrum of SF film treated by methanol, which showed a typical Silk II form [13,14,30,31].

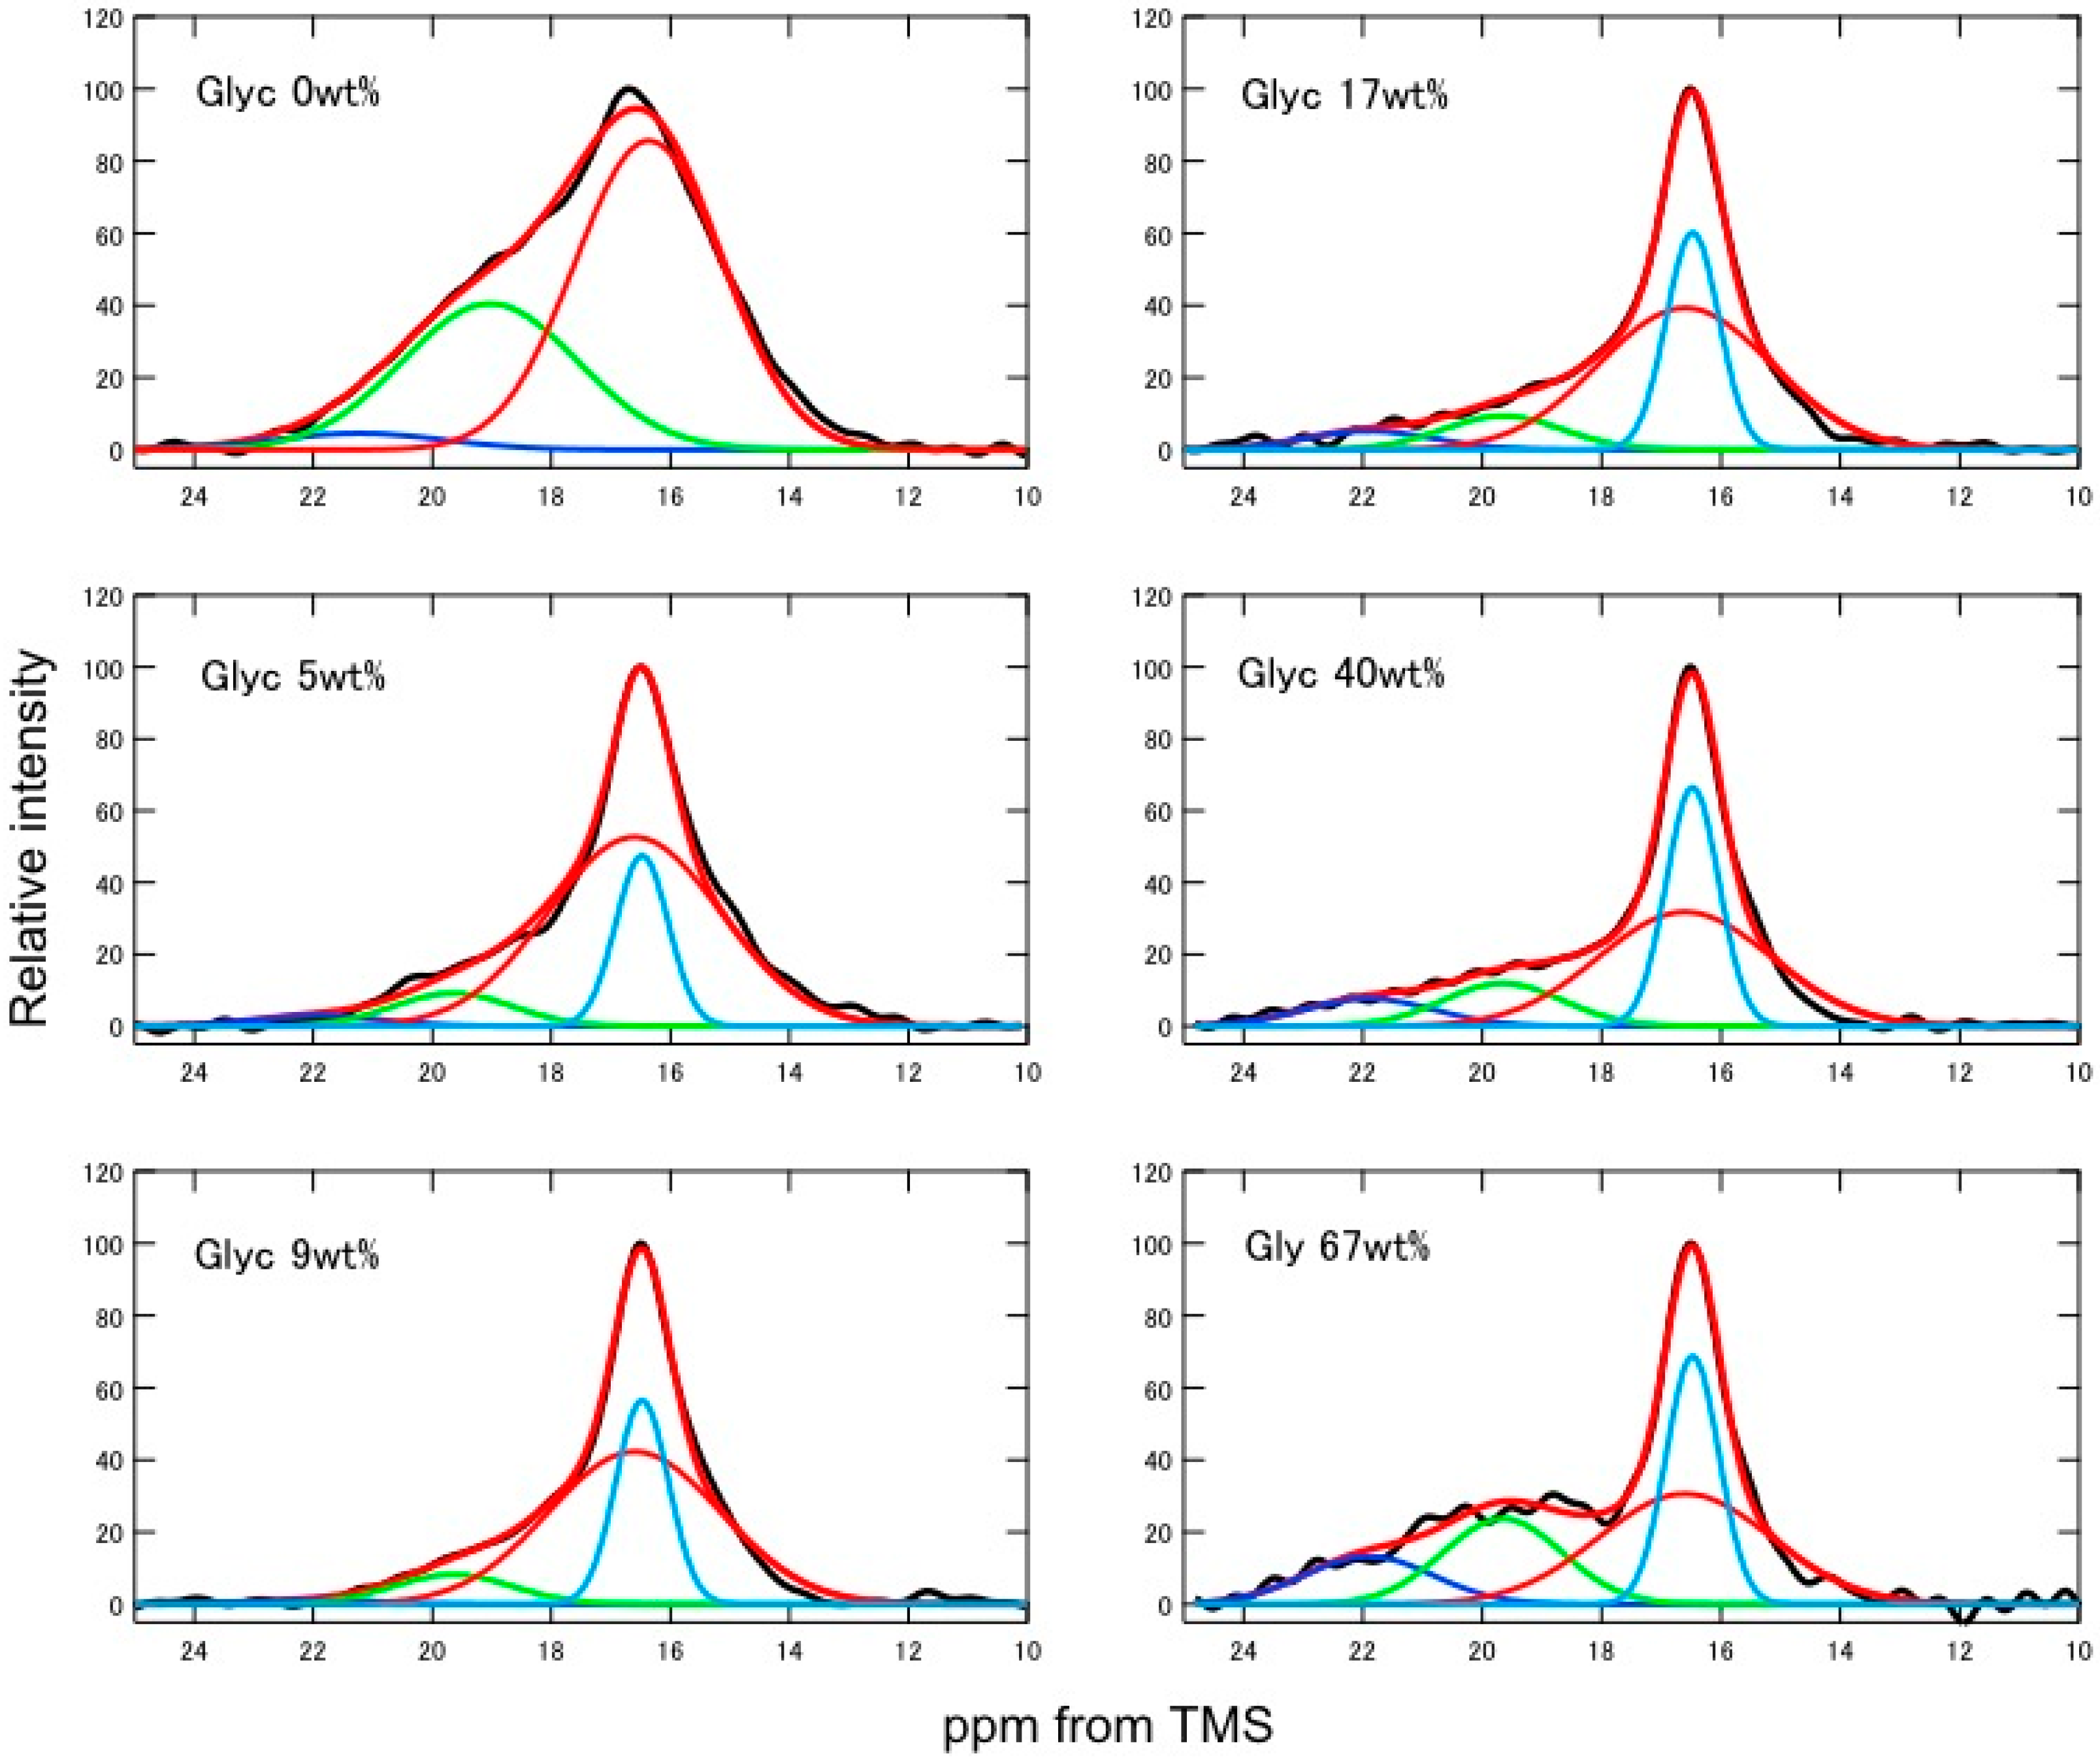
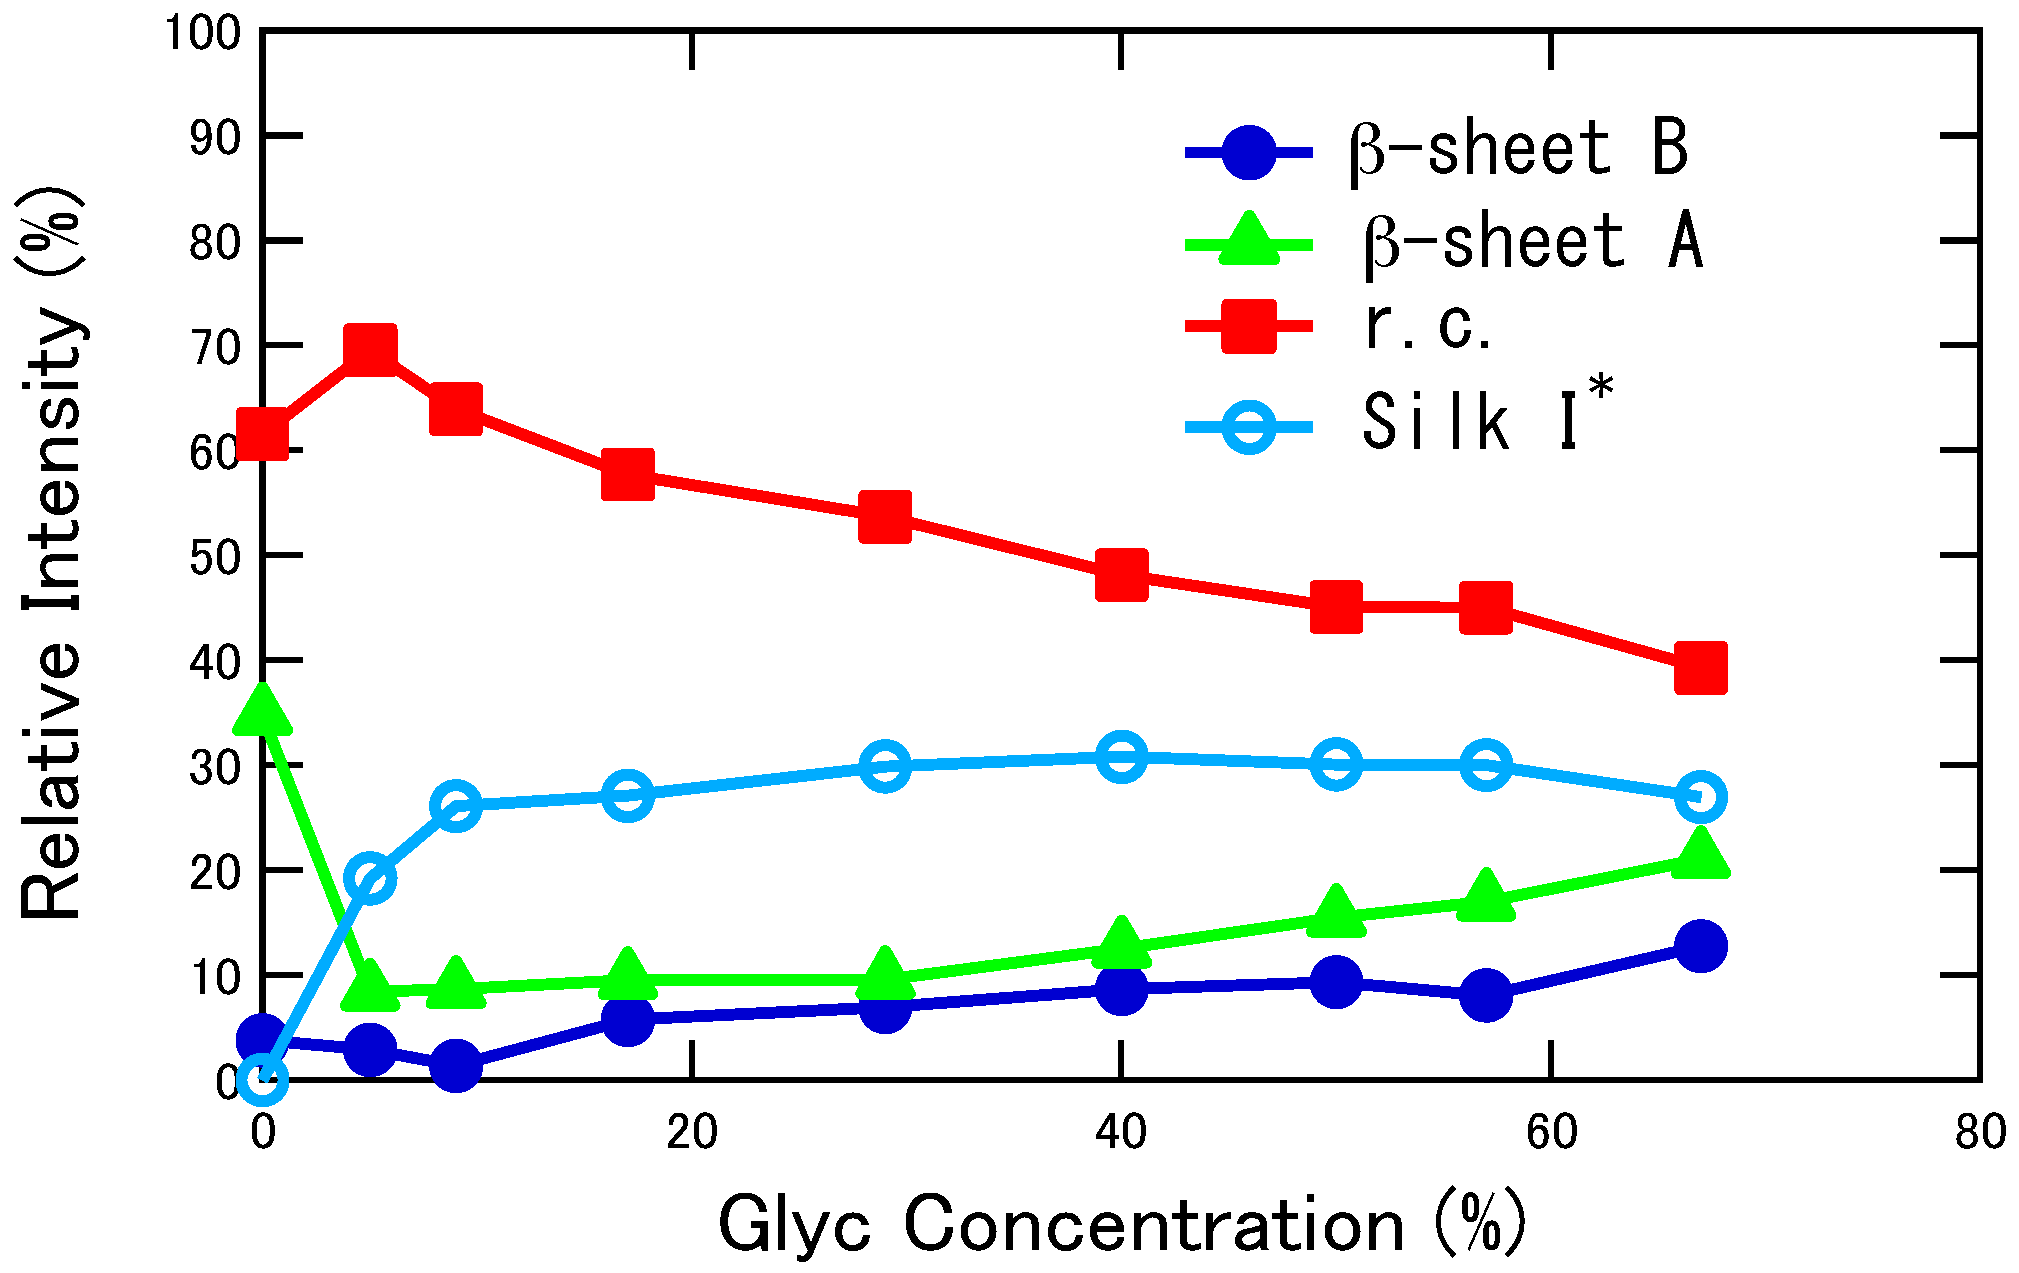
2.2. Quantitative Conformational Analysis of SF and Glyc-Blended SF from the Ala Cβ Peaks of the 13C CP/MAS NMR Spectra

In order to determine the fraction of different conformations of SF and Glyc-blended SF films, deconvolution of the 13C Ala Cβ peaks was performed as a function of Glyc concentration by assuming Gaussian line-shapes (Figure 2). Without Glyc, there were three components in the deconvoluted spectrum, i.e., random coil and two kinds of β-sheets, A and B. The β-sheet A and B were reported previously by us [12,22]. The torsion angles of both structures are the same (−140°, 140°) for both Ala and Gly residues. The β-sheet A and B have similar inter-molecular packing of the β-strands in the unit cell (a = 9.38 Å, b = 9.49 Å, c = 6.98 Å, and space group P21) as reported by Takahashi et al. [42]. A key difference between β-sheet A and B is that the Ala methyl groups are positioned differently. In the β-sheet A, the methyl groups of the top sheet that point down to the central sheet are positioned roughly towards the Gly Hα, in the spaces between the pairs of inter-strand Gly···Ala hydrogen bonds. In contrast, in the β-sheet B the methyl groups point to the center of the pair of inter-strand Gly···Ala hydrogen bonds and are thus shifted along the strand by one residue. In fact, the β-sheet A entailed slightly lower energy than the β-sheet B according to two structural models of (Ala-Gly)15 [22]. In the observed NMR spectrum of SF film alone, the β-sheet A was the main structure found on the basis of the chemical shifts.
During the preparation of the regenerated SF films (including the drying process), partial conformational change from random coil to β-sheet occurred, especially in the crystalline domain, which consisted of repeated AGSGAG sequences as reported previously [34]. By adding a small amount of Glyc (only 5 wt %) to SF, a remarkable change in the spectrum occurred. In particular, Silk I* form appeared partly as marked by light blue curve (Figure 2), viz. the peak with the narrower linewidth but the same chemical shifts as that of broad random coil peak. Thus, the Silk I* structure has a narrower chemical shift distribution than that of the random coil. In addition, β-sheet A in the spectrum of the SF sample without Glyc decreased considerably in intensity.
The proportion of each conformation was determined by assuming the presence of only four conformations: Silk I*, random coil and β-sheets A and B. The change in the fraction of different conformations of SF and Glyc-blended SF films as a function of Glyc concentration is shown in Figure 3. The numerical values of the fractions are listed in Table S1. As Glyc concentration increased from 5 to 9 wt %, the change in the spectrum was not large compared with the spectral change from Glyc 0 to 5 wt %, but the fraction of Silk I* increased and that of random coil decreased. With further increase of Glyc content, the changes were relatively small. Thus, the fraction of Silk I* increased linearly up to 25%, then to 30% where it stayed almost constant. This was the same value (30%) of Ala residues in all Ala residues in SF sample present in B. mori mature silkworm. Thus, the fraction of 30% was considered to be the maximum content for Silk I* because only longer (AGSGAG)n sequence could generate Silk I* form as discussed in our previous paper [34]. Thus, the minimum amount of Glyc to fully produce the Silk I* form was 9 wt %, and further Glyc addition did not generate more Silk I* structure in SF. With further increase of Glyc from 9 wt %, the fraction of random coil decreased and both β-sheets, A and B, increased gradually. Note that the amount of β-sheet A was larger than that of B over the whole range of Glyc concentrations.

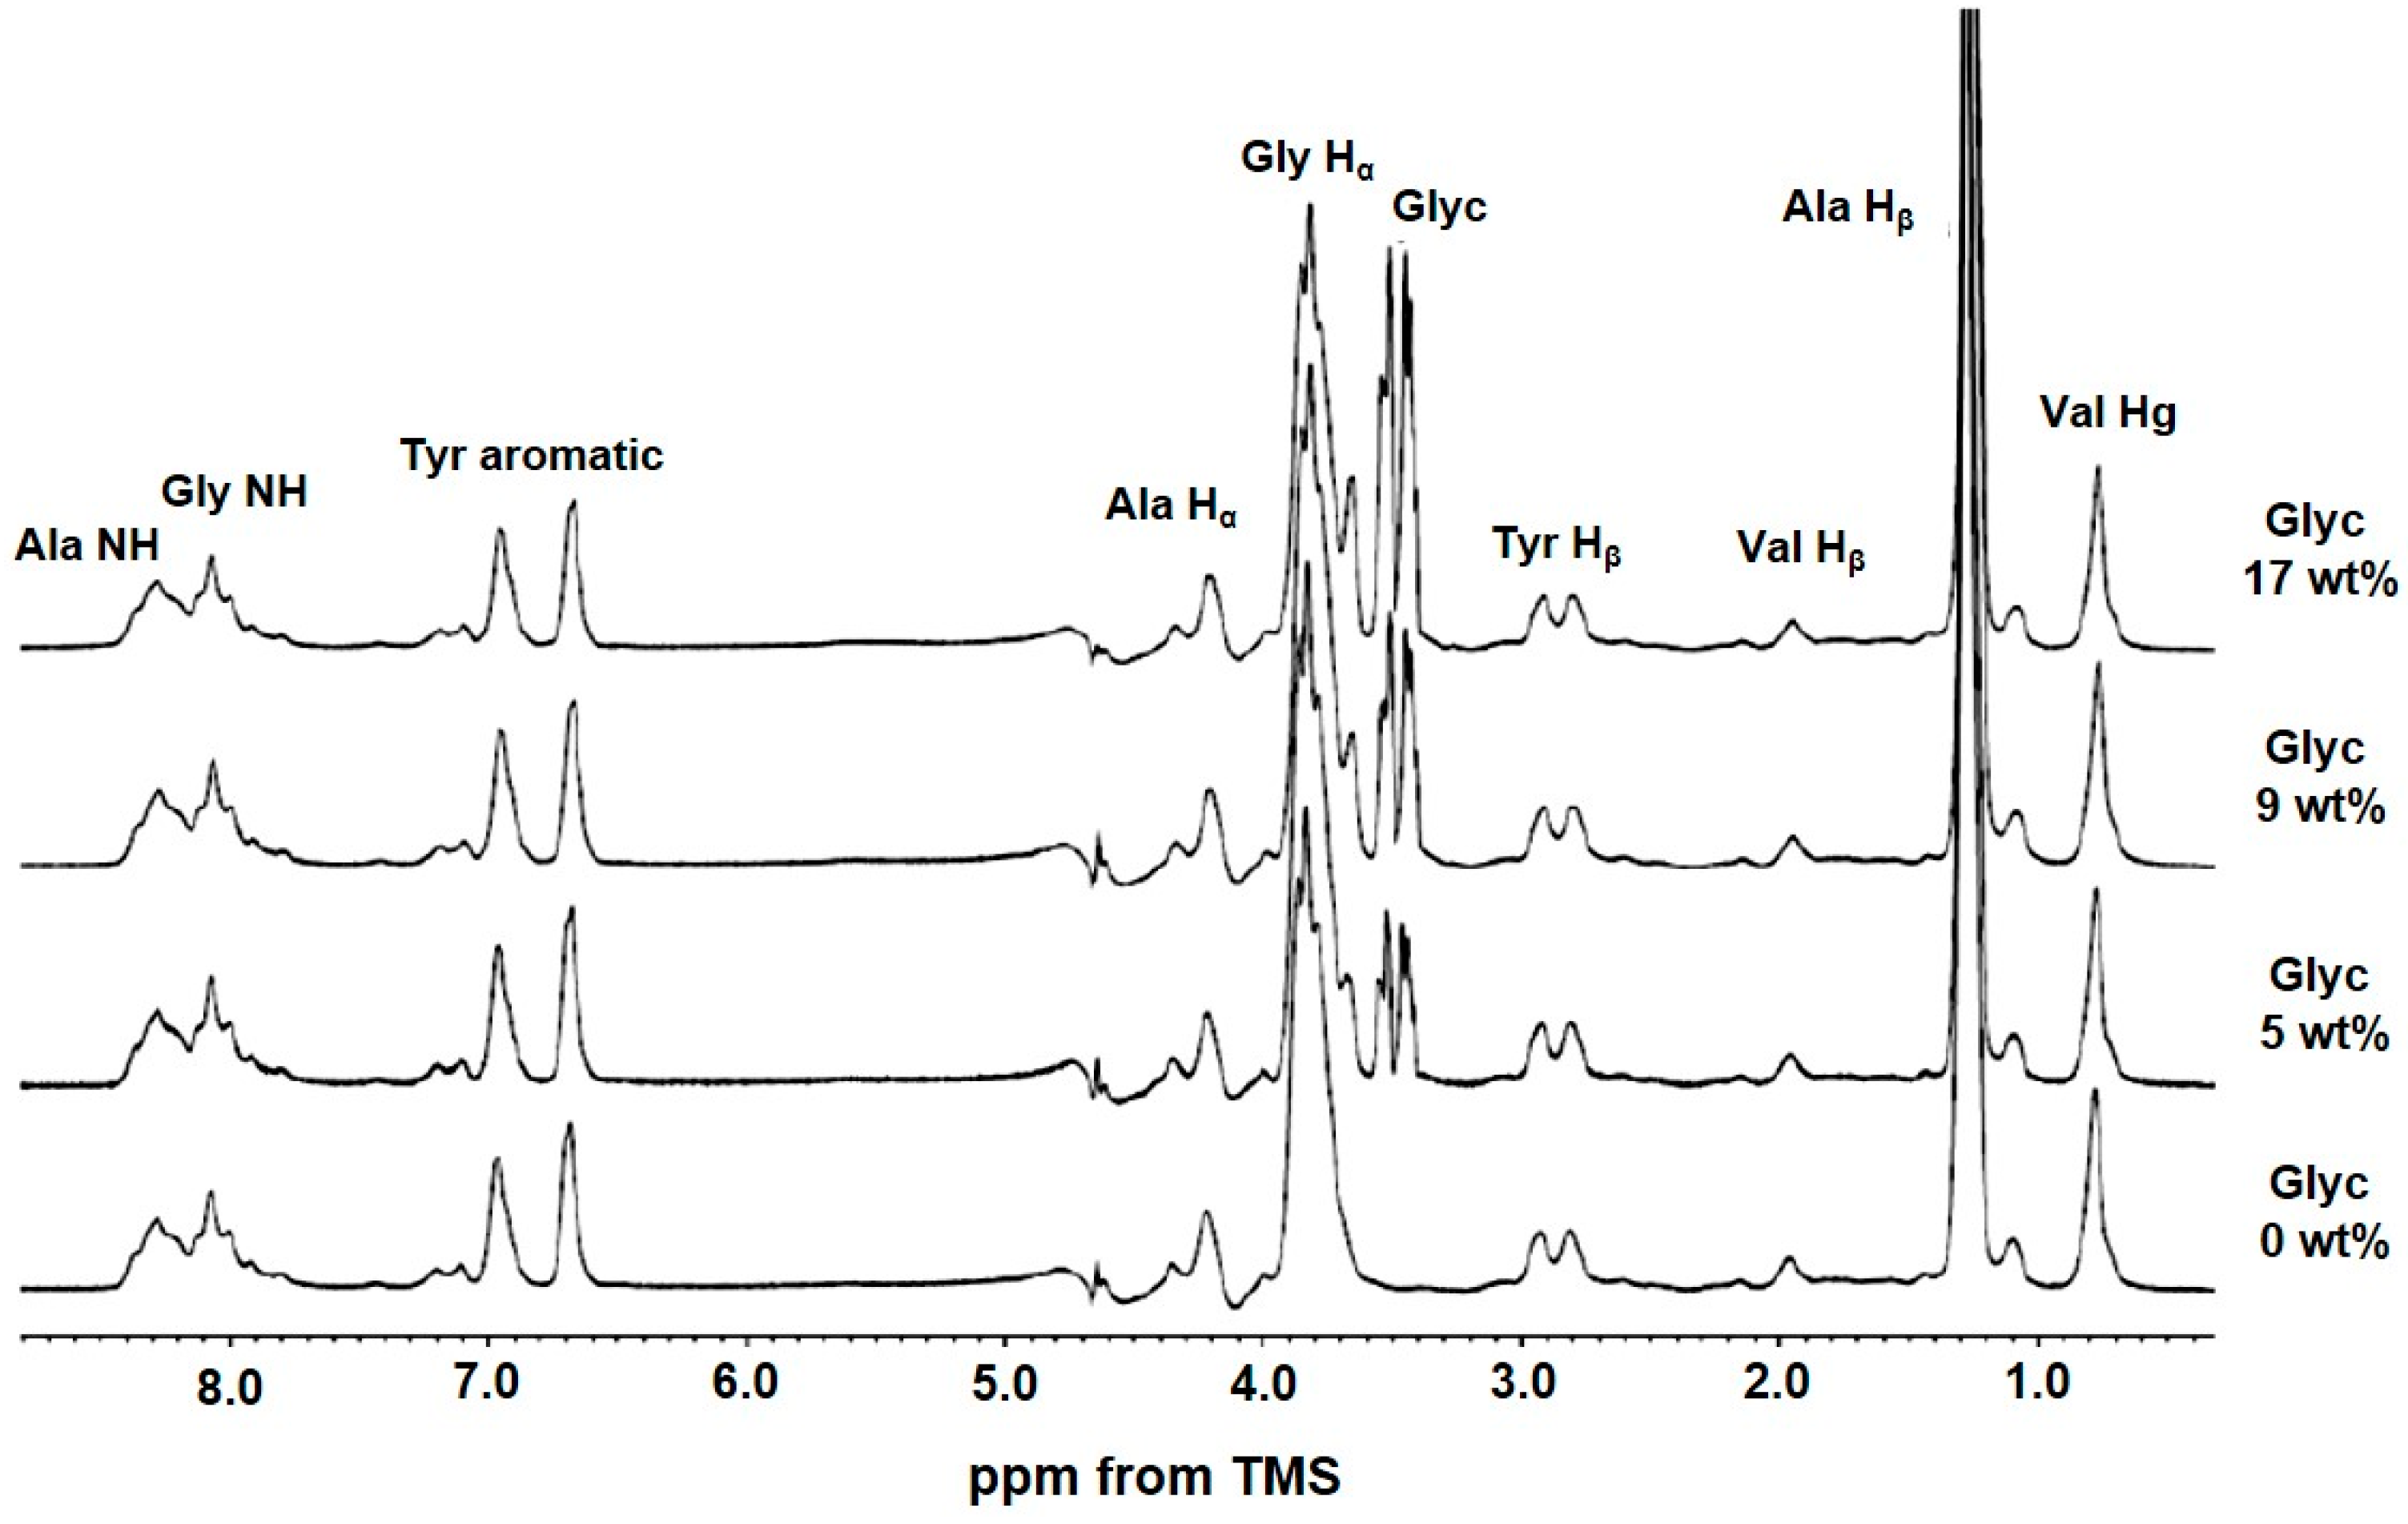
2.3. 1H Solution NMR Spectra of Regenerated SF Aqueous Solution as a Function of Glyc Concentration

The 1H solution NMR spectra of regenerated SF aqueous solutions containing Glyc were observed as a function of Glyc concentration to study the interaction between SF and Glyc in aqueous solution (Figure 4). The NMR spectra were easily assigned by reference to a previous paper [36]. Other than SF peaks, the peaks assigned to Glyc were observed. However, with increasing Glyc concentration, there was no significant change. Thus, in aqueous solution, SF molecules were hydrated sufficiently and surrounded by water molecules. Similarly, Glyc molecules were also surrounded by sufficient amounts of water molecules. Therefore, there was essentially no direct interaction between SF and Glyc molecules. This indicated that the direct interaction between SF and Glyc occurred during the drying process because of the shortage of water. Thus only solid state NMR is useful for the purpose of structural characterization of SF and change in the structure as a function of Glyc concentration.

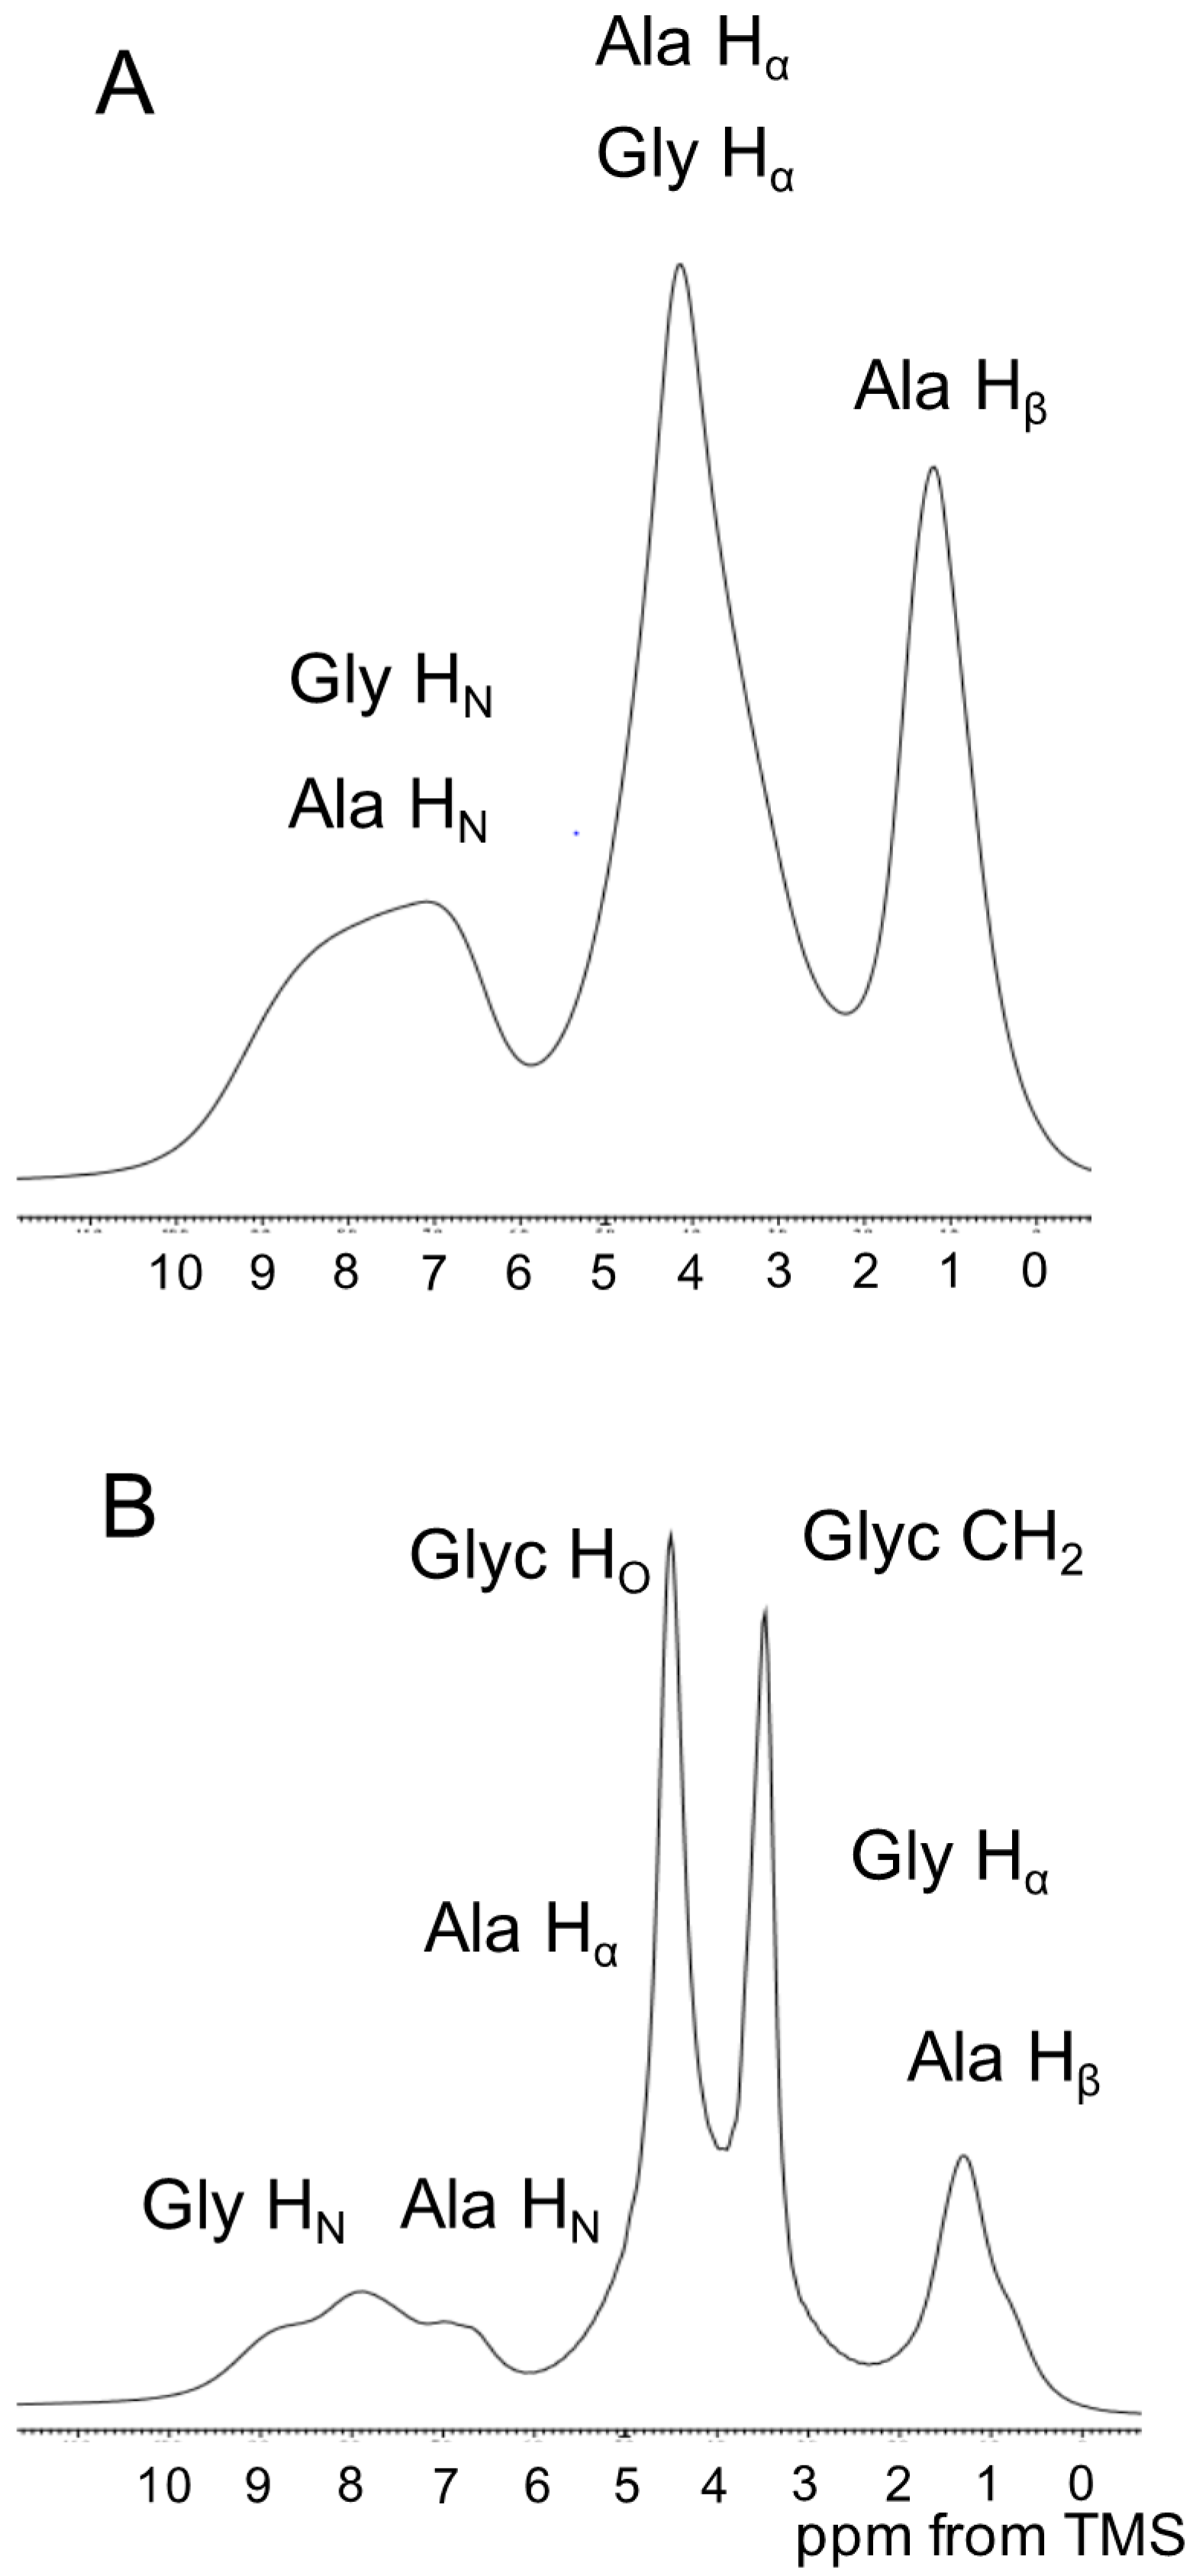
2.4. 1H Solid State NMR Spectra of SF and Glyc (29 wt %)-Blended SF Films

1H single pulse NMR spectra of SF and Glyc-blended SF films (Glyc 29 wt % concentration) were observed in the solid state (Figure 5). The Glyc (29 wt %)-blend SF film was selected because the fraction of Silk I* was fixed to be about 30%. There was a large difference in the spectrum between Glyc 0 wt % and Glyc 29 wt %. This was mainly due to the presence of Glyc peaks observed at 3.4 ppm (CH2 and CH) and 4.4 ppm (OH plus H2O) in the latter spectrum. In addition, there was a difference in the lower field (NH region) of the spectra. However, because of low resolution, the detailed assignments and related analysis was difficult, and further analysis was done from the 1H DQMAS NMR spectra (vide infra).

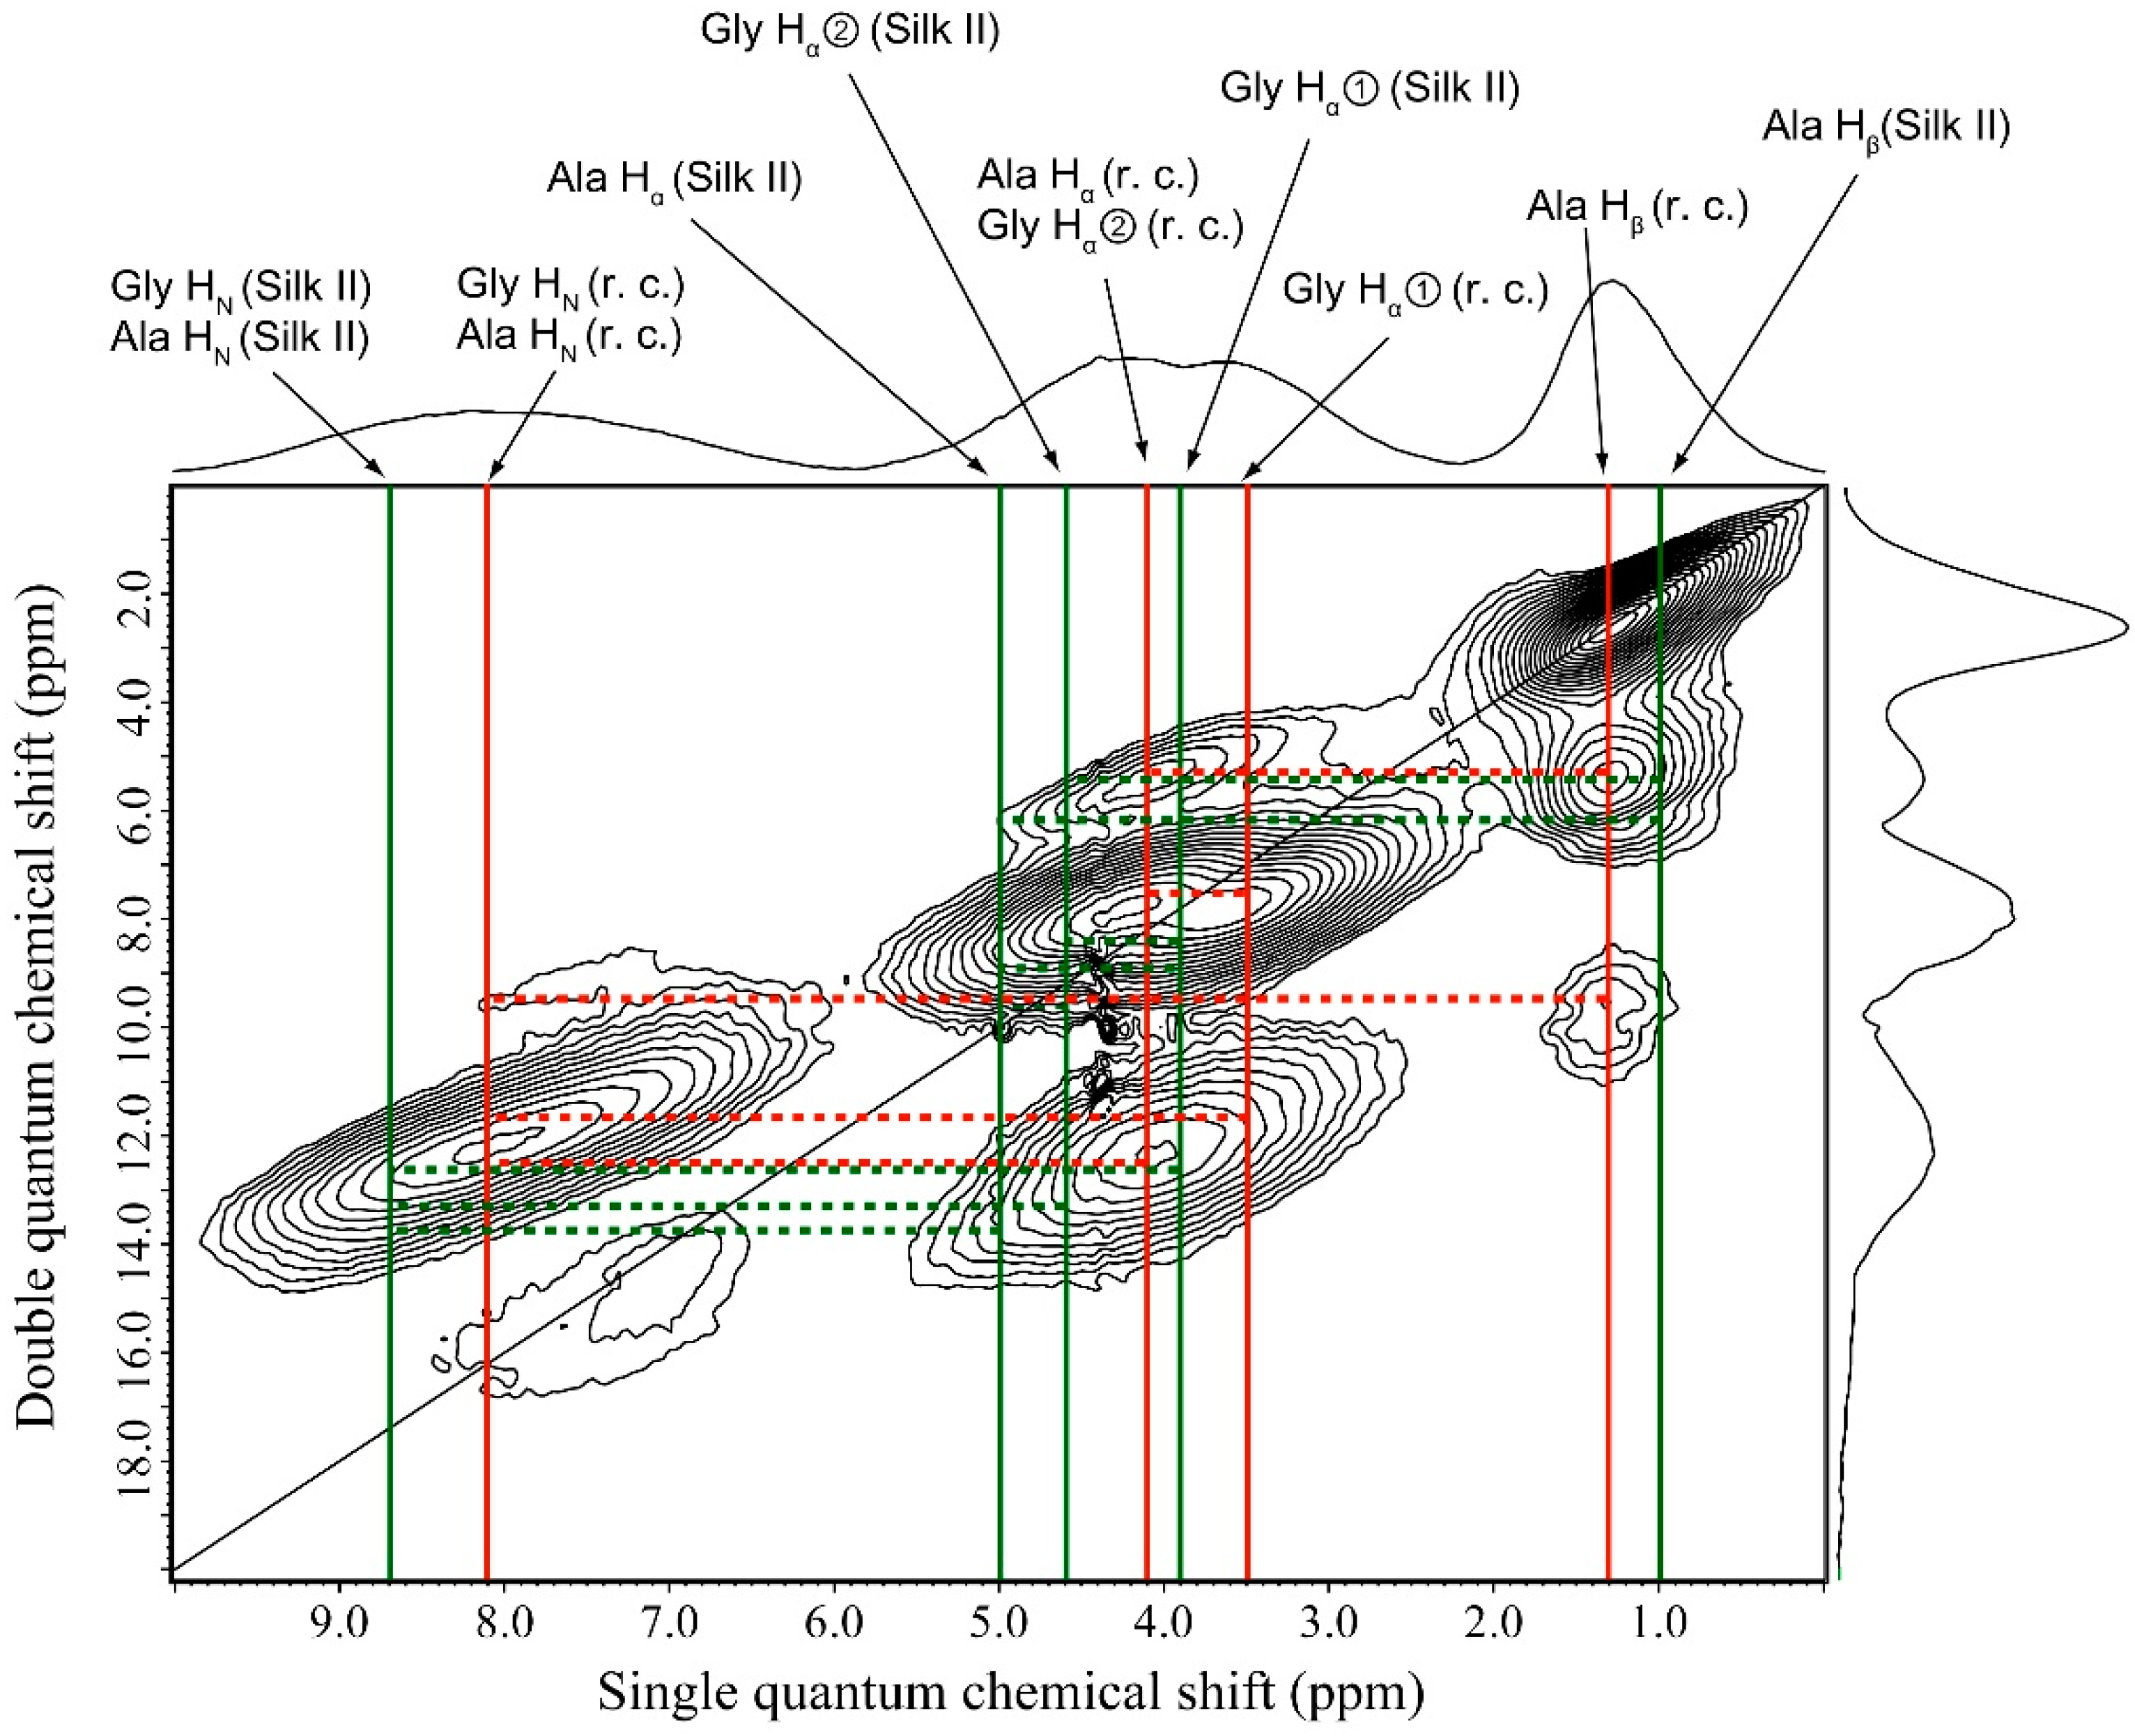
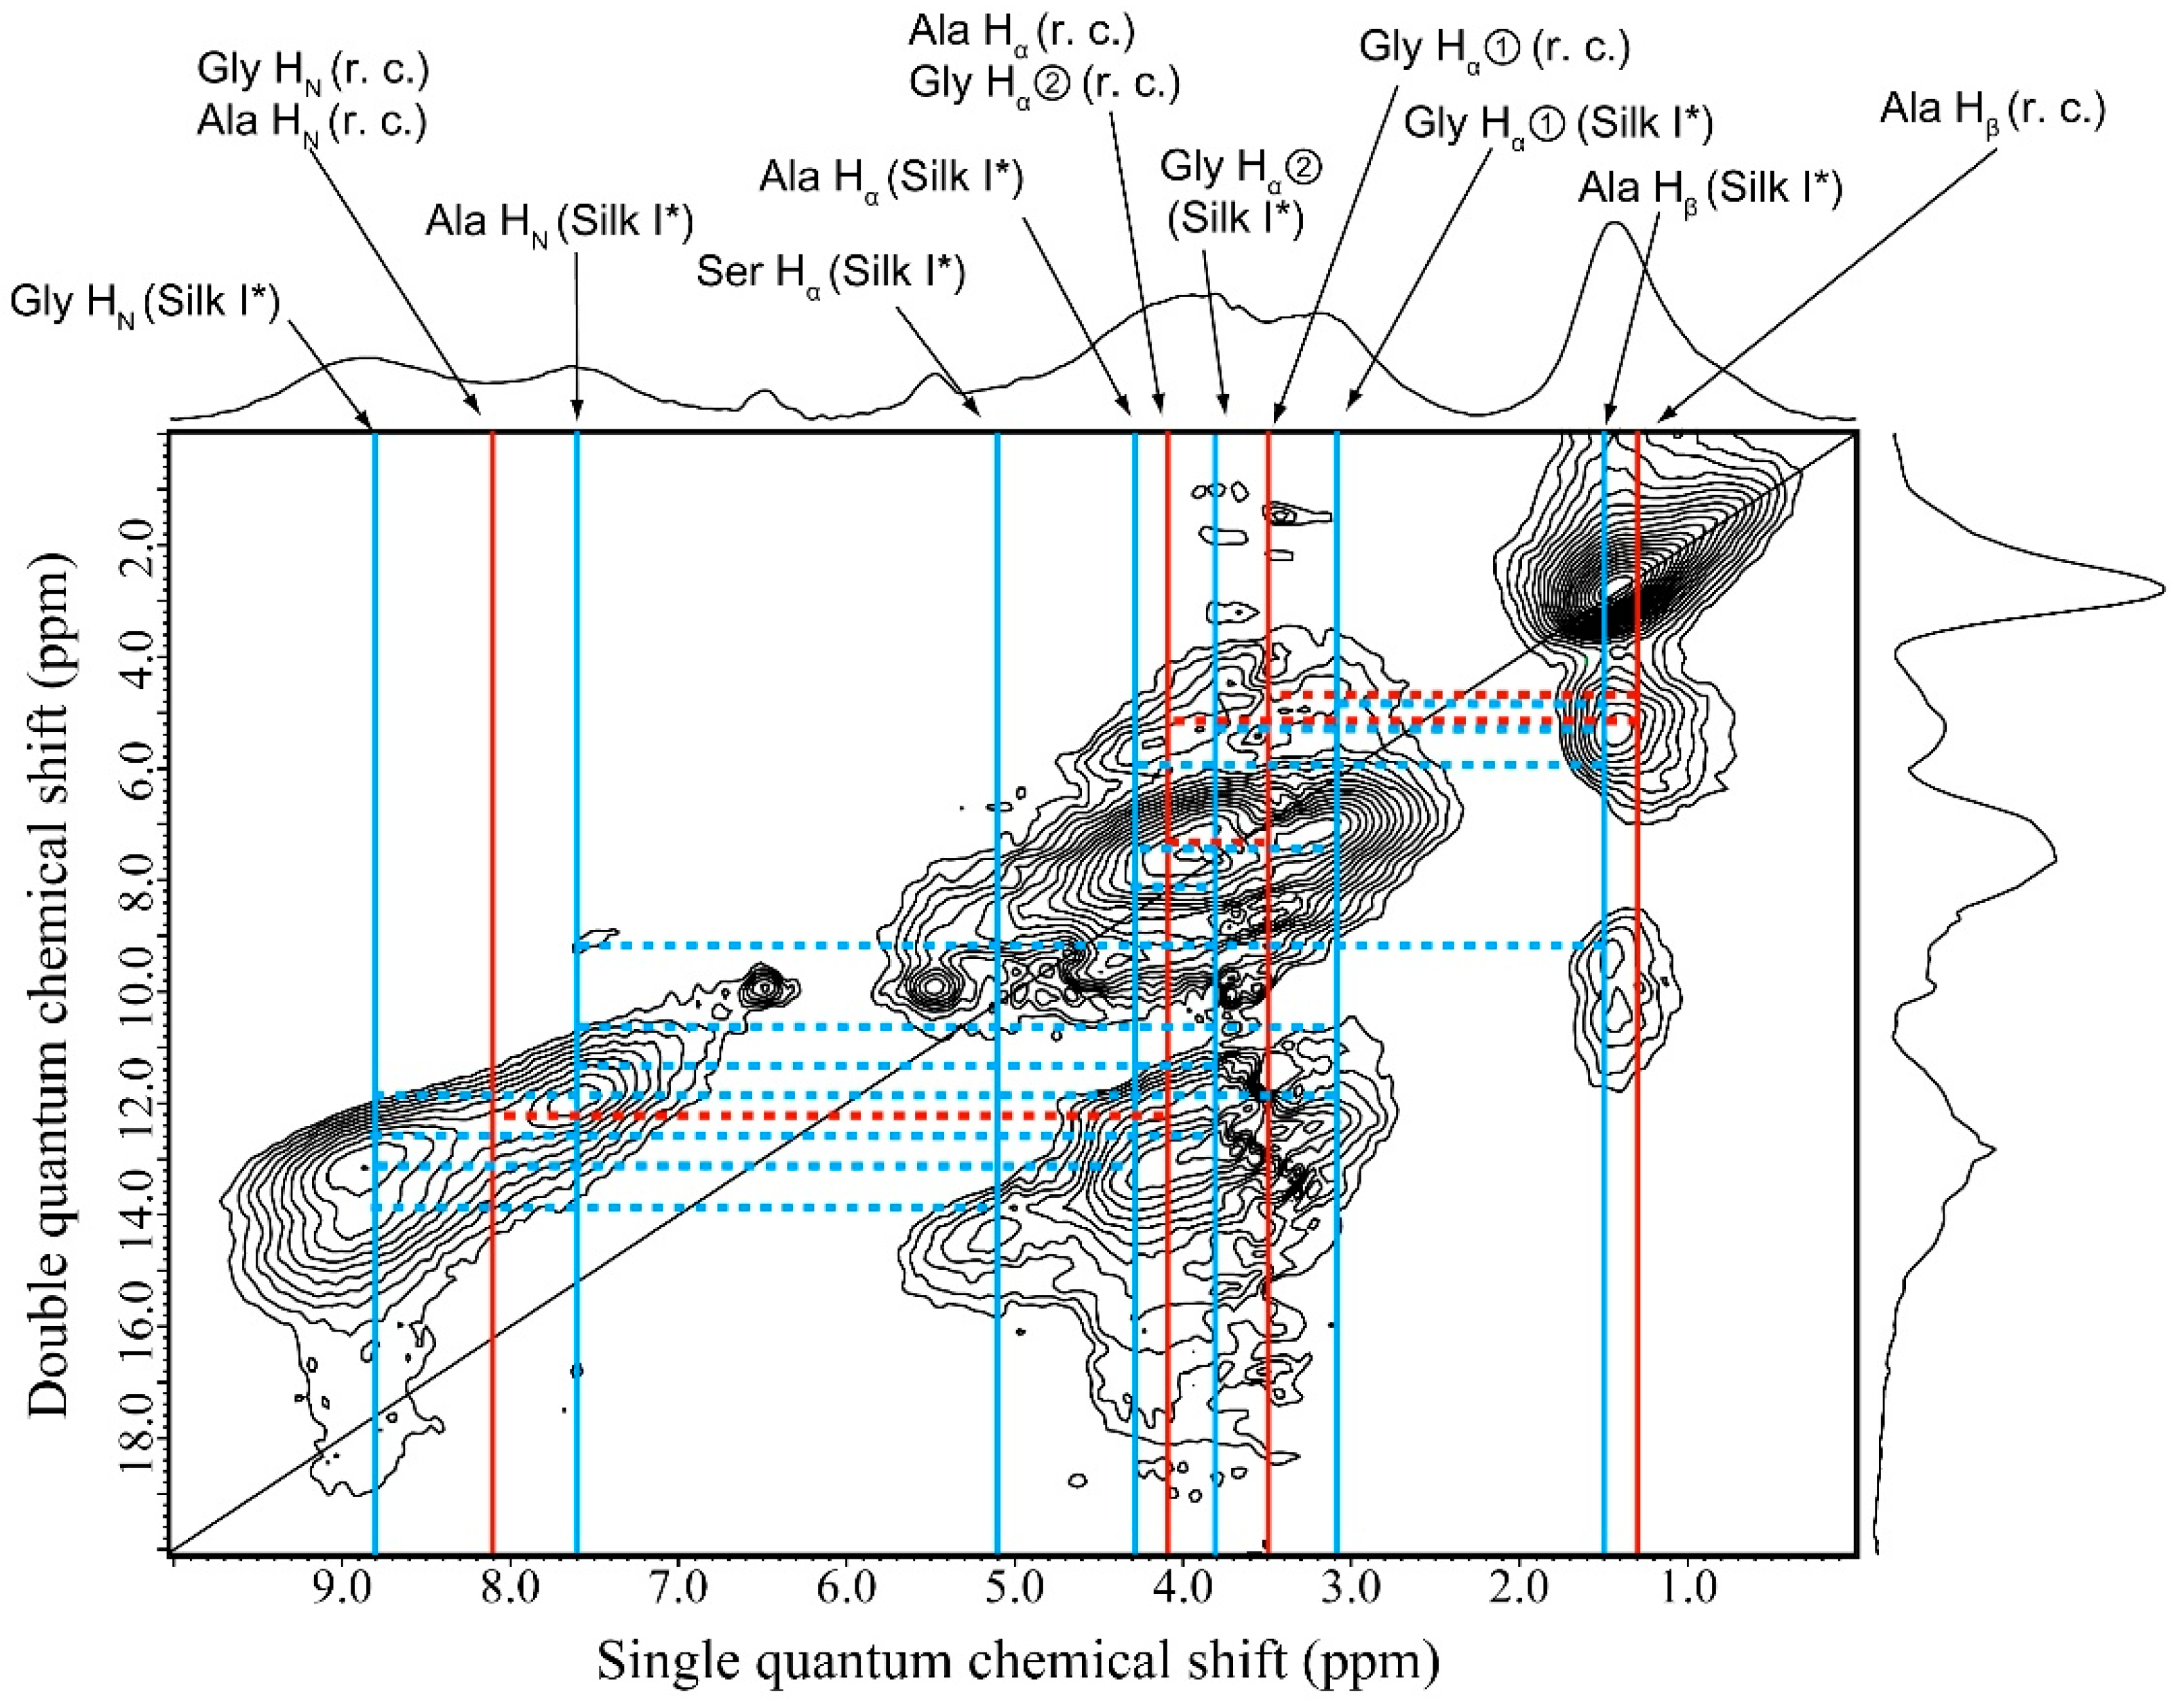
2.5. 1H Double-Quantum Magic Angle Spinning (DQMAS) NMR Spectrum of SF Film

The 1H DQMAS NMR spectrum of SF without Glyc is given in Figure 6. The fractions of random coil and β-sheet were determined to be 61.6% and 38.4%, respectively, from the simulation of the 13C CP/MAS NMR spectrum (Table S1). Thus, we need to consider the presence of these two conformations. In our previous paper [22], we reported 1H DQMAS NMR spectra of (AG)15 with Silk II form, which can serve as a reference spectrum for Silk II in the analysis of Figure 6. In our first attempt to assign the 1H DQMAS NMR spectrum, we compared the spectra of random coil with those of Silk II. Although differences in the chemical shifts between β-sheet A and B appeared in the 13C CP/MAS NMR spectra [22], it was difficult to distinguish the 1H peaks from the β-sheet A and B in the whole SF spectrum observed here. Therefore, we assume the chemical shift values of Silk II in Figure 6 correspond to the β-sheet A of (Ala-Gly)15.
The 1H chemical shifts of random coil and Silk II forms were determined as listed in Table 1. The most interesting points are the HN chemical shifts which reflect the distance of direct hydrogen bonding of NH···OC pairs in the solid state [30] as well as the solution state [19]. The HN chemical shifts of Ala and Gly residues with random coil were the same (8.1 ppm), but it was smaller than that of Silk II (8.7 ppm). The larger NH chemical shift indicated stronger inter-molecular hydrogen bond formation, and therefore the inter-molecular hydrogen bonding in Silk II was stronger than in random coil; this observation seemed to be reasonable. Ala Hβ chemical shift of random coil was larger than that of Silk II, and Ala Hα chemical shift of Silk II was larger than that of random coil. This showed the same trend as 1H conformation-dependent chemical shifts of proteins [18,19]. As reported previously [22,27,32], the 1H DQMAS NMR spectrum gave information on the 1H–1H distances in the SF sample as observable cross peaks connecting two 1H nuclei within distances of about 4 Å. A set of six 1H–1H correlation signals (broken lines) was indicated in Figure 6 for SF with random coil form, while eight 1H–1H correlation signals for Silk II was found. The 1H–1H correlation data were summarized in Table 2. In view of the 1H–1H correlation data, both random coil and Silk II structure appeared present, although it was difficult to determine the fraction as in the case of 13C CP/MAS NMR as mentioned above.

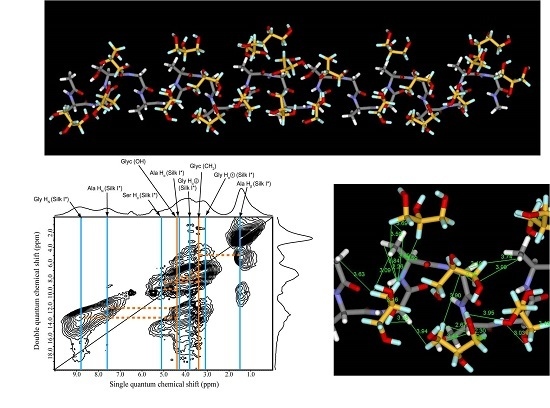
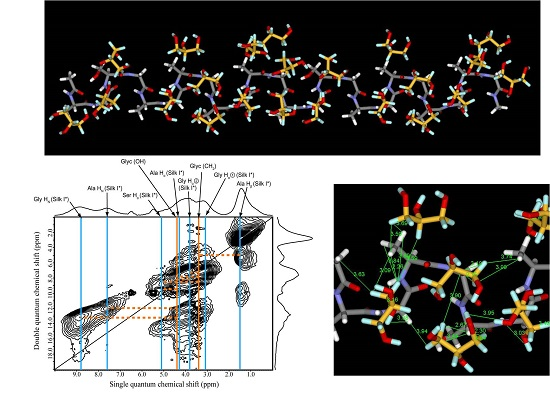
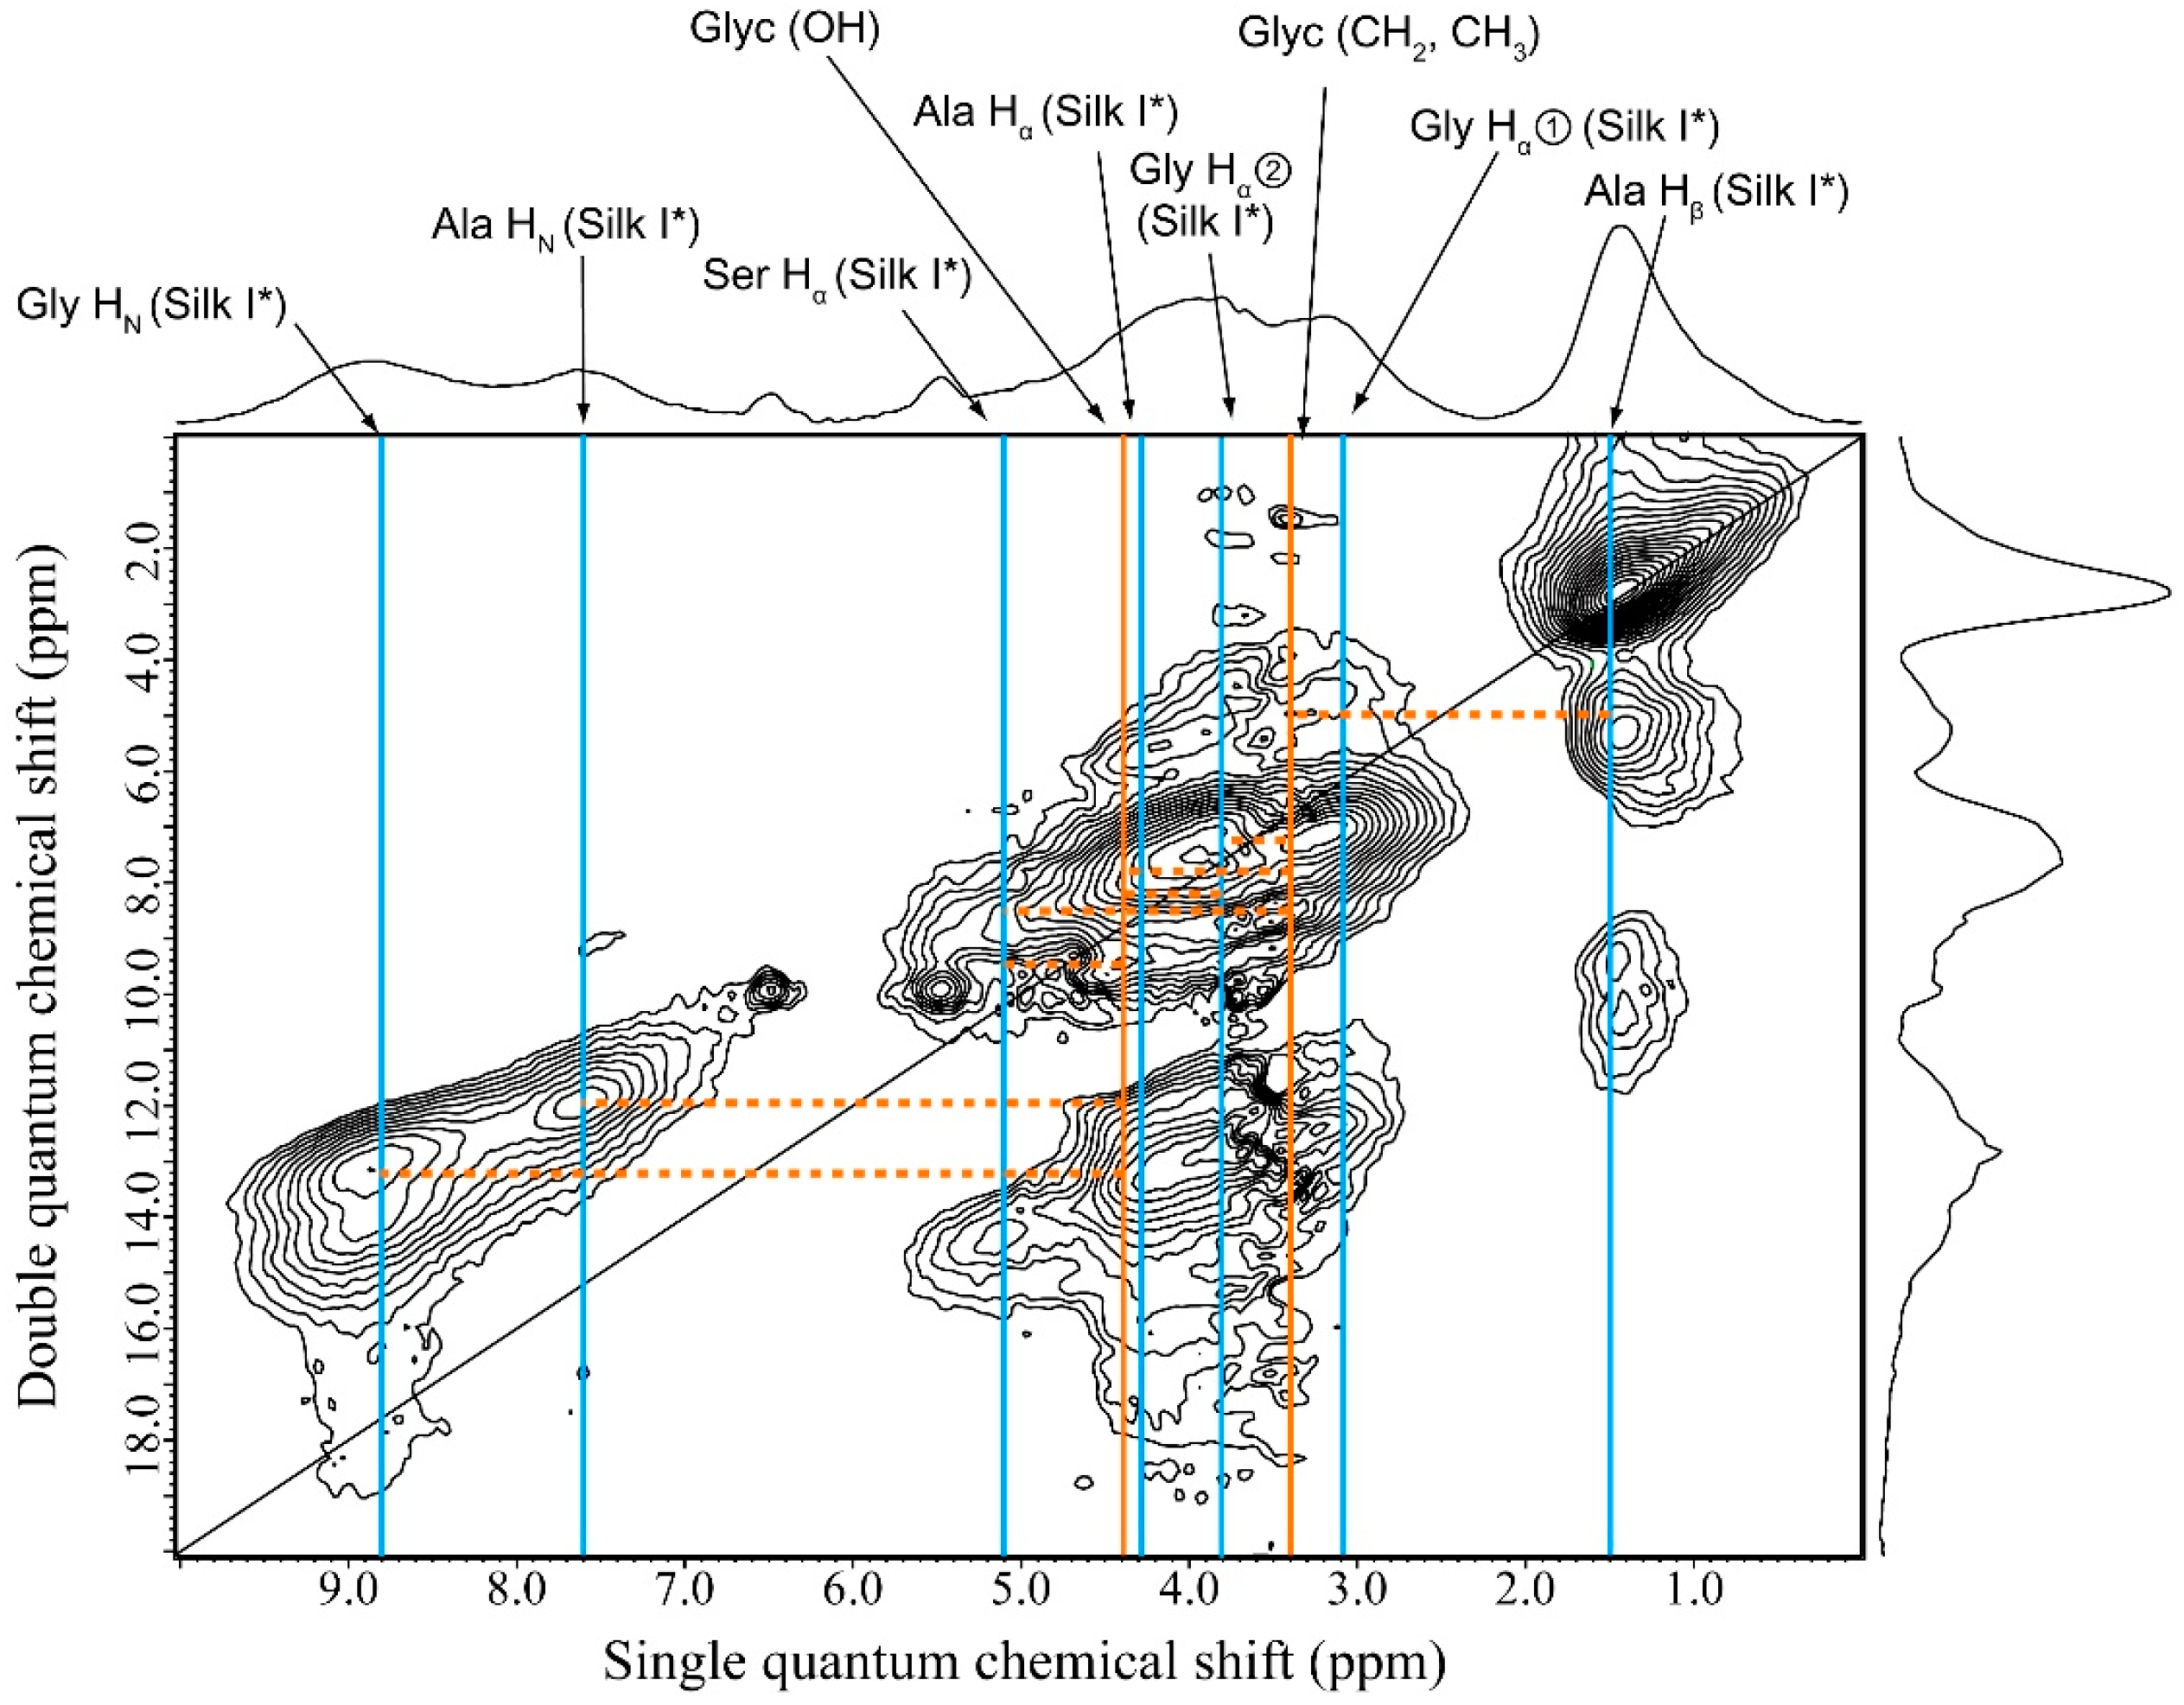
2.6. 1H DQMAS NMR Spectrum of Glyc (29 wt %)-Blended SF Film

Figure 7 shows the 1H DQMAS NMR spectrum of SF with Glyc (29 wt %). The percentages of random coil, Silk I* and β-sheet were determined to be 53.6%, 29.9% and 17.5%, respectively, for Glyc (29 wt %)-blended SF. The remarkable spectral change from Figure 6 was due to the appearance of Silk I* form in SF. The Ser Hα peak of SF with Silk I* form was clearly observed in the 1H DQMAS NMR spectrum as well as the Ser Cα peak of SF with Silk I* form observed in the 13C CP/MAS NMR spectra of Glyc-blend SF films (Figure 1). In addition, the NH peaks of Ala and Gly residues were separated clearly with chemical shift difference of more than 1 ppm due to the appearance of Silk I* form [32]. In the Silk I* conformation, the Gly NH contributed to intra-molecular hydrogen bonding formation parallel to the SF chain, while Ala NH contributed to inter-molecular hydrogen bonding formation perpendicular to the SF chain [20,21]. The latter inter-molecular hydrogen bonding was weaker than the intra-molecular hydrogen bonding judging from the NH chemical shifts; thus, the NH chemical shifts of Ala HN proton was 7.6 ppm and that of Gly HN proton 8.8 ppm. Therefore, the inter-molecular hydrogen bonding was easy to break down by interaction with Glyc for the Silk I* form. A set of twelve 1H–1H correlation signals (broken lines) was observed for Silk I* form together with that of three 1H–1H correlation signals (broken lines) of random coil, as summarized in Table 2 although those of Silk II could not be detected because of low probability.

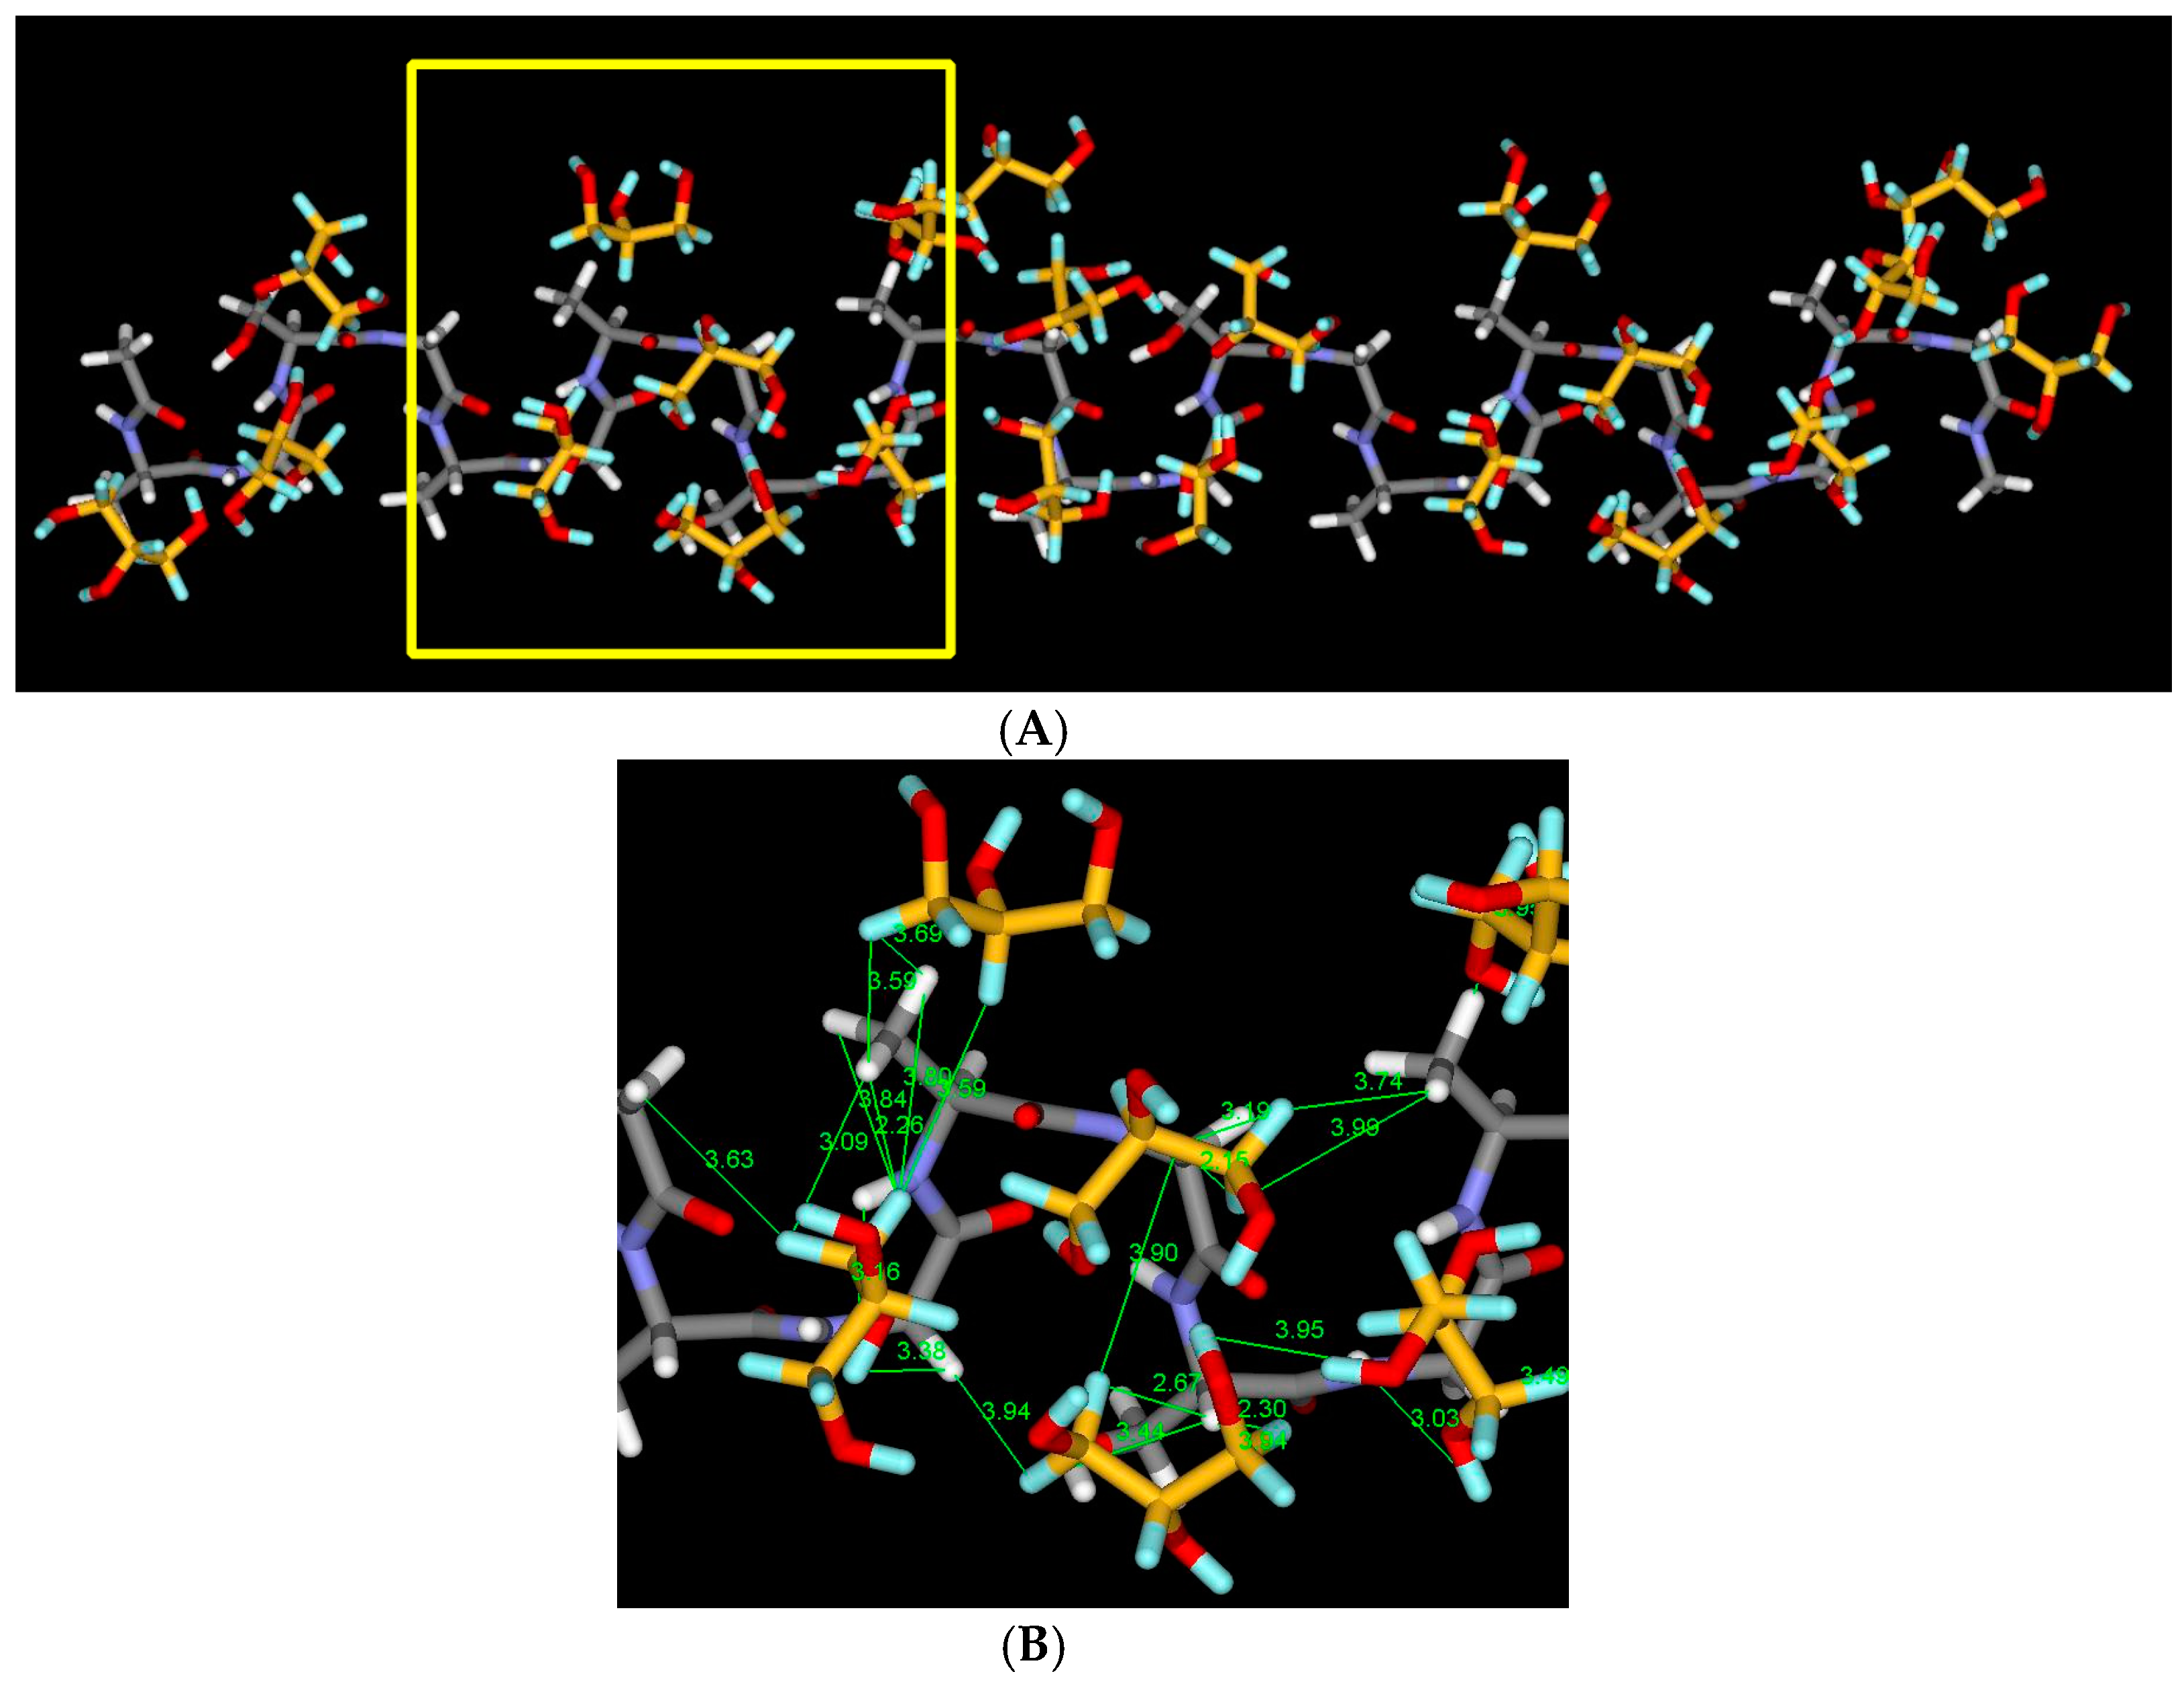
2.7. Structural Model of Glyc-SF Complex Having Silk I* Form

The six 1H–1H correlation signals (broken lines) between the OH or CH2 groups of Glyc and SF were selected from Figure 8 and listed in Table 2. Thus, 1H atomic distances of Glyc (CH2)-Ala Hβ, Glyc (CH2)-Gly Hα①, Glyc (CH2)-Ser Hα, Glyc (OH)-Ser Hα, Glyc (OH)-Ala HN and Glyc (OH)-Gly HN were assumed to be within 4 Å. Here the Glyc peaks were observed at 3.4 ppm (CH2) and 4.4 ppm (OH plus H2O). The observed signals reflecting the distance constraints can be used to prepare a structural model for the Glyc-SF complex. As described in the section on Materials and Method, four complex models were obtained after MD simulation as shown in Figure S1. Figure 9A shows one example of the models, and the yellow highlighted area is expanded in Figure 9B to visualize the 1H–1H distances. The Glyc molecules are also hydrogen bonded with each other after the MD simulation. All the green lines in Figure 9B are within 4 Å, which satisfies the observed 1H–1H distance constraints in Glyc (29 wt %) -blended SF film. Among the four models in Figure S1, it is difficult to select one best model. Therefore, it seems reasonable to consider all these models to have similar probabilities. The complex between Glyc and SF with Silk I* form is very stable because the Silk I* form in Glyc-blended SF film does not decrease in concentration after immersion of the Glyc-blended SF film in methanol (data not shown).

3. Materials and Methods

3.1. Preparation of Glyc-Blended SF Films

The 25 cocoons from B. mori were degummed in a mixture of sodium carbonate (0.25% w/v) and Marseille soap (0.25% w/v) solution at 85 °C for 15 min in order to remove silk sericin [43]. Following this step, the degummed SF fiber was obtained. The SF fiber was then dissolved in 9 M LiBr aqueous solution at 40 °C. The 4% regenerated SF solution was prepared by dialysis of the 9 M LiBr aqueous solution against distilled water, followed by centrifugation at 10,000 rpm. The SF aqueous solution after mixing with a certain amounts of Glyc was cast on Teflon plates at 20 °C to prepare the Glyc-blend SF film [44]. The Glyc concentration in SF-Glyc mixture was changed from 0 to 67 wt %. There is no significant difference visually in the appearance and through Scanning Electron Microscopy (SEM) observations among the Glyc-blended SF films with different Glyc concentrations.

3.2. 13C CP/MAS NMR of Glyc-Blended SF Films

13C CP/MAS NMR spectra of Glyc-blended SF films were acquired on a Bruker DSX-400 AVANCE spectrometer (Bruker Co., Billerica, MA, USA) at room temperature operating at 100.4 MHz, with a CP contact time of 1 ms, two pulse phase modulation (TPPM) decoupling, and magic angle spinning at 7 kHz. A total of 8192 scans was collected over a spectral width of 60 kHz, with a recycle delay of 3 s. The 13C NMR chemical shifts were calibrated indirectly through the methylene peak of adamantane observed at 28.8 ppm relative to tetramethylsilane (TMS) at 0 ppm. The 13C CP/MAS NMR observations were repeated at least two times for newly prepared Glyc-blended SF films with different Glyc concentrations and the reproducibility of the experimental results was confirmed.

3.3. Deconvolution Analysis of 13C CP/MAS NMR Spectra

The Ala Cβ peak in the 13C CP/MAS NMR spectra of SF films was used for the deconvolution analysis to determine the fraction of each conformation. In our previous papers [22,45,46], the Ala Cβ peak was deconvoluted by assuming the presence of five peaks. The Ala Cβ peak in the 13C CP/MAS NMR spectrum of the precipitated crystalline fraction of SF after chymotrypsin cleavage (Cp fraction (56% of total SF)) was independently observed and deconvoluted to three peaks at 21.7 ppm (β-sheet B), 19.6 ppm (β-sheet A) and 16.5 ppm (distorted β-turn/random coil) [22,46]. The Ala Cβ peak in the 13C CP/MAS NMR spectrum of the other soluble fraction (44%) was assigned to the non-crystalline fraction [46]. However, it was difficult to monitor the structural change as a function of Glyc concentration because the structural change was expected to occur at both crystalline and non-crystalline regions of SF film simultaneously. Therefore in this paper, we determined the fraction of the conformation of Glyc-blended SF films by assuming the presence of four conformations: Silk I* (16.5 ppm), random coil (16.5 ppm), β-sheet A (19.6 ppm) and β-sheet B (21.7 ppm) from the Ala Cβ peaks in the 13C CP/MAS NMR spectra. Since the Ala Cβ chemical shifts were the same between random coil and Silk I*, the large difference in the half-height-widths between them (Random coil: ~300 Hz and Silk I*: ~100 Hz) was used to determine each fraction in the peak deconvolution. In addition, the appearance of Silk I* could be confirmed by the appearance of sharp peak at 177 ppm in the Ala carbonyl carbon region as reported previously [33,34]. All the deconvolution analyses were performed by assuming Gaussian line shapes [34,47].

3.4. Solid State DQMAS 1H NMR

DQMAS 1H NMR spectra were observed at 920 MHz using a JEOL JNM-ECA920 spectrometer in Okazaki, Japan [48]. The 1H–X double resonance and ultra-high speed MAS probe are attached. The sample spinning speed was stabilized such that the spinning fluctuations were less than ±10 Hz at a spinning rate of 70 kHz. The temperature of the samples was estimated to be around 333 K at 70 kHz MAS. The 1H rf field strength of π/2 pulse (1.29 μs) was 194 kHz. The 1H chemical shift was referenced to the peak of silicon rubber and set to 0.12 ppm from TMS. The 2τ delay was 0.3 ms. The DQMAS spectra were obtained every 32 scans at each period in the DQ domain, and the recycle delay was 2 s. For the 1H DQMAS measurement, a Dipolar Homonuclear Homogeneous Hamiltonian Double-Quantum/Single-Quantum correlation experiment (DH3DQ-SQ) was employed [49].

3.5. 1H Solution NMR of Regenerated SF Aqueous Solution

1H solution NMR spectra of regenerated SF aqueous solution were observed as a function of Glyc concentration at room temperature by JEOL ECX-400 spectrometer (JEOL Co., Tokyo, Japan).

3.6. Model Building of Glyc-SF with Silk I* Form by Molecular Dynamics (MD) Simulation

The MD simulation was performed for the complex model between Glyc and SF with Silk I* form by using the “Discover” module in Materials Studio 4.1 (Accelrys Inc. Tokyo, Japan). A crystal which consisted of 24 SF molecules (with the arrangement such that 6 molecules were located within the sheet and 4 molecules placed inter-sheet) with the formula Acetyl-(Ala-Gly-Ala-Gly-Ser-Gly)2-NHCH3 with Silk I* form [32] was built for the MD simulation. Five hundred Glyc molecules were generated around the crystal. All of the MD simulations were performed using a pcff force field in vacuo, and temperature was controlled at 298 K. The MD simulations were performed by 500,000 steps up to 500 ps. After the simulation, 16 Glyc-SF complex models where several Glyc molecules attached to each SF molecule located at the surface of the crystal were obtained at 500 ps. Moreover, the energy minimization was performed again for the complex models using MOPAC (Molecular Orbital PACkage, Colorado Springs, CO, USA). The models were selected if all of the observed 6 1H–1H distances between 1H atoms of Glyc and SF were within 4 A. Finally, four complex models were obtained as shown in the Supplementary Materials.

4. Conclusions

The Glyc-induced structural characterization of SF was performed with 13C CP/MAS NMR and 1H DQMAS NMR. The presence of only 5 wt % Glyc in the film induced a significant conformational change in SF where Silk I* (repeated type II β-turn and no α-helix) newly appeared. Upon further increase in Glyc concentration, the percentage of Silk I* increased linearly up to 9 wt % Glyc and then tended to be almost constant (30%). The appearance of Silk I* form was confirmed by the 1H DQMAS NMR spectrum of Glyc-blended SF film. The 1H–1H distance constraints among 1H atoms of Glyc and 1H atoms of SF were obtained from the 1H DQMAS NMR and used to build a structural model of the complex between Glyc and SF having Silk I* form by MD simulation.

Supplementary Materials

Supplementary materials can be found at www.mdpi.com/1422-0067/17/9/1517/s1.

Acknowledgments

Tetsuo Asakura acknowledges support by a Grant-in-Aid for Scientific Research from the Ministry of Education, Science, Culture and Supports of Japan (26248050) and Impulsing Paradigm Change through Disruptive Technologies Program (ImPACT).

Author Contributions

Tetsuo Asakura is the idea source and writer of the manuscript; Masanori Endo, Misaki Hirayama, Hiroki Arai, Yugo Tasei and Tetsuo Asakura performed and analyzed the experiments; and Akihiro Aoki performed and analyzed the Molecular Dynamics simulation.

Conflicts of Interest

The authors declare no conflict of interest.

References

  1. Asakura, T.; Miller, T. Biotechnology of Silk; Springer: Dordrecht, The Netherlands, 2014. [Google Scholar]
  2. Vollrath, F.; Porter, D. Spider silk as archetypal protein elastomer. Soft Matter 2006, 2, 377–385. [Google Scholar] [CrossRef]
  3. Altman, G.H.; Diaz, F.; Jakuba, C.; Calabro, T.; Horan, R.L.; Chen, J.; Lu, H.; Richmond, J.; Kaplan, D.L. Silk-based biomaterials. Biomaterials 2003, 24, 401–416. [Google Scholar] [CrossRef]
  4. Gronau, G.; Krishnaji, S.T.; Kinahan, M.E.; Giesa, T.; Wong, J.Y.; Kaplan, D.L.; Buehler, M.J. A review of combined experimental and computational procedures for assessing biopolymer structure-process-property relationships. Biomaterials 2012, 33, 8240–8255. [Google Scholar] [CrossRef] [PubMed]
  5. Koh, L.D.; Cheng, Y.; Teng, C.P.; Khin, Y.W.; Loh, X.J.; Tee, S.Y.; Low, M.; Ye, E.; Yu, H.D.; Zhang, Y.W.; et al. Structures, mechanical properties and applications of silk fibroin materials. Prog. Polym. Sci. 2015, 46, 86–100. [Google Scholar] [CrossRef]
  6. Asakura, T.; Kaplan, D.L. Silk Production and Processing. In Encyclopedia of Agricultural Science; Arutzen, C.J., Ed.; Academic Press: New York, NY, USA, 1994; Volume 4, pp. 1–11. [Google Scholar]
  7. Cao, Y.; Wang, B. Biodegradation of Silk Biomaterials. Int. J. Mol. Sci. 2009, 10, 1514–1524. [Google Scholar] [CrossRef] [PubMed]
  8. Kawahara, Y.; Furukawa, K.; Yamamoto, T. Self-Expansion Behavior of Silk Fibroin Film. Macromol. Mater. Eng. 2006, 291, 458–462. [Google Scholar] [CrossRef]
  9. Lu, S.; Wang, X.; Lu, Q.; Zhang, X.; Kluge, J.A.; Uppal, N.; Omenetto, F.; Kaplan, D.L. Insoluble and Flexible Silk Films Containing Glycerol. Biomacromolecules 2010, 11, 143–150. [Google Scholar] [CrossRef] [PubMed]
  10. Pei, Y.; Liu, X.; Liu, S.; Lu, Q.; Liu, J.; Kaplan, D.L.; Zhu, H. A mild process to design silk scaffolds with reduced β-sheet structure and various topographies at the nanometer scale. Acta Biomater. 2015, 13, 168–176. [Google Scholar] [CrossRef] [PubMed]
  11. Asakura, T.; Suzuki, Y.; Nakazawa, Y.; Holland, G.P.; Yarger, J.L. Elucidating silk structure using solid-state NMR. Soft Matter 2013, 9, 11440–11450. [Google Scholar] [CrossRef]
  12. Asakura, T.; Okushita, K.; Williamson, M.P. Analysis of the Structure of Bombyx mori Silk Fibroin by NMR. Macromolecules 2015, 48, 2345–2357. [Google Scholar] [CrossRef]
  13. Asakura, T.; Kuzuhara, A.; Tabeta, R.; Saito, H. Conformational characterization of Bombyx mori silk fibroin in the solid state by high-frequency carbon-13 cross polarization-magic angle spinning NMR, X-ray diffraction, and infrared spectroscopy. Macromolecules 1985, 18, 1841–1845. [Google Scholar] [CrossRef]
  14. Saito, H.; Tabeta, R.; Asakura, T.; Iwanaga, Y.; Shoji, A.; Ozaki, T.; Ando, I. High-resolution carbon-13 NMR study of silk fibroin in the solid state by the cross-polarization-magic angle spinning method. Conformational characterization of silk I and silk II type forms of Bombyx mori fibroin by the conformation-dependent carbon-13 chemical shifts. Macromolecules 1984, 17, 1405–1412. [Google Scholar]
  15. Van Beek, J.D.; Beaulieu, L.; Schäfer, H.; Demura, M.; Asakura, T.; Meier, B.H. Solid-state NMR determination of the secondary structure of Samia cynthia ricini silk. Nature 2000, 405, 1077–1079. [Google Scholar] [PubMed]
  16. Spera, S.; Bax, A. Empirical correlation between protein backbone conformation and Cα and Cβ 13C nuclear magnetic resonance chemical shifts. J. Am. Chem. Soc. 1991, 113, 5490–5492. [Google Scholar] [CrossRef]
  17. Asakura, T.; Iwadate, M.; Demura, M.; Williamson, M.P. Structural analysis of silk with 13C NMR chemical shift contour plots. Int. J. Biol. Macromol. 1999, 24, 167–171. [Google Scholar] [CrossRef]
  18. Wishart, D.S.; Sykes, B.D.; Richards, F.M. Relationship between nuclear magnetic resonance chemical shift and protein secondary structure. J. Mol. Biol. 1991, 222, 311–333. [Google Scholar] [CrossRef]
  19. Asakura, T.; Taoka, K.; Demura, M.; Williamson, M.P. The relationship between amide proton chemical shifts and secondary structure in proteins. J. Biomol. NMR 1995, 6, 227–236. [Google Scholar] [CrossRef] [PubMed]
  20. Asakura, T.; Ashida, J.; Yamane, T.; Kameda, T.; Nakazawa, Y.; Ohgo, K.; Komatsu, K. A repeated β-turn structure in poly(Ala-Gly) as a model for silk I of Bombyx mori silk fibroin studied with two-dimensional spin-diffusion NMR under off magic angle spinning and rotational echo double resonance. J. Mol. Biol. 2001, 306, 291–305. [Google Scholar] [CrossRef] [PubMed]
  21. Asakura, T.; Ohgo, K.; Komatsu, K.; Kanenari, M.; Okuyama, K. Refinement of Repeated β-turn Structure for Silk I Conformation of Bombyx mori Silk Fibroin Using 13C Solid-State NMR and X-ray Diffraction Methods. Macromolecules 2005, 38, 7397–7403. [Google Scholar] [CrossRef]
  22. Asakura, T.; Ohata, T.; Kametani, S.; Okushita, K.; Yazawa, K.; Nishiyama, Y.; Nishimura, K.; Aoki, A.; Suzuki, F.; Kaji, H.; et al. Intermolecular Packing in B. mori Silk Fibroin: Multinuclear NMR Study of the Model Peptide (Ala-Gly)15 Defines a Heterogeneous Antiparallel Antipolar Mode of Assembly in the Silk II Form. Macromolecules 2015, 48, 28–36. [Google Scholar] [CrossRef]
  23. Jenkins, J.E.; Creager, M.S.; Lewis, R.V.; Holland, G.P.; Yarger, J.L. Quantitative Correlation between the Protein Primary Sequences and Secondary Structures in Spider Dragline Silks. Biomacromolecules 2010, 11, 192–200. [Google Scholar] [CrossRef] [PubMed]
  24. Schnell, I.; Brown, S.P.; Low, H.Y.; Ishida, H.; Spiess, H.W. An Investigation of Hydrogen Bonding in Benzoxazine Dimers by Fast Magic-Angle Spinning and Double-Quantum 1H NMR Spectroscopy. J. Am. Chem. Soc. 1998, 120, 11784–11795. [Google Scholar] [CrossRef]
  25. Yates, J.R.; Pham, T.N.; Pickard, C.J.; Mauri, F.; Amado, A.M.; Gil, A.M.; Brown, S.P. An Investigation of Weak CH···O Hydrogen Bonds in Maltose Anomers by a Combination of Calculation and Experimental Solid-State NMR Spectroscopy. J. Am. Chem. Soc. 2005, 127, 10216–10220. [Google Scholar] [CrossRef] [PubMed]
  26. Yates, J.R.; Pickard, C.J.; Mauri, F. Calculation of NMR chemical shifts for extended systems using ultrasoft pseudopotentials. Phys. Rev. B 2007, 76, 024401. [Google Scholar] [CrossRef]
  27. Brown, S.P. Probing proton–proton proximities in the solid state. Prog. Nucl. Magn. Reson. Spectrosc. 2007, 50, 199–251. [Google Scholar] [CrossRef]
  28. Bradley, J.P.; Tripon, C.; Filip, C.; Brown, S.P. Determining relative proton–proton proximities from the build-up of two-dimensional correlation peaks in 1H double-quantum MAS NMR: Insight from multi-spin density-matrix simulations. Phys. Chem. Chem. Phys. 2009, 11, 6941–6952. [Google Scholar] [CrossRef] [PubMed]
  29. Harris, R.K.; Hodgkinson, P.; Zorin, V.; Dumez, J.N.; Herrmann, B.E.; Emsley, L.; Salager, E.; Stein, R.S. Computation and NMR crystallography of terbutaline sulfate. Magn. Reson. Chem. 2010, 48, S103–S112. [Google Scholar] [CrossRef] [PubMed]
  30. Yazawa, K.; Suzuki, F.; Nishiyama, Y.; Ohata, T.; Aoki, A.; Nishimura, K.; Kaji, H.; Shimizu, T.; Asakura, T. Determination of accurate 1H positions of an alanine tripeptide with anti-parallel and parallel β-sheet structures by high resolution 1H solid state NMR and GIPAW chemical shift calculation. Chem. Commun. 2012, 48, 11199–11201. [Google Scholar] [CrossRef] [PubMed]
  31. Asakura, T.; Yazawa, K.; Horiguchi, K.; Suzuki, F.; Nishiyama, Y.; Nishimura, K.; Kaji, H. Difference in the structures of alanine tri- and tetra-peptides with antiparallel β-sheet assessed by X-ray diffraction, solid-state NMR and chemical shift calculations by GIPAW. Biopolymers 2014, 10, 13–20. [Google Scholar] [CrossRef] [PubMed]
  32. Asakura, T.; Suzuki, Y.; Yazawa, K.; Aoki, A.; Nishiyama, Y.; Nishimura, K.; Suzuki, F.; Kaji, H. Determination of Accurate 1H Positions of (Ala-Gly)n as a Sequential Peptide Model of Bombyx mori Silk Fibroin before Spinning (Silk I). Macromolecules 2013, 46, 8046–8050. [Google Scholar] [CrossRef]
  33. Asakura, T.; Demura, M.; Date, T.; Miyashita, N.; Ogawa, K.; Williamson, M.P. NMR study of silk I structure of Bombyx mori silk fibroin with 15N- and 13C-NMR chemical shift contour plots. Biopolymers 1996, 41, 193–203. [Google Scholar] [CrossRef]
  34. Asakura, T.; Sato, Y.; Aoki, A. Stretching-Induced Conformational Transition of the Crystalline and Noncrystalline Domains of 13C-Labeled Bombyx mori Silk Fibroin Monitored by Solid State NMR. Macromolecules 2015, 48, 5761–5769. [Google Scholar] [CrossRef]
  35. Asakura, T.; Suzuki, H.; Watanabe, Y. Conformational characterization of silk fibroin in intact Bombyx mori and Philosamia cynthia ricini silkworms by carbon-13 NMR spectroscopy. Macromolecules 1983, 16, 1024–1026. [Google Scholar] [CrossRef]
  36. Suzuki, Y.; Yamazaki, T.; Aoki, A.; Shindo, H.; Asakura, T. NMR Study of the Structures of Repeated Sequences, GAGXGA (X = S, Y, V), in Bombyx mori Liquid Silk. Biomacromolecules 2014, 15, 104–112. [Google Scholar] [CrossRef] [PubMed]
  37. Zhou, C.Z.; Confalonieri, F.; Jacquet, M.; Perasso, R.; Li, Z.G.; Janin, J. Silk fibroin: Structural implications of a remarkable amino acid sequence. Proteins 2001, 44, 119–122. [Google Scholar] [CrossRef] [PubMed]
  38. Percot, A.; Colomban, P.; Paris, C.; Dinh, H.M.; Wojcieszak, M.; Mauchamp, B. Water dependent structural changes of silk from Bombyx mori gland to fibre as evidenced by Raman and IR spectroscopies. Vib. Spectrosc. 2014, 73, 79–89. [Google Scholar] [CrossRef]
  39. Colomban, P.; Dinh, H.M.; Riand, J.; Prinsloo, L.C.; Mauchamp, B. Nanomechanics of single silkworm and spider fibres: A Raman and micro-mechanical in situ study of the conformation change with stress. J. Raman Spectrosc. 2008, 39, 1749–1764. [Google Scholar] [CrossRef]
  40. Asakura, T. Structure of Bombyx mori silk fibroin in aqueous solution. Makromol. Chem. Rapid Commun. 1986, 7, 755–759. [Google Scholar] [CrossRef]
  41. Asakura, T.; Ashida, J.; Yamane, T. Structure of Bombyx mori Silk Fibroin before Spinning in Silkworm. In NMR Spectroscopy of Polymers in Solution and in the Solid State; Cheng, H.N., English, A.D., Eds.; American Chemical Society: Washington, DC, USA, 2004; pp. 71–82. [Google Scholar]
  42. Takahashi, Y.; Gehoh, M.; Yuzuriha, K. Structure refinement and diffuse streak scattering of silk (Bombyx mori). Int. J. Biol. Macromol. 1999, 24, 127–138. [Google Scholar] [CrossRef]
  43. Asakura, T.; Watanabe, Y.; Uchida, A.; Minagawa, H. NMR of silk fibroin. Carbon-13 NMR study of the chain dynamics and solution structure of Bombyx mori silk fibroin. Macromolecules 1984, 17, 1075–1081. [Google Scholar] [CrossRef]
  44. Yoshimizu, H.; Asakura, T. The structure of Bombyx mori silk fibroin membrane swollen by water studied with ESR, 13C-NMR, and FT-IR spectroscopies. J. Appl. Polym. Sci. 1990, 40, 1745–1756. [Google Scholar] [CrossRef]
  45. Asakura, T.; Yao, J.; Yamane, T.; Umemura, K.; Ulrich, A.S. Heterogeneous Structure of Silk Fibers from Bombyx mori Resolved by 13C Solid-State NMR Spectroscopy. J. Am. Chem. Soc. 2002, 124, 8794–8795. [Google Scholar] [CrossRef] [PubMed]
  46. Asakura, T.; Yao, J. 13C CP/MAS NMR study on structural heterogeneity in Bombyx mori silk fiber and their generation by stretching. Protein Sci. 2002, 11, 2706–2713. [Google Scholar] [CrossRef] [PubMed]
  47. Asakura, T.; Isobe, K.; Aoki, A.; Kametani, S. Conformation of Crystalline and Noncrystalline Domains of [3–13C]Ala-, [3–13C]Ser-, and [3–13C]Tyr-Bombyx mori Silk Fibroin in a Hydrated State Studied with 13C DD/MAS NMR. Macromolecules 2015, 48, 8062–8069. [Google Scholar] [CrossRef]
  48. Yamauchi, K.; Yamasaki, S.; Takahashi, R.; Asakura, T. Microscopic structural analysis of fractured silk fibers from Bombyx mori and Samia cynthia ricini using 13C CP/MAS NMR with a 1 mm microcoil MAS NMR probehead. Solid State Nucl. Mag. 2010, 38, 27–30. [Google Scholar] [CrossRef] [PubMed]
  49. Deschamps, M.; Fayon, F.; Cadars, S.; Rollet, A.L.; Massiot, D. 1H and 19F ultra-fast MAS double-quantum single-quantum NMR correlation experiments using three-spin terms of the dipolar homonuclear Hamiltonian. Phys. Chem. Chem. Phys. 2011, 13, 8024–8030. [Google Scholar] [CrossRef] [PubMed]
Figure 1. 13C Cross Polarization/Magic Angle Spinning nuclear magnetic resonance (CP/MAS NMR) spectra of pure silk fibroin (SF) and glycerin (Glyc)-blend SF films with different Glyc concentrations of 5, 9, and 40 wt % and pure SF film treated by methanol. The assignments are given on top of the peaks. TMS, tetramethylsilane.
Ijms 17 01517 g001
Figure 2. Deconvolution of Ala Cβ peaks (marked by red (random coil), light blue (Silk I*), dark blue (β-sheet B) and green (β-sheet A) lines) in the 13C CP/MAS NMR spectra of SF and Glyc-blended SF films as a function of Glyc concentration by assuming Gaussian line shape. TMS, tetramethylsilane.
Ijms 17 01517 g002
Figure 3. Change in the fraction of different conformations of SF and Glyc-blended SF films determined from the deconvolution of Ala Cβ peaks as a function of Glyc concentration. r.c.: random coil.
Ijms 17 01517 g003
Figure 4. 1H solution NMR spectra of regenerated SF aqueous solutions observed by changing Glyc concentration. The assignments are given on top of the peaks.
Ijms 17 01517 g004
Figure 5. 1H single pulse NMR spectra of (A) SF; and (B) Glyc (29 wt %)-blended SF films in the solid state. The assignments are given on top of the peaks. The detailed assignments and the chemical shifts of the 1H NMR peaks are summarized in Table 1 (1H chemical shift).
Ijms 17 01517 g005
Figure 6. 1H Double-Quantum Magic Angle Spinning (DQMAS) NMR spectrum of SF film together with the assignment. The 1H chemical shifts of random coil (red) and Silk II (green) forms are shown together with the 1H–1H correlation signals (broken lines).
Ijms 17 01517 g006
Figure 7. 1H DQMAS NMR spectrum of Glyc (29 wt %)-blended SF film together with the assignments. The 1H chemical shifts of random coil (red) and Silk I* (blue) forms are shown together with the 1H–1H correlation signals (broken lines).
Ijms 17 01517 g007
Figure 8. 1H DQMAS NMR spectrum of Glyc (29 wt %)-blended SF film. The 1H–1H correlation signals (broken lines) between the OH or CH2 groups of Glyc (orange) and SF with Silk I* (blue) form are shown.
Ijms 17 01517 g008
Figure 9. (A) A complex model of Glyc-SF model peptide, Acetyl-(Ala-Gly-Ala-Gly-Ser-Gly)2-NHCH3 with Silk I* form after 500 ps of Molecular Dynamics (MD) simulation. Details of the calculation are described in Materials and Method. The model satisfies the observed 1H–1H distance information. Four models including this model are shown in Figure S1; (B) the calculated distances between 1H atoms in Glyc and 1H atoms in SF in the area surrounded by square (yellow) in Figure 9A are shown as an example. All of the calculated 1H atomic distances between Glyc (CH2) and Ala Hβ, Glyc (CH2) and Gly Hα①, Glyc (CH2) and Ser Hα, Glyc (OH) and Ser Hα, Glyc (OH) and AlaHN, and Glyc (OH) and Gly HN are within 4 Å which satisfies the corresponding observed distances in Figure 8.
Ijms 17 01517 g009
Table 1. 13C and 1H chemical shifts (in ppm from tetramethylsilane (TMS)) of silk fibroin (SF) with different conformations in glycerin (Glyc)-blended SF film. The assignments of the conformations were performed as shown in the references [13,14,17,20,21,22,33] for 13C nuclear magnetic resonance (NMR) and [32] for 1H NMR.
13C Chemical Shift
ConformationAla CβAla CαAla COGly CαGly COSer Cβ
r.c.16.750.0175.542.6171.1–171.5-
Silk II19.6(A), 21.7(B)49.2172.643.0169.1-
Silk I*16.551.4177.043.8170.760.7
1H Chemical Shift
ConformationAla HβAla HαAla HNGly HαGly HαGly HNSer Hα
r.c.1.34.18.13.54.18.1-
Silk II1.05.08.73.94.68.7-
Silk I*1.54.37.63.83.18.85.1
r.c.: random coil; Silk I*: Type II β-turn; Gly Hα① and Gly Hα②: Two protons of Gly CαH2 group with different chemical shifts in the solid state [32].
Table 2. Sets of 1H–1H correlation signals in the 1H DQMAS NMR spectra of SF and Glyc (29 wt %)-blended SF films. These 1H–1H correlation signals are shown as broken lines in Figure 6, Figure 7 and Figure 8.
SF Film
r.c.Silk II
Ala Hβ—Ala Hα/Gly HαAla Hβ—Gly Hα
Ala Hβ—Gly HαAla Hβ—Ala Hα
Ala Hβ—Ala HN/Gly HNGly Hα①—Gly Hα
Gly Hα①—Ala Hα/Gly HαGly Hα①—Ala Hα
Gly Hα①—Ala HN/Gly HNGly Hα①—Gly HN/Ala HN
Ala Hα/Gly Hα②—Ala HN/Gly HNAla Hα—Gly Hα
-Gly Hα②–Gly HN/Ala HN
-Ala Hα—Gly HN/Ala HN
Glyc-Blend SF Film
r.c.Silk I*Glyc—Silk I*
Ala Hβ—Ala Hα/Gly HαAla Hβ—Gly HαGlyc (CH2)—Ala Hβ
Ala Hβ—Gly HαAla Hβ—Gly HαGlyc (CH2)—Gly Hα
Gly Hα①—Ala Hα/Gly HαAla Hβ—Ala HαGlyc (CH2)—Ser Hα
Ala Hα—Ala HN/Gly HNAla Hβ—Ala HNGlyc (OH)—Gly Hα
-Gly Hα②—Ala HαGlyc (OH)—Ser Hα
-Gly Hα②—Ala HNGlyc (OH)—Ala HN
-Gly Hα②—Gly HNGlyc (OH)—Gly HN
-Gly Hα①—Ala Hα-
-Gly Hα①—Ala HN-
-Gly Hα①—Gly HN-
-Ser Hα—Gly HN-
-Ala Hα—Gly HN-

