Article

Function of Metallothionein-3 in Neuronal Cells: Do Metal Ions Alter Expression Levels of MT3?

1
Department of Chemistry, Barnard College of Columbia University, New York, NY 10027, USA
2
Center for Genome Technology and Biomolecular Engineering, Department of Chemical Engineering, Columbia University, New York, NY 10027, USA
3
Department of Biology, Barnard College of Columbia University, New York, NY 10027, USA
4
Department of Psychology and Program in Neuroscience, Barnard College of Columbia University, New York, NY 10027, USA
5
Department of Psychology, Columbia University, New York, NY 10027, USA
6
Department of Pathology and Cell Biology Columbia Health Sciences, New York, NY 10027, USA
*
Authors to whom correspondence should be addressed.
Int. J. Mol. Sci. 2017, 18(6), 1133; https://doi.org/10.3390/ijms18061133
Submission received: 19 April 2017 / Revised: 16 May 2017 / Accepted: 16 May 2017 / Published: 25 May 2017
(This article belongs to the Special Issue Metallothioneins in Bioinorganic Chemistry: Recent Developments)

Abstract

:
A study of factors proposed to affect metallothionein-3 (MT3) function was carried out to elucidate the opaque role MT3 plays in human metalloneurochemistry. Gene expression of Mt2 and Mt3 was examined in tissues extracted from the dentate gyrus of mouse brains and in human neuronal cell cultures. The whole-genome gene expression analysis identified significant variations in the mRNA levels of genes associated with zinc homeostasis, including Mt2 and Mt3. Mt3 was found to be the most differentially expressed gene in the identified groups, pointing to the existence of a factor, not yet identified, that differentially controls Mt3 expression. To examine the expression of the human metallothioneins in neurons, mRNA levels of MT3 and MT2 were compared in BE(2)C and SH-SY5Y cell cultures treated with lead, zinc, cobalt, and lithium. MT2 was highly upregulated by Zn2+ in both cell cultures, while MT3 was not affected, and no other metal had an effect on either MT2 or MT3.

Graphical Abstract

1. Introduction

Mammalian metallothionein-3 isoform (MT3) is an unusual protein with a puzzling role in neurochemistry [1]. It has the hallmarks of a typical mammalian metallothionein and is comprised of 68 amino acids, 20 of which are cysteines. Hence, it is assumed that, like other metallothioneins (MT), it binds essential metal ions such as zinc (Zn) and copper (Cu) and sequesters toxic metal ions such as cadmium (Cd) and silver (Ag) [2]. Most mammalian metallothioneins are induced by high levels of zinc by a mechanism initiated by Zn2+ binding to a metal-responsive transcription factor [3]. Because toxic metals such as Cd2+ and Ag+ displace zinc bound to metallothionein, their presence also indirectly leads to elevated MT levels.
Despite the presence of the canonical 20 cysteines in its structure, MT3 was first identified not as a metallothionein, but as an inhibitor of neuronal growth [4,5]. Although the molecular basis of its ability to inhibit neuronal growth is not understood, the effect has been connected to the seven-amino-acid acidic region that is unique to MT3 [6]. Recently, MT3 has been shown to bind to β-actin and facilitate actin polymerization [7]. β-Actin polymerization is involved in cytoskeletal growth, fueling speculation that the neuronal growth inhibitor effects of MT3 could occur via an interaction with β-actin [8].
MT3 is specifically expressed in the normal human brain and is significantly under-expressed in the brains of patients with Alzheimer’s disease [1,4,9]. Little is known about what constitutes “normal” bioinorganic chemistry in the central nervous system [10], though recent works point to essential roles for zinc and copper ions in the brain and suggest that both ions can function in neuronal signaling [11]. Therefore, it is noteworthy that MT3 might modulate the bioinorganic chemistry of essential (zinc, copper), therapeutic (lithium) and toxic (lead) metal ions in the brain. MT3 has been speculated to play a special role in mediating the chemistry of copper, which has been found in the brain not only as bound to biomolecules and highly regulated, but also as existing in dynamic, loosely bound pools [11]. We have speculated that MT3 might be involved in the effect that the exposure to lead (Pb) has on brain development [12]. It is well known that exposure to lead during childhood leads to irreversible long-lasting developmental effects, including perhaps an increased risk of certain forms of mental illnesses [13,14]. Based on a report that lithium chloride treatment leads to decreased levels of Mt3 in mice brains, we have considered the possibility that MT3 might be involved in the pharmacological benefits of lithium treatment for people suffering from bipolar mood disorder [15].
In this paper, we explore factors that may potentially impact MT3 gene expression and, indirectly, function. MT3 is known to be abundant in the dentate gyrus (DG) [16]. Our study of gene expression in the DG of a population of litter-mate matched mice, presented here, revealed significant differences between tested mice in the expression levels of Mt3, along with a suite of other genes associated with zinc homeostasis. Significantly, Mt2 was upregulated in one population of mice, while Mt3 was upregulated in the other population of mice, pointing to a very different mechanism of regulation of these two metallothioneins.
We also examine some inorganic factors that may have an impact on expression levels of metallothioneins in human neuronal cells. There is conflicting published data about the role that metal ions have on the MT3 levels, pointing to the importance of studying MT3 expression in multiple cell lines [17,18,19]. We show that, compared to MT2, MT3 responds differently to identical metal treatments. The effects that metal ions have on MT3 levels are far more modest than the effects that these metal ions have on MT2 levels. This fact, again, is pointing to a possible regulatory mechanism that differentially controls the expression of MT2 vs. MT3 in neuronal tissues.

2. Results

This study focused on gaining a better understanding of MT3 metalloneurochemistry by examining relationships between Mt3/Mt2 and known zinc homeostasis gene expression in mice brains and by comparing how MT3 and MT2 levels in neuronal cell cultures respond to metal ion treatments. Ultimately, this work is part of ongoing efforts in our laboratories to connect molecular-level knowledge about the metal-mediated processes in which MT3 participates and its more systemic role in mammal neurobiology.

2.1. Analysis of Expression of Zinc Homeostasis Genes in Mice Dentate Gyrus

The expression profiles of genes related to Zn homeostasis were assessed using data mining in a whole-genome gene expression dataset that was produced using DG tissues extracted from adult mice brain samples. The dataset was generated by microarray analysis of the mouse gene complement represented by 60,000 probes on Agilent gene expression arrays and consisted of 21,000 genes that were identified as present based on their hybridization signals above the background.
Gene Ontology search for cellular zinc ion homeostasis and related terms revealed 39 genes, 25 of which were found to be expressed in DG based on our microarray dataset (Table 1). Among these genes, there were three that code for metallothionein proteins related to Zn-ion transport and all the major zinc transporters from the Solute Carrier Protein families 30 and 39. Using hierarchical clustering, a search for possible patterns in expression of these genes in the DG tissue samples revealed a presence of two groups of animals. Nearly equal in size, these two groups can be identified by their group-specific co-expression patterns of Zn-binding transporters (Figure 1).
To determine the specific Zn transporters whose expression drives the separation between the two animal groups, we performed a t-test analysis of gene expression between these groups. The t-test analysis was followed by false discovery rate (FDR) correction using the Benjamini-Hochberg procedure. The analysis revealed 11 genes coding for metallothioneins and transporters (shown in color in Table 2) as having a major impact on the segregation of the animal samples into two groups. Re-clustering the expression profiles of the samples based on these 11 genes (Figure 2) revealed two groups, denoted Groups A and B. Group A is characterized by having the genes coding for Mt2 and S100b (Ca-binding protein B) upregulated. The remaining 9 of the 11 discriminating genes were upregulated in Group B, with Mt3 showing the largest difference in its expression level when compared to that in Group A.
To find other genes and molecular functions that distinguish Group A from Group B, in addition to those involved in Zn-ion transport, we performed a global (genome-wide) comparison of gene expression between the two groups and analyzed functional enrichment of the genes that are expressed differently in Group A vs. Group B. We found that both groups had a large number of over-expressed genes coding for metal-binding proteins, but those genes that were found to be upregulated in Group A were different from those upregulated in Group B. In particular, about 250 of such genes were upregulated in Group A, while 237 different genes were upregulated in Group B (Table S1). In addition, Group A had a significant enrichment in genes related to synaptic function and signal transduction pathways.
The gene set that was upregulated in Group B was marked with statistically significant upregulation. These genes are enriched in functional categories related to ribosomal function, active transcription and translation, and other processes characteristic of metabolically active cells. Remarkably, in this group, several large subsets of upregulated genes are disease-related, and include genes involved in functional pathways associated with Huntington’s, Parkinson’s, and Alzheimer’s diseases. The common regulatory themes governing these differentially expressed genes in the dentate gyrus of the two groups of mice still remain to be found. It is also noteworthy that these differences are not related to differences in sex.

2.2. Analysis of MT2 and MT3 mRNA Expression after Metal Treatment

In order to measure the relative expression of MT2/3 mRNA in cells exposed to various excess metal treatments, RNA was extracted and reverse transcribed to yield a cDNA library, followed by qPCR-based determination of relative gene expression levels. While different time points were explored (data not shown), the 4 h post-exposure results were used for this study. Table 3 and Table 4 present the change in MT2 and MT3 expression relative to non-metal treated controls and normalized to the control gene HSP90ABI. Based on the qPCR data, MT2, in both BE(2)C and SHSY5Y cell lines, was highly upregulated in the presence of 100 μM Zn2+. The data also show, with equal clarity, that 100 μM Zn2+ had no effect on MT3 levels in either cell line. No other metal had a significant effect on either MT2 or MT3 levels in these cell lines (data from all experiments shown in Figure S1). Preliminary studies indicated that Cu(II) did not have a statistically significant effect on MT3 expression.

3. Discussion

Metallothioneins are small proteins whose molecular simplicity belies a history replete with efforts to definitively determine their function [20,21,22]. As a member of this protein family known for its confusing biochemical functions, MT3 plays an even more opaque role in mammalian biology. The presented work strives to provide an insight into the biology of MT3 by studying the factors that regulate its expression as well as characterizing the degree of structural changes conferred by the binding of the protein with different metal ions.
Metallothioneins are thought to act as zinc chaperones transporting zinc ions to their target locations and perhaps facilitating their release when warranted [1]. Consistent with this function, most metallothioneins are upregulated by high levels of zinc. The presence of a metal response element (MRE) in the promoter region of MT1 and MT2 causes most metallothioneins to be induced by zinc [3]. The MRE is activated via interaction with the zinc finger-containing metal transcription factor 1 (MTF1) [23]. MTF1 is responsible for regulating a number of genes associated with heavy metals and oxidative stress [23]. Metallothionein is the prototypical gene target for MTF1.
Metallothioneins are also thought to function as “heavy metal sponges,” binding toxic metal ions and potentially sequestering them. Heavy metals, including cadmium and silver, have been repeatedly shown to increase metallothionein levels. However, the effect is an indirect one. Heavy metals affect MT levels because they displace zinc from metallothionein, and the displaced zinc binds to the metal transcription factor, which in turn binds to the MRE and activates the transcription of metallothioneins [24]. Interestingly, despite the fact that lead is a heavy metal, it has never been clear whether lead affects the levels of any metallothioneins [25,26,27]. We recently showed that lead can displace zinc from Mt3 with an equilibrium constant of about 1 × 10⁴ and thus should be able to displace zinc in vivo, leading to the upregulation of MTs by the mechanism described above [12]. Nevertheless, some published studies show no change in MT levels following lead treatment [17], while others do show a change [28].
Metallothioneins have also long been associated with a role in ameliorating oxidative stress [22]. MTs can release Zn2+ and two electrons while forming a disulfide bond. This may be relevant to immune responses and inflammation [22,29]. MTF1 also binds to the metal response element of other genes involved in cellular redox homeostasis, including selenoproteins H and W [30,31]. Thus, it is speculated that metallothioneins and other proteins involved in combatting oxidative stress will be simultaneously overexpressed under conditions of oxidative stress.
Very significantly, however, MT3 appears to be regulated differently from other mammalian metallothioneins [18,32]. MT3 does not appear to respond to zinc levels in either astrocytes or neurons in the same way that other MTs respond to zinc, even though the promoter region of MT3 has several regions that are similar to the metal response elements that regulate MT1 and MT2 levels [1,5,17,19,32]. MTF1 does not bind to the MRE sequence in the MT3 promoter region [32].
Both our cell culture data and our microarray data are consistent with the assertion that, in the brain, MT3 is regulated differently from other metallothioneins. Our cell culture data shows that, in two different neuronal cell lines, addition of zinc leads to a significant overexpression of MT2, while having essentially no effect on MT3.
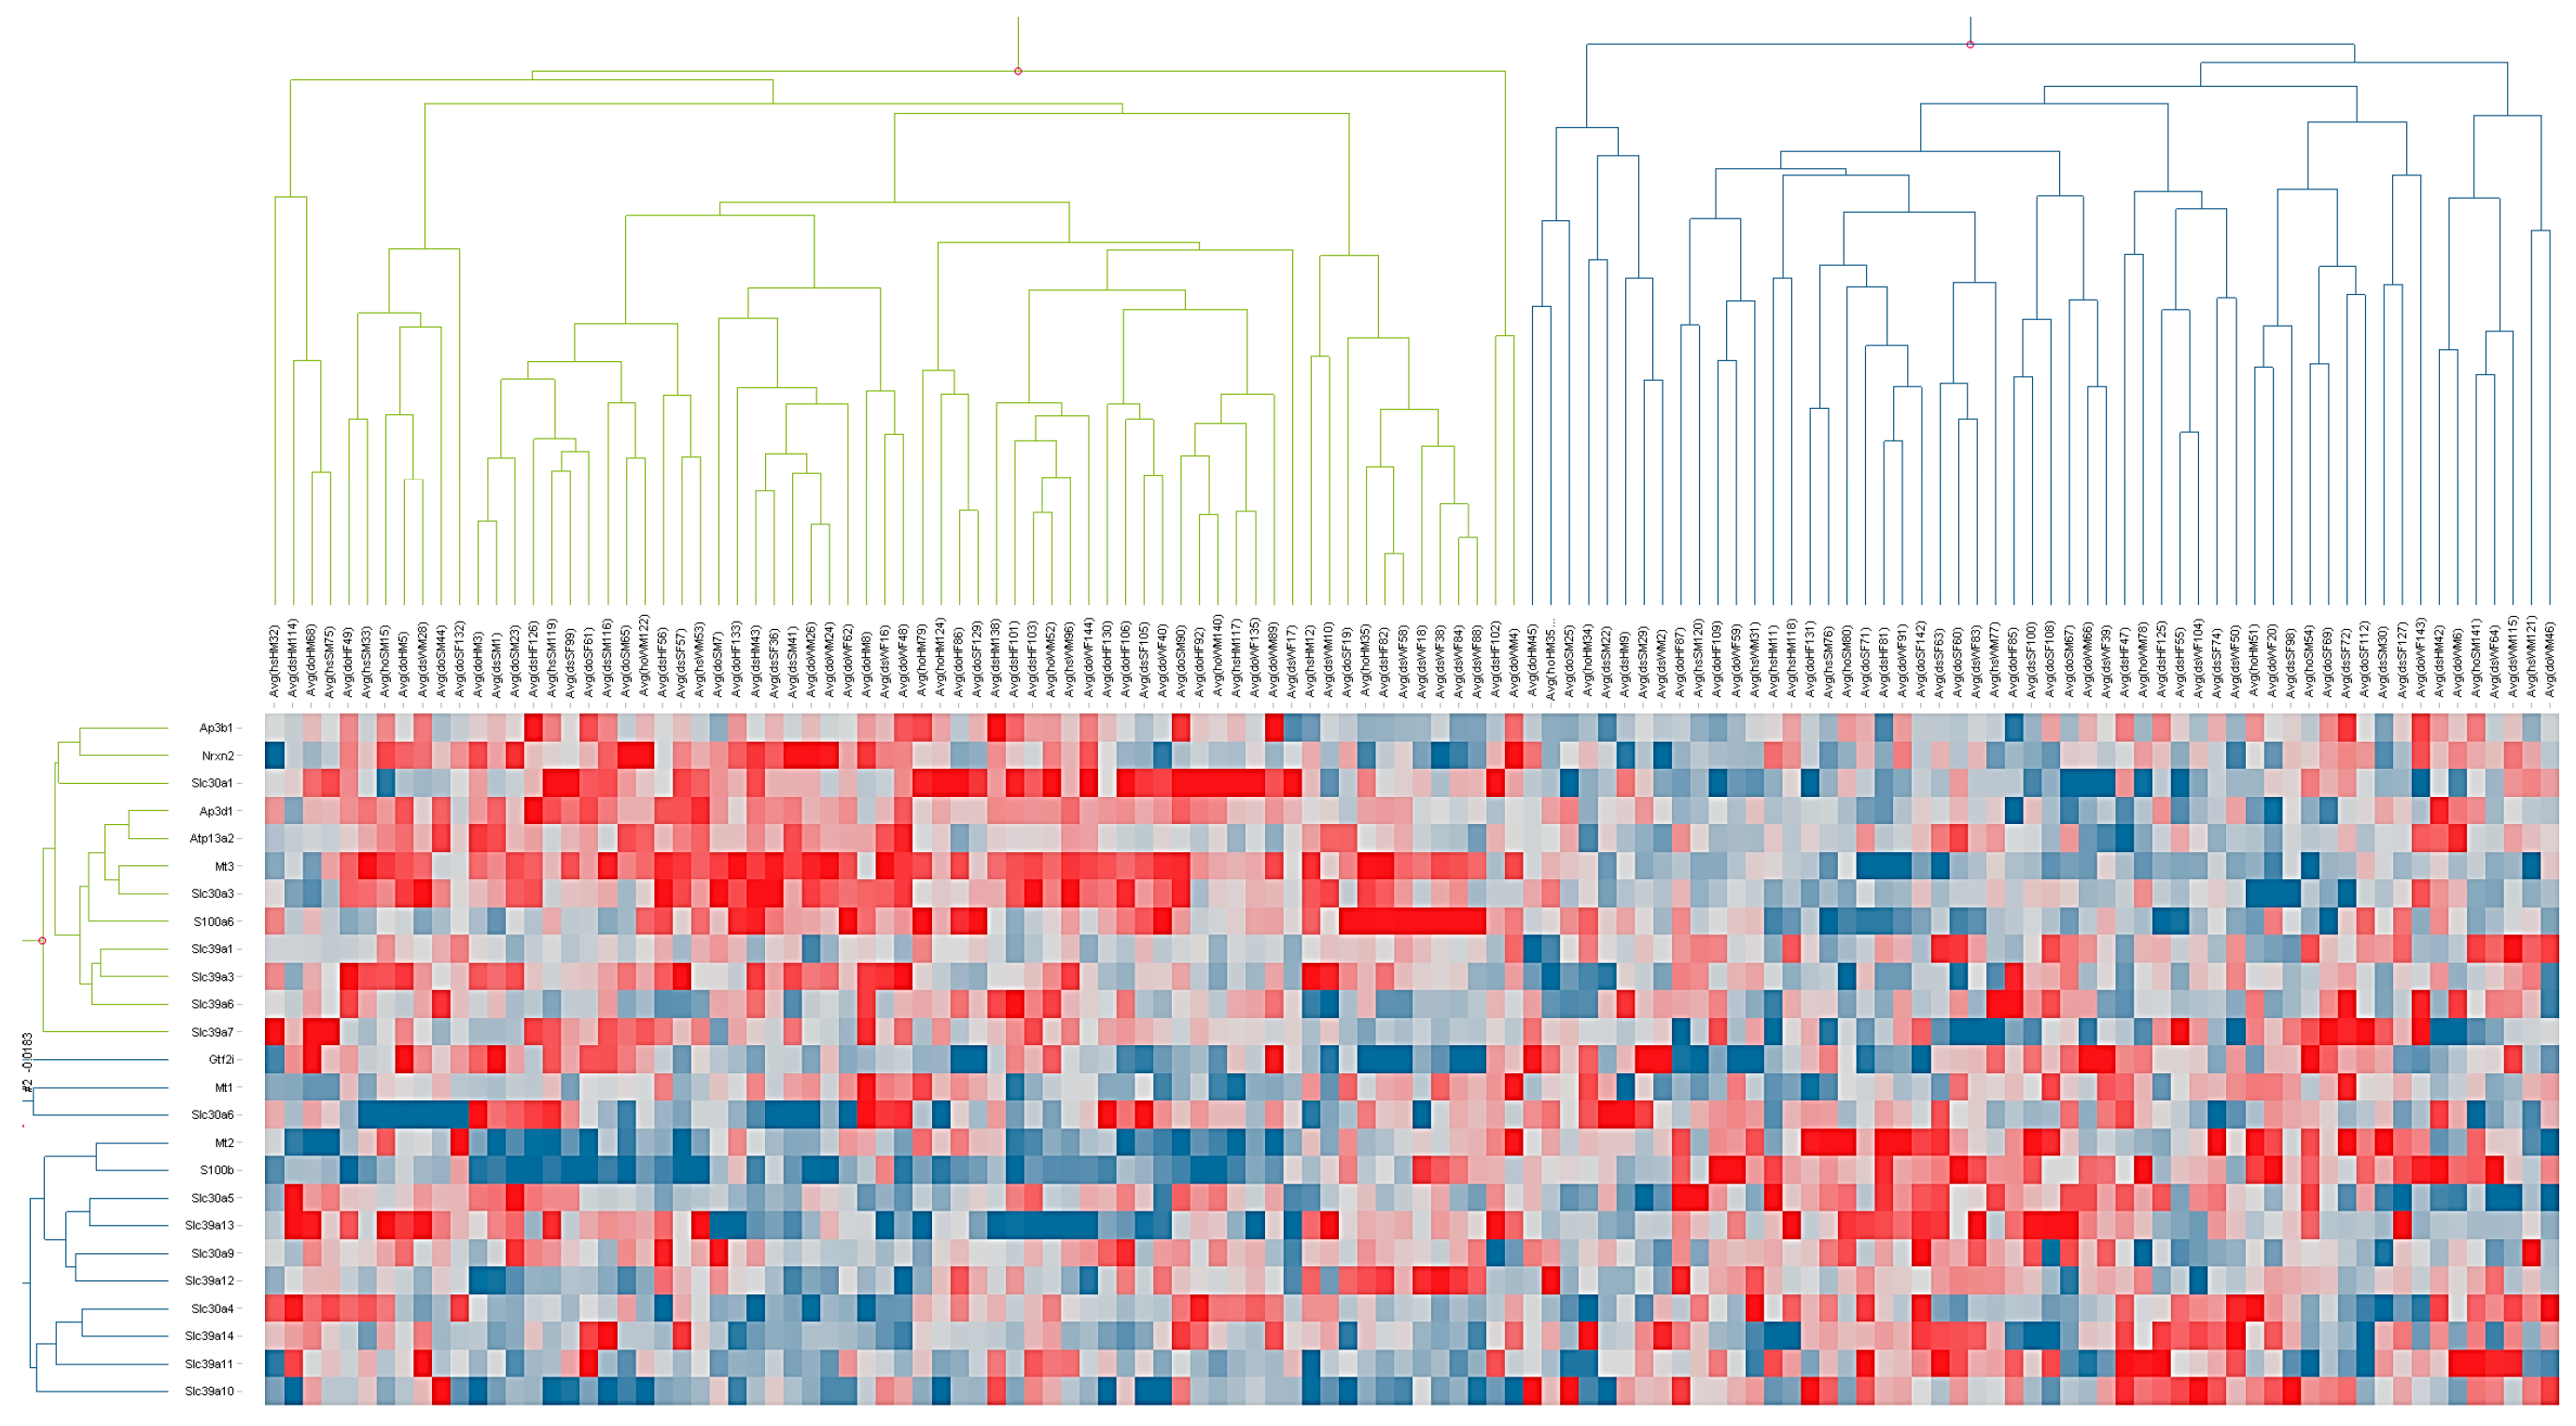
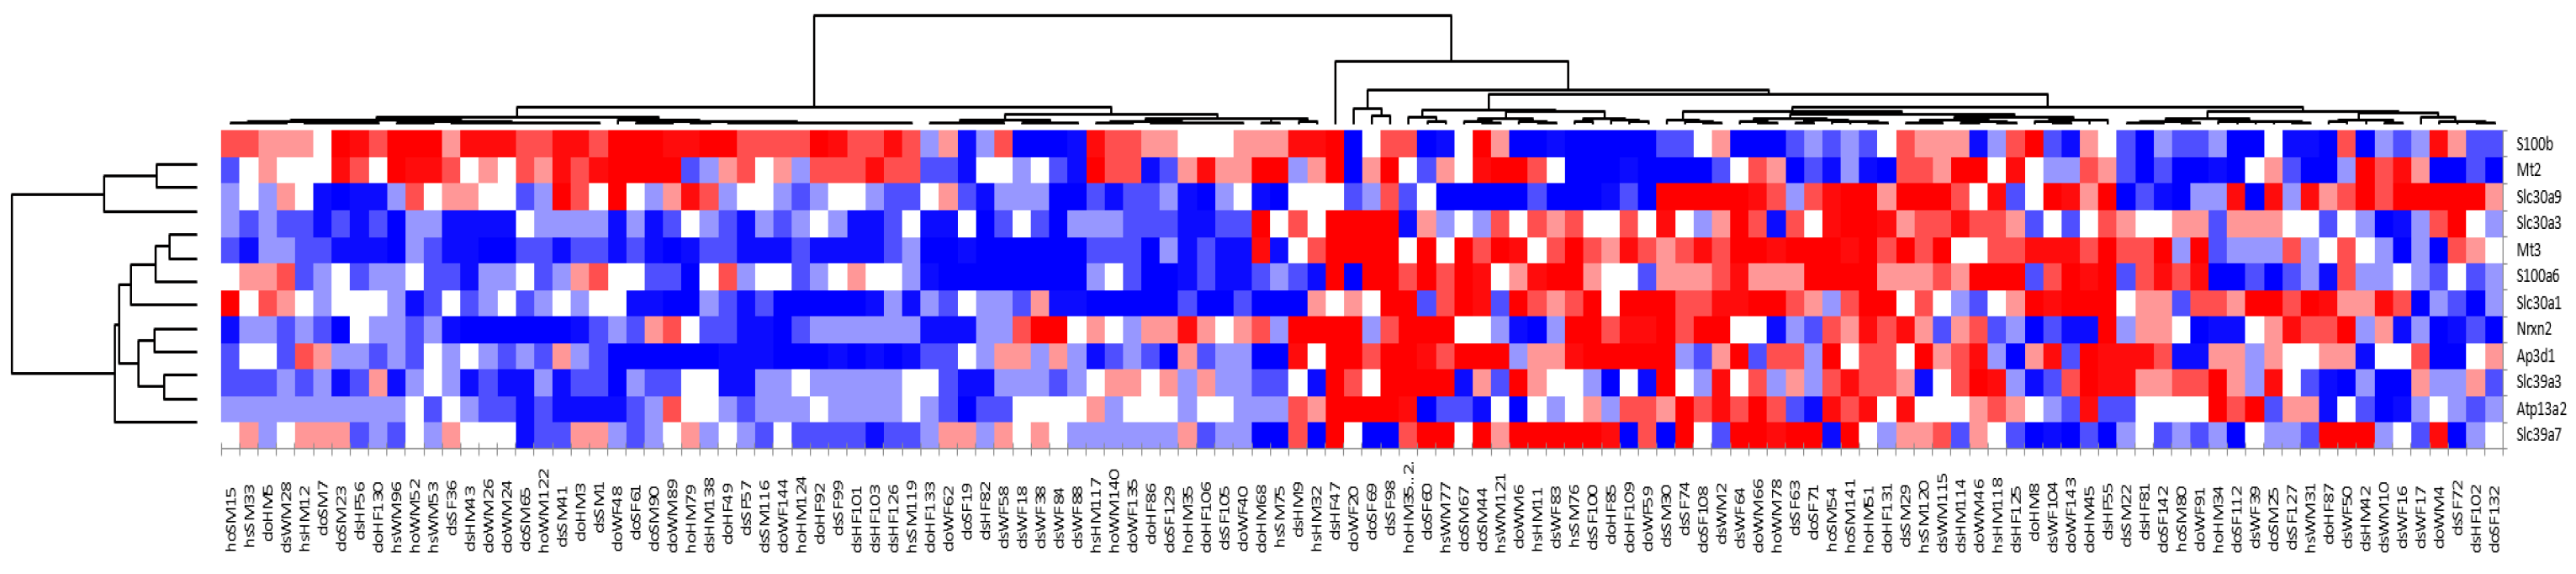
The microarray data demonstrate that, among a group of littermate-matched mice, approximately half the population (Group A) had statistically significant upregulation of Mt2 and S100b, while the other half of the population (Group B) had statistically significant upregulation of Mt3 and a number of known zinc transporters (S100a6, Slc30a1, Slc39a7, Slc30a3, Slc39a3, and Ap3d1), as well as Nrx2 and Atp13a2. The fact that Mt2 was highly expressed in Group A while Mt3 was highly expressed in Group B indicates that these two genes are regulated differently. Furthermore, the observation that Mt3 was upregulated along with a number of other zinc transporters suggests that this protein has a role in zinc homeostasis in the brain.
Of particular note is the differential pattern of coexpression of members of the S100 family. S100b, which was upregulated together with Mt2, expresses a calcium- and zinc-binding protein involved in immune responses. S100a6, which is upregulated with Mt3, expressed a calcium- and zinc-binding protein that has been associated with misregulation of zinc levels in several neurodegenerative diseases [33]. S100a6 is overexpressed in mouse models of amyotrophic lateral sclerosis (ALS) and Alzheimer’s disease and is speculated to contribute to disease progression via its high affinity for zinc [34]. It has also been associated with cell proliferation and neuronal degeneration, processes with which MT3 is also associated [35,36,37,38]. Other researchers have noted that S100b and S100A6 are differentially expressed in human cortical tissue and have speculated that despite being members of the same family of enzymes they play different neurochemical roles [38]. S100b has been linked to neuronal growth, including the formation of neurite extension [38], while S100a6 has been associated with cytoskeletal dynamics (as has MT3 [7,8]) [39]. S100a6 is known to be upregulated under conditions of oxidative stress [39]. S100b has been associated with the protective effects of nutritional zinc against methyl mercury exposure [40], as well as linked to MT2 expression in bipolar mood disorder [41]. Additional studies are underway in our laboratories to further explore the molecular mechanisms that link this differential expression of MT2/S100b and MT3/S100A6.
There are a few factors that have been reported to affect MT3 expression. These include lithium (downregulation), age (upregulation) and hypoxia (upregulation), but in each case, the molecular mechanism for this regulation is not understood. Lithium was shown to decrease MT3 expression in mice that were given lithium chloride [15]. Our cell culture results, however, showed essentially no effect of lithium on MT3 levels. The antidepressant eugenol has also been shown to induce Mt3 expression in the hippocampus of mice while having no effect on Mt1 levels [42]. Both of these experiments further suggest that MT3 may play a role in aspects of brain chemistry not normally associated with metallothionein function and also point to regulation of MT3 by a non-MRE pathway.
MT3 levels increase with age [36,43,44,45,46]. In mice brains, Mt3 was found in higher concentrations after 12 weeks of age [43]. In rat brains, a very large increase in Mt3 levels was seen when the rats passed middle age (16 months) [36]. The authors speculate that, because MT3 has more Cu-thionein character, its upregulation could indicate an enhanced role in copper chelation to protect the aging brain from copper redox toxicity. However, it is unclear by what mechanism aging could lead to higher MT3 levels [36].
MT3 also responds to hypoxia [45,46,47]. In one study of hypoxia, MT3 was the gene most sensitive to hypoxia, with 3- and 7-fold increases in expression levels after 10 and 30 min treatments, respectively [45]. In another study, MT3 levels increased by a factor of more than 600 in 60 min upon exposure to hypoxic conditions [46]. MT3 gene expression can also reportedly be substantially induced by hypoxia mimetics (CoCl2, desferrioxamine, dimethyloxalylglycine), which indicates that it is transcriptionally regulated through HIF1 [46]. Hypoxia has been suggestively linked to an imbalance in zinc homeostasis [47]. Also, while other metallothioneins have been shown to respond to hypoxia, in the case of other MTs, activation via the MRE was implicated [48]. Again, in our cell culture experiments, the hypoxia mimic Co2+ showed essentially no effect on either MT2 or MT3 expression levels.
It is challenging to study factors that influence MT3 levels, and our work illustrates this as well. Few established cell lines express MT3 to levels comparable to the levels that have been measured in the brain [31]. In this study, we selected two different neuronal cell lines, both of which were known to have measurable but not extremely high MT3 levels, making it possible to study treatments that might lead to increased (or decreased) gene and protein expression. Even still, the cell culture work does not appear to capture all of the complexity visible in animal models.
Considering that MT3 is in so many respects similar to MT1 and MT2, how can one explain its strikingly different neurochemistry? Part of the answer presumably rests with the small structural differences between MT3 and other MTs [49]. The unique N-terminal sequence of MT3 is required for the growth inhibitory activity of MT3 in the neural system [50]. It has also been shown to be responsible for Cd2+-induced death of the proximal tubule cell [50]. These amino acids have also been shown to be responsible for zinc-specific MT3 binding to actin [7]. Protein–protein interactions, modulated by MT3’s unique structure, may be critical to many of MT3’s neurochemical functions [9,49]. The 3D structure of metallothionein is determined by metal binding. Thioneins are unstructured and unfolded in the absence of metal ions and then fold into bilobal proteins upon binding seven divalent metal ions [51,52]. Suprametalation has been suggested to cause the protein to rearrange to form a single, more globular structure [53]. Apo-MT2 and apo-MT3 in solution have practically identical structures with low helical content [54], supporting the common notion that apo-metallothioneins exhibit little or no secondary structure [55]. In the presence of metals, however, metallothioneins fold into varied structures. Metallothioneins bind divalent metals such as Zn2+ and Cd2+ in tetrahedrally coordinated M3S9 and M4S11 binding clusters, separated with sections of random coil. These structures are characterized by circular dichroism spectra that show a positive peak at 240 nm [56].
We and others have speculated that some of the neurotoxic effects of lead exposure might be mediated by differences in metallothionein structure when bound to lead vs. zinc [12,57,58]. Zinc prefers a coordination number of four, corroborated by its tetrahedral coordination with thiol sites [56]. In contrast to the coordination chemistry of Zn2+, that of Pb2+ is much more complex and varied [59,60]. Recent evidence indicates few four-coordinate Pb(II) complexes; they are either three-coordinate or five-coordinate [31]. Possibly, lead’s (potentially) stereochemically active lone pair plays a role in determining its geometric preferences [30,32]. He et al. speculate that lead forms a trigonal pyramidal coordination when bound to MT2 with three sulfurs and electron donating oxygens (Pb–S3O) [57]. The known differences in metal binding preferences between MT3 and other metallothioneins, including the presence of an 8th metal binding site in MT2, is likely to effect the overall structure of metal-replete MT3 [54,61,62]. Work is ongoing to determine if these structural differences lead to functional differences in the way that MT3 interacts with partner proteins [9].
Part of the answer also presumably lies with the differential expression of MT3. This work confirms the differential expression of MT3 but does not elucidate what the molecular mechanism is by which it is regulated. Additional work in our labs is also underway to test hypotheses associated with regulatory pathways for MT3.

4. Materials and Methods

4.1. Materials

Metal salts used in this work include: lead acetate (99–103%, Thermo Fisher Scientific, Waltham, MA, USA), zinc sulfate monohydrate (99%, Strem Chemicals, Newburyport, MA, USA), cobalt (II) chloride hexahydrate (98.0–102.0%, Sigma Aldrich, St. Louis, MO, USA), and lithium sulfate monohydrate (99%, Sigma Aldrich).
An ÄKTA Pure 25 L FPLC (GE Healthcare, Pittsburgh, PA, USA) was used for protein purification, and a Forma Anaerobic System 1025 (Thermo Forma, Marietta, OH, USA) was used for anaerobic protein manipulations. Low-speed centrifugation was done with an Allegra X-30R benchtop centrifuge (Beckman Coulter, Indianapolis, IN, USA) and higher speed centrifugation above 10,000 rpm was done with an Avanti J-265 XPI superspeed centrifuge (Beckman Coulter). Sonication was done with a Vibra-Cell VC 505 Ultrasonic Liquid Processor (Sonics & Materials, Inc., Newtown, CT, USA), and lyophilization was done on a FreeZone 2.5 Liter Benchtop Freeze Dry System (Labconco, Kansas City, MO, USA). UV-Vis spectra were taken on a Varian Cary 50 UV-Vis spectrometer (Agilent Technologies, Santa Clara, CA USA).
MES, MOPS, and bis-Tris buffers were purchased in highest purity from Sigma Aldrich (St. Louis, MO, USA), as were metal salts, dithiothreitol (DTT), and 5,5′-dithiobis-(2-nitrobenzoi acid) (DTNB). Tris(2-carboxyethyl)phosphine hydrochloride (TCEP-HCl) was purchased from Thermo Fisher Scientific (Waltham, MA, USA). Thrombin from bovine plasma was obtained from GE Healthcare Life Sciences (Pittsburgh, PA, USA). GSTrap FF columns, HiTrap desalting columns, and a HiLoad 26/600 75 pg size exclusion column were also purchased from GE Healthcare Life Sciences (Pittsburgh, PA, USA). All buffers were prepared with milli-Q (18.2 MΩ·cm) water, filtered through 0.22 μm filter unit, and degassed under vacuum until no air bubbles were seen. Metal stock solutions were prepared using the appropriate mass of metal salt and then diluted with oxygen-free buffers in the anaerobic chamber.

4.2. Animal Studies Ethics Statement and Animal Use

All animal care and testing protocols were approved by the Institutional Animal Care and Use Committee at Columbia University, animal welfare assurance # A3007-01 (31 July 2013).
C57BL/6 mice were purchased from Jackson Laboratories (Bar Harbor, ME, USA) and bred to establish colonies at the Columbia University animal facility (New York City, NY, USA). All mice were group-housed according to institutional guidelines, with water and a commercial mouse diet available ad libitum. Gene expression analysis was performed on age- and sex-matched mice (8- to 12-week-old; 61 females, 63 males).

4.3. Tissue Preparation

The dentate gyrus (DG) was dissected from adult mice hippocampi under a stereomicroscope using an established method [63]. Brains were collected from deeply anesthetized mice and placed into ice-cold phosphate-buffered saline (PBS). After exposing the medial side of the brain, the DG was isolated and retrieved using forceps. DG tissue was placed directly into cryovials containing RNAlater and kept at 4 °C overnight. The following day, RNAlater was removed, and samples were frozen at −80 °C until further use.

4.4. RNA Extraction, Amplification, and Gene Expression Microarray Experiments

Before tissue homogenization, all surfaces and instruments were wiped clean with an Ambion RNaseZap RNase decontamination solution (Thermo Fisher Scientific). RNA was extracted from DG tissue according to RNeasy Mini Kit instructions (Qiagen, Germantown, MD, USA). DG tissues of individual mice were homogenized using a Powergen 700 homogenizer (Thermo Fisher Scientific) in the kit lysis buffer. Samples were quantified spectrophotometrically using a NanoDrop 2000 (Thermo Fisher Scientific) and further analyzed using a 2100 Bioanalyzer (Agilent Technologies).
10 ng of the extracted RNA were amplified using an Ambion MessageAmp II aRNA Amplification Kit in vitro transcription protocol following the manufacturer instructions (Thermo Fisher Scientific). The resulting aRNA was purified using an Ambion MEGAclear Transcription Clean-Up Kit (Thermo Fisher Scientific), and 2.5 µg of aRNA from each sample were labeled with AlexaFluor647 or AlexaFluor536 using RNA alkylation with monoreactive cisplatin dye complexes from an Invitrogen ULYSIS Nucleic Acid Labeling Kits (Molecular Probes, Thermo Fisher Scientific). To correct for dye-related sensitivity bias in the downstream detection of hybridization signals, the dye selection was balanced between the sample groups across the experiment. Using spectroscopic measurements of the labeled probes, labeling efficiencies were estimated as 0.5–1.5% of the dye with respect to RNA bases. The labeled aRNA samples were hybridized to SurePrint G3 Mouse GE 8x60K Microarray Kit (Agilent) following the manufacturer instructions. After hybridization, the microarray slides were scanned on the two channels using Agilent C scanner (Agilent), and the image segmentation, gridding, and feature extraction were performed using the onboard Scan Control software (v.8.5.1).

4.5. Analysis of Microarray Data

The raw hybridization signal intensities were normalized within the arrays by Agilent software following global normalization using the loess function from the Bioconductor package affy (v.1.42.3) [64,65]. Background filtering was performed on Agilent’s “Well Above Background” flag function using score modulation between the relevant groups of the samples. For a gene to be scored as present, the gene expression signals must be flagged “Well Above Background” in more than 50% of samples within a group. Gene function assignments were done using Gene Ontology (AmiGO, v.2.4.26) [66]. The resulting data were imported into the Spotfire (v.7.6.1) for Functional Genomics Suite (TIBCO, New York City, NY, USA) for data visualization and further review using PCA and hierarchical clustering. Analysis of differential gene expression was performed using a t-test followed by Benjamini-Hochberg multiple testing correction [67]. Differentially expressed genes for functional enrichment surveys were selected at FDR < 0.05 and fold change of 1.3. Functional enrichment analysis in differentially expressed genes was carried out with DAVID (v.6.8) [68].

4.6. General Cell Culture and Metal Treatment

Human neuroblastoma cell lines, BE(2)C and SH-SY5Y (ATCC), were cultured in 1X Dulbecco’s Modified Eagle Media (DMEM) with 4.5 g/L glucose and l-glutamine without sodium pyruvate (Corning Inc., Corning, NY, USA), supplemented with 10% fetal bovine serum (FBS, Thermo Fisher Scientific) using standard mammalian cell culture procedures. Cells were maintained at 37 °C and 5% CO2 in a humidified incubator.
One day prior to metal treatment, BE(2)C and SH-SY5Y cells were seeded at 400,000 BE(2)C cells or 450,000 SH-SY5Y cells per well onto tissue culture treated 6-well plates (2 mL media per well). At designated treatment times, the cell culture media was replaced with 2 mL of fresh DMEM with 10% FBS and 100 mM metal solutions of lead acetate, zinc sulfate, cobalt chloride, or lithium sulfate were added to the media to a final concentration of 100 µM metal ion.

4.7. Total RNA Extraction, cDNA Synthesis, and qPCR

Prior to RNA extraction, metal containing media was aspirated from the cells and the cells were washed with PBS. Total RNA was extracted using the PureLinkTM RNA Mini Kit (Invitrogen) according to manufacturer’s instructions for monolayer cells. The quantity and relative purity of the total RNA was measured by UV-Vis spectroscopy on a Nanodrop 2000 spectrophotometer using the absorbance at 260 nm and the 260/280 nm ratio, respectively. All RNA were stored at −80 °C until further use.
Total cellular messenger RNA were reverse transcribed using the First Strand cDNA Synthesis (Quick Protocol, New England BioLabs, Ipswich, MA, USA). Within each trial, total RNA used for reverse transcription were maximized and standardized within the range of 200–1000 ng of RNA. To amplify only the mRNA transcripts, an anchored poly-DT primer (5 mg/mL, IDT DNA) was used. Complementary DNA (cDNA) synthesis was performed in a thermocycler (Bio-Rad, Hercules, CA, USA) according to the following protocol: 42 °C for 60 min, 80 °C for 10 min. The extracted cDNA was incubated at 4 °C for immediate use and stored at −20 °C for future use.
Real time quantitative PCR (qPCR) was performed using PowerUP SYBR Green Master Mix (Thermo Fisher Scientific) according to the manufacturer’s protocol for a 20 µL reaction using 2 µL of the cDNA product as the PCR template. MT3, MT2, and the housekeeping gene HSP90AB1 were quantified (in triplicate) for each metal treatment condition as well as the non-treatment control. The primers used for quantitative PCR amplification of MT2, MT3, and HSP90AB1 cDNA are listed in Table 5. A LightCycler 480 instrument (Roche Molecular Diagnostics, Pleasanton, CA, USA) was used for qPCR amplification and monitoring, according to the PowerUp SYBR Green Master Mix thermal cycling protocol guidelines. Based on the primers used, the annealing temperature for the qPCR was set at 58 °C. qPCR data was analyzed using the ΔΔCP method [69]. The presence of MT3 in the cell lines was confirmed by western blot analysis and by SDS-PAGE gels with purified Mt3 as a control.

4.8. Protein Purification

Recombinant mouse Zn7-Mt3 was purified by following a modified protocol from our previous study [12,70,71]. Cells were induced at OD600 ~ 0.7 by adding 1 mM isopropyl β-d-1-thiogalactopyranoside (IPTG). After incubation at room temperature and 250 rpm for 1 h, ZnCl2 was added to a final concentration of 0.5 mM, and the cultures were incubated at 37 °C and 250 rpm for 16–18 h.
Cells were thawed, separated into approximately 15 g portions, and each portion was suspended in a solution of 1.248 g sucrose in 15 mL PBS (140 mM NaCl, 2.7 mM KCl 10 mM Na2HPO4, 1.8 mM KH2PO4). Argon was bubbled through the mixture before centrifuging at 8000× g for 30 min at 4 °C and collecting the pellets. To a suspension of the pellet in 15 mL PBS, 5.7 mM β-mercaptoethanol (BME) was added. After bubbling with argon, the suspension was centrifuged at 8000× g for 30 min at 4 °C. The pellets were collected and resuspended in PBS to a total volume of 15 mL. Just before sonicating the solution for 7 min, with 10 s rest every 5 s, 1 mM DTT and 0.1 mM phenylmetylsulfonyl fluoride (PMSF) were added. The lysed cells were then centrifuged at 8000× g for 30 min at 4 °C. The supernatant was collected and centrifuged at 35,000 rpm for 30 min to remove any particulate matter. A Bradford standard assay using bovine serum albumin (BSA) was used to determine the protein concentration of the cell lysate.
Using previously published protocols, GST-tagged Mt3 protein was separated via GSTrap FF columns and cleaved using bovine plasma thrombin [12]. Mt3 was isolated via HiLoad 26/600 75 pg size exclusion column. Mt3 concentration was determined by measuring the absorbance of the samples in 1 mM HCl at 220 nm and calculating using an extinction coefficient of 53,000 M−1·cm−1 [62]. The presence of Mt3 was confirmed by SDS-PAGE on a 15% polyacrylamide gel, either with silver or Coomassie staining and florescence imaging on bromobimane-modified MT3 samples [72].
Mt3 was concentrated and buffer-exchanged into Milli Q water using 3 kDa Amicon centrifugal filter units. The concentrate was lyophilized overnight, and reconstituted in Tris-HClO4 buffer to maintain the pH at 7.0. Mt3 concentration was determined both by using a DTNB assay measuring the concentration of free thiols (20 free thiols per protein) and by measuring the absorbance at 220 nm in 1 mM HCl as described above.

Supplementary Materials

Supplementary materials can be found at www.mdpi.com/1422-0067/18/6/1133/s1.

Acknowledgments

Amen Wiqas acknowledges the Beckman Foundation for a Beckman Scholars Award. Rachel Narehood Austin acknowledges the National Science Foundation for funding (CHE-1151957), and Mary Sever acknowledges Barnard College for a Presidential Research Award. We thank Òscar Palacios and Mercè Capdevila for the gift of the MT3 expression vector and for helpful conversations.

Author Contributions

Jamie Bousleiman and Alexa Pinsky carried out the cell culture work and associated data analysis and contributed to writing the paper. Sohee Ki and Angela Su did protein purification, discussed results, and contributed to writing the paper. Irina Morozova, Sergey Kalachikov, and Rae Silver designed and carried out the microarray experiment and analysis and contributed to writing the paper. Amen Wiqas contributed to analyzing the microarray data for this manuscript. Mary Sever designed the cell culture experiments, oversaw all the cell culture work and data analysis and contributed to writing the paper. Rachel Narehood Austin oversaw protein purification, discussed all aspects of the work with all co-authors, and contributed to writing the paper.

Conflicts of Interest

The authors declare no conflict of interest.

Abbreviations

BME2-Mercaptoethanol
BSABovine serum albumin
DGDentate gyrus
DMEMDulbecco’s modified eagle medium
DTNB5,5′-Dithiobis-(2-nitrobenzoi acid)
DTTDithiothreitol
FDRFalse discovery rate
FPLCFast protein liquid chromatography
GSTGlutathione S-transferase
MES2-(N-morpholino)ethanesulfonic acid
MOPS3-(N-morpholino)propanesulfonic acid
MREMetal regulatory element
MT2Human metallothionein-2 protein
MT2Human metallothionein-2 gene
MT3Human metallothionein-3 protein
MT3Human metallothionein-3 gene
Mt2Mouse metallothionein-2 protein
Mt2Mouse metallothionein-2 gene
Mt3Mouse metallothionein-3 protein
Mt3Mouse metallothionein-3 gene
MTF1Metal transcription factor 1
PBSPhosphate buffer saline
PCAPrincipal component analysis
PMSFPhenylmethylsulfonyl fluoride
qPCRQuantitative polymerase chain reaction
SDS-PAGESodium dodecyl sulfate polyacrylamide gel electrophoresis
TCEP-HClTris(2-carboxyethyl)phosphine hydrochloride

References

  1. Masters, B.A.; Quaife, C.J.; Erickson, J.C.; Kelly, E.J.; Froelick, G.J.; Zambrowicz, B.P.; Brinster, R.L.; Palmiter, R.D. Metallothionein III is expressed in neurons that sequester zinc in synaptic vesicles. J. Neurosci. 1994, 14, 5844–5857. [Google Scholar] [PubMed]
  2. Babula, P.; Masarik, M.; Adam, V.; Eckschlager, T.; Stiborova, M.; Trnkova, L.; Skutkova, H.; Provaznik, I.; Hubalekadi, J.; Kizek, R. Mammalian metallothioneins: Properties and functions. Metallomics 2012, 4, 739–750. [Google Scholar] [CrossRef] [PubMed]
  3. Günther, V.; Lindert, U.; Schaffner, W. The taste of heavy metals: Gene regulation by MTF-1. Biochim. Biophys. Acta 2012, 1823, 1416–1425. [Google Scholar] [CrossRef] [PubMed]
  4. Uchida, Y.; Takio, K.; Titani, K.; Ihara, Y.; Tomonaga, M. The growth inhibitory factor that is deficient in the Alzheimer’s disease brain is a 68 amino acid metallothionein-like protein. Neuron 1991, 7, 337–347. [Google Scholar] [CrossRef]
  5. Naruse, S.; Igarashi, S.-I.; Furuya, T.; Kobayashi, H.; Miyatake, T.; Tsuji, S. Structures of the human and mouse growth inhibitory factor-encoding genes. Gene 1994, 144, 283–287. [Google Scholar] [PubMed]
  6. Howells, C.; West, A.K.; Chung, R.S. Neuronal growth-inhibitory factor (metallothionein-3): Evaluation of the biological function of growth-inhibitory factor in the injured and neurodegenerative brain. FEBS J. 2010, 277, 2931–2939. [Google Scholar] [CrossRef] [PubMed]
  7. Lee, S.-J.; Cho, K.-S.; Kim, H.N.; Kim, H.-J.; Koh, J.-Y. Role of zinc metallothionein-3 (ZnMt3) in epidermal growth factor (EGF)-induced c-Abl protein activation and actin polymerization in cultured astrocytes. J. Biol. Chem. 2011, 286, 40847–40856. [Google Scholar] [CrossRef] [PubMed]
  8. Lee, S.-J.; Seo, B.-R.; Koh, J.-Y. Metallothionein-3 modulates the amyloid β endocytosis of astrocytes through its effects on actin polymerization. Mol. Brain 2015, 8, 84–96. [Google Scholar] [CrossRef] [PubMed]
  9. El Ghazi, I.; Martin, B.L.; Armitage, I.M. Metallothionein-3 is a component of a multiprotein complex in the mouse brain. Exp. Biol. Med. 2006, 23, 1500–1506. [Google Scholar] [CrossRef]
  10. Lippard, S.J. The inorganic side of chemical biology. Nat. Chem. Biol. 2006, 2, 504–507. [Google Scholar] [CrossRef] [PubMed]
  11. Dodani, S.C.; Firl, A.; Chan, J.; Nam, C.I.; Aron, A.T.; Onak, C.S.; Ramos-Torres, K.M.; Paek, J.; Webster, C.M.; Feller, M.B.; et al. Copper is an endogenous modulator of neural circuit spontaneous activity. Proc. Nat. Acad. Sci. USA 2014, 111, 16280–16285. [Google Scholar] [CrossRef] [PubMed]
  12. Carpenter, M.C.; Shami Shah, A.; DeSilva, S.; Gleaton, A.; Su, A.; Goundie, B.; Croteau, M.; Stevenson, M.; Wilcox, D.E.; Austin, R.N. Thermodynamics of Pb(II) and Zn(II) binding to MT-3, a neurologically important metallothionein. Metallomics 2016, 8, 605–617. [Google Scholar] [CrossRef] [PubMed]
  13. Ordemann, J.M.; Austin, R.N. Lead neurotoxicity: Exploring the potential impact of lead substitution in zinc-finger proteins on metal health. Metallomics 2016, 8, 579–588. [Google Scholar] [CrossRef] [PubMed]
  14. Reuben, A.; Caspi, A.; Belsky, D.W.; Broadbent, J.; Harrington, H.; Sugden, K.; Houts, R.M.; Ramrakha, S.; Poulton, R.; Moffitt, T.E. Association of childhood blood lead levels with cognituve function and socioeconomic status at age 38 years and with IQ change and socioeconomic mobility between childhood and adulthood. JAMA 2017, 317, 1244–1251. [Google Scholar] [CrossRef] [PubMed]
  15. Chetcuti, A.; Adams, L.J.; Mitchell, P.B.; Schofield, P.R. Microarray gene expression profiling of mouse brain mRNA in a model of lithium treatment. Psychiatr. Genet. 2008, 18, 64–72. [Google Scholar] [CrossRef] [PubMed]
  16. Lago, N.; Quintana, A.; Carrasco, J.; Giralt, M.; Hidalgo, J.; Molinero, A. Absence of metallothionein-3 produces changes on MT-1/2 regulation in basal conditions and alters hypothalamic-pituitary–adrenal (HPA) axis. Neurochem. Int. 2014, 74, 65–73. [Google Scholar] [CrossRef] [PubMed]
  17. Kramer, K.K.; Liu, J.; Choudhuri, S.; Klaassen, C.D. Induction of metallothionein mRNA and protein in murine astrocyte cultures. Toxicol. Appl. Pharmacol. 1996, 136, 94–100. [Google Scholar] [CrossRef] [PubMed]
  18. Zheng, H.; Berman, N.E.J.; Klassen, C.D. Chemical modulation of metallothionein I and III mRNA in mouse brain. Neurochem. Int. 1995, 27, 43–58. [Google Scholar] [CrossRef]
  19. Oz, G.; Zangger, K.; Armitage, I.M. Three-dimensional structure and dynamics of a brain specific growth inhibitory factor: Metallothionein-3. Biochemistry 2001, 40, 11433–11441. [Google Scholar] [CrossRef] [PubMed]
  20. Vallee, B.L. Implications and Inferences of Metallothionein Structure. In Metallothionein II: Proceedings of the Second International Meeting on Metallothionein and Other Low Molecular Weight Metal-Binding Proteins; Kagi, J.H.R., Kojima, Y., Eds.; Springer: Zurich, Switzerland, 1987; pp. 5–16. [Google Scholar]
  21. Inoue, K.-I.; Takano, H.; Shimada, A.; Satah, M. Metallothionein as an anti-inflammatory mediator. Mediat. Inflamm. 2009, 2009, 101659. [Google Scholar] [CrossRef] [PubMed]
  22. Palmiter, R.D. Molecular biology of metallothionein gene expression. In Metallothionein II: Proceedings of the Second International Meeting on Metallothionein and Other Low Molecular Weight Metal-Binding Proteins; Kagi, J.H.R., Kojima, Y., Eds.; Springer: Zurich, Switzerland, 1987; pp. 63–80. [Google Scholar]
  23. Zhang, B.; Georgiev, O.; Hagmann, M.; Günes, Ç.; Cramer, M.; Faller, P.; Vasák, M.; Schaffner, W. Activity of metal-responsive transcription factor 1 by toxic heavy metals and H2O2 in vitro is modulated by metallothionein. Mol. Cell. Biol. 2003, 12, 8471–8485. [Google Scholar] [CrossRef]
  24. Yu, J.; Fujishiro, H.; Miyataka, H.; Moyama, T.M.; Hasegawa, T.; Seko, Y.; Miura, N.; Himeno, S. Dichotomous effects of lead acetate on the expression of metallothionein in the liver and kidney of mice. Biol. Pharm. Bull. 2009, 32, 1037–1042. [Google Scholar] [CrossRef] [PubMed]
  25. Nascimento, C.R.B.; Risso, W.E.; Bueno dos Reis Martinez, C. Lead accumulation and metallothionein content in female rates of different ages and generations after daily intake of Pb-contaminated food. Environ. Toxicol. Pharmacol. 2016, 48, 272–277. [Google Scholar] [CrossRef] [PubMed]
  26. Maitani, T.; Watahiki, A.; Suzuki, K.T. Induction of metallothionein after lead administration by three injection routes in mice. Toxicol. Appl. Pharmacol. 1986, 83, 211–217. [Google Scholar] [CrossRef]
  27. Peterson, S.M.; Jun, Z.; Weber, G.; Freeman, J.L. global gene expression analysis reveals dynamic and developmental stage-dependent enrichment of lead-induced neurological gene alterations. Environ. Health Persp. 2011, 119, 615–621. [Google Scholar] [CrossRef] [PubMed]
  28. Vignesh, K.S.; Figueroa, J.A.L.; Porollo, A.; Divanovic, S.; Caruso, J.A.; Deepe, G.S.J. IL-4 induces metallothionein 3- and SLC30A4-dependent increase in intracellular Zn2+ that promotes pathogen persistence in macrophages. Cell Rep. 2016, 16, 3232–3246. [Google Scholar]
  29. Amantana, A.; Vorachek, W.R.; Butler, J.A.; Ream, W.; Whanger, P.D. Identification of putative transcription factor binding sites in rodent selenoprotein W promoter. J. Inorg. Biochem. 2004, 98, 1513–1520. [Google Scholar] [CrossRef] [PubMed]
  30. Amantana, A.; Vorachek, W.R.; Butler, J.A.; Costa, N.D.; Whanger, P.D. Effect of copper, zinc and cadmium on the promoter of selenorprotein W in glial and myoblast cells. J. Inorg. Biochem. 2002, 91, 356–362. [Google Scholar] [CrossRef]
  31. Faraonio, R.; Moffatt, P.; LaRochelle, O.; Schipper, H.M.; S-Arnaud, R.; Séguin, C. Characterization of cis-acting elements in the promoter of the mouse metallothionein-3 gene. Eur. J. Biochem. 2000, 267, 1743–1753. [Google Scholar] [CrossRef] [PubMed]
  32. Bartkowska, K.; Swiatek, I.; Aniszewska, A.; Jurewicz, E.; Turlejski, K.; Filipek, A.; Djavadian, R.L. Stress-dependent changes in the CacyBP/SIP interacting protein S100A6 in the mouse brain. PLoS ONE 2017, 12, e0169760. [Google Scholar] [CrossRef] [PubMed]
  33. Boom, A.; Pochet, R.; Authelet, M.; Pradier, L.; Borghgraef, P.; Leuven, F.V.; Heizmann, C.W.; Brion, J.-P. Astrocytic calcium/zinc binding protein S100A6 over expression in Alzheimer’s disease and in PS1/APP transgenic mice models. Biochem. Biophys. Acta 2004, 1741, 161–168. [Google Scholar] [CrossRef] [PubMed]
  34. Yamada, J.; Jinno, S. S100A6 (calcyclin) is a novel marker of neural stem cells and astrocyte precursors in the subgranular zone of the adult mouse hippocampus. Hippocampus 2014, 24, 89–101. [Google Scholar] [CrossRef] [PubMed]
  35. Carrasco, J.; Penkowa, M.; Giralt, M.; Camats, J.; Molinero, A.; Campbell, I.L.; Palmiter, R.D.; Hidalgo, J. Role of metallothionein-III following central nervous system damage. Neurobiol. Dis. 2003, 13, 22–36. [Google Scholar] [CrossRef]
  36. Adam, P.; Krizkoca, S.; Heger, Z.; Babula, P.; Pekarik, V.; Vaculovicova, M.; Gomes, C.M.; Kizek, R.; Adam, V. Metallothioneins in prion and amyloid-related diseases. J. Alzheimers Dis. 2016, 51, 637–656. [Google Scholar] [CrossRef] [PubMed]
  37. Uchida, Y. Molecular mechanisms of regeneration in Alzheimer’s disease brain. Geriatr. Gerentol. Int. 2010, 10, S158–S168. [Google Scholar] [CrossRef] [PubMed]
  38. Tiu, S.C.; Chan, W.Y.; Heizmann, C.W.; Schafer, B.W.; Shu, S.Y.; Yew, D.T. Differential expression of S100B1 and S100A61 in the human fetal and aged cerebral cortex. Dev. Brain Res. 2000, 119, 159–168. [Google Scholar] [CrossRef]
  39. Lesniak, W.; Slomnicki, L.P.; Filipek, A. S100A6—New facts and features. Biochem. Biophys. Res. Commun. 2009, 390, 1087–1092. [Google Scholar] [CrossRef] [PubMed]
  40. Weng, Z.; Liu, Z.; Zhang, S.; Tao, H.; Ji, X. Zinc protection in fetal rats for maternal mercury exposure-induced growth retardation is probably associated with S100B expression. J. Obstet. Gynaecol. Res. 2017, 43, 73–77. [Google Scholar] [CrossRef] [PubMed]
  41. Seifuddin, F.; Pirooznia, M.; Judy, J.T.; Goes, F.W.; Potash, J.B.; Zandi, P.P. Systematic review of genome-side gene expression studies of bipolar disorder. BMC Psychiatry 2013, 13, 213. [Google Scholar] [CrossRef] [PubMed]
  42. Irie, Y.; Itokazua, N.; Anjikia, N.; Ishige, A.; Wantanabe, K.; Keung, W.M. Eugenol exhibits antidepressant-like activity in mice and induces expression of metallothionein-III in the hippocampus. Brain Res. 2004, 1011, 243–246. [Google Scholar] [CrossRef] [PubMed]
  43. Choudhuri, S.; Liu, W.L.; Berman, N.E.J.; Klassen, C.D. Cadmium accumulation and metallothionein expression in brain of mice at different stages of development. Toxicol. Lett. 1996, 84, 127–133. [Google Scholar] [CrossRef]
  44. Giacconi, R.; Cipriano, C.; Muzzioli, M.; Gasparini, N.; Orlando, F.; Mocchegiani, E. Interrelationships among brain, endocrine and immune response in ageing and successful ageing: Role of metallothionein III isoform. Mech. Ageing Dev. 2003, 124, 371–378. [Google Scholar] [CrossRef]
  45. Zeng, J.; Wang, J.; Gao, W.; Mohammadreza, A.; Kelbauskas, L.; Zhang, W.; Johnson, R.H.; Meldrum, D.R. Quantitative single-cell gene expression measurements of multiple genes in response to hypoxia treatment. Anal. Bioanal. Chem. 2011, 401, 3–13. [Google Scholar] [CrossRef] [PubMed]
  46. Wang, B.; Wood, I.S.; Trayhurn, P. PCR arrays identify metallothionein-3 as a highly hypoxia-inducible gene in human adipocytes. Biochem. Biophys. Res. Commun. 2008, 368, 88–93. [Google Scholar] [CrossRef] [PubMed]
  47. Malairaman, U.; Dandapani, K.; Katyal, A. Effect of Ca2EDTA on the Zinc Mediated inflammation and neuronal apoptosis in hippocampus of an in vivo mouse model of hypobaric hypoxia. PLoS ONE 2014, 9, e110253. [Google Scholar] [CrossRef] [PubMed]
  48. Murphy, B.J.; Andrews, G.K.; Bittel, D.; Discher, D.J.; McCue, J.; Green, C.J.; Yanovsky, M.; Giaccia, A.; Sutherland, R.M.; Laderoute, K.R.; et al. Activation of metallothionein gene expression by hypoxia involves metal respnse elements and metal transcription factor-1. Cancer Res. 1999, 59, 1315–1322. [Google Scholar] [PubMed]
  49. Hasler, D.W.; Jensen, L.T.; Zerbe, O.; Winge, D.T.; Vasak, M. Effect of the two conserved prolines of human growth inhibitory factor (metallothionein-3) on its biological activity and structure fluctuations: Comparison with a mutant protein. Biochemistry 2000, 39, 14567–14575. [Google Scholar] [CrossRef] [PubMed]
  50. Somji, S.; Garrett, S.H.; Sens, M.A.; Sens, D.E. The unique N-terminal sequence of metallothionein-3 is required to regulate the choice between apoptotic or necrotic cell death of human proximal tubule cells exposed to Cd(II). Toxicol. Sci. 2006, 90, 369–376. [Google Scholar] [CrossRef] [PubMed]
  51. Presta, A.; Green, A.R.; Zelazowski, A.J.; Stillman, M.J. Copper binding to rabbit liver metallothionein: Formation of a continuum of copper(I)-thiolate stoichiometry species. Eur. J. Biochem. 1995, 227, 226–240. [Google Scholar] [CrossRef] [PubMed]
  52. Rigby, K.E.; Chan, J.; Mackie, J.; Stillman, M.J. Molecular dynamics study on the folding and metallation of the individual domains of metallothionein. Proteins Struct. Funct. Bioinform. 2006, 62, 159–172. [Google Scholar] [CrossRef] [PubMed]
  53. Sutherland, D.E.K.; Stillman, M.J. The “magic numbers” of metallothionein. Metallomics 2011, 3, 444–463. [Google Scholar] [CrossRef] [PubMed]
  54. Palumaa, P.; Tammiste, I.; Kruusel, K.; Kangur, L.; Jornvall, H.; Sillard, R. Metal binding of metallothionein-3 versus metallothionein-2: Lower affinity and higher plasticity. Biochem. Biophys. Acta 2005, 1747, 205–211. [Google Scholar] [CrossRef] [PubMed]
  55. Irvine, G.W.; Duncan, K.E.R.; Gullons, M.; Stillman, M.J. Metallation kinetics of the human alpha-metallothionein 1a fragment is dependent on the fluxional structure of the apo protein. Chem. Eur. J. 2015, 21, 1269–1279. [Google Scholar] [CrossRef] [PubMed]
  56. Presta, A.; Stillman, M.J. Chiral copper(I)—Thiolate clusters in metallothionein and glutathione. Chirality 1994, 6, 521–530. [Google Scholar] [CrossRef] [PubMed]
  57. He, Y.; Lui, M.; Darabedian, N.; Liang, Y.; Wu, D.; Xiang, J.; Zhou, F. pH-Dependent Coordination of Pb2+ to Metallothionein-2: Structures and Insight into Lead Detoxification. Inorg. Chem. 2014, 53, 2822–2830. [Google Scholar] [CrossRef] [PubMed]
  58. Chu, D.; Tang, Y.; Huan, Y.; He, W.; Cao, W. The microcalorimetry study on the complexation of lead ion with metallothionein. Thermochim. Acta 2000, 352–353, 205–212. [Google Scholar] [CrossRef]
  59. Bridgewater, B.M.; Parkin, G. Lead poisoning and the inactivation of 5-aminolevulinate dehydratase as modeled by the tris(2-mercapto-1-phenylimidazolyl)hydroborato lead complex, {[TmPh]Pb}[ClO4]. J. Am. Chem. Soc. 2000, 122, 7140–7141. [Google Scholar] [CrossRef]
  60. Magyar, J.S.; Weng, T.-C.; Stern, C.M.; Dye, D.F.; Rous, B.W.; Payne, J.D.; Bridgewater, B.M.; Mijovilovish, A.; Parkin, G.; Zaleski, J.M.; et al. Reexamination of Lead(II) coordination preferences in sulfur-rich sites: Implications for a critical mechanism of lead poisoning. J. Am. Chem. Soc. 2005, 127, 9495–9505. [Google Scholar] [CrossRef] [PubMed]
  61. Artells, E.; Palacios, O.; Atrian, S. In vivo-folded metal-metallothionein 3 complexes reveal the Cu-thionein rather than Zn-thionein character of this brain-specific mammalian metallothionein. FEBS J. 2014, 281, 1659–1678. [Google Scholar] [CrossRef] [PubMed]
  62. Meloni, G.; Polanski, T.; Braun, O.; Vasak, M. Effects of Zn(II), Ca(II), and Mg(II) on the structure of Zn7metallothionein-3: Evidence for an additional zinc binding site. Biochemistry 2009, 48, 5700–5707. [Google Scholar] [CrossRef] [PubMed]
  63. Hagihara, H.; Toyama, K.; Yamasaki, N.; Miyakawa, T. Dissection of hippocampal dentate gyrus from adult mouse. J. Vis. Exp. 2009, 33, e1543. [Google Scholar] [CrossRef] [PubMed]
  64. Gentleman, R.C.; Carey, V.J.; Bates, D.M.; Bolstad, B.; Dettling, M.; Dudoit, S.; Ellis, B.; Gautier, L.; Ge, Y.; Gentry, J.; et al. Bioconductor: Open software development for computational biology and bioinformatics. Genome Biol. 2004, 5, R80. [Google Scholar] [CrossRef] [PubMed]
  65. Irizarry, R.A.; Bolstad, B.M.; Collin, F.; Cope, L.M.; Hobbs, B.; Speed, T.P. Summaries of Affymetrix GeneChip probe level data. Nucleic Acids Res. 2003, 31, e15. [Google Scholar] [CrossRef] [PubMed]
  66. Carbon, S.; Ireland, A.; Mungall, C.J.; Shu, S.; Marshall, B.; Lewis, S. AmiGO Hub, Web Presence Working Group. AmiGO: Online access to ontology and annotation data. Bioinformatics 2009, 25, 288–289. [Google Scholar] [CrossRef] [PubMed]
  67. Benjamini, Y.; Hochberg, Y. Controlling the false discovery rate: A practical and powerful approach to multiple testing. J. R. Stat. Soc. Ser. B 1995, 57, 289–300. [Google Scholar]
  68. Huang, D.W.; Sherman, B.T.; Lempicki, R.A. Systematic and integrative analysis of large gene lists using DAVID Bioinformatics Resources. Nat. Protoc. 2009, 4, 44–57. [Google Scholar] [CrossRef] [PubMed]
  69. Livak, K.J.; Schmittgen, T.D. Analysis of relative gene expression data using real-time quantitative PCR and the 2∆∆CT method. Methods 2001, 25, 402–409. [Google Scholar] [CrossRef] [PubMed]
  70. Capdevila, M.; Cols, N.; Romero-Isart, N.; Gonzales-Duarte, R.; Atrian, S.; Gonzales-Duarte, P. Recombinant synthesis of mouse Zn3-β and Zn4-α metallothionein 1 domains and characterization of their cadmium (II) binding capacity. Cell. Mol. Life Sci. 1997, 53, 681–688. [Google Scholar] [CrossRef] [PubMed]
  71. Cols, N.; Romero-Isart, N.; Capdevila, M.; Oliva, B.; Gonzalez-Duarte, P.; Gonzalez-Duarte, R.; Atrian, S. Binding of excess cadmium(II) to Cd7-metallothionein from recombinant mouse Zn7-metallothionein 1. UV-Vis Absorption and Circular Dichroism studies and theoretical location approach by surface accessibility analysis. J. Inorg. Biochem. 1997, 68, 157–166. [Google Scholar] [CrossRef]
  72. Meloni, G.; Knipp, M.; Vasak, M. Detection of neuronal growth inhibitory factor (metallothionein-3) in polyacrylamide gels and by Western blot analysis. J. Biochem. Biophys. Methods 2005, 64, 76–81. [Google Scholar] [CrossRef] [PubMed]
Figure 1. Hierarchical clustering of gene expression profiles related to the expression of Zn transporters. Genes coding for Zn transporters are shown as rows, and individually tested animal samples are shown as columns. The expression changes in the heat map are represented by z-scores that are color-coded according to their values: red squares correspond to positive changes in expression levels (upregulation); blue squares correspond to negative changes in gene expression (downregulation); and white represents the absence of changes. Hierarchical clustering of the gene expression profiles revealed the presence of two distinct groups of animals, shown as green and blue trees, respectively, on the top of the figure.
Ijms 18 01133 g001
Figure 2. Gene expression profile clustering based on the 11 genes that differentiate animal groups A and B. Genes are shown as rows, and animals (dentate gyrus samples) are shown as columns. The expression changes in the heat map are represented by z-scores that are color-coded according to their values: red squares correspond to positive changes in expression levels (upregulation); blue squares correspond to negative changes in gene expression (downregulation); and white represents the absence of changes.
Ijms 18 01133 g002
Table 1. Genes related to Zn ion homeostasis. Out of the 39 genes listed in Gene Ontology (GO) as associated with Zn ion homeostasis, 25 were expressed above background levels in the hippocampal dentate gyrus samples in this study (shown in red).
GeneGene/Product NameGO TermTerm DescriptionRegistry
Ap3b1adaptor-related protein complex 3, beta 1 subunitGO:0006829calcium channel regulator activityMGI:MGI:4441257|PMID:17349999
Ap3d1adaptor-related protein complex 3, delta 1 subunitGO:0061088regulation of sequestering of zinc ionMGI:MGI:4834177|GO_REF:0000096
Atp13a2ATPase type 13A2GO:0006882cellular zinc ion homeostasisMGI:MGI:4834177|GO_REF:0000096
Gtf2igeneral transcription factor II IGO:0051481cellular zinc ion homeostasisMGI:MGI:4417868|GO_REF:0000096
Mt1Metallothionein-1GO:0006882cellular zinc ion homeostasisMGI:MGI:2177111|PMID:11792622
Mt2Metallothionein-2GO:0006882cellular zinc ion homeostasisMGI:MGI:2177111|PMID:11792622
Mt3Metallothionein-3GO:0006882cellular zinc ion homeostasisMGI:MGI:5315330|PMID:21359432
Nrxn2neurexin IIGO:0005246calcium channel regulator activityMGI:MGI:3040168|PMID:12827191
S100a6ref|Mus musculus S100 calcium binding protein A6 (calcyclin) (S100a6), mRNA [NM_011313]GO:0005509calcium ion bindingMGI:MGI:4834177|GO_REF:0000096
S100bref|Mus musculus S100 protein, beta polypeptide, neural (S100b), mRNA [NM_009115]GO:0005509calcium ion bindingMGI:MGI:4417868|GO_REF:0000096
Slc30a1solute carrier family 30 (zinc transporter), member 1GO:0006882cellular zinc ion homeostasisMGI:MGI:3056220|PMID:15452870
Slc30a3solute carrier family 30 (zinc transporter), member 3GO:0032119cellular zinc ion homeostasisMGI:MGI:4441264|PMID:16741752
Slc30a4solute carrier family 30 (zinc transporter), member 4GO:0061088regulation of sequestering of zinc ionMGI:MGI:4459044|GO_REF:0000033
Slc30a5solute carrier family 30 (zinc transporter), member 5GO:0006882cellular zinc ion homeostasisMGI:MGI:4834177|GO_REF:0000096
Slc30a6solute carrier family 30 (zinc transporter), member 6GO:0061088regulation of sequestering of zinc ionMGI:MGI:4459044|GO_REF:0000033
Slc30a9solute carrier family 30 (zinc transporter), member 9GO:0006829calcium channel regulator activityMGI:MGI:1354194|GO_REF:0000004
Slc39a1solute carrier family 39 (zinc transporter), member 1GO:0006829calcium channel regulator activityMGI:MGI:2683827|PMID:14525987
Slc39a10solute carrier family 39 (zinc transporter), member 10GO:0006882cellular zinc ion homeostasisMGI:MGI:5586917|PMID:25074913
Slc39a11solute carrier family 39 (metal ion transporter), member 11GO:0006829calcium channel regulator activityMGI:MGI:1354194|GO_REF:0000004
Slc39a12solute carrier family 39 (zinc transporter), member 12GO:0006882cellular zinc ion homeostasisMGI:MGI:4459044|GO_REF:0000033
Slc39a13solute carrier family 39 (metal ion transporter), member 13GO:0006882cellular zinc ion homeostasisMGI:MGI:4834177|GO_REF:0000096
Slc39a14solute carrier family 39 (zinc transporter), member 14GO:0006882cellular zinc ion homeostasisMGI:MGI:4834177|GO_REF:0000096
Slc39a3solute carrier family 39 (zinc transporter), member 3GO:0006829calcium channel regulator activityMGI:MGI:2683827|PMID:14525987
Slc39a6solute carrier family 39 (metal ion transporter), member 6GO:0006882cellular zinc ion homeostasisMGI:MGI:4834177|GO_REF:0000096
Slc39a7solute carrier family 39 (zinc transporter), member 7GO:0006882cellular zinc ion homeostasisMGI:MGI:4459044|GO_REF:0000033
Atp7bATPase, Cu++ transporting, beta polypeptideGO:0006882cellular zinc ion homeostasisMGI:MGI:1100407|PMID:9392450
CpceruloplasminGO:0006879cellular iron ion homeostasisMGI:MGI:2152098|GO_REF:0000002
HephhephaestinGO:0006879cellular iron ion homeostasisMGI:MGI:2152098|GO_REF:0000002
KelKell blood groupGO:0006874cellular calcium ion homeostasisMGI:MGI:5581641|PMID:23122227
Pik3c2aphosphatidylinositol 3-kinase, C2 domain containing, alpha polypeptideGO:0071583zinc II ion transportMGI:MGI:5543317|PMID:23823722
Slc30a10solute carrier family 30, member 10GO:0061088regulation of sequestering of zinc ionMGI:MGI:4459044|GO_REF:0000033
Slc30a2solute carrier family 30 (zinc transporter), member 2GO:0061088regulation of sequestering of zinc ionMGI:MGI:4459044|GO_REF:0000033
Slc30a7solute carrier family 30 (zinc transporter), member 7GO:0032119cellular zinc ion homeostasisPMID:17720550
Slc30a8solute carrier family 30 (zinc transporter), member 8GO:0006882cellular zinc ion homeostasisMGI:MGI:4417868|GO_REF:0000096
Slc39a2solute carrier family 39 (zinc transporter), member 2GO:0006829calcium channel regulator activityMGI:MGI:2683827|PMID:14525987
Slc39a4solute carrier family 39 (zinc transporter), member 4GO:0006882cellular zinc ion homeostasisMGI:MGI:3028750|PMID:14612438
Slc39a5solute carrier family 39 (metal ion transporter), member 5GO:0006882cellular zinc ion homeostasisMGI:MGI:3522410|PMID:15358787
Slc39a8solute carrier family 39 (metal ion transporter), member 8GO:0006882cellular zinc ion homeostasisMGI:MGI:4459044|GO_REF:0000033
Slc39a9solute carrier family 39 (zinc transporter), member 9GO:0006829calcium channel regulator activityMGI:MGI:1354194|GO_REF:0000004
Table 2. Zn transporter genes that differentiate the two identified animal groups. Eleven genes, shown in red and blue, account for the major differences between the two animal groups identified in Figure 1. Other Zn transporter genes do not show statistically significant changes in expression levels between the groups. Among the 11 differentially expressed genes, two (Mt2 and S100b, shown in blue) are upregulated in the animal Group A as compared to Group B.
Genesp-ValueStatistically Significant?Relative Expression Value, Group ARelative Expression Value, Group Blog2R
Ap3d10.000Yes10.23410.0150.219
Atp13a20.002Yes12.35512.1430.212
Mt20.000Yes15.10815.370−0.262
Mt30.000Yes15.25114.3010.950
Nrxn20.002Yes12.81712.6170.200
S100a60.000Yes10.2829.7390.542
Slc30a10.000Yes8.1777.4870.690
Slc39a70.023Yes11.37011.1980.171
S100b0.000Yes11.14011.634−0.494
Slc30a30.000Yes9.9479.3490.598
Slc39a30.000Yes10.36810.0540.314
Slc30a90.162No10.36710.2080.159
Gtf2i1.000No11.86311.918−0.055
Mt10.165No7.6077.4040.203
Mt11.000No15.84615.8010.046
Slc30a41.000No8.7118.744−0.033
Slc30a51.000No8.3518.3450.006
Slc30a60.880No6.9066.7490.157
Slc30a90.536No7.9937.8510.143
Slc39a11.000No10.03410.087−0.053
Slc39a100.075No9.3129.489−0.176
Slc39a111.000No9.4369.497−0.061
Slc39a121.000No8.2678.2150.053
Slc39a130.092No7.0537.399−0.346
Slc39a141.000No8.2608.351−0.092
Slc39a61.000No10.29810.2410.057
Table 3. Relative MT2 mRNA levels after metal treatment. All results are normalized to non-metal treated control cells and the housekeeping gene HSP90ABI. Results are the average of 6 and 5 biological replicates, for BE(2)C and SH-SY5Y cells, respectively. Each biological replicate is the average of 3 technical replicates. Standard errors are presented in parentheses.
Cell LineNo TreatmentPbZnCoLi
BE(2)C11.66 (0.77)24.58 (6.23)1.45 (0.46)1.16 (0.37)
SH-SY5Y10.97 (0.04)16.19 (2.13)1.18 (0.14)1.35 (0.27)
Table 4. Relative MT3 mRNA levels after metal treatment. All results are normalized to non-metal treated control cells and the housekeeping gene HSP90ABI. Results are the average of 6 and 5 biological replicates, for BE(2)C and SH-SY5Y cells, respectively. Each biological replicate is the average of 3 technical replicates. Standard errors are presented in parentheses.
Cell LineNo TreatmentPbZnCoLi
BE(2)C11.30 (0.34)1.20 (0.44)1.99 (0.58)1.16 (0.16)
SH-SY5Y10.66 (0.14)0.76 (0.28)1.17 (0.28)1.23 (0.33)
Table 5. Reverse transcription and PCR primers used in this study.
PrimerSequenceTm (°C)
Anchored Poly DT5′ TTT TTT TTT TTT TTT TTT TTV N 3′41.0
HSP90 Primer 15′ TCC TTC TCT CGT TCC TTC TCC 3′55.7
HSP90 Primer 25′ GTA CCA AAG TGA TCC TCC ATC T 3′54.0
MT-2 Forward5′ CCG ACT CTA GCC GCC TCT T 3′59.0
MT-2 Reverse5′ GTG GAA GTC GCG TTC TTT ACA 3′55.3
MT-3 Forward5′ CTG CGG AGT GTG AGA AGT GT 3′57.1
MT-3 Reverse5′ TTG TCA TTC CTC CAA GGT CA 3′53.6

