Article

Identification of Potential Key Genes Associated with Adipogenesis through Integrated Analysis of Five Mouse Transcriptome Datasets

1
College of Animal Science and Technology, Northwest A&F University, Yangling 712100, China
2
National Beef Cattle Improvement Center, Northwest A&F University, Yangling 712100, China
*
Author to whom correspondence should be addressed.
These authors contributed equally to this study.
Int. J. Mol. Sci. 2018, 19(11), 3557; https://doi.org/10.3390/ijms19113557
Submission received: 7 October 2018 / Revised: 1 November 2018 / Accepted: 6 November 2018 / Published: 12 November 2018
(This article belongs to the Special Issue Transcriptional Regulation in Lipid Metabolism)

Abstract

:
Adipose tissue is the most important energy metabolism and secretion organ, and these functions are conferred during the adipogenesis process. However, the cause and the molecular events underlying adipogenesis are still unclear. In this study, we performed integrated bioinformatics analyses to identify vital genes involved in adipogenesis and reveal potential molecular mechanisms. Five mouse high-throughput expression profile datasets were downloaded from the Gene Expression Omnibus (GEO) database; these datasets contained 24 samples of 3T3-L1 cells during adipogenesis, including 12 undifferentiated samples and 12 differentiated samples. The five datasets were reanalyzed and integrated to select differentially expressed genes (DEGs) during adipogenesis via the robust rank aggregation (RRA) method. Functional annotation of these DEGs and mining of key genes were then performed. We also verified the expression levels of some potential key genes during adipogenesis. A total of 386 consistent DEGs were identified, with 230 upregulated genes and 156 downregulated genes. Gene Ontology (GO) analysis showed that the biological functions of the DEGs primarily included fat cell differentiation, lipid metabolic processes, and cell adhesion. Kyoto Encyclopedia of Genes and Genomes (KEGG) analysis showed that these DEGs were mainly associated with metabolic pathways, the peroxisome proliferator-activated receptor (PPAR) signaling pathway, regulation of lipolysis in adipocytes, the tumor necrosis factor (TNF) signaling pathway, and the FoxO signaling pathway. The 30 most closely related genes among the DEGs were identified from the protein–protein interaction (PPI) network and verified by real-time quantification during 3T3-L1 preadipocyte differentiation. In conclusion, we obtained a list of consistent DEGs during adipogenesis through integrated analysis, which may offer potential targets for the regulation of adipogenesis and treatment of adipose dysfunction.

Graphical Abstract

1. Introduction

When preadipocytes differentiate into mature adipocytes during adipogenesis, adipose tissue gains its specific physiological functions: being the primary storage site for fatty acids and the largest endocrine organ. Much of our understanding of adipogenesis comes from in vitro studies of preadipocyte models (e.g., the 3T3-L1 and 3T3-F442A cell lines) [1,2]. Adipogenesis (adipocyte differentiation) is a multistep biological process that is highly controlled. The expression of several transcription factors and adipogenic genes during adipogenesis causes adipocyte development. During the terminal differentiation stage, the cell morphology changes dramatically (from fibroblastic to spherical), and preadipocytes synchronously gain the characteristics of mature adipocytes. Glucose transporters, enzymes involved in triglyceride metabolism, insulin receptors, and adipocyte-secreted products all show increased activity and quantity, which is necessary for lipid metabolic balance and the inflammatory response. In the past few decades, a number of regulatory factors related to adipogenic programs have been gradually unearthed.
Some studies determined the gene expression profiles during adipogenesis, and a large number of differentially expressed genes (DEGs) related to the initiation of adipogenesis have been identified [3,4,5,6,7]. However, a frequent cause of confusion is the inconsistency of these results due to differences in sample batch, detection platforms, and data processing methods. Therefore, each independent experiment has certain limitations. We need to integrate these results to find credible DEGs that are stable in multiple independent studies using an unbiased approach. In this way, we can fully utilize multiple expression profiles obtained by high-throughput technology to find reliable and effective molecular targets. In this study, to identify DEGs associated with adipogenesis, the robust rank aggregation (RRA) approach was used to integrate multiple ranked gene lists [8]. The RRA method is a powerful ordering algorithm, and for all of the genes in the final ranked gene list, this method assigns a p-value to estimate significance probabilities indicating that the result is better than expected by chance [9]. The size of the p-value corresponds to the position and significance of the corresponding gene in the final ranked list, meaning that the smaller the p-value is, the higher the ranking position of the gene.
In this study, to more accurately identify DEGs associated with adipogenesis, we reanalyzed five expression profile datasets from a public expression database and then integrated these results. With these DEGs, a number of subsequent bioinformatic analyses were performed. Here, we aimed to explore the main pathways and processes associated with adipocyte differentiation and provide key targets for regulating adipose dysfunction and metabolic disorders.

2. Results

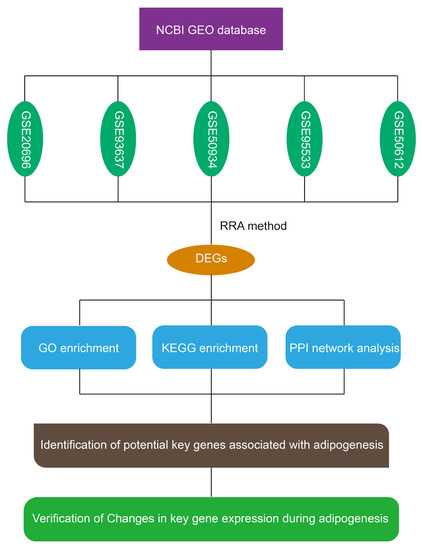
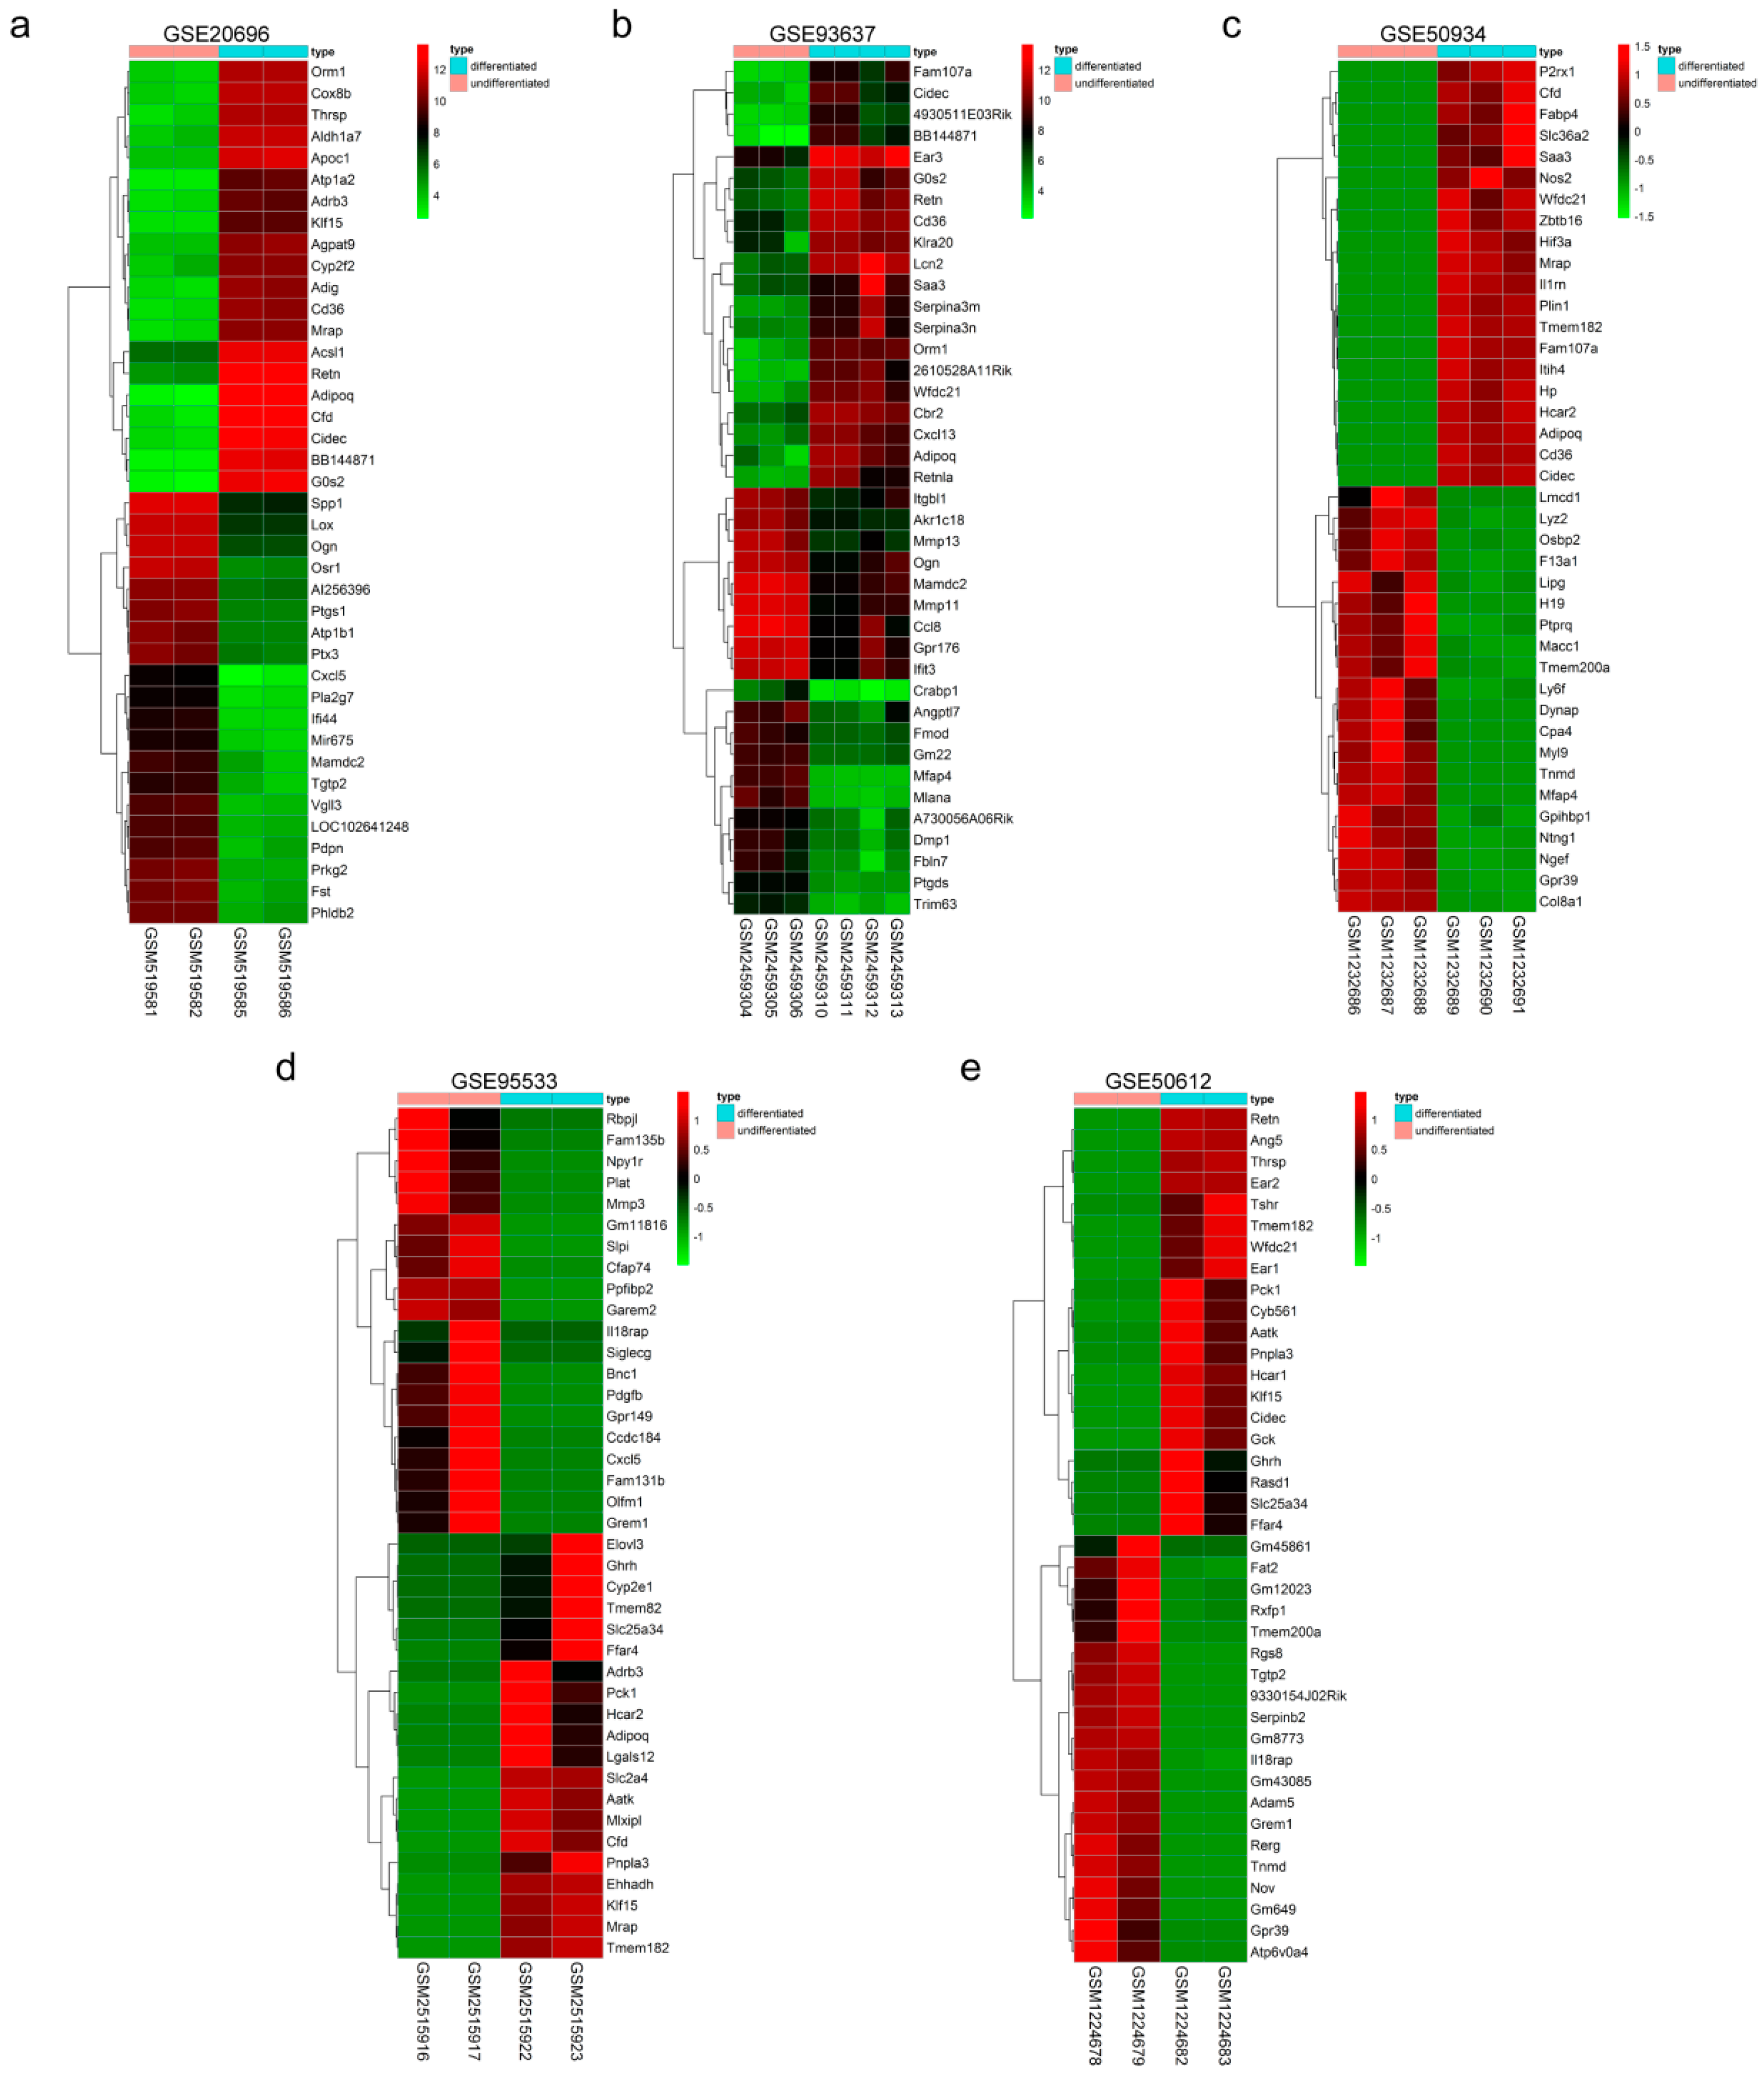
2.1. Expression Profile Datasets and Identification of Differentially Expressed Genes (DEGs) Associated with Adipogenesis

Five expression profile datasets from the Gene Expression Omnibus (GEO) database were selected. In total, 24 samples were obtained, including 12 undifferentiated 3T3-L1 cell samples and 12 differentiated 3T3-L1 cell samples (Table 1). The GSE20696 [7] and GSE93637 [3] expression microarray datasets were standardized, and DEGs were screened with the limma package (|Log2 fold change (log2FC)| > 1, and corrected p-value < 0.05). The high-throughput sequencing datasets GSE50934 [6], GSE95533 [4] and GSE50612 [5] were mapped, and the expression level was calculated. DEGs were screened by the DESeq2 package (|log2FC| > 1 and corrected p-value < 0.05). The numbers of DEGs in these datasets are shown in Table 1. The cluster heatmaps of the top 40 DEGs from the two sets of sample data included in each of the five expression profile datasets are shown in Figure 1a–e.

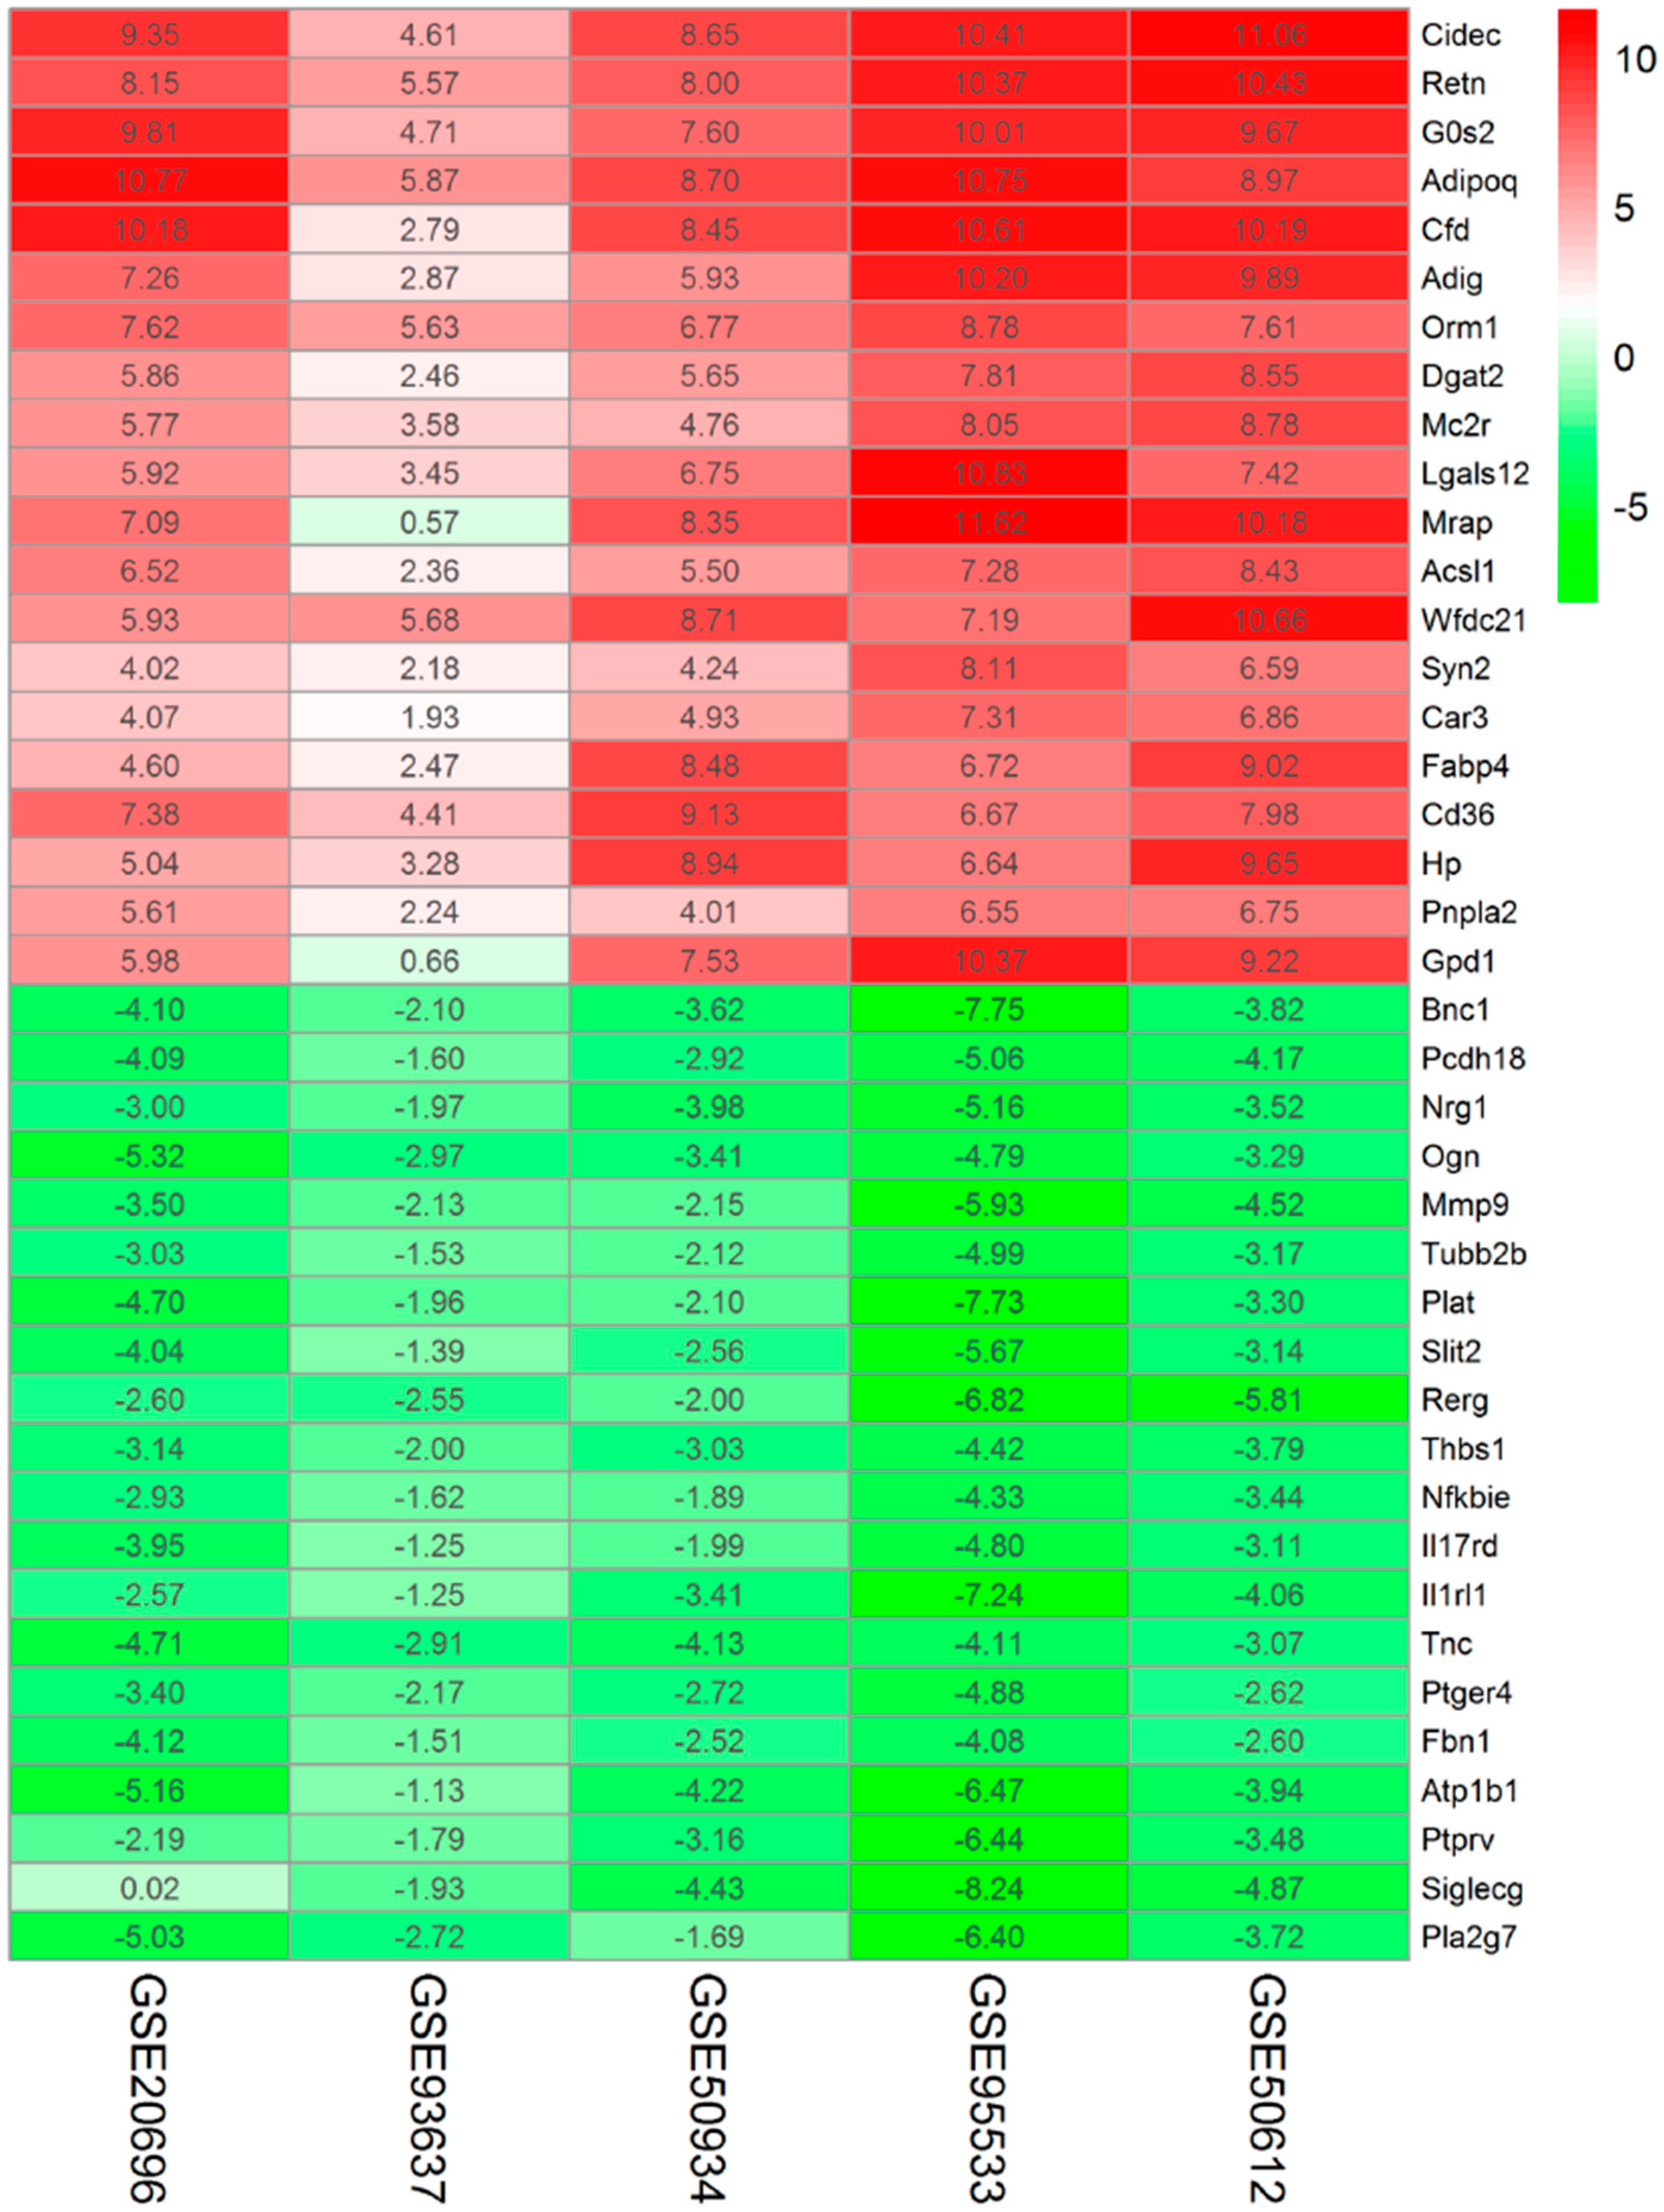
2.2. Identification of DEGs Associated with Adipogenesis Using Integrated Bioinformatics

After the above five adipogenesis datasets were reanalyzed by the limma [10] or DESeq2 [11] package, five gene lists ranked according to log2FC value were obtained and then analyzed by RRA (|log2FC| > 1 and corrected p-value < 0.05). Through rank analysis, we identified 386 DEGs, with 230 upregulated genes and 156 downregulated genes. A heatmap of the top 20 up- and down-regulated genes is shown in Figure 2. The integrated analysis results for the top 20 up- and down-regulated DEGs are shown in Table 2.

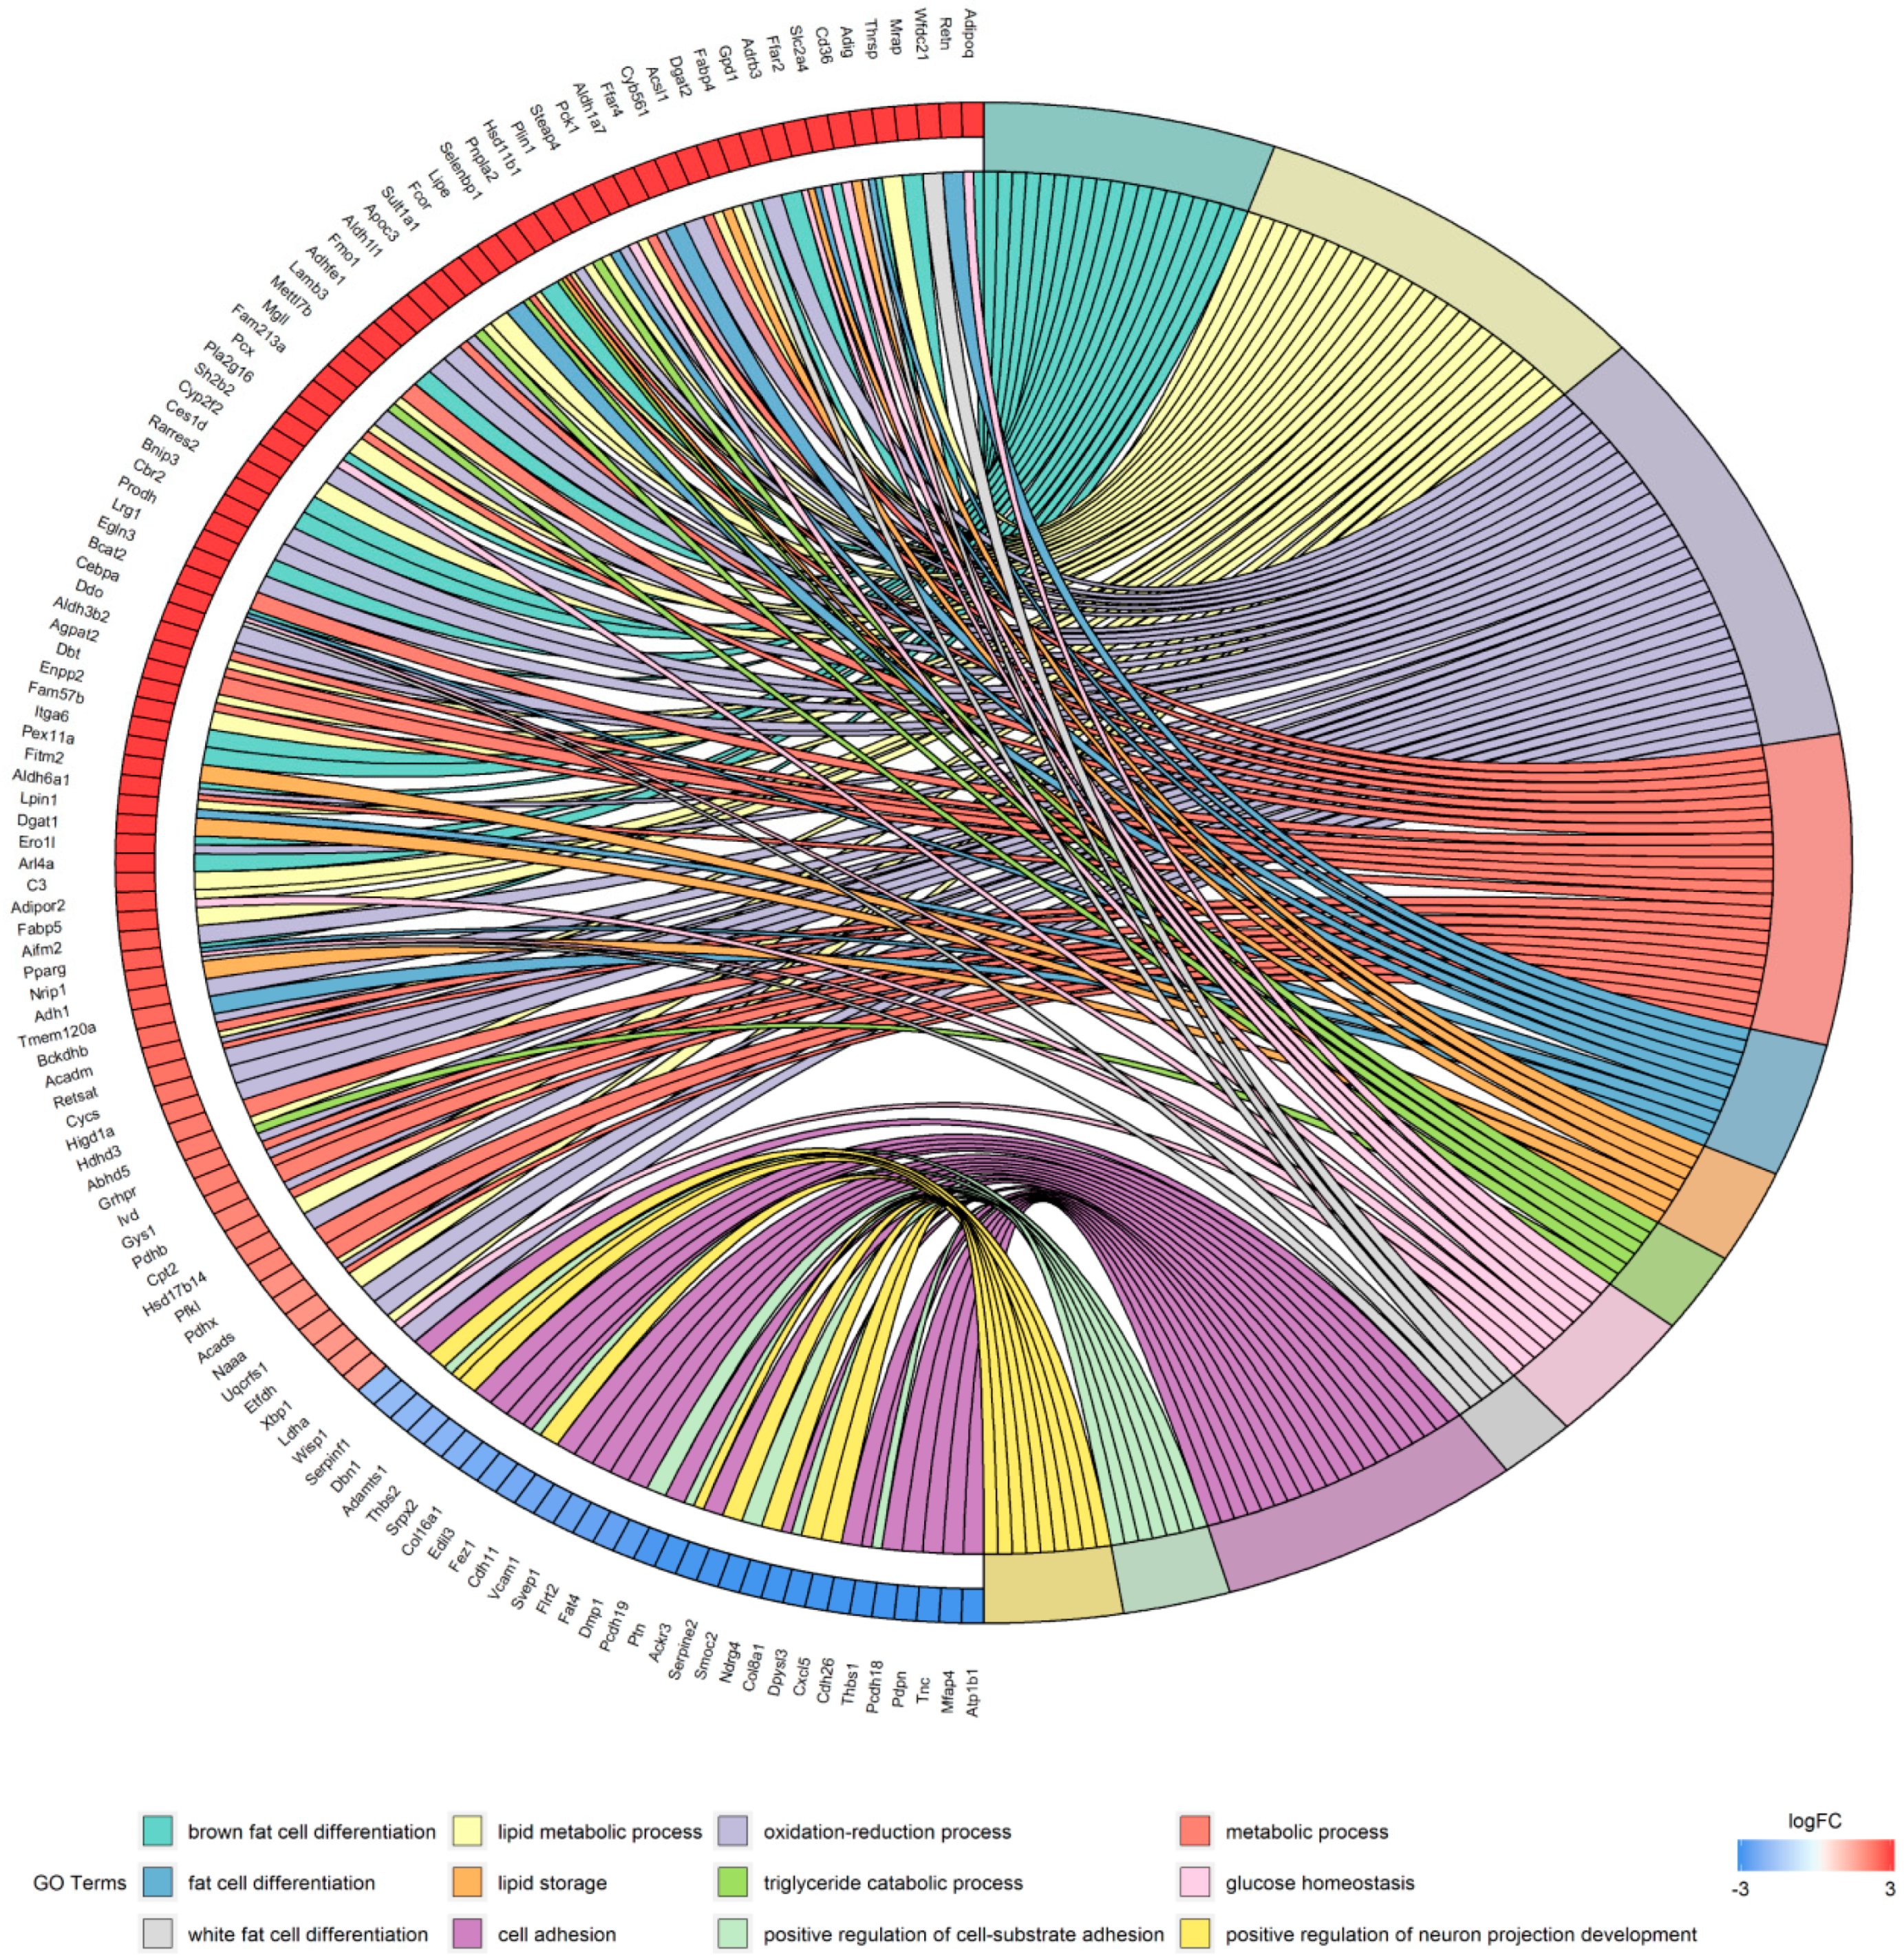
2.3. Enrichment Analysis of the Gene Ontology (GO) Terms of the DEGs

Significant results from the Gene Ontology (GO) term analysis of DEGs associated with adipogenesis are shown in Table 3. The enrichment results for the biological process (BP) GO category showed that the upregulated genes were primarily involved in fat cell differentiation, lipid metabolic processes, and oxidation-reduction processes. The downregulated genes were primarily concentrated in cell adhesion, positive regulation of cell-substrate adhesion, and positive regulation of neuron projection development. The enrichment results for cell composition (CC) GO category showed that the upregulated genes were primarily concentrated in mitochondria, lipid particles, and the cytosol. The downregulated genes were mainly enriched in extracellular regions, the proteinaceous extracellular matrix, and the extracellular matrix. The enrichment results for the molecular function (MF) GO category showed that the upregulated genes were mainly enriched in oxidoreductase activity. The downregulated genes were mainly enriched in heparin binding, calcium ion binding, and integrin binding. Moreover, the correspondence between genes and biological processes is shown in Figure 3.

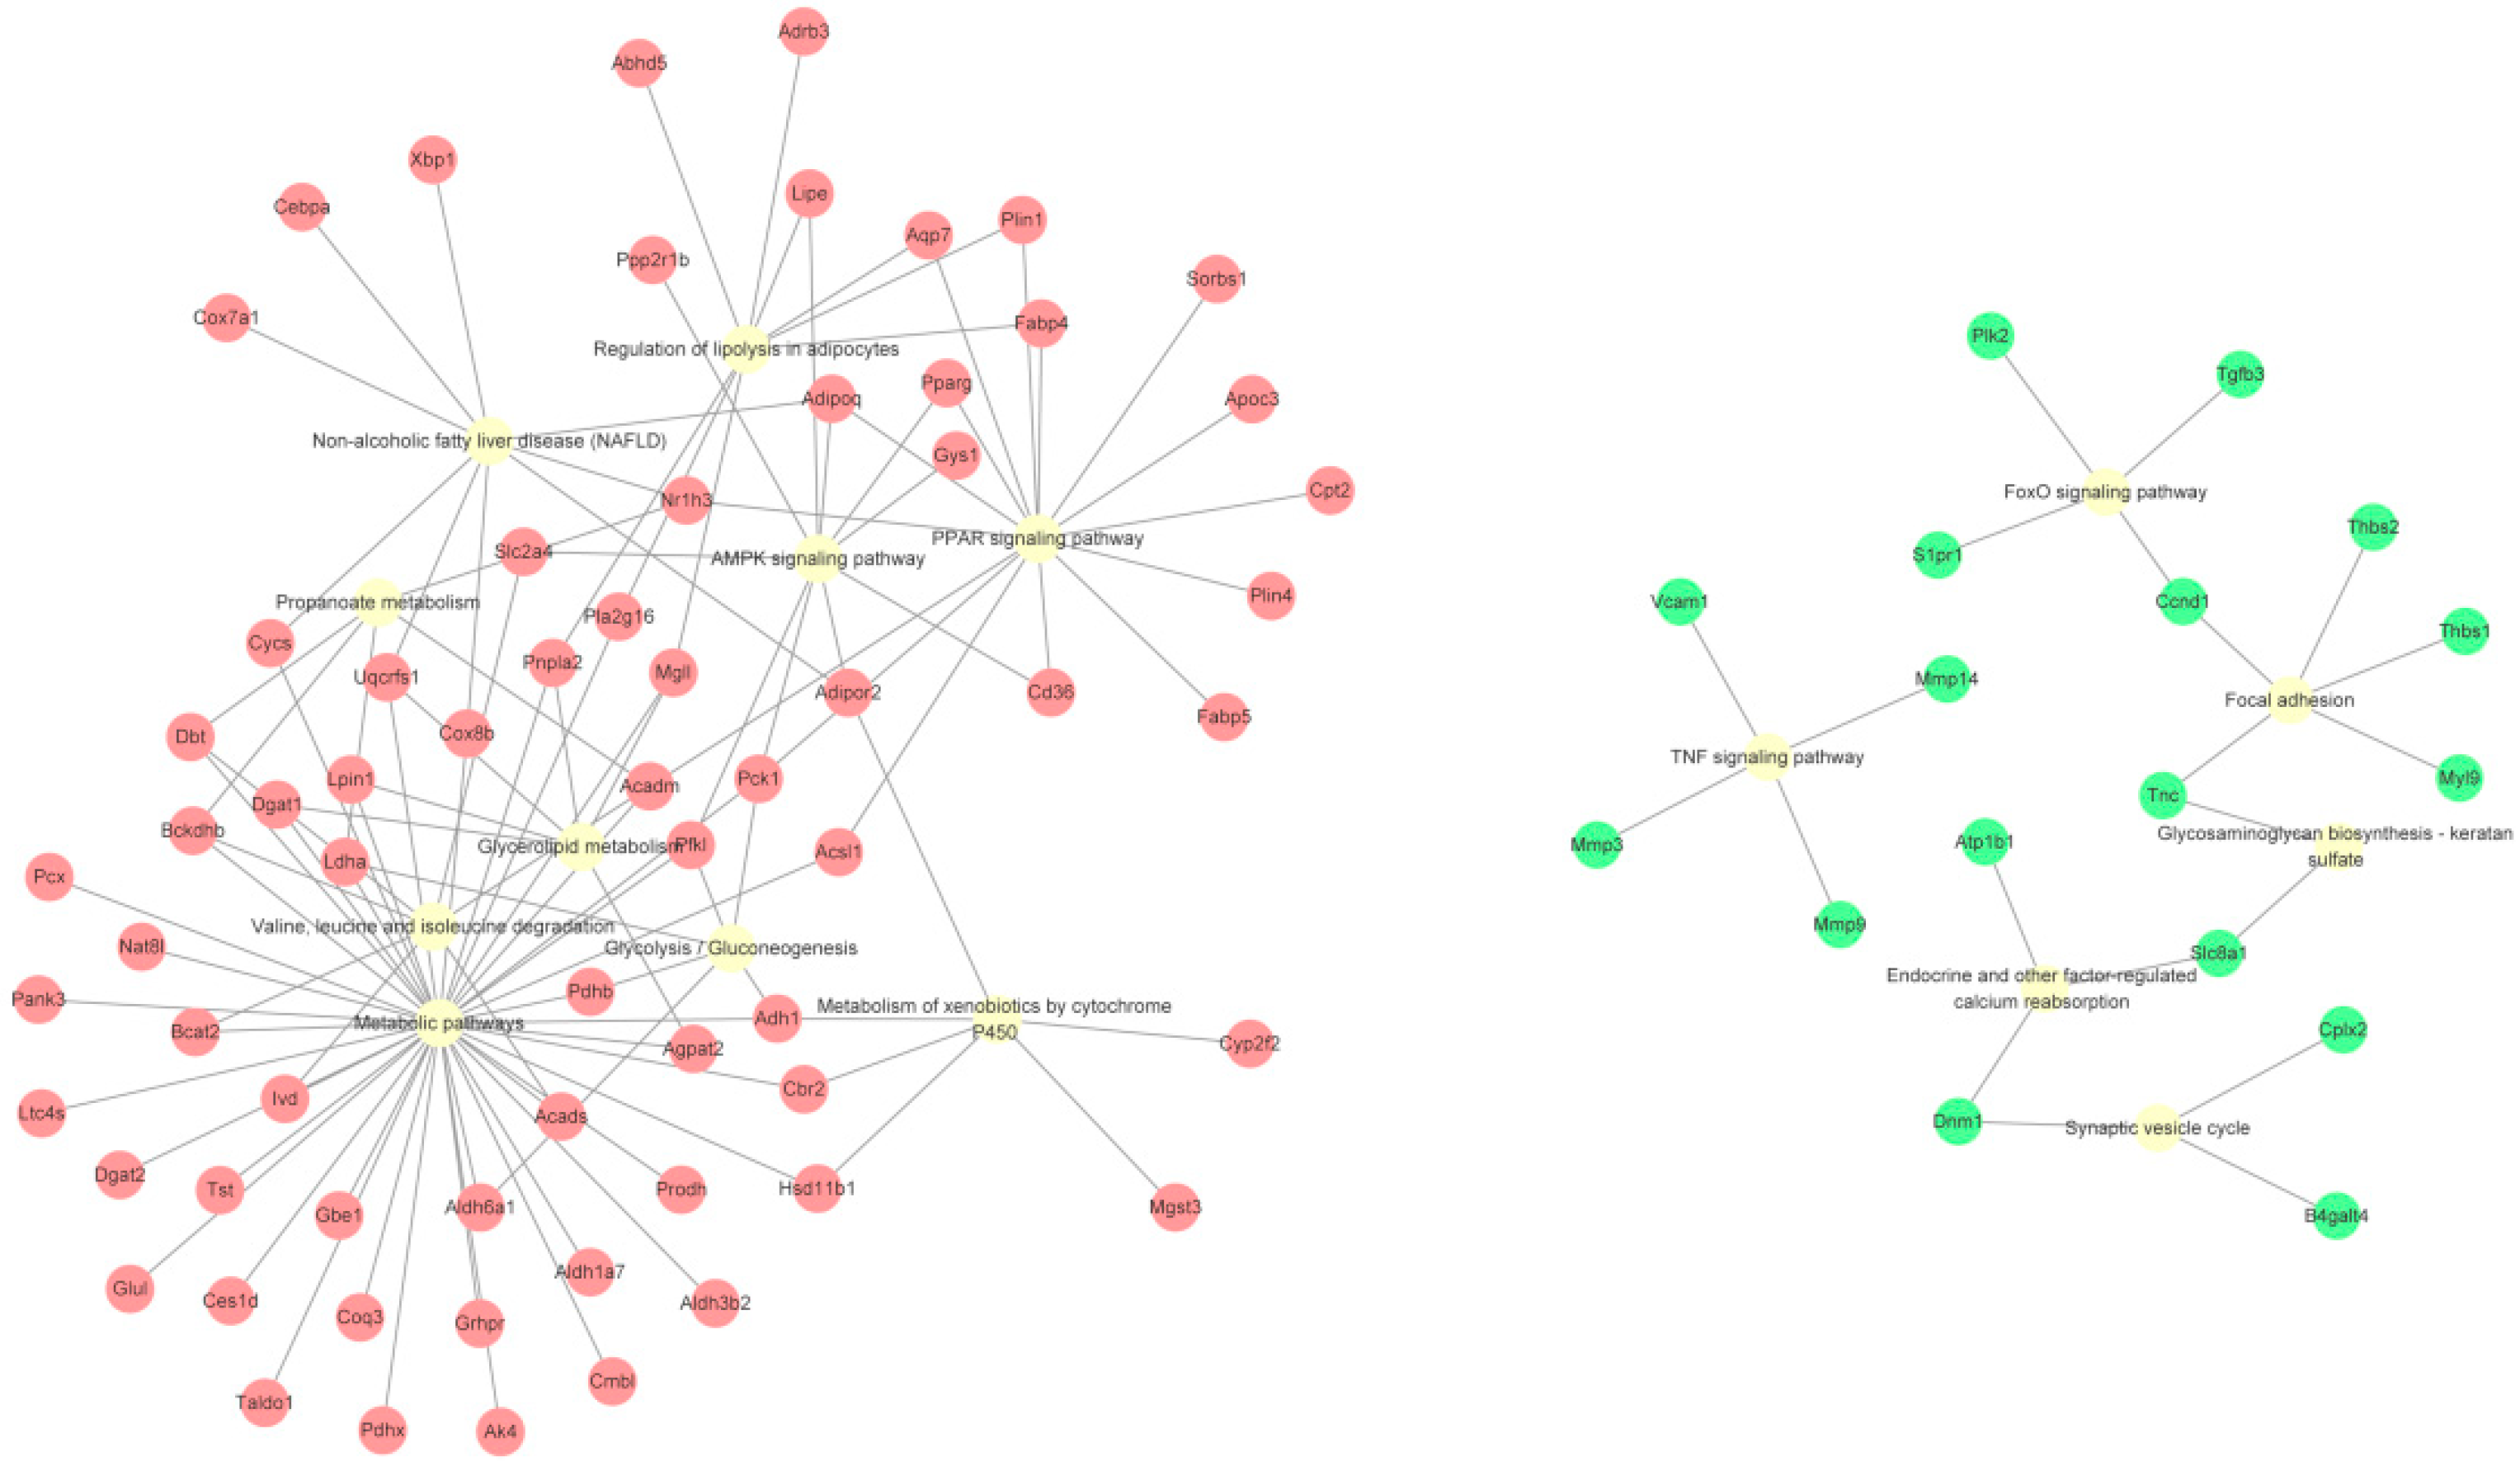
2.4. Kyoto Encyclopedia of Genes and Genomes (KEGG) Pathway Analysis of DEGs

The top 20 significant pathways for the upregulated genes were selected (Table 4). The upregulated genes were mainly enriched in metabolic pathways, the proliferator-activated receptor (PPAR) signaling pathway, and regulation of lipolysis in adipocytes, and were also enriched in some adipogenesis-related pathways, including the AMP-activated protein kinase (AMPK) signaling pathway, fat digestion and absorption, adipocytokine signaling pathway, and insulin signaling pathway. On the other hand, 11 significant pathways for the downregulated genes were filtered out (Table 4). Except for some diseases and cancer-related pathways, the downregulated genes were mainly enriched in the tumor necrosis factor (TNF) signaling pathway, forkhead box O (FoxO) signaling pathway, and some fundamental biochemical processes (such as focal adhesion, endocrine and other factor-regulated calcium reabsorption, and glycosaminoglycan biosynthesis—keratan sulfate). Cytoscape was used to visualize the relationship between genes and pathways. The genes and pathway nodes are represented by circles. The results are shown in Figure 4.

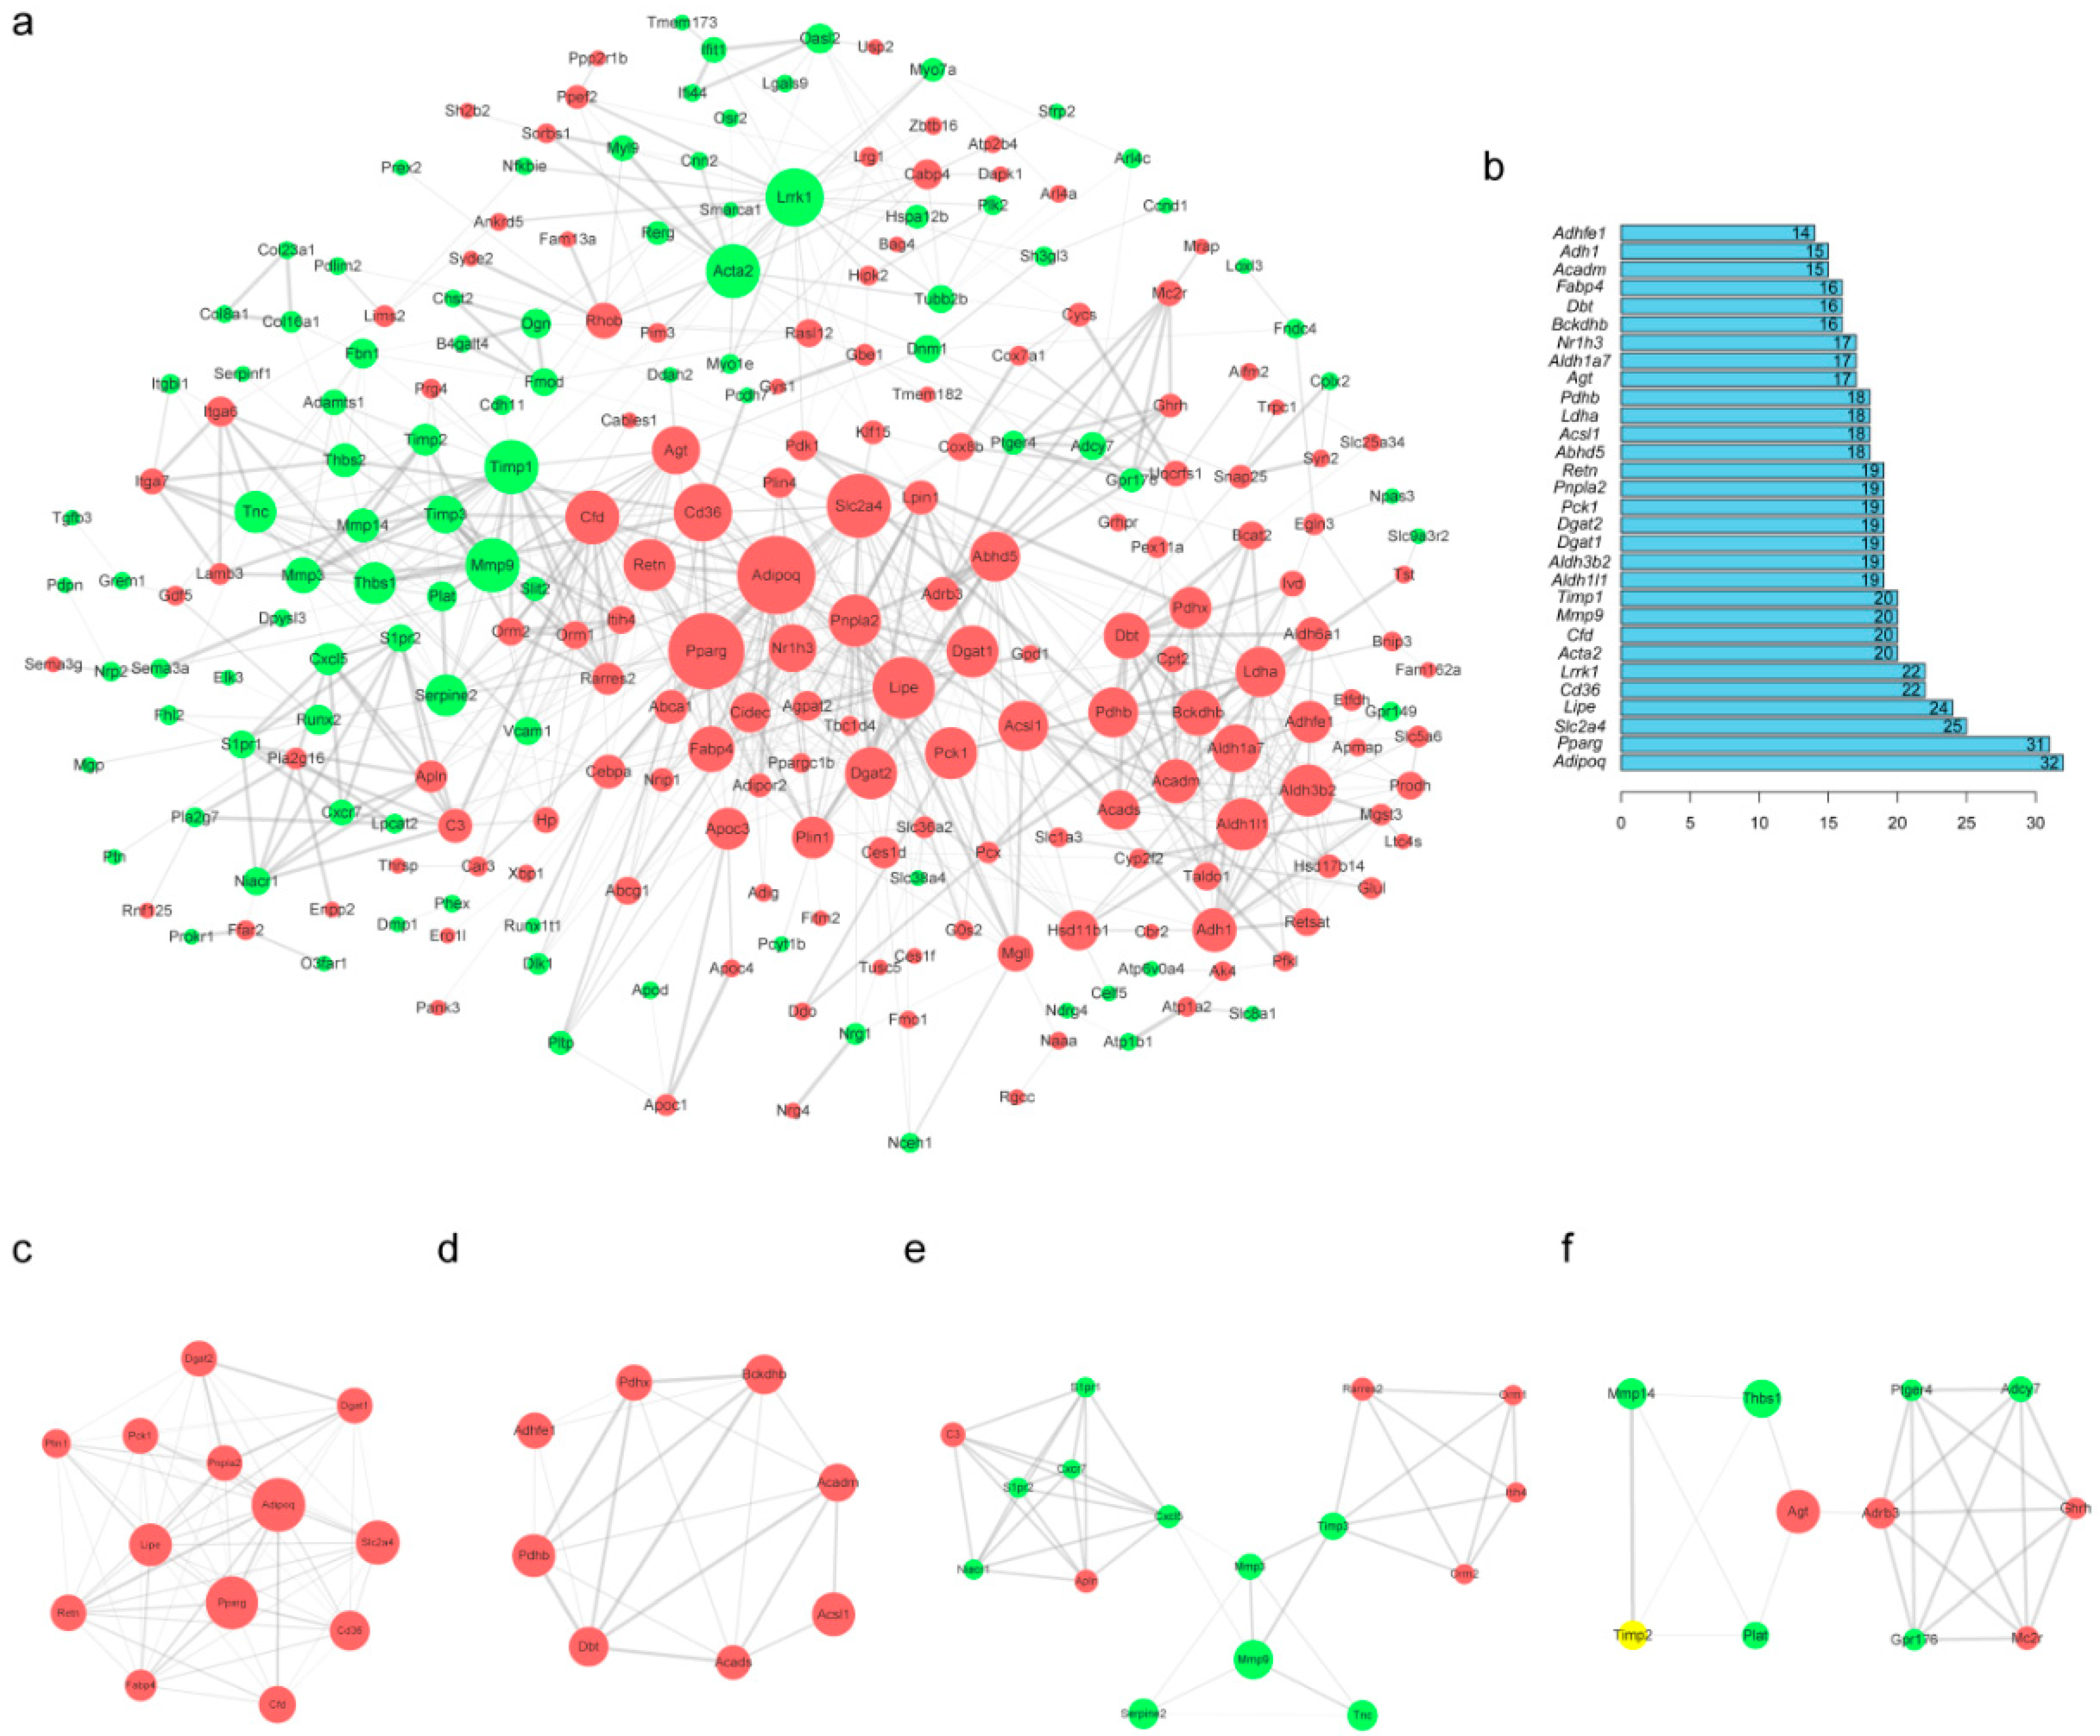
2.5. Protein–Protein Interaction (PPI) Network Construction and Module Analysis of DEGs

To analyze the interaction among DEG expression products, the Search Tool for the Retrieval of Interacting Genes/Proteins (STRING) database [12] was used to construct a PPI network. A total of 247 nodes and 751 edges were obtained with a combined score >0.4, as shown in Figure 5a (isolated nodes were ignored). The top 30 highest degree nodes are shown in Figure 5b. Among these genes, adiponectin, C1Q and collagen domain containing (Adipoq) showed the highest node degree, which was 32. Then, nine modules were selected using the plug-in Molecular Complex Detection (MCODE) to screen the above PPI network. The top 4 modules are shown in Figure 5c–f. In addition, functional annotations for these top 30 genes (only leucine-rich repeat kinase 1 (Lrrk1), actin, alpha 2, smooth muscle, aorta (Acta2), matrix metallopeptidase 9 (Mmp9), and tissue inhibitor of metalloproteinase 1 (Timp1) were downregulated) were implemented (Table 5). GO analysis showed that the genes were mainly related to lipid metabolism, oxidation-reduction, and fat cell differentiation. KEGG analysis showed that they were mainly associated with the PPAR signaling pathway, metabolism pathways, and the AMPK signaling pathway.

2.6. Verification of Changes in DEG Expression During 3T3-L1 Preadipocyte Differentiation

We believe that the top 30 highest degree genes in the PPI network may play a key regulatory role in the process of adipogenic differentiation. Here, we measured their expression levels before and after 3T3-L1 preadipocyte differentiation. First, we induced differentiation of 3T3-L1 preadipocytes and performed oil red O staining (Figure 6a). The results showed that the lipid droplets were numerous and large after differentiation. Next, we determined the expression levels of 17 potential key genes in undifferentiated and differentiated 3T3-L1 cells through quantitative real-time PCR (qRT-PCR) (Figure 6b). The results showed that their expression varied significantly during adipogenesis. The direction of change was consistent with the results of the previous integrated bioinformatic analysis.

3. Discussions

Adipose tissue is composed of many cell types, and mature adipocytes account for only two-thirds of adipose tissue. Undifferentiated cells are also found in adipose tissue, including preadipocytes and stem cells. Stem cells have the potential to differentiate into various types of cells, and the direction of the differentiation of preadipocytes has been determined. Proliferation and differentiation of preadipocytes are essential for the continued development and maintenance of adipose tissue. Spalding et al. found that almost 50% of human subcutaneous fat is renewed every 8 years, suggesting that adipocytes are a dynamic cell type that undergoes constant substitution by newborn adipocytes [13]. In other words, adipogenesis fundamentally determines the expansion and functional properties of adipose tissue. Considering the occurrence of increases in public health problems caused by adipose dysfunction and metabolic disorders (such as obesity, diabetes mellitus, insulin resistance, and cardiovascular disease) on a global scale, it is necessary to explore the fundamental molecular mechanism of adipogenesis [14].
With the development of high-throughput technology, a large amount of transcriptome data is generated and uploaded to a public expression database. Fully exploiting these large datasets can provide good value to life science research. Given the inevitable errors among independent experiments, we urgently need to integrate the results of various experiments to more accurately identify the intrinsic components and elucidate the major molecular mechanisms. In this study, we integrated five gene expression profile datasets of the adipogenesis processes from different independent experiments. A total of 386 DEGs were identified, including 230 upregulated genes and 156 downregulated genes. The upregulated gene list contained many fat marker genes (such as Adipoq, peroxisome proliferator activated receptor gamma (Pparg), and solute carrier family 2 (facilitated glucose transporter), member 4 (Slc2a4)), and a large number of adipogenic differentiation studies have been carried out around them. The downregulated gene list includes the well-known antiadipogenesis gene delta-like 1 (Dlk1), but many of the other genes related to adipogenic differentiation have rarely been reported. In general, the role of these genes with dramatic changes in expression during adipogenesis deserves a deeper understanding. This study provides a reliable collection of DEGs associated with adipogenic processes, providing a large number of potential subjects for subsequent research.
In addition, functional annotation of DEGs was performed to fully understand the processes and pathways in which they participate. GO analysis of the upregulated genes revealed that adipocyte differentiation and concomitant activities, such as lipid metabolism and redox activity, were major biological processes in which they were involved. The KEGG analysis of upregulated genes showed consistent results, with the PPAR signaling pathways and lipid metabolism-related pathways (such as metabolic pathways and regulation of lipolysis in adipocytes) playing a dominant role. The PPAR signaling pathway has been extensively studied as a core pathway in the process of adipogenic differentiation. Peroxisome proliferator-activated receptor gamma (PPARG, encoded by Pparg) is the master regulator of adipose differentiation; its expression is necessary for initiating differentiation and maintaining a differentiated state, and a large number of prodifferentiation factors function through its activation [15]. The GO and KEGG analyses of downregulated genes also showed consistent results, with biological processes and pathways involved in adhesion and activity of the extracellular matrix (ECM) predominating. Phenotypic changes in cells during fat differentiation were apparent and were accompanied by changes in the levels and type of ECM components [16], and proteolytic degradation of preadipocytes by ECM components is required for cell-shape changes, adipocyte-specific gene expression, and lipid accumulation [17]. On the other hand, downregulated genes are also enriched in some antiadipogenic differentiation pathways, such as the TNF signaling pathway [18] and the FoxO signaling pathway [19].
A PPI network of DEG-encoded proteins was constructed and the 30 most closely related genes were selected. Further functional annotation of these key genes was performed, and the results were consistent with the functional annotations of the entire set of DEGs. They were mainly concentrated in the same biological processes and pathways involved in adipogenesis. The findings further suggested that the 30 key genes that we screened were credible because the 30 key genes were sufficient to represent all the DEGs and reflect the main activities of adipogenesis. We believe that these genes with the highest node degree play a major regulatory role in multiple processes of adipogenic differentiation. Some of these genes are well-known as key genes in fat differentiation and lipid metabolism functions, such as the transcriptional regulation of adipogenesis (Pparg), insulin sensitive glucose transport (Slc2a4) [20], fatty acid transport (fatty acid binding protein 4 (Fabp4), CD36 Molecule (Cd36)) [21,22], triacylglycerol (TAG) synthesis (diacylglycerol O-acyltransferase 1 (Dgat1), diacylglycerol O-acyltransferase 1 (Dgat2), acyl-CoA synthetase long-chain family member 1 (Acsl1)) [23,24,25,26], lipolysis and its regulation (lipase, hormone sensitive (Lipe), patatin-like phospholipase domain containing 2 (Pnpla2), abhydrolase domain containing 5 (Abhd5)) [27,28], and the endocrine functions of adipocytes (Adipoq, complement factor D (Cfd), resistin (Retn)) [29,30]. In addition, tissue inhibitor of metalloproteinases-1 (TIMP1, encoded by Timp1) is a natural inhibitor of matrix metalloproteinases (MMPs) [31], a cluster of peptidases that are involved in degrading and remodeling the ECM [32,33]. MMP9 (a member of the MMP family, encoded by Mmp9) is secreted by adipocytes, and its proteolytic activity was induced during adipocyte differentiation [34]. The Nr1h3 gene encodes a nuclear receptor, Nuclear Receptor Subfamily 1 Group H Member 3 (NR1H3, also known as LXRα), which is a vital regulator in hepatic de novo lipogenesis and lipid homeostasis [35]. NR1H3 exhibits ligand-dependent activation activity and is activated primarily by cellular cholesterols, leading to the induction of transcription of a downstream nuclear transcriptional factor, sterol regulatory element binding transcription factor 1 (SREBF1) [36]. The Pck1 gene is mainly responsible for the regulation of gluconeogenesis [37] and is closely related to diabetes mellitus and obesity [38]. Cytosolic isozyme of phosphoenolpyruvate carboxykinase (PEPCK-C, encoded by Pck1) stimulates the transformation of oxaloacetate to phosphoenolpyruvate (PEP) in fat cells [39]. As a member of the aldehyde dehydrogenase 3 (ALDH3) family, aldehyde dehydrogenase 3 family member B2 (ALDH3B2, encoded by Aldh3b2) is localized in lipid droplets and is responsible for the removal of lipid aldehydes, exhibiting broad substrate specificity towards medium- and long-chain aldehydes [40]. The remaining genes with high node degrees, such as Lrrk1, aldehyde dehydrogenase 1 family, member L1 (Aldh1l1), and alcohol dehydrogenase, iron containing, 1 (Adhfe1), are very rarely reported to be related to adipogenesis. These genes deserve more attention from frontline researchers, and their potential role in adipogenesis requires further experimental verification.
Finally, we verified the expression changes in some key genes before and after 3T3-L1 preadipocyte differentiation. Combining the results of integrated bioinformatic analyses with the results of gene expression measurements, this study has greatly narrowed the range of potential key genes and provides high-value targets for subsequent adipogenic differentiation research.

4. Materials and Methods

4.1. Gene Expression Profile Data

The gene expression profile datasets GSE50934, GSE95533, GSE50612, GSE93637, and GSE20696 were downloaded from the GEO database (https://www.ncbi.nlm.nih.gov/geo/). The platforms of the five GEO datasets were GPL13112 Illumina HiSeq 2000 (Mus musculus) for the GSE50934 and GSE50612 datasets, GPL18480 Illumina HiSeq 1500 (Mus musculus) for the GSE95533 dataset, and GPL1261 [Mouse430_2] Affymetrix Mouse Genome 430 2.0 Array for the GSE93637 and GSE20696 datasets.

4.2. Identification of DEGs

For the raw data of GSE50934, GSE95533, and GSE50612, reads were mapped to the mouse genome (GRCm38) using HiSat2 [41], and annotated genes were quantified with featureCounts [42]. Differential expression analysis was performed using the DESeq2 R package. For the raw data of GSE93637 and GSE20696, normalization and differential expression analysis were performed using the limma R package. DESeq2 and limma R package were all from the Bioconductor project (https://www.bioconductor.org/). All the R packages used in this study were deployed in the programming language R (version 3.3.3, Auckland, New Zealand).

4.3. Integration of Gene Expression Profile Data

The RRA method was based on the assumption that all genes are unordered in each list. In this study, only the overlapping DEGs were used for the integrated analysis, and the five lists of genes were ranked by expression level in the five datasets. The RobustRankAggreg package of programming language R was downloaded from the Comprehensive R Network (https://cran.r-project.org/).

4.4. GO Term and KEGG Pathway Enrichment Analyses

For functional annotation of the DEGs, GO term enrichment analysis was performed using the online Visualization and Integrated Discovery (DAVID) software (https://david.ncifcrf.gov/) [43,44], for the three GO categories (BP, CC and MF). In addition, KEGG pathway enrichment analysis was carried out using KEGG Orthology-Based Annotation System (KOBAS) software (version 3.0, Peking, China (http://kobas.cbi.pku.edu.cn/)) [45,46]. Significant enrichment was considered for a corrected p-value (FDR) < 0.05.

4.5. PPI Network Construction and Module Analysis

The list of genes was mapped to the STRING database (http://www.string-db.org/) to construct a functional protein association network. Then, the PPI network was visualized with Cytoscape software (version 3.6.0, Washington, DC, USA) (http://www.cytoscape.org/). The degree of a node is the number of edges (interactions) incident to that node. A node is important if it links to many other nodes. The genes at the top of the degree distribution (≥90% percentile) in the network were defined as key genes (central genes). The plug-in MCODE (http://apps.cytoscape.org/apps/mcode) was used to scan the PPI network to identify densely connected regions. A p-value < 0.05 was considered statistically significant.

4.6. Cell Culture, Differentiation, and Lipid Droplet Staining

The culture and differentiation of 3T3-L1 preadipocytes were performed as previously described in Reference [47]. For lipid droplet (LD) staining, cells were washed with phosphate buffer saline (PBS) three times and then fixed in 4% paraformaldehyde for 30 min at room temperature. After washing three times with PBS, the cells were stained with a 60% filtered oil red O (Sigma, St. Louis, MO, USA) stock solution (0.3 g/100 mL of isopropanol). The cells were then rinsed three times with PBS. All images were obtained using an inverted fluorescence microscope FV500-IX71 (Olympus, Tokyo, Japan).

4.7. qRT-PCR Validation of Key Genes

Total RNA from undifferentiated and differentiated 3T3 cells was extracted using RNAiso (Takara, Dalian, China). A PrimeScriptTM RT Reagent Kit with gDNA Eraser (Takara) was used to perform reverse transcription of total RNA. A SYBR® Premix Ex TaqTM ΙΙ Kit (Takara) was used to carry out qRT-PCR with an ABI 7500 Real-Time PCR system (Applied Biosystems, Foster, CA, USA). Gapdh served as an internal reference to normalize gene expression levels via the 2−∆∆Ct method, as in Reference [48]. Some of the key genes whose expression trends during the adipogenesis of 3T3-L1 preadipocytes were known were excluded, and qRT-PCR validation was performed for the remaining genes.

4.8. Statistical Analysis

All the quantitative experiments were performed three times, and the quantitative results were expressed as the mean ± SD. Comparisons between two sets of groups were analyzed using the Student’s two-tailed t-test with GraphPad Prism 7. Statistical significance depended on a value of p < 0.05 (significant) or p < 0.01 (extremely significant).

5. Conclusions

Given the limitations of independent experiments, analyzing different datasets often yields different results, especially when performing differential expression analysis. In this study, we used the RRA method to integrate the results of five high-throughput datasets well, and we obtained consistent DEGs showing an association with adipogenesis. This work will contribute to the study of adipogenesis in the future, thus promoting our understanding of the molecular mechanisms underlying adipogenesis, and it may offer potential targets for the regulation of adipogenesis and the treatment of adipose dysfunction. Further experimental verification is needed to explore the specific functions of these DEGs.

Author Contributions

L.Z., S.Z. and L.W. conceived and designed the experiments. S.Z. and L.W. performed the experiments, analyzed the data, and wrote the manuscript. S.L., W.Z., X.M., G.C. and W.Y. mainly assisted in providing constructive suggestions for the manuscript and a language modification.

Funding

This research was funded by the National Key Research Projects (No. 2018YFD0501700), the National High Technology Development Project (No. 2013AA102505), the National Science and Technology Support Projects (No. 2015BAD03B04), the National Modern Agricultural Industry Special Program (No. CARS-37), and the Collaborative Innovation Major Projects of Yangling Demonstration Zone (No. 2017CXY-14).

Conflicts of Interest

The authors declare no conflict of interest.

Abbreviations

GEOGene expression omnibus
DEGsDifferentially expressed genes
RRARobust rank aggregation
GOGene ontology
KEGGKyoto encyclopedia of genes and genomes
PPIMCODEProtein–protein interactionMolecular complex detection

References

  1. Green, H.; Meuth, M. An established pre-adipose cell line and its differentiation in culture. Cell 1974, 3, 127–133. [Google Scholar] [CrossRef]
  2. Green, H.; Kehinde, O. Spontaneous heritable changes leading to increased adipose conversion in 3T3 cells. Cell 1976, 7, 105–113. [Google Scholar] [CrossRef]
  3. Romero, M.; Sabate-Perez, A.; Francis, V.A.; Castrillon-Rodriguez, I.; Diaz-Ramos, A.; Sanchez-Feutrie, M.; Duran, X.; Palacin, M.; Moreno-Navarrete, J.M.; Gustafson, B.; et al. TP53INP2 regulates adiposity by activating beta-catenin through autophagy-dependent sequestration of GSK3beta. Nat. Cell Biol. 2018, 20, 443–454. [Google Scholar] [CrossRef] [PubMed]
  4. Siersbaek, R.; Madsen, J.; Javierre, B.M.; Nielsen, R.; Bagge, E.K.; Cairns, J.; Wingett, S.W.; Traynor, S.; Spivakov, M.; Fraser, P.; et al. Dynamic Rewiring of Promoter-Anchored Chromatin Loops during Adipocyte Differentiation. Mol. Cell 2017, 66, 420–435. [Google Scholar] [CrossRef] [PubMed]
  5. Al, A.H.; Evano, B.; Le Digarcher, A.; Gueydan, C.; Dubois, E.; Parrinello, H.; Dantec, C.; Bouschet, T.; Varrault, A.; Journot, L. A systems-level approach to parental genomic imprinting: The imprinted gene network includes extracellular matrix genes and regulates cell cycle exit and differentiation. Genome Res. 2015, 25, 353–367. [Google Scholar]
  6. Duteil, D.; Metzger, E.; Willmann, D.; Karagianni, P.; Friedrichs, N.; Greschik, H.; Gunther, T.; Buettner, R.; Talianidis, I.; Metzger, D.; et al. LSD1 promotes oxidative metabolism of white adipose tissue. Nat. Commun. 2014, 5, 4093. [Google Scholar] [CrossRef] [PubMed] [Green Version]
  7. Mikkelsen, T.S.; Xu, Z.; Zhang, X.; Wang, L.; Gimble, J.M.; Lander, E.S.; Rosen, E.D. Comparative epigenomic analysis of murine and human adipogenesis. Cell 2010, 143, 156–169. [Google Scholar] [CrossRef] [PubMed]
  8. Kolde, R.; Laur, S.; Adler, P.; Vilo, J. Robust rank aggregation for gene list integration and meta-analysis. Bioinformatics 2012, 28, 573–580. [Google Scholar] [CrossRef] [PubMed] [Green Version]
  9. Li, W.; Xu, H.; Xiao, T.; Cong, L.; Love, M.I.; Zhang, F.; Irizarry, R.A.; Liu, J.S.; Brown, M.; Liu, X.S. MAGeCK enables robust identification of essential genes from genome-scale CRISPR/Cas9 knockout screens. Genome Biol. 2014, 15, 554. [Google Scholar] [CrossRef] [PubMed] [Green Version]
  10. Ritchie, M.E.; Phipson, B.; Wu, D.; Hu, Y.; Law, C.W.; Shi, W.; Smyth, G.K. limma powers differential expression analyses for RNA-sequencing and microarray studies. Nucleic Acids Res. 2015, 43, e47. [Google Scholar] [CrossRef] [PubMed]
  11. Love, M.I.; Huber, W.; Anders, S. Moderated estimation of fold change and dispersion for RNA-seq data with DESeq2. Genome Biol. 2014, 15, 550. [Google Scholar] [CrossRef] [PubMed]
  12. Szklarczyk, D.; Morris, J.H.; Cook, H.; Kuhn, M.; Wyder, S.; Simonovic, M.; Santos, A.; Doncheva, N.T.; Roth, A.; Bork, P.; et al. The STRING database in 2017: Quality-controlled protein-protein association networks, made broadly accessible. Nucleic Acids Res. 2017, 45, D362–D368. [Google Scholar] [CrossRef] [PubMed]
  13. Spalding, K.L.; Arner, E.; Westermark, P.O.; Bernard, S.; Buchholz, B.A.; Bergmann, O.; Blomqvist, L.; Hoffstedt, J.; Naslund, E.; Britton, T.; et al. Dynamics of fat cell turnover in humans. Nature 2008, 453, 783–787. [Google Scholar] [CrossRef] [PubMed]
  14. Chen, C.; Cui, Q.; Zhang, X.; Luo, X.; Liu, Y.; Zuo, J.; Peng, Y. Long non-coding RNAs regulation in adipogenesis and lipid metabolism: Emerging insights in obesity. Cell Signal. 2018, 51, 47–58. [Google Scholar] [CrossRef] [PubMed]
  15. Gregoire, F.M.; Smas, C.M.; Sul, H.S. Understanding adipocyte differentiation. Physiol. Rev. 1998, 78, 783–809. [Google Scholar] [CrossRef] [PubMed]
  16. Selvarajan, S.; Lund, L.R.; Takeuchi, T.; Craik, C.S.; Werb, Z. A plasma kallikrein-dependent plasminogen cascade required for adipocyte differentiation. Nat. Cell Biol. 2001, 3, 267–275. [Google Scholar] [CrossRef] [PubMed]
  17. Rosen, E.D.; MacDougald, O.A. Adipocyte differentiation from the inside out. Nat. Rev. Mol. Cell Biol. 2006, 7, 885–896. [Google Scholar] [CrossRef] [PubMed]
  18. Loftus, T.M.; Lane, M.D. Modulating the transcriptional control of adipogenesis. Curr. Opin. Genet. Dev. 1997, 7, 603–608. [Google Scholar] [CrossRef]
  19. Liu, L.; Zheng, L.D.; Zou, P.; Brooke, J.; Smith, C.; Long, Y.C.; Almeida, F.A.; Liu, D.; Cheng, Z. FoxO1 antagonist suppresses autophagy and lipid droplet growth in adipocytes. Cell Cycle 2016, 15, 2033–2041. [Google Scholar] [CrossRef] [PubMed] [Green Version]
  20. James, D.E.; Brown, R.; Navarro, J.; Pilch, P.F. Insulin-regulatable tissues express a unique insulin-sensitive glucose transport protein. Nature 1988, 333, 183–185. [Google Scholar] [CrossRef] [PubMed]
  21. Hertzel, A.V.; Bernlohr, D.A. The mammalian fatty acid-binding protein multigene family: Molecular and genetic insights into function. Trends Endocrinol. Metab. 2000, 11, 175–180. [Google Scholar] [CrossRef]
  22. Abumrad, N.A.; El-Maghrabi, M.R.; Amri, E.Z.; Lopez, E.; Grimaldi, P.A. Cloning of a rat adipocyte membrane protein implicated in binding or transport of long-chain fatty acids that is induced during preadipocyte differentiation. Homology with human CD36. J. Biol. Chem. 1993, 268, 17665–17668. [Google Scholar] [PubMed]
  23. Cases, S.; Stone, S.J.; Zhou, P.; Yen, E.; Tow, B.; Lardizabal, K.D.; Voelker, T.; Farese, R.J. Cloning of DGAT2, a second mammalian diacylglycerol acyltransferase, and related family members. J. Biol. Chem. 2001, 276, 38870–38876. [Google Scholar] [CrossRef] [PubMed]
  24. Cases, S.; Smith, S.J.; Zheng, Y.W.; Myers, H.M.; Lear, S.R.; Sande, E.; Novak, S.; Collins, C.; Welch, C.B.; Lusis, A.J.; et al. Identification of a gene encoding an acyl CoA:diacylglycerol acyltransferase, a key enzyme in triacylglycerol synthesis. Proc. Natl. Acad. Sci. USA 1998, 95, 13018–13023. [Google Scholar] [CrossRef] [PubMed] [Green Version]
  25. Lardizabal, K.D.; Mai, J.T.; Wagner, N.W.; Wyrick, A.; Voelker, T.; Hawkins, D.J. DGAT2 is a new diacylglycerol acyltransferase gene family: Purification, cloning, and expression in insect cells of two polypeptides from Mortierella ramanniana with diacylglycerol acyltransferase activity. J. Biol. Chem. 2001, 276, 38862–38869. [Google Scholar] [CrossRef] [PubMed]
  26. Suzuki, H.; Kawarabayasi, Y.; Kondo, J.; Abe, T.; Nishikawa, K.; Kimura, S.; Hashimoto, T.; Yamamoto, T. Structure and regulation of rat long-chain acyl-CoA synthetase. J. Biol. Chem. 1990, 265, 8681–8685. [Google Scholar] [PubMed]
  27. Reilich, P.; Horvath, R.; Krause, S.; Schramm, N.; Turnbull, D.M.; Trenell, M.; Hollingsworth, K.G.; Gorman, G.S.; Hans, V.H.; Reimann, J.; et al. The phenotypic spectrum of neutral lipid storage myopathy due to mutations in the PNPLA2 gene. J. Neurol. 2011, 258, 1987–1997. [Google Scholar] [CrossRef] [PubMed]
  28. Ghosh, A.K.; Ramakrishnan, G.; Chandramohan, C.; Rajasekharan, R. CGI-58, the causative gene for Chanarin-Dorfman syndrome, mediates acylation of lysophosphatidic acid. J. Biol. Chem. 2008, 283, 24525–24533. [Google Scholar] [CrossRef] [PubMed]
  29. Song, N.J.; Kim, S.; Jang, B.H.; Chang, S.H.; Yun, U.J.; Park, K.M.; Waki, H.; Li, D.Y.; Tontonoz, P.; Park, K.W. Small Molecule-Induced Complement Factor D (Adipsin) Promotes Lipid Accumulation and Adipocyte Differentiation. PLoS ONE 2016, 11, e162228. [Google Scholar] [CrossRef] [PubMed]
  30. Meier, U.; Gressner, A.M. Endocrine regulation of energy metabolism: Review of pathobiochemical and clinical chemical aspects of leptin, ghrelin, adiponectin, and resistin. Clin. Chem. 2004, 50, 1511–1525. [Google Scholar] [CrossRef] [PubMed]
  31. Zhao, D.; Li, Q.; Liu, M.; Ma, W.; Zhou, T.; Xue, C.; Cai, X. Substrate stiffness regulated migration and invasion ability of adenoid cystic carcinoma cells via RhoA/ROCK pathway. Cell. Prolif. 2018, 51, e12442. [Google Scholar] [CrossRef] [PubMed]
  32. Moustafa, P.E.; Abdelkader, N.F.; El, A.S.; El-Shabrawy, O.A.; Zaki, H.F. Extracellular Matrix Remodeling and Modulation of Inflammation and Oxidative Stress by Sulforaphane in Experimental Diabetic Peripheral Neuropathy. Inflammation 2018, 41, 1460–1476. [Google Scholar] [CrossRef] [PubMed]
  33. Chavey, C.; Mari, B.; Monthouel, M.N.; Bonnafous, S.; Anglard, P.; Van Obberghen, E.; Tartare-Deckert, S. Matrix metalloproteinases are differentially expressed in adipose tissue during obesity and modulate adipocyte differentiation. J. Biol. Chem. 2003, 278, 11888–11896. [Google Scholar] [CrossRef] [PubMed]
  34. Bouloumie, A.; Sengenes, C.; Portolan, G.; Galitzky, J.; Lafontan, M. Adipocyte produces matrix metalloproteinases 2 and 9: Involvement in adipose differentiation. Diabetes 2001, 50, 2080–2086. [Google Scholar] [CrossRef] [PubMed]
  35. Lee, J.H.; Baek, S.Y.; Jang, E.J.; Ku, S.K.; Kim, K.M.; Ki, S.H.; Kim, C.E.; Park, K.I.; Kim, S.C.; Kim, Y.W. Oxyresveratrol ameliorates nonalcoholic fatty liver disease by regulating hepatic lipogenesis and fatty acid oxidation through liver kinase B1 and AMP-activated protein kinase. Chem. Biol. Interact. 2018, 289, 68–74. [Google Scholar] [CrossRef] [PubMed]
  36. Hong, C.; Tontonoz, P. Liver X receptors in lipid metabolism: Opportunities for drug discovery. Nat. Rev. Drug Discov. 2014, 13, 433–444. [Google Scholar] [CrossRef] [PubMed]
  37. Beale, E.G.; Hammer, R.E.; Antoine, B.; Forest, C. Disregulated glyceroneogenesis: PCK1 as a candidate diabetes and obesity gene. Trends Endocrinol. Metab. 2004, 15, 129–135. [Google Scholar] [CrossRef] [PubMed]
  38. Chang, H.C.; Lane, M.D. The enzymatic carboxylation of phosphoenolpyruvate. II. Purification and properties of liver mitochondrial phosphoenolpyruvate carboxykinase. J. Biol. Chem. 1966, 241, 2413–2420. [Google Scholar] [PubMed]
  39. Beale, E.G.; Harvey, B.J.; Forest, C. PCK1 and PCK2 as candidate diabetes and obesity genes. Cell Biochem. Biophys. 2007, 48, 89–95. [Google Scholar] [CrossRef] [PubMed]
  40. Kitamura, T.; Takagi, S.; Naganuma, T.; Kihara, A. Mouse aldehyde dehydrogenase ALDH3B2 is localized to lipid droplets via two C-terminal tryptophan residues and lipid modification. Biochem. J. 2015, 465, 79–87. [Google Scholar] [CrossRef] [PubMed] [Green Version]
  41. Kim, D.; Langmead, B.; Salzberg, S.L. HISAT: A fast spliced aligner with low memory requirements. Nat. Methods 2015, 12, 357–360. [Google Scholar] [CrossRef] [PubMed]
  42. Liao, Y.; Smyth, G.K.; Shi, W. featureCounts: An efficient general purpose program for assigning sequence reads to genomic features. Bioinformatics 2014, 30, 923–930. [Google Scholar] [CrossRef] [PubMed]
  43. Huang, D.W.; Sherman, B.T.; Lempicki, R.A. Systematic and integrative analysis of large gene lists using DAVID bioinformatics resources. Nat. Protoc. 2009, 4, 44–57. [Google Scholar] [CrossRef] [PubMed]
  44. Huang, D.W.; Sherman, B.T.; Lempicki, R.A. Bioinformatics enrichment tools: Paths toward the comprehensive functional analysis of large gene lists. Nucleic Acids Res. 2009, 37, 1–13. [Google Scholar] [CrossRef] [PubMed]
  45. Wu, J.; Mao, X.; Cai, T.; Luo, J.; Wei, L. KOBAS server: A web-based platform for automated annotation and pathway identification. Nucleic Acids Res. 2006, 34, W720–W724. [Google Scholar] [CrossRef] [PubMed]
  46. Xie, C.; Mao, X.; Huang, J.; Ding, Y.; Wu, J.; Dong, S.; Kong, L.; Gao, G.; Li, C.Y.; Wei, L. KOBAS 2.0: A web server for annotation and identification of enriched pathways and diseases. Nucleic Acids Res. 2011, 39, W316–W322. [Google Scholar] [CrossRef] [PubMed]
  47. Mi, L.; Chen, Y.; Zheng, X.; Li, Y.; Zhang, Q.; Mo, D.; Yang, G. MicroRNA-139-5p Suppresses 3T3-L1 Preadipocyte Differentiation Through Notch and IRS1/PI3K/Akt Insulin Signaling Pathways. J. Cell Biochem. 2015, 116, 1195–1204. [Google Scholar] [CrossRef] [PubMed]
  48. Livak, K.J.; Schmittgen, T.D. Analysis of relative gene expression data using real-time quantitative PCR and the 2(-Delta Delta C(T)) Method. Methods 2001, 25, 402–408. [Google Scholar] [CrossRef] [PubMed]
Figure 1. Hierarchical clustering heatmap of the top 20 up- and down-regulated differentially expressed genes (DEGs) screened in each Gene Expression Omnibus (GEO) dataset. (a) GSE20696 data, (b) GSE93637 data, (c) GSE50934 data, (d) GSE95533 data, and (e) GSE50612 data. Each row represents one gene, and each column represents one sample. Red indicates that the expression of genes is relatively upregulated, and green indicates that the expression of genes is relatively downregulated.
Ijms 19 03557 g001
Figure 2. Heatmap of the top 20 up- and down-regulated DEGs in the integrated analysis. Each row represents one gene, and each column represents one dataset. Red indicates that the expression of genes is relatively upregulated, and green indicates that the expression of genes is relatively downregulated. The number in each rectangle represents the value of log2FC.
Ijms 19 03557 g002
Figure 3. Distribution of genes that are up- and down-regulated during adipogenesis for different GO biological processes.
Ijms 19 03557 g003
Figure 4. Distribution of up- and down-regulated genes associated with adipogenesis in different KEGG pathways. The upregulated genes (red), downregulated genes (green), and pathway nodes (yellow) are represented by circles.
Ijms 19 03557 g004
Figure 5. Protein–protein interaction (PPI) network construction and module analysis of DEGs associated with adipogenesis. (a) Using Cytoscape software, the PPI network was visualized (isolated nodes were removed). The node size represents the node degree (a larger size indicates a higher degree). The width and transparency of the edge indicate the combined score of the edge (a wider or more opaque edge indicates a higher combined score). (b) Top 30 genes with the highest degrees in the PPI network. (cf) Molecular Complex Detection (MCODE) module screening for the DEGs, including module 1 (score = 11), module 2 (score = 6), module 3 (score = 5.467), and module 4 (score = 4.6).
Ijms 19 03557 g005
Figure 6. Verification of differential expression of key genes during 3T3-L1 preadipocyte differentiation. (a) Undifferentiated (Day 0) and differentiated (Day 8, Oil red O staining) 3T3-L1 cells under the induced differentiation process. (b) Relative expression levels of potential key genes were measured in undifferentiated and differentiated 3T3-L1 cells by qRT-PCR. Three independent experiments were performed for all of these groups, and the quantitative results are expressed as the mean ± SD of three independent experiments. ** indicates p < 0.01.
Ijms 19 03557 g006
Table 1. Undifferentiated and differentiated 3T3-L1 cell samples from the NCBI Gene Expression Omnibus (GEO) database used in this study.
ReferenceGEOPlatformStudy TypeDifferentiation Stage of SamplesNumber of DEGs
(Up/Down)
UndifferentiatedDifferentiated
Mikkelsen, T.S. et al. (2010) [7]GSE20696GPL1261microarrayGSM519581
GSM519582
GSM519585
GSM519586
2898
(1425/1473)
Romero, M. et al. (2018) [3]GSE93637GPL1261microarrayGSM2459304
GSM2459305
GSM2459306
GSM2459310
GSM2459311
GSM2459312
GSM2459313
1119
(591/528)
Duteil, D. et al. (2014) [6]GSE50934GPL13112RNA-seqGSM1232686
GSM1232687
GSM1232688
GSM1232689
GSM1232690
GSM1232691
2685
(1552/1133)
Siersbæk, R. et al. (2017) [4]GSE95533GPL18480RNA-seqGSM2515916
GSM2515917
GSM2515922
GSM2515923
4416
(2197/2219)
Al, A.H. et al. (2015) [5]GSE50612GPL13112RNA-seqGSM1224678
GSM1224679
GSM1224682
GSM1224683
3966
(2170/1796)
Table 2. Top 20 up- and down-regulated DEGs identified during adipogenesis via integrated analysis.
Top 20 Upregulated GenesTop 20 Downregulated Genes
Symbollog2FCp-ValueCorrected p-ValueSymbollog2FCp-ValueCorrected p-Value
Cidec8.8158052.15 × 10−155.34 × 10⁻¹¹Bnc1−4.277877.38 × 10−121.83 × 10⁻⁷
Retn8.505115.14 × 10−151.28 × 10⁻¹⁰Pcdh18−3.568378.39 × 10−112.09 × 10⁻⁶
G0s28.3590122.39 × 10−145.94 × 10⁻¹⁰Nrg1−3.525921.30 × 10−103.24 × 10⁻⁶
Adipoq9.0121891.81 × 10−134.51 × 10⁻⁹Ogn−3.955312.77 × 10−106.89 × 10⁻⁶
Cfd8.4416241.81 × 10−134.51 × 10⁻⁹Mmp9−3.646023.46 × 10−108.60 × 10⁻⁶
Adig7.2296261.17 × 10−122.90 × 10⁻⁸Tubb2b−2.966983.77 × 10−109.37 × 10⁻⁶
Orm17.2807639.69 × 10−122.41 × 10⁻⁷Plat−3.957924.36 × 10−101.09 × 10⁻⁵
Dgat26.0662811.06 × 10−112.63 × 10⁻⁷Slit2−3.35687.55 × 10−101.88 × 10⁻⁵
Mc2r6.1865461.10 × 10−112.75 × 10⁻⁷Rerg−3.956061.10 × 10−92.73 × 10⁻⁵
Lgals126.8737061.67 × 10−114.15 × 10⁻⁷Thbs1−3.277641.16 × 10−92.87 × 10⁻⁵
Mrap7.5632152.17 × 10−115.39 × 10⁻⁷Nfkbie−2.843091.82 × 10−94.53 × 10⁻⁵
Acsl16.0167733.73 × 10−119.29 × 10⁻⁷Il17rd−3.023512.32 × 10−95.77 × 10⁻⁵
Wfdc217.6326374.86 × 10−111.21 × 10⁻⁶Il1rl1−3.706072.50 × 10−96.21 × 10⁻⁵
Syn25.0304088.88 × 10−112.21 × 10⁻⁶Tnc−3.786024.22 × 10−91.05 × 10⁻⁴
Car35.0213591.14 × 10−102.83 × 10⁻⁶Ptger4−3.158854.22 × 10−91.05 × 10⁻⁴
Fabp46.2576841.34 × 10−103.32 × 10⁻⁶Fbn1−2.965344.99 × 10−91.24 × 10⁻⁴
Cd367.1152361.48 × 10−103.69 × 10⁻⁶Atp1b1−4.182695.09 × 10−91.27 × 10⁻⁴
Hp6.7094481.60 × 10−103.98 × 10⁻⁶Ptprv−3.410986.87 × 10−91.71 × 10⁻⁴
Pnpla25.0310891.77 × 10−104.40 × 10⁻⁶Siglecg−3.889487.62 × 10−91.90 × 10⁻⁴
Gpd16.7527932.03 × 10−105.05 × 10⁻⁶Pla2g7−3.914157.64 × 10−91.90 × 10⁻⁴
Table 3. Gene Ontology (GO) term enrichment analysis of DEGs associated with adipogenesis.
DEGsTermCategoryCountFDR
upbrown fat cell differentiationBP191.63 × 10−23
lipid metabolic processBP273.04 × 10−8
oxidation-reduction processBP326.77 × 10−8
metabolic processBP233.03 × 10−5
fat cell differentiationBP104.76 × 10−4
lipid storageBP78.27 × 10−4
triglyceride catabolic processBP64.12 × 10−3
glucose homeostasisBP103.70 × 10−2
white fat cell differentiationBP54.44 × 10−2
mitochondrionCC529.65 × 10−8
lipid particleCC122.11 × 10−7
cytosolCC428.61 × 10−3
intracellular membrane-bounded organelleCC241.60 × 10−2
mitochondrial membraneCC92.25 × 10−2
oxidoreductase activityMF273.98 × 10−6
downcell adhesionBP208.40 × 10−6
positive regulation of cell-substrate adhesionBP71.19 × 10−3
positive regulation of neuron projection developmentBP91.74 × 10−2
extracellular regionCC514.64 × 10−14
proteinaceous extracellular matrixCC242.78 × 10−13
extracellular matrixCC211.28 × 10−10
extracellular spaceCC411.82 × 10−9
basement membraneCC114.33 × 10−6
calcium ion bindingMF244.46 × 10−6
integrin bindingMF91.34 × 10−3
heparin bindingMF132.56 × 10−6
Table 4. Kyoto Encyclopedia of Genes and Genomes (KEGG) pathway enrichment analysis of DEGs in adipogenesis.
DEGsTermCountFDR
upMetabolic pathways421.34 × 10−16
PPAR signaling pathway153.33 × 10−15
Regulation of lipolysis in adipocytes91.20 × 10−8
AMPK signaling pathway105.06 × 10−7
Valine, leucine and isoleucine degradation73.31 × 10−6
Non-alcoholic fatty liver disease (NAFLD)92.05 × 10⁻⁵
Propanoate metabolism55.31 × 10−5
Glycerolipid metabolism65.31 × 10−5
Metabolism of xenobiotics by cytochrome P45067.77 × 10−5
Glycolysis/Gluconeogenesis67.77 × 10−5
Pyruvate metabolism58.57 × 10−5
Nitrogen metabolism48.57 × 10−5
Insulin resistance78.57 × 10−5
Fat digestion and absorption58.57 × 10−5
Adipocytokine signaling pathway68.90 × 10−5
Carbon metabolism71.09 × 10−4
Proximal tubule bicarbonate reclamation41.63 × 10−4
Fatty acid degradation51.65 × 10−4
Glucagon signaling pathway64.20 × 10−4
Biosynthesis of amino acids51.26 × 10−3
downMalaria47.99 × 10−3
Transcriptional misregulation in cancer67.99 × 10−3
Rheumatoid arthritis42.24 × 10−2
Bladder cancer32.67 × 10−2
TNF signaling pathway43.24 × 10−2
Focal adhesion53.24 × 10−2
Endocrine and other factor-regulated calcium reabsorption33.24 × 10−2
Glycosaminoglycan biosynthesis—keratan sulfate23.51 × 10−2
Synaptic vesicle cycle33.51 × 10−2
FoxO signaling pathway43.51 × 10−2
Bile secretion34.35 × 10−2
Table 5. Enrichment analysis of the top 30 genes with the highest degrees.
MethodTermCountFDRGenes
GOmetabolic process103.98 × 10−5Dbt, Aldh1l1, Acsl1, Acadm, Bckdhb, Aldh3b2, Pnpla2, Aldh1a7, Pdhb, Lipe
oxidation-reduction process91.12 × 10−2Ldha, Aldh1l1, Acadm, Adhfe1, Adh1, Bckdhb, Aldh3b2, Aldh1a7, Pdhb
lipid storage41.51 × 10−2Dgat1, Cd36, Dgat2, Pnpla2
brown fat cell differentiation43.07 × 10−2Slc2a4, Pparg, Fabp4, Adipoq
negative regulation of sequestering of triglyceride33.54 × 10−2Pparg, Abhd5, Pnpla2
KEGGPPAR signaling pathway82.89 × 10−13Acadm, Adipoq, Fabp4, Cd36, Acsl1, Pck1, Pparg, Nr1h3
Metabolic pathways131.61 × 10−10Acadm, Adh1, Bckdhb, Dbt, Dgat1, Acsl1, Ldha, Pck1, Aldh1a7, Pnpla2, Dgat2, Pdhb, Aldh3b2
AMPK signaling pathway61.88 × 10−8Adipoq, Cd36, Lipe, Pck1, Pparg, Slc2a4
Glycolysis/Gluconeogenesis53.90 × 10−8Adh1, Ldha, Pck1, Pdhb, Aldh3b2
Adipocytokine signaling pathway55.04 × 10−8Adipoq, Cd36, Acsl1, Pck1, Slc2a4

