Article

Large-Scale Simulation of the Phenotypical Variability Induced by Loss-of-Function Long QT Mutations in Human Induced Pluripotent Stem Cell Cardiomyocytes

1
Faculty of Biomedical Sciences and Engineering, BioMediTech Institute, Tampere University of Technology, FI-33720 Tampere, Finland
2
Department of Anatomy and Embryology, Leiden University Medical Center, 2333 ZA Leiden, The Netherlands
3
Department of Electrical, Electronic and Information Engineering “Guglielmo Marconi”, University of Bologna, 40126 Cesena, Italy
*
Author to whom correspondence should be addressed.
Int. J. Mol. Sci. 2018, 19(11), 3583; https://doi.org/10.3390/ijms19113583
Submission received: 5 October 2018 / Revised: 8 November 2018 / Accepted: 8 November 2018 / Published: 13 November 2018
(This article belongs to the Special Issue Disease Modeling Using Human Induced Pluripotent Stem Cells)

Abstract

:
Loss-of-function long QT (LQT) mutations inducing LQT1 and LQT2 syndromes have been successfully translated to human induced pluripotent stem cell-derived cardiomyocytes (hiPSC-CMs) used as disease-specific models. However, their in vitro investigation mainly relies on experiments using small numbers of cells. This is especially critical when working with cells as heterogeneous as hiPSC-CMs. We aim (i) to investigate in silico the ionic mechanisms underlying LQT1 and LQT2 hiPSC-CM phenotypic variability, and (ii) to enable massive in silico drug tests on mutant hiPSC-CMs. We combined (i) data of control and mutant slow and rapid delayed rectifying K+ currents, IKr and IKs respectively, (ii) a recent in silico hiPSC-CM model, and (iii) the population of models paradigm to generate control and mutant populations for LQT1 and LQT2 cardiomyocytes. Our four populations contain from 1008 to 3584 models. In line with the experimental in vitro data, mutant in silico hiPSC-CMs showed prolonged action potential (AP) duration (LQT1: +14%, LQT2: +39%) and large electrophysiological variability. Finally, the mutant populations were split into normal-like hiPSC-CMs (with action potential duration similar to control) and at risk hiPSC-CMs (with clearly prolonged action potential duration). At risk mutant hiPSC-CMs carried higher expression of L-type Ca2+, lower expression of IKr and increased sensitivity to quinidine as compared to mutant normal-like hiPSC-CMs, resulting in AP abnormalities. In conclusion, we were able to reproduce the two most common LQT syndromes with large-scale simulations, which enable investigating biophysical mechanisms difficult to assess in vitro, e.g., how variations of ion current expressions in a physiological range can impact on AP properties of mutant hiPSC-CMs.

Graphical Abstract

1. Introduction

The development of induced pluripotent stem cell (iPSC) technology provides the opportunity for generating and culturing iPSC-derived cardiomyocytes obtained from human material (hiPSC-CMs). An important application of hiPSC-CMs is the assessment of drug cardiotoxicity [1]. In recent years, their use in the field of safety pharmacology has been supported by comprehensive in vitro proarrhythmia assay (CiPA), which aims to combine the in vitro drug assays on hiPSC-CMs with in silico simulations [2]. Furthermore, hiPSC-CMs have been able to recapitulate the phenotype of several inherited cardiac arrhythmia syndromes such as LQT1 [3], LQT2 [4,5], LQT3 [6], LQT14 [7], catecholaminergic polymorphic ventricular tachycardia [8], hypertrophic cardiomyopathy [9] and Brugada Syndrome [10].
In 2013, we published the first in silico hiPSC-CMs model [11], based on our previous model of cardiomyocyte derived from human embryonic stem cells [12] and on the experimental data by Ma et al. [13]. As recently acknowledged by the FDA [14] and the pharmaceutical industry, in vitro tests on cardiac cells, in particular hiPSC-CMs, certainly benefits from the use of such in silico models of the cardiac cellular electrophysiology [15]. This is true for the screening of new compounds to be tested for cardiac safety, as well as for the study of the ion channel biophysical properties underlying the electrophysiology of control and diseased cells. The main advantage of integrating reliable in silico models in the standard in vitro laboratory practice is the possibility of running huge amount of simulations in shorter time than in vitro experiments. Moreover, in silico models are white boxes, therefore all the internal mechanisms representing the cellular biophysics can be observed without altering the system behavior and be tuned or modified in an easier way than a real biological system. Specifically for hiPSC-CMs, the use of advanced in silico modeling techniques are extremely important to manage one of the main hiPSC-CM challenges, i.e., their electrophysiological variability observed in vitro [16]. The population of in silico models [17,18] approach enables the development of a huge ensemble of in silico models which, after experimental calibration, mimics the behavior of the in vitro population of cells, with all the aforementioned advantages of model usage. In this case, the added value consists of having an in silico cell population that is way larger than whatever population could be obtained or analyzed in vitro. As a matter of fact, the literature presents electrophysiological investigations on hiPSC-CMs performed on samples containing only a few cells, while an in silico population contains at least hundreds of models. We recently used this modeling technique to investigate the LQT3 syndrome effect on in silico hiPSC-CMs and to predict the effects of two drugs, commonly used in this syndrome treatment, also elucidating possible mechanisms for the development of adverse drug effects [18]. The same approach was used also by Passini et al. [19] for a comprehensive in silico drug trial on 62 compounds, on in silico populations of adult ventricular cardiomyocytes, which obtained higher accuracy than studies involving animal models.
The aim of this work consist of exploiting a recently published model of the electrophysiology of hiPSC-CMs (Paci2018) [20] and the population of in silico models approach to replicate the behavior of the two most common LQT forms: LQT1 and LQT2. Both forms of LQT can result in a dangerous prolongation of the duration of the cardiomyocyte action potential (AP), which makes the cells prone to develop arrhythmias. At the whole organ level, this reflects in a prolongation of the QT segment in the electrocardiogram, which is associated with dramatic outcomes, such as syncope, and sudden cardiac death due to ventricular tachyarrhythmias [21]. LQT1 is associated with loss-of-function mutations in the KCNQ1 gene, which encodes for the α-subunit of the channel conducting the slowly activating delayed rectifier potassium current (IKs), while LQT2 arises from loss-of-function mutations in KCNH2 (also known as hERG), encoding the rapidly activating delayed rectifier potassium current (IKr). In this work, we focused our in silico analysis on the KCNQ1 R190Q mutation associated with LQT1 and the KCNH2 N996I mutation associated with LQT2, both already in vitro characterized in hiPSC-CMs [3,4]. Together with our previous work on LQT3 [18], this work covers the spectrum of the most common forms of LQT syndromes and their in silico simulations based on populations of hiPSC-CMs, remarking the importance of the synergy of in vitro and in silico experiments for disease modeling using hiPSCs.

2. Results

In this work, we produced four populations of in silico hiPSC-CM models showing spontaneous electrical activity, as detailed in Section 4.4 and Section 4.5 of Materials and Methods. In particular, the LQT1_CTRL and LQT1_MUT populations were based on the Paci2018 model [20], where the original IKs was replaced with the control and mutant IKs from Moretti et al. [3]. Likewise, in the LQT2_CTRL and LQT2_MUT populations, IKr was replaced with the control and mutant IKr described in Bellin et al. [4]. To facilitate the comparison with the in vitro experiments, LQT2_CTRL and LQT2_MUT were also paced at 60 bpm. To generate the LQT1_CTRL and the LQT2_CTRL populations, we sampled thirteen parameters in the baseline model. The sampled parameters are the maximum conductances/currents of fast and late Na+ currents (INa, INaL), funny current (If), L-type Ca2+ current (ICaL), IKs, IKr, inward rectifying K+ current (IK1), transient outward K+ current (Ito), Na+/Ca2+ exchanger (INCX), Na+/K+ pump (INaK), sarcolemmal Ca2+ pump (IpCa), SERCA pump (ISERCA) and RyR-sensitive Ca2+ release from sarcoplasmic reticulum (IRyR). Each parameter was sampled in the range [0.5; 2] of its nominal value from [20], thus obtaining two random populations. Each random population was then calibrated using AP biomarker values experimentally recorded on spontaneous hiPSC-CM APs, thus obtaining the populations LQT1_CTRL and LQT2_CTRL. A more detailed description of this method is reported in Section 4 and a summary of this approach is reported in Figure S1. The number of models included in each population is reported in Table 1.

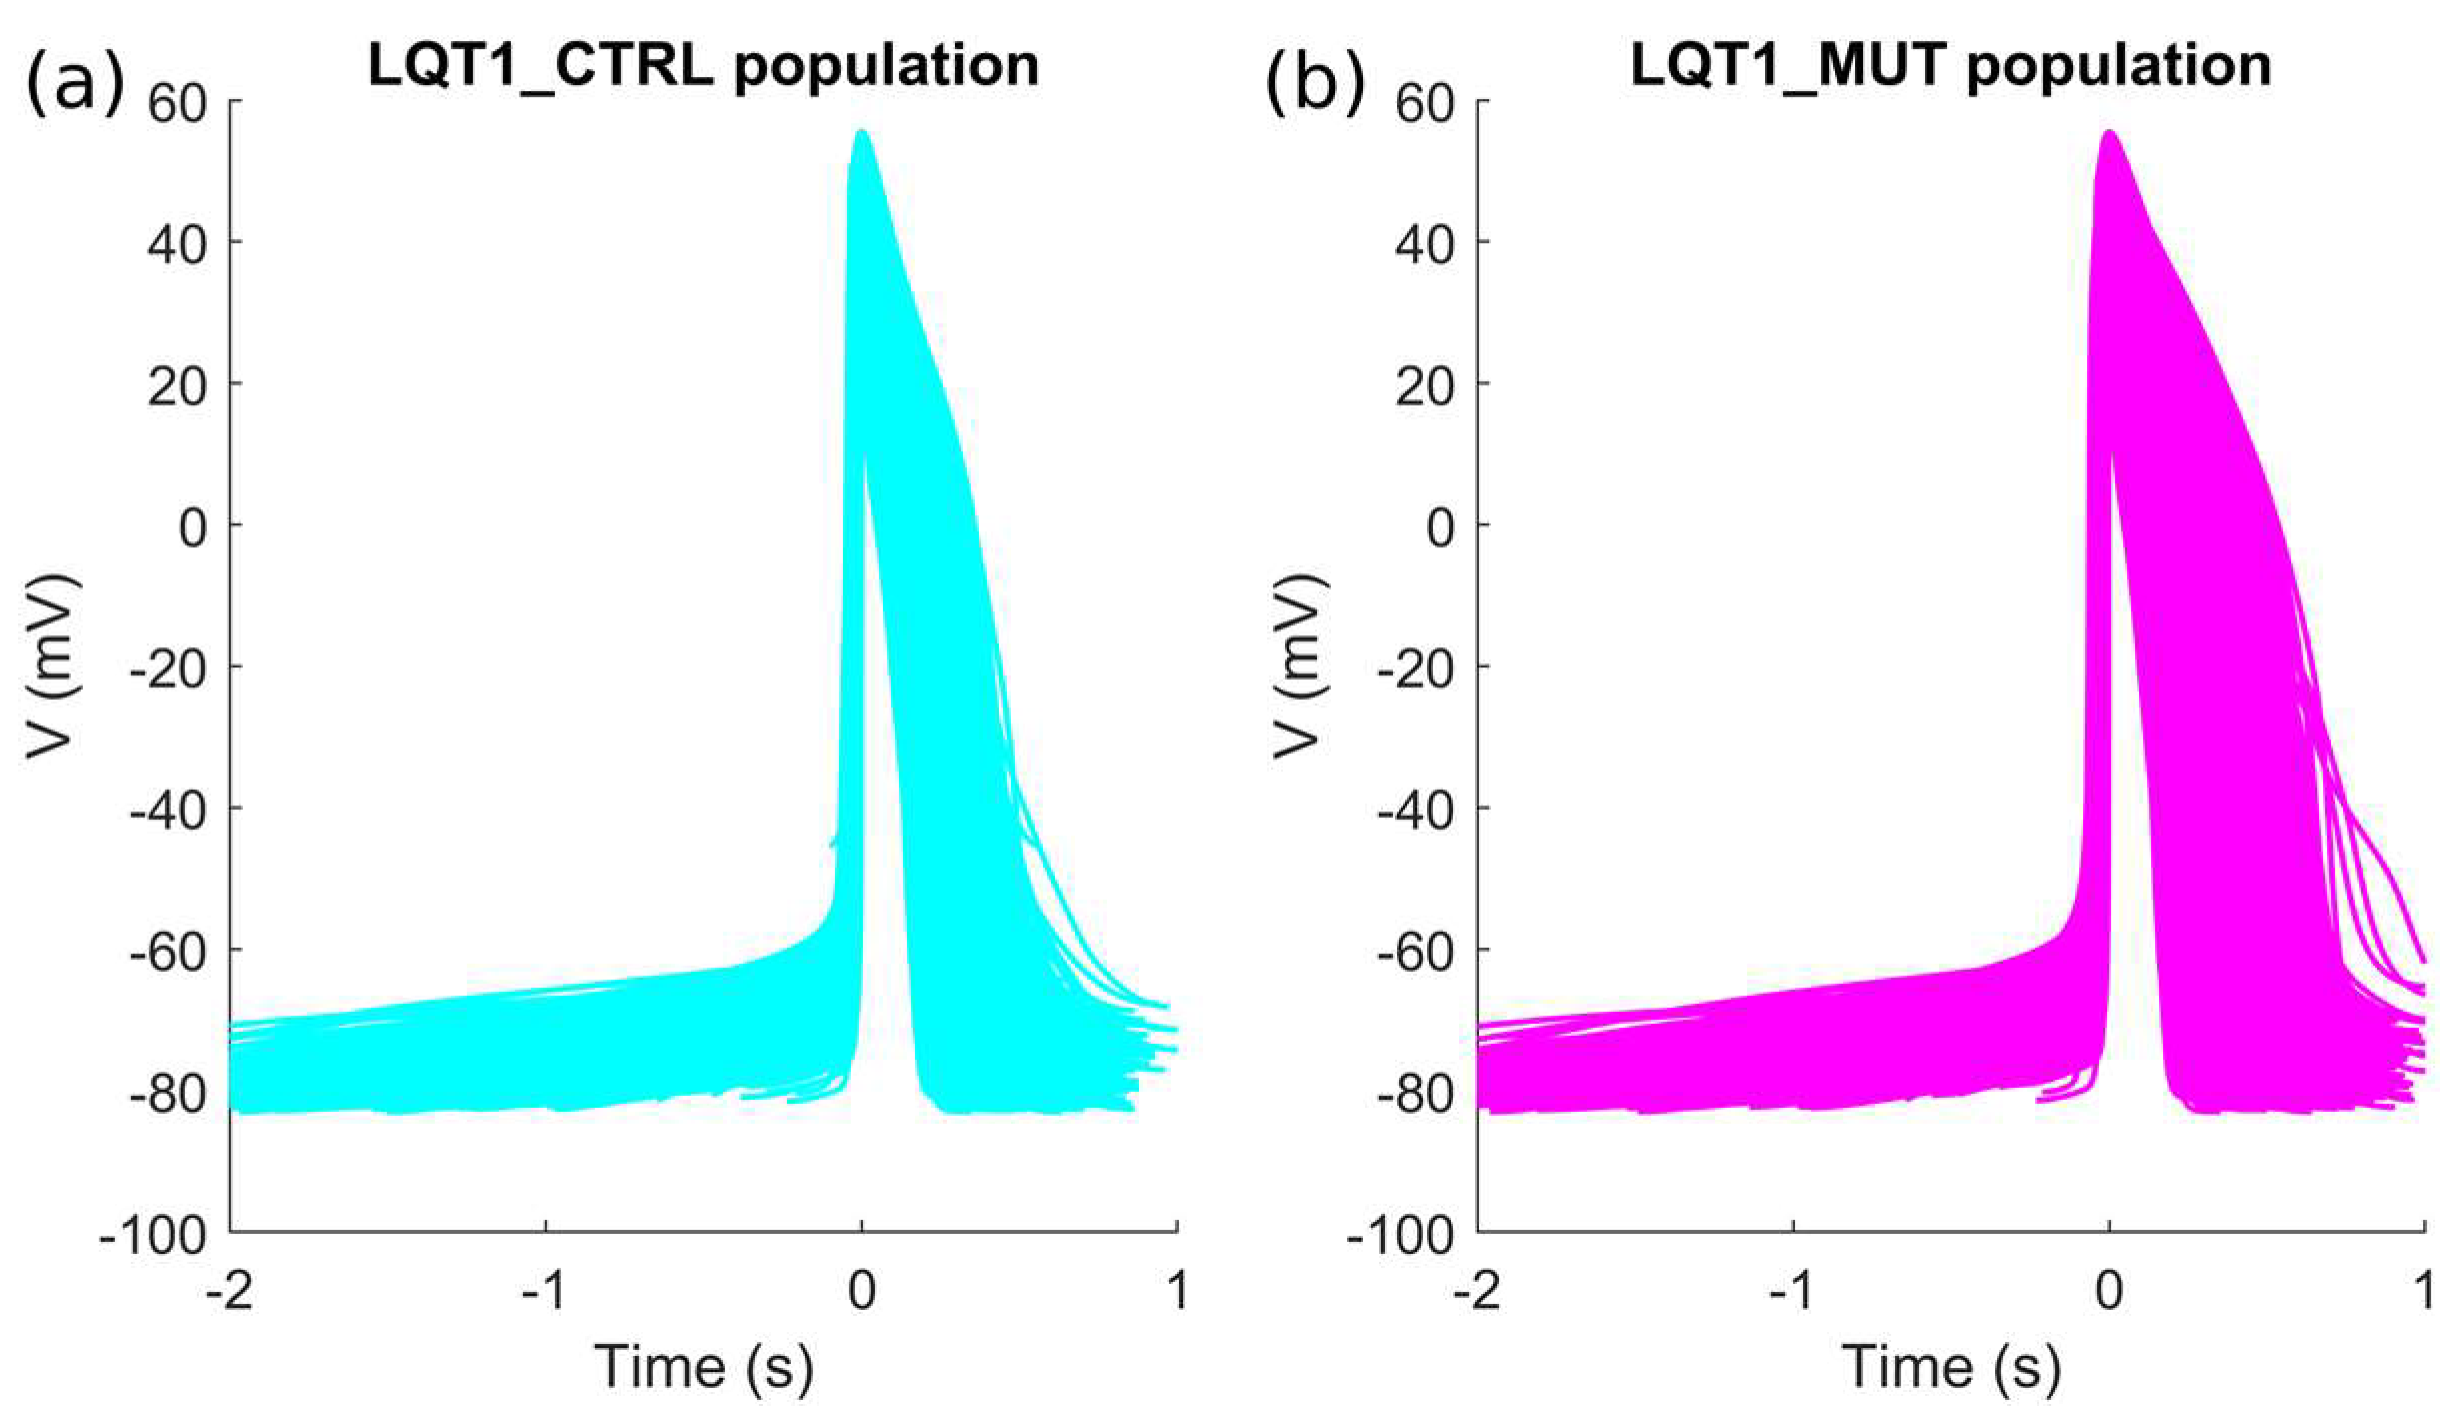
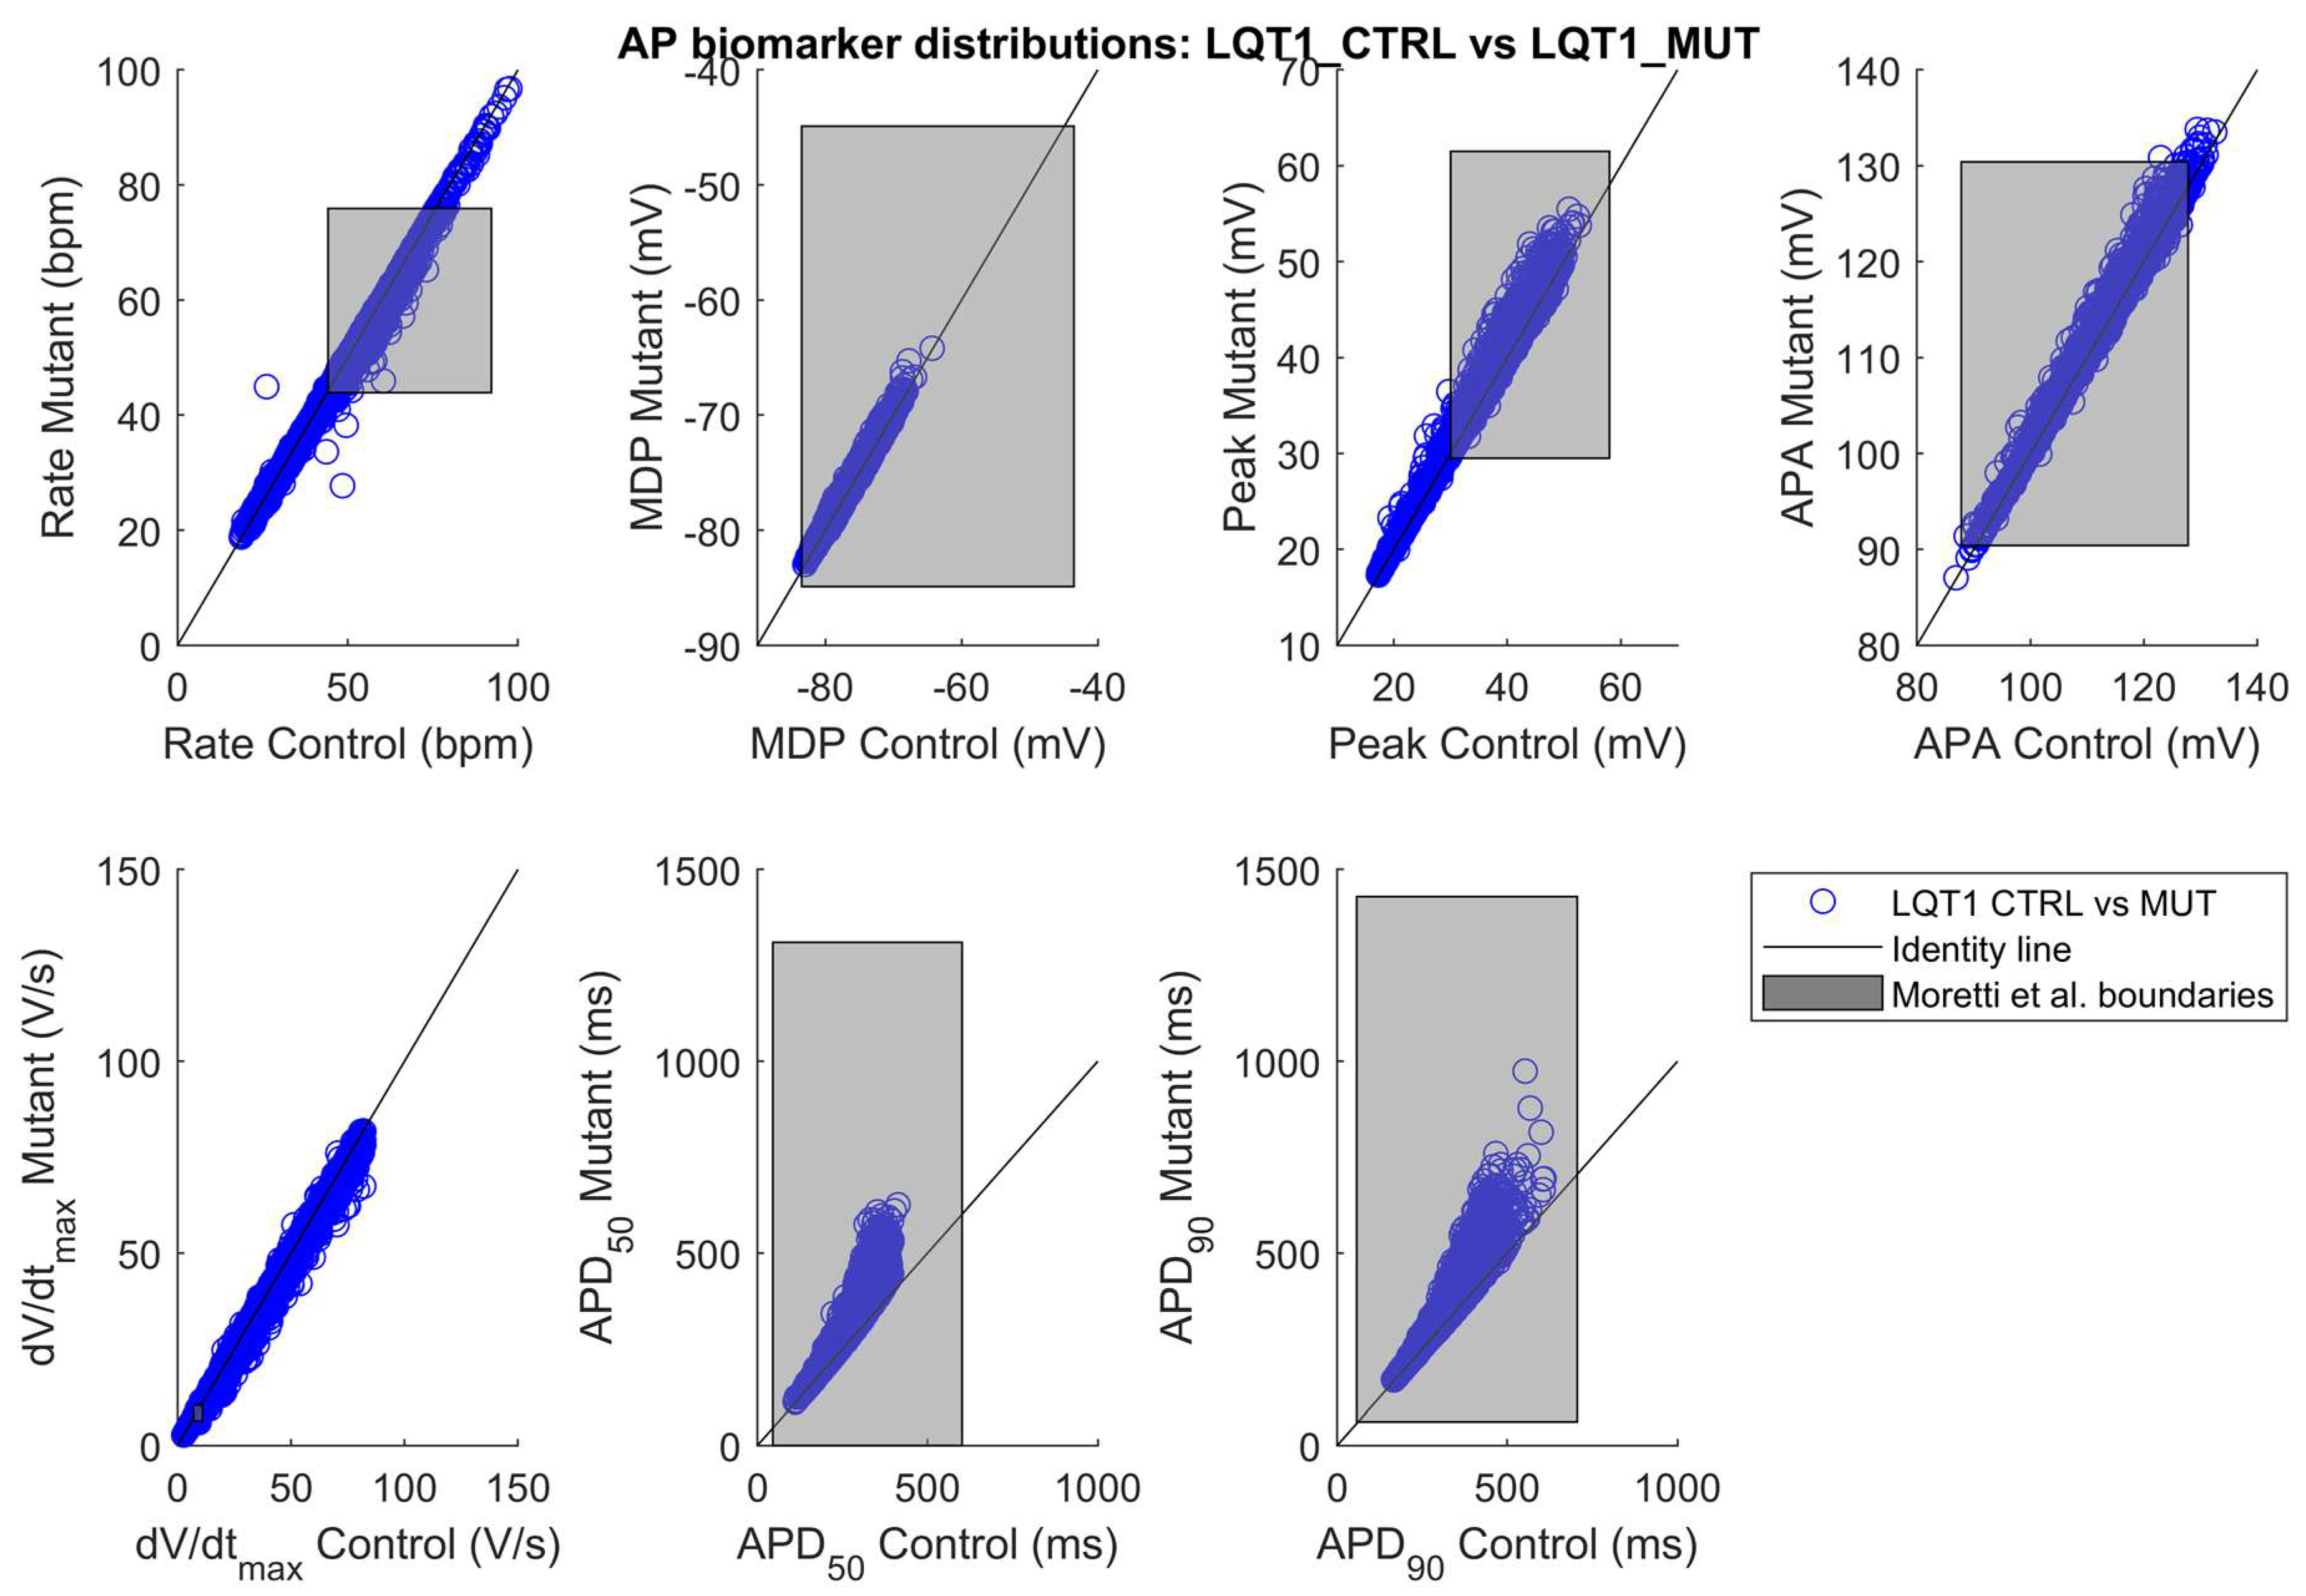
2.1. The Control and the Mutant LQT1 Populations

Out of the initial 10,000 parameter sets (i.e., 10,000 putative/candidate cell models) obtained by Latin Hypercube sampling, only 3584 produced models which satisfied the experimental calibration represented by the filtering conditions listed in Section 4.4. APs from the 3584 hiPSC-CM models included in the LQT1_CTRL population are shown in Figure 1a and Figure S2a. After “switching on” the mutation in the 3584 models, we obtained the LQT1_MUT population, which contains 3238 models. 346 models were not included in the LQT1_MUT population for one or more of the reasons listed in Section 4.5. The APs produced by the LQT1_MUT population are shown in Figure 1b and Figure S2b, from which an overall AP prolongation can be appreciated. Figure 2 compares the AP biomarkers computed on the spontaneous APs included in LQT1_CTRL (cyan) and LQT1_MUT (magenta). Clearly, the mutant population shows considerably prolonged APs. In Figure 3, we report the scatter plots of the AP biomarkers in LQT1_CTRL vs. the AP biomarkers in LQT1_MUT. The grey rectangles were built using the AP biomarkers reported in Table 2, to show how our populations cover the biomarker space from the Moretti 2010 dataset (see Table 2) [3]. For each AP biomarker, the lower bound is computed as mean—2SD and the upper bound as mean + 2SD. Of note, such boundaries were not used to calibrate the LQT1_MUT population (since we turned on the mutation on all the 3584 models of LQT1_CTRL), but they are here reported for comparison. The AP biomarkers which are mainly affected by the LQT1 mutation are the AP duration at 50% of repolarization (APD50) and the AP duration at 90% of repolarization (APD90). In particular, the longer is the AP in control conditions, the longer is the AP prolongation induced by the mutation, as shown by the clouds of APD50 and APD90 points that detach from the identity lines for long control APD values. An alternative representation of the AP biomarker distributions in LQT1_CTRL and LQT1_MUT is reported in Figure S3. Finally, Figure 4 reports the distribution of the APD90 changes expressed as percent of the control APD90 (ΔAPD90%). The average simulated ΔAPD90% is +14%, while the experimental one is +95%. To compare LQT1_MUT with LQT1_CTRL, we included in this analysis only the control and mutant versions of the 3238 models included in LQT1_MUT.

2.2. The Control and the Mutant LQT2 Populations

As in the previous section, only a limited number of parameter sets out of the initial 10,000 were included in the LQT2_CTRL population: 1226. In Figure 5a and Figure S4a, we show the spontaneous APs of the LQT2_CTRL population. After switching on the LQT2 mutation in these 1226 models, a subset of 1008 models was included in the LQT2_MUT population, shown in Figure 5b and Figure S4b. The comparison of the AP biomarkers is reported in Figure 6, showing also in this case a substantial prolongation of the APD in the mutant population. Since the data reported in Bellin et al. [4] (see Table 3) refer to APs measured in hiPSC-CMs stimulated at 60 bpm, we also stimulated LQT2_CTRL and LQT2_MUT, obtaining 979 and 650 models respectively. This discrepancy between the spontaneous and stimulated LQT2_CTRL and LQT2_MUT populations is due to the fact that subsets of models (247 and 358 models, respectively) were not able to synchronize their spontaneous APs with the external pacing. This lack of synchronization led to scenarios where a spontaneous AP was triggered before the external stimulus, which eventually occurred in the middle of the spontaneous AP, consequently making computing the AP biomarkers meaningless. Figure 7 reports the scatter plots of the AP biomarkers in LQT2_CTRL vs. the AP biomarkers in LQT2_MUT, in non-paced (blue circles) and paced (red circles) conditions. The grey rectangles represent the experimental AP biomarkers boundaries built on the data from paced hiPSC-CMs reported in Table 3, as for Figure 3 in the previous Section 2.1. The AP biomarkers affected the most by the LQT2 mutation are APD50 and APD90, which are prolonged by almost the same extent, independently of the APD in control conditions. An alternative representation of the AP biomarker distributions in LQT2_CTRL and LQT2_MUT is reported in Figure S5. Figure 8 shows the distribution of ΔAPD90% in case of spontaneous APs (Figure 8a) or paced APs (Figure 8b). The average simulated ΔAPD90% is +39% when computed on the spontaneous APs, while it is +41% when computed on the paced APs, respectively. The experimental ΔAPD90% reported by Bellin et al. [4] is +41% in conditions of external pacing.

2.3. At Risk vs. Normal-Like Mutant hiPSC-CMs

The mutant populations LQT1_MUT and LQT2_MUT were split into two groups by means of k-means clustering, exploiting APDs and Rate biomarkers, as detailed in Section 4.5. Provided that the KCNQ1 R190Q and the KCNH2 N996I mutations affect all cells in LQT1_MUT and LQT2_MUT, respectively, we named as normal-like those models with APDs similar to control hiPSC-CMs, and at risk those models with prolonged APDs. Figure 9 shows the different distributions of the maximum conductances/currents for the normal-like and at risk models of populations LQT1_MUT (Figure 9a) and LQT2_MUT (Figure 9b), respectively. For each of these mutant populations, we considered a median difference of at least 10% to identify the main ionic mechanisms that differ between the at risk and normal-like groups. At risk models in LQT1_MUT exhibited (i) smaller IKr (outward current, −25%) and (ii) larger ICaL (inward current, +41%). In LQT2_MUT, again the at risk group showed reduced IKr (−32%) with the addition of a reduced IpCa (outward current, −11%). Notably, in contrast to the LQT1_MUT at risk models, at risk models in LQT2_MUT showed only a moderately larger ICaL (+6%). These differences in ionic current expressions are emblematic of a reduced repolarization reserve in the at risk groups. With the term repolarization reserve, we refer “to the idea is that the complexity of repolarization includes some redundancy. As a consequence, loss of one component (such as IKr or IKs) ordinarily will not lead to failure of repolarization (i.e., marked QT prolongation); as a corollary, individuals with subclinical lesions in other components of the system, say IKs or calcium current, may display no QT change until IKr block is superimposed” (definition adapted from [22,23]).
We also run an additional Mann-Whitney U-test to identify if other ionic currents could have shown significant differences (p-value < 0.01) among the at risk and normal-like groups. No additional differences in currents were identified in the LQT2 at risk group as compared to the normal-like. Conversely, in LQT1_MUT, the at risk group showed significantly larger INCX, INaK and INaL and smaller IpCa (median difference compared to normal-like +3%, +7%, +7% and −7% respectively). Figure 10 shows how APD50 and APD90 of the normal-like groups are way closer to control values than to the computed APD50 and APD90 of the at risk groups. Furthermore, we evaluated in the control populations LQT1_CTRL and LQT2_CTRL whether the control models corresponding to at risk vs. normal-like mutant models displayed differences in AP biomarker (quantified as median values). Control models leading to at risk LQT1 models displayed increased Peak voltage (+18%) and prolonged APD50 and APD90 (+42% and +36%, respectively) compared to those leading to normal-like LQT1 models after switching on the IKs mutation. Similarly, control models leading to at risk LQT2 models were characterized by decreased dV/dtmax (–21%), increased Peak voltage (+14%) and prolonged APD50 and APD90 (+55% and +47%, respectively) compared to control models leading to normal-like LQT2 models after switching on the IKr mutation.

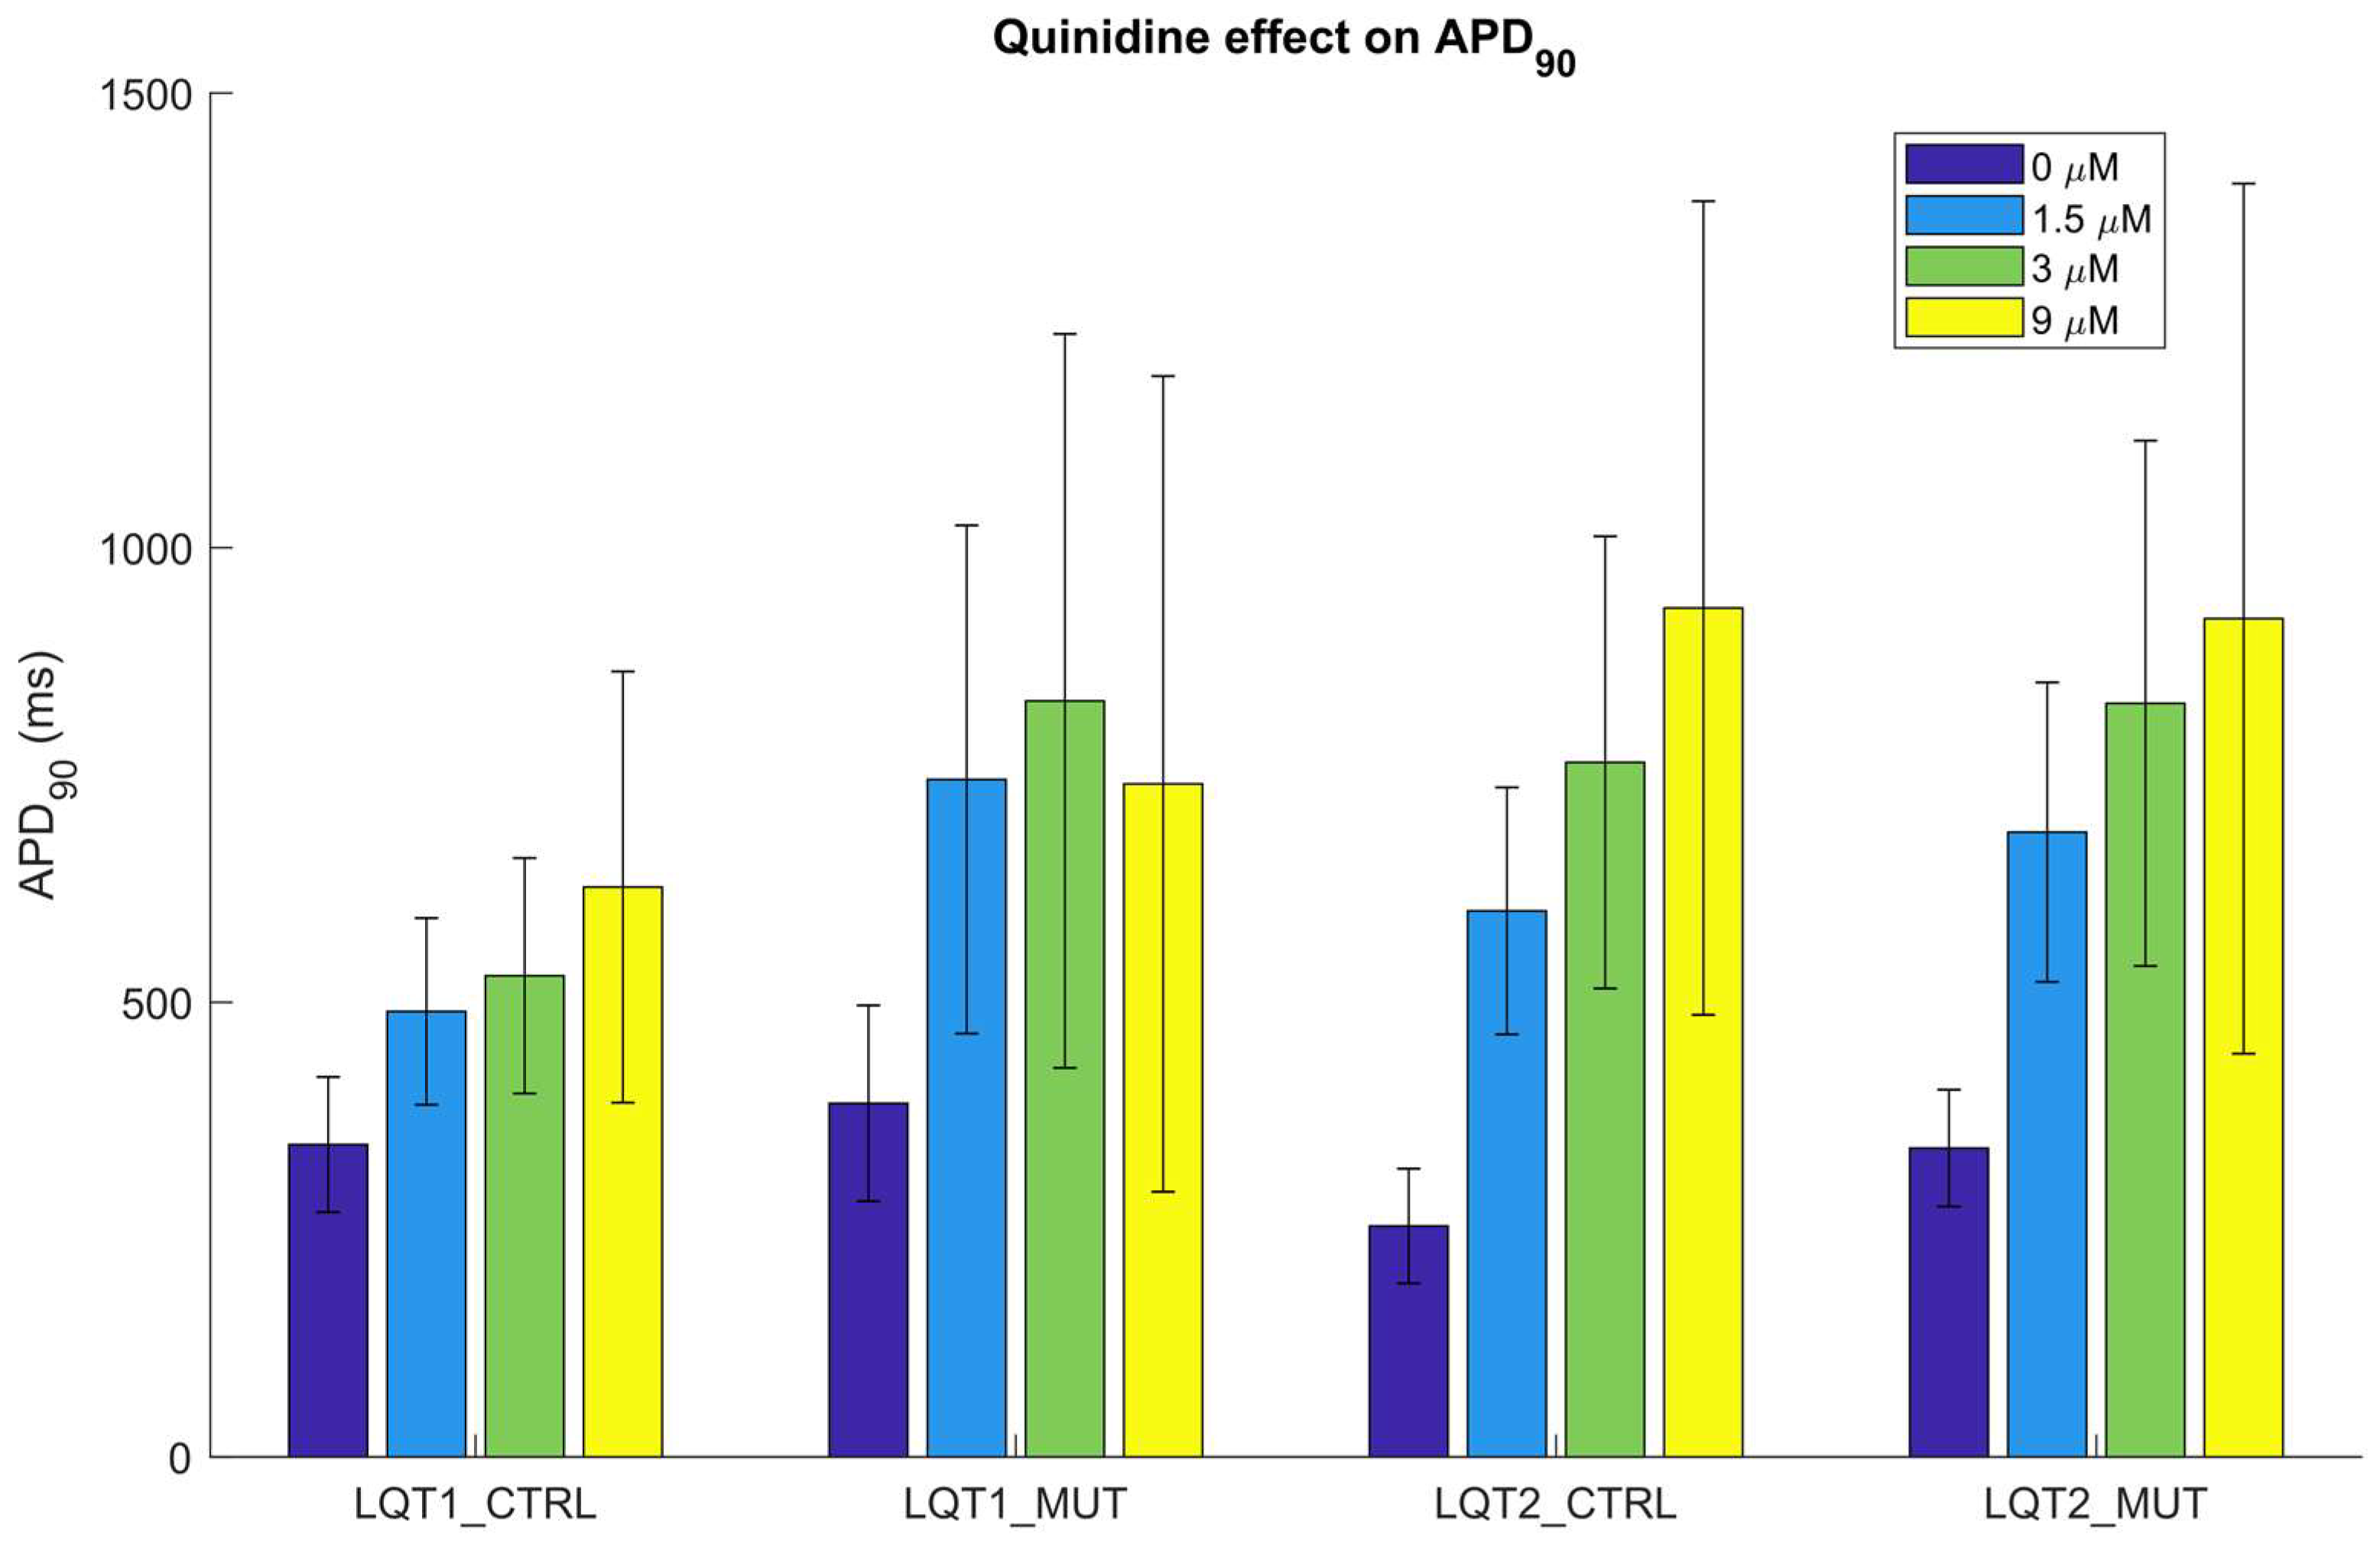
2.4. Quinidine Effect on hiPSC-CMs

Quinidine, a pro-arrhythmic drug causing AP prolongation, induced a remarkable prolongation of APD90 in all four in silico populations. Figure 11 shows quinidine effect on APD90 for those models for which computing the AP biomarkers was still possible after drug administration. Moreover, quinidine administration triggered many arrhythmic events, especially at the highest dose (Table 4). Among the models developing abnormalities, we observed many different arrhythmogenic patterns, including early afterdepolarization (EADs), repolarization failure and delayed afterdepolarization (DADs)-like abnormalities (which could also degenerate in anticipated beats), as shown in Figure 12. Finally, Table 4 also reports the percent of at risk and normal-like models in the populations LQT1_MUT and LQT2_MUT that produced abnormalities after quinidine administration (in brackets), showing that at risk models are more prone to abnormalities than the normal-like ones, except for the highest dose, when the amount of abnormalities becomes comparable.

3. Discussion

The potential of hiPSC-CMs as disease-specific in vitro models has been clear for a decade. In this work, we showed a synergistic approach between experimental data from cells with two specific ion channel mutations (namely the KCNQ1 R190Q mutation associated with LQT1 and the KCNH2 N996I associated with LQT2) and a recent in silico modeling technique, i.e., the populations of models. Starting from our recent Paci2018 hiPSC-CM in silico model [20], we were able to integrate patch clamp data of control and mutant IKs [3] and control and mutant IKr [4], to produce four in silico populations of control and mutant hiPSC-CMs (LQT1_CTRL, LQT1_MUT, LQT2_CTRL and LQT2_MUT). The hiPSC-CM models included in the aforementioned populations represents single isolated cells; therefore, we did not consider any coupling (e.g., via gap junctions) between the cells of each population.
Firstly, we were able to replicate in silico the main AP feature at cellular level of both the LQT types we investigated, i.e., the prolongation of the AP duration (Figure 2 and Figure 6). In [3], a very large APD90 prolongation (+95%) due to LQT1 was observed. In our populations, we did not observe such extreme prolongation, with only few models prolonging APD90 over 50% (Figure 4). We ascribe such differences in the effect of the mutation to a quite small sensitivity of the original Paci2018 model [20] to IKs, which reflected the low sensitivity of hiPSC-CMs to IKs block experimentally recorded by Ma et al. [13], which is actually similar to those of adult myocytes. In fact, in [20], we showed only very small changes in APD90 by blocking IKs up to 90% (ΔAPD90 = 18 ms when paced at 1 Hz and ΔAPD90 = 13 ms considering spontaneous APs). The replacement of the Moretti et al. control IKs [3] in the Paci2018 model [20], which is actually greater than the original IKs, as shown in Figure 13a, was indeed sufficient to make the model more sensitive to IKs block (ΔAPD90 = 42 ms, +12%, when blocking 90% IKs) and to IKs loss-of-function.
The IKs contribution to repolarization of cardiac membrane potential is highly debated. In Lemoine et al. [24], it was recently shown that a strong IKs block obtained by 1 µM HMR-1556 did not induce prolongation nor in human left ventricle tissue nor in engineered heart tissue (EHT) samples obtained from hiPSC-CMs, unless the samples were pretreated with IKr blocker E4031 and in conditions of β-adrenergic stimulation. Even though the results of Lemoine et al. [24] focus on IKs block and not IKs loss-of-function due to specific mutations, they seem in contrast with the huge APD prolongation observed by Moretti et al. [3] as consequence of the KCNQ1 R190Q mutation. A more moderate APD90 prolongation (about +28%), associated with more positive APA and elevated plateau phase, was observed by Zhang et al. [25] in hiPSC-CMs carrying the KCNQ1 c.1781G>A mutation. However, Christ et al. [26] criticized these results and the idea that “repolarization reserve in hiPSC-CM is profoundly different from native human ventricular cardiomyocytes, with a much larger impact of unstimulated IKs compared with other potassium currents” (Quoted from [26]). Conversely, Christ et al. [26] pointed out that the higher APA and elevated plateau phase reported by Zhang et al. [25] could only be explained by the suppression of a very rapidly activated repolarizing current, which is in contrast with the slow IKs activation kinetics observed in native cardiomyocytes. The different APD prolongations reported upon reduction of IKs could be ascribed to different maturity degrees of the analyzed hiPSC-CMs. Indeed, hiPSC-CMs in the EHT format are rather mature compared with the two-dimensional differentiation from which single cells were measured in Moretti et al. [3] and in Zhang et al. [25]. It is likely that in immature cells, IKs plays a major role in AP repolarization, even without adrenergic stimulation, while in native cardiomyocytes as well in more mature hiPSC-CMs (where not only all the other cardiac ion currents are more similar to native myocytes, but also the myocyte structure and the calcium handling properties are improved), the role of IKs is minimal under baseline conditions. Moreover, it should also be considered that in in vitro studies, the choice of control influences very much the changes that can be measured. In fact, in Moretti et al. [3], an unrelated control hiPSC line was used as reference. However, when the LQT1 mutation was corrected and an isogenic hiPSC control line created [27], a smaller APD prolongation was measured in the LQT1 mutant cardiomyocytes compared to the LQT1 corrected cardiomyocytes (+30%). It is worth noting that the approach we used in the present study to simulate the effect of mutation (hence only by substitution of the IKs formulation) is definitely more similar to the isogenic situation than to that reported in the original Moretti et al. [3] study. Our in silico analysis predicts a more moderate LQT1 effect than Moretti et al. [3], Zhang et al. [25] and Chen et al. [27], i.e., an average APD90 prolongation equal to +14%. However, a subset of cells in our LQT1_MUT population showed strong APD90 prolongation. In Figure S6 we reported the parameter distribution of the LQT1_MUT models with APD90 prolongation over 50%. It is clear that these models are characterized by (i) overexpression of inward currents (INa, INaL and ICaL), (ii) strong underexpression of IKr, and (iii) strong overexpression of IKs. Our in silico predictions considered such a configuration of ionic current expressions compatible with higher sensitivity to IKs loss-of-function/IKs block in hiPSC-CMs. It is an open question whether this higher sensitivity also corresponds to a lower degree of maturity in hiPSC-CMs. Of course such results would need a solid experimental confirmation. In fact, due to the complexity of this dispute, we can only hope for more detailed characterization of IKs (but also of the other ionic currents) on control and mutant hiPSC-CMs, taking into account the high hiPSC-CM electrophysiological variability, and therefore the performing of measurements on a high number of cells obtained from different commercial lines and different patients.
There is more consensus about the role of IKr in the AP repolarization and the effects of IKr loss-of-function. Bellin et al. [4] reports an APD90 prolongation equal to +41% due to LQT2 in paced hiPSC-CMs [4]. We observed an APD90 increment equal to +39% and +41% in LQT2_MUT as compared to LQT2_CTRL, respectively, for spontaneous and paced APs, in full agreement with the experiments. In a previous article, we showed the strong effect that IKr block has on the original Paci2018 model [20]. The direct replacement of the Bellin et al. control IKr [4] (clearly larger than the original IKr reported in dashed in Figure 14) in the original Paci2018 model [20] dramatically shortened APD90 (~140 ms) and created an AP shape that was not included in the LQT2_CTRL population and, in cascade, in the LQT2_MUT population. Here, the power of running simulations with populations of in silico models is already clear. In the LQT1 example, starting from a baseline model showing only +11% APD90 prolongation, we obtained a population including models with prolongation over 50%. Conversely, in the LQT2 case, starting from a baseline model which was not even included in the control population, we obtained more than 1000 models whose mean ΔAPD90 was in agreement with the in vitro experiments [4].
Figure 3, Figure 7, Figure S3 and Figure S5 show how well our populations were able to cover the control and mutant AP biomarkers from the Moretti2010 [3] and Bellin2013 [4] datasets. Notably, from the Moretti2010 dataset, only control AP biomarkers (and not mutant ones) were used for the calibration of the control populations (together with the other five datasets listed in Section 4.4, Table 5). In fact, our approach consisted of (i) calibrating the two control populations using AP biomarker ranges from the six experimental datasets of AP biomarkers computed on spontaneous hiPSC-CM APs joined together, and (ii) switching on the mutations in all the models we included in the control populations. This approach, already used in [18,28], has the advantage of producing more control phenotypes, compared to calibrating the control population only with a single dataset, e.g., Moretti2010 [3]. Secondly, switching on the mutations only in the models included in the control populations, allows a direct comparison between each mutant and control cell, e.g., to assess APD90 prolongation for each cell. Notably, we could not use the data from Bellin et al. [4] for calibration, since they were recorded in paced hiPSC-CMs, while we calibrated our control populations on spontaneous AP data. The APD90 scatter plots in Figure 3 and Figure 7 highlight that the two mutations affect APD with completely different patterns. While in LQT2_MUT APD90 is always prolonged by almost the same extent (Figure 7), independently of the APD in control conditions, in LQT1_MUT there is a marked sensitivity and the longer APD is in control, the larger its prolongation due to the mutation will be (Figure 3). This is not surprising; given the slow activation kinetic of IKs, its contribution (and the impact of its reduction) to repolarization is expected to increase with APD. This is less true for IKr, whose action is mainly mediated by rapid recovering from inactivation during phase 3 of the AP. Moreover, from the last scatter plot in Figure 3, it is evident that, for long APD, LQT1_MUT is characterized by very large intersubject variability, with very different mutant APD90 values in correspondence of the same control APD90. This points to the fact that in LQT1_MUT (much more than LQT2_MUT) the effect of the mutation could be compensated or exacerbated by over/under-expression of the other ionic currents.
We used a technique previously described [18] to discriminate between at risk and normal-like mutant hiPSC-CMs by means of an unsupervised classifier. Figure 10 shows how the normal-like group in both LQT1_MUT and LQT2_MUT exhibits AP duration closer to that observed in control, despite the mutation. We identified a subset of ionic currents whose overexpression or underexpression could act as protective mechanisms against the LQT mutations investigated in this paper. In both LQT1_MUT and LQT2_MUT, the main protective mechanisms were the overexpression of IKr and underexpression of ICaL (to a lesser extent in LQT2_MUT) and IpCa. It is interesting to note that in LQT1_MUT, the at risk group showed also significant overexpression of INCX and INaK, as compared to LQT1_CTRL. This is actually in agreement with the work of Krogh-Madsen et al. [29], where the authors used two different genetic optimizations to create two models (Multi-variable and APDLQT), able to summarize the three most common forms of LQT, i.e., types 1, 2 and 3. In both the Multi-variable and APDLQT models, the parameter optimization resulted in an overexpression of INCX (3.05× and 1.75×) and INaK (1.91× and 7.4×). Therefore, our simulations suggest that underexpression of INaK and INCX could act as well as protective mechanisms against the mutation effects.
Finally, we also provided a simple but powerful application of our in silico populations, i.e., an illustrative drug test. We chose quinidine, known to prolong APD [30] and to be a high-risk drug for Torsades de Pointes (a malignant type of arrhythmia, associated with sudden cardiac death) generation [19,31]. Such an aggressive drug is expected to trigger many arrhythmogenic events, both in the mutant and in the control populations. It is interesting to observe that the differences in APD prolongation between LQT2_CTRL and LQT2_MUT, tend to disappear by increasing the quinidine dose (Figure 11). This is due to the fact that LQT2_CTRL and LQT2_MUT differ only for the IKr formulation, which is the most affected current by quinidine (Table S1). In principle, the full IKr block should lead to the same APD90 in both LQT2_CTRL and LQT2_MUT, as shown in Figure 11 in corrispondence of the higher dose of quinidine. The same does not happen for LQT1_CTRL and LQT1_MUT. In fact, these two populations differ for their IKs formulation, which is affected by quinidine to a smaller extent (Table S1). Nevertheless, in LQT1_MUT the compromised repolarization reserve amplifies the effect of the IKr block due to quinidine (Figure 11). This is visible also from the increasing difference in the amount of AP abnormalities occurring in LQT1_MUT as compared to LQT1_CTRL at increasing drug doses. Such differences do not emerge in LQT2_CTRL and LQT2_MUT (Table 4), due to the presence of high IKr intensity in both populations (Figure 14a). In fact, APs are surely prolonged in LQT2_CTRL and LQT2_MUT as a consequence of drug administration; however, they are less prone to develop abnormalities as compared to LQT1_CTRL and LQT1_MUT.
The onset of afterdepolarizations or beating arrest as a response to high doses of quinidine was experimentally demonstrated by Kuusela et al. [30] on hiPSC-CM aggregates, whose field potentials were recorded by means of multielectrode arrays. Quinidine was administrated to hiPSC-CM clusters derived from two wild-type lines and three LQT lines (namely LQT1a, LQT1b and LQT2). All hiPSC-CM clusters showed afterdepolarizations and beating arrest. When we consider only the models that did not react to quinidine with arrhythmic events, the APD90 prolongation was quite extreme for all the four in silico populations: at the highest doses APD90 was more than doubled (Figure 11). A more moderate field potential duration prolongation (+14–16%, at 9 µM) was observed in control and mutant clusters in [30]. We ascribe this difference in prolongation to the following factors. Firstly, the number of cell clusters used in Kuusela et al. [30] is limited (min 6, max 16). Secondly, we performed our simulations on single in silico cells and not on cell clusters; therefore, we do not consider any interaction between hiPSC-CMs or between hiPSC-CMs and cells that are not cardiomyocytes but that could still be present in aggregates, potentially affecting the AP depolarization and repolarization phases and mitigating the drug effect [32]. Coupling in multicellular systems (e.g., cardiomyocyte-cardiomyocyte or cardiomyocyte-fibroblast coupling) affects the cell electrophysiology, as we also reported in Paci et al. [12], and some averaging of the population of responses is expected. However, a quantitative evaluation of the effects of coupling is beyond the aim of this study. Finally, quinidine was simulated with the simple single-pore block model, which is effective in showing the main effects of the drug (including the onset of arrhythmic events), but which does not describe more complex effects, e.g., due to state dependent interactions between the drug and the ion channels.
Finally, in this study, we chose to develop two control models to be used as stems to generate the LQT1_CTRL and the LQT2_CTRL populations, instead of a single control model containing both the Moretti et al. [3] control IKs and the Bellin et al. [4] control IKr. This choice is justified by the fact that both IKs from Moretti et al. [3] and IKr from Bellin et al. [4] are extremely stronger than the original IKs and IKr in the Paci2018 model [20]. Therefore, a single control model obtained by replacing both the control IKs and IKr reported in Figure 13 and Figure 14, would have generated a baseline with an extremely short APD (~105 ms), making it very hard to generate a control population covering both the two experimental datasets, that show dramatically different APD values. This would have been particularly problematic when switching on the LQT1 mutation, since the AP prolongation induced by the IKs loss-of-function would have been hidden by the very strong Bellin et al. control IKr [4].

4. Materials and Methods

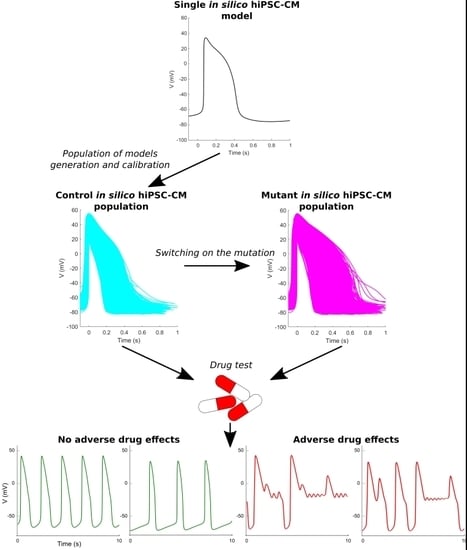
4.1. General Approach and Study Design

This study was organized in the following steps. Firstly, we fit the experimental voltage clamp data for the control and the mutant IKs [3] and IKr [4]. Secondly, for each of the aforementioned K+ currents, we inserted its control formulation into the recently published Paci2018 model of hiPSC-CM [20], thus obtaining two baseline models, the former with an updated control IKs, the latter with an updated control IKr. Each of these models was subsequently used to generate a control population of in silico hiPSC-CMs as in [18,33]. Then we switched on the respective LQT mutation in each of the control population, thus obtaining two mutant populations, expressing LQT1 and LQT2 mutations, respectively. A summary of this approach is reported in Figure S1. Finally, we ran specific analyses on the control and mutant populations to compare them to each other and to the experimental data from the literature.

4.2. Control and Mutant Slow Delayed Rectifying Current IKs

We rewrote the IKs formulation based on the experimental data from [3], where the authors investigated the KCNQ1 R190Q mutation in hiPSC-CMs. Mutant hiPSC-CMs were produced from father and son, both affected by LQT1, while control cells were produced from two healthy control subjects. In detail, the available data for control and mutant IKs were: (i) the deactivation time constant, (ii) the steady-state activation curve, (iii) IKs step current and iv) the IKs tail current. We modified our original IKs formulation [20] to fit all this pool of experiments and we simulated the same activation experimental protocol reported in [3]. We kept the same IKs structure, with only one activation gate, as in Paci et al. [20] and TenTusscher et al. [34]. Such a formulation allowed us to obtain a very good fitting of the current kinetics (Figure 13c,d). However, with only one activation gate, we were not able to perfectly fit both the experimental peak and tail currents (Figure 13a,b). Therefore, we aimed at an acceptable compromise in the fitting of the two features of the current. The resulting mathematical formulations of the control and mutant IKs are reported in the Supplementary Material, Section 1, while the fitting results are reported in Figure 13.

4.3. Control and Mutant Rapid Delayed Rectifying Current IKr

As in the previous section, we also wrote a formulation of the control and mutant current for IKr based on the experimental data from [4], in which the authors studied the N996I mutation in the KCNH2 gene. In contrast to IKs data, in this case, the control hiPSC-CMs were not produced from healthy subjects, but obtained from the mutant cells by targeted gene correction. The available voltage-clamp data are: (i) IKr step current, (ii) IKr tail current and (iii) IKr activation time constant (Figure 14). As in the previous section, our IKr formulation [20] was adapted to this pool of experimental data to obtain the control and mutant formulations reported in the Supplementary Material, Section 2.

4.4. Control Populations (LQT1_CTRL and LQT2_CTRL) of In Silico hiPSC-CMs

We generated two control hiPSC-CM populations: the former using as a baseline model the Paci2018 [20] after control IKs replacement; the latter after control IKr replacement. In both cases, we proceeded as in [18,33]. We first generated a random population of in silico hiPSC-CMs by sampling thirteen parameters in the baseline model by means of latin hypercube sampling. The sampled parameters are the maximum conductances/currents of fast and late Na+ currents (INa, INaL), funny current (If), L-type Ca2+ current (ICaL), IKs, IKr, inward rectifying K+ current (IK1), transient outward K+ current (Ito), Na+/Ca2+ exchanger (INCX), Na+/K+ pump (INaK), sarcolemmal Ca2+ pump (IpCa), SERCA pump (ISERCA) and RyR-sensitive Ca2+ release from sarcoplasmic reticulum (IRyR). Each parameter was sampled in the range [0.5; 2] of its nominal value from [20]. Globally, 10,000 parameter sets (i.e., individual models) were simulated for 800 s to allow the models to reach their steady state; these models represent the random population. The next step consisted of calibrating the random population, i.e., discarding all those models whose AP biomarkers are not in agreement with the experimental data, thus obtaining a subset of models that we called the calibrated population. As in [18], we considered as experimental variability intervals of the AP biomarkers those intervals obtained by merging together six AP biomarkers datasets computed on the spontaneous hiPSC-CM APs: Ma2011 [13], Moretti2010 [3], Ma2013 [6], Fatima2013 [35], Lahti2012 [5] and Kujala2012 [8]. We did not consider the AP biomarkers computed on the control APs in [4] since they were obtained in paced conditions. For each AP biomarker, we considered the union of the ranges mean − 2SD and mean + 2SD from each dataset to get the lower (LB) and upper (UB) bounds of the ranges to which the AP biomarkers computed on the APs of the random population must belong to (Table 5). In case of meaningless bounding values, e.g., negative APD, the respective LB was set to zero. The AP biomarkers considered for the calibration were: (i) rate of spontaneous AP (Rate), (ii) maximum diastolic potential (MDP), (iii) peak potential (Peak), (iv) AP amplitude (APA), (v) maximum upstroke velocity (dV/dtmax) and (vi) AP duration at different repolarization percentages (APDxx). Additionally, models from the random populations were discarded also for the following two reasons: (i) if they did not produce spontaneous APs or (ii) if their cytosolic Na+ or sarcoplasmic Ca2+ concentrations did not belong to the intervals [5; 15] and [0; 5] mM, respectively. For simplicity, we called the population based on the control IKs from [3] LQT1_CTRL and the population based on the control IKr from [4] LQT2_CTRL.

4.5. Mutant LQT1 and LQT2 (LQT1_MUT and LQT2_MUT) In Silico Populations

After developing the LQT1_CTRL and the LQT2_CTRL populations, we switched on the respective mutation in each of the hiPSC-CM models, i.e., we replaced the control IKs and IKr formulations with their mutant equivalent, obtaining two new mutant populations: LQT1_MUT and LQT2_MUT. In this case, no experimental calibration was performed. However, models were again excluded in cases where (i) the mutation made them stop generating spontaneous APs, or (ii) their cytosolic Na+ or sarcoplasmic Ca2+ were out of range. Due to the lack of an accepted criterion to separate mutant APs showing pseudo-physiological APD from APs clearly showing the effect of the mutation, as in [18], we divided the LQT1_MUT and the LQT2_MUT populations into two groups using only the AP shapes. Provided that the KCNQ1 R190Q and the KCNH2 N996I mutations affect all cells in LQT1_MUT and LQT2_MUT, respectively, we named normal-like the group with APDs more similar to control hiPSC-CMs, and at risk the group with longer APDs. Instead of setting one arbitrary threshold on only one AP biomarker, e.g., APD90, we chose to use k-means clustering [36] applied to Rate and to all the APDs. AP biomarkers were standardized with mean = 0 and standard deviation = 1 and k-means was repeated 200 times to stabilize the centroids in the AP biomarker space.

4.6. In Silico Drug Tests

Quinidine is a class Ia antiarrhythmic drug, hence blocking INa, but also dramatically affecting other currents, e.g., IKr and ICaL. The effect of three doses of quinidine (1.5, 3, and 9 µM) was tested on all the in silico populations. Drug administration was performed using the single pore block model, as in [18]. The couples (IC50 in µM, Hill’s coefficients) for the quinidine effect on INa and ICaL were taken from [37]: INa (14.6, 1.22) and ICaL (6.4, 0.68). The couples for IKr, IKs and Ito were taken from [38]: IKr (0.343, 1), IKs (4.899, 1.4) and Ito (3.487, 1.3). Quinidine was administered from steady state for 250 s to all the models in each population. AP biomarkers were computed on the last 10 APs if arrhythmic events, e.g., EADs, DADs or repolarization failure, did not happen. In this test, we did not exclude any model based on the absence of spontaneous APs or because of out-of-boundaries Na+ and Ca2+ concentrations, since we aimed to appreciate all the abnormalities induced by quinidine.

5. Conclusions

In conclusion, in this work we were able to reproduce the two most common loss-of-function LQT syndromes by means of large-scale simulations, which also enabled the investigation of biophysical mechanisms not easy to assess in vitro, e.g., how the expression of ionic currents can impact on the mutation. Moreover, we provided a tool to assess adverse effects of drugs on the electrophysiology of control and mutant cells, in the perspective of in silico drug tests, not only on adult cells [19], but also on hiPSC-CMs as required in the Comprehensive In vitro Proarrhythmia Assay framework [39].

Supplementary Materials

Supplementary materials can be found at https://www.mdpi.com/1422-0067/19/11/3583/s1, Figure S1: Flowchart for generating the four in silico populations LQT1_CTRL, LQT1_MUT, LQT2_CTRL, LQT2_MUT, Figure S2: Magnification of the action potentials included in the two populations built using the IKs experiments by Moretti et al. [2]: (a) LQT1_CTRL; (b) LQT1_MUT, Figure S3: AP biomarker distributions in the LQT1_CTRL (cyan) and LQT1_MUT (magenta) populations, Figure S4: Magnification of the action potentials included in the two populations built using the IKr experiments by Bellin et al. [3]: (a) LQT2_CTRL; (b) LQT2_MUT, Figure S5: AP biomarker distributions in the non-paced (cyan) and paced (blue) LQT2_CTRL and non-paced (magenta) and paced (red) LQT2_MUT populations, Figure S6: Parameter distribution in the 21 LQT1_MUT models showing an APD90 prolongation greater than 50% as consequence of IKs loss-of-function, Figure S7: Original IKs peak current from the Paci2018 model (dashed trace), Table S1: Residual percent currents after Quinidine administration.

Author Contributions

Conceptualization, M.P. and S.S.; Data curation, M.P. and S.C.; Formal analysis, M.P. and S.S.; Funding acquisition, M.P.; Investigation, M.P. and S.S.; Methodology, M.P., S.C., M.B. and S.S.; Project administration, M.P. and S.S.; Resources, J.H.; Software, M.P.; Supervision, M.P., J.H. and S.S.; Validation, M.P. and S.S.; Visualization, M.P.; Writing—original draft, M.P., S.C., M.B., J.H. and S.S.; Writing—review & editing, M.P., S.C., M.B., J.H. and S.S.

Funding

This research was funded by the Academy of Finland grant number 307967.

Acknowledgments

The authors acknowledge CSC—IT Center for Science, Finland, for generous computational resources.

Conflicts of Interest

The authors declare no conflict of interest. The funders had no role in the design of the study; in the collection, analyses, or interpretation of data; in the writing of the manuscript, and in the decision to publish the results.

Abbreviations

APAction potential
APDxxAction potential duration at xx%
hiPSCHuman induced pluripotent stem cell
APAAction potential amplitude
DADDelayed afterdepolarization
dV/dtmaxMaximum upstroke velocity
EADEarly afterdepolarization
EHTEngineered heart tissue
FDAFood and drug administration
hiPSC-CMHuman induced pluripotent stem cell-derived cardiomyocyte
ICaLL-type Ca2+ current
IfFunny current
IKrRapid delayed rectifying K+ current
IKsSlow delayed rectifying K+ current
IK1Inward rectifying K+ current
INaFast Na+ current
INaKNa+/K+ pump
INaLLate Na+ current
INCXNa+/Ca2+ exchanger
IpCaSarcolemmal Ca2+ pump
IRyRRyR-sensitive Ca2+ release
ISERCASERCA pump
ItoTransient outward K+ current
LBLower bound
LQT1_CTRLhiPSC-CM population with control IKs from [3]
LQT1_MUThiPSC-CM population with mutant IKs from [3]
LQT2_CTRLhiPSC-CM population with control IKr from [4]
LQT2_MUThiPSC-CM population with mutant IKr from [4]
MDPMaximum diastolic potential
meanMean value
Paci2018hiPSC-CM model from [20]
PeakPeak potential
RateSpontaneous action potential rate
SDStandard deviation
UBUpper bound
ΔAPD90%Percent APD90 variation

References

  1. Rodriguez, B.; Carusi, A.; Abi-Gerges, N.; Ariga, R.; Britton, O.; Bub, G.; Bueno-Orovio, A.; Burton, R.A.B.; Carapella, V.; Cardone-Noott, L.; et al. Human-based approaches to pharmacology and cardiology: An interdisciplinary and intersectorial workshop. Europace 2016, 18, 1287–1298. [Google Scholar] [CrossRef] [PubMed]
  2. Colatsky, T.; Fermini, B.; Gintant, G.; Pierson, J.B.; Sager, P.; Sekino, Y.; Strauss, D.G.; Stockbridge, N. The Comprehensive in Vitro Proarrhythmia Assay (CiPA) initiative—Update on progress. J. Pharmacol. Toxicol. Methods 2016, 81, 15–20. [Google Scholar] [CrossRef] [PubMed]
  3. Moretti, A.; Bellin, M.; Welling, A.; Jung, C.B.; Lam, J.T.; Bott-Flügel, L.; Dorn, T.; Goedel, A.; Höhnke, C.; Hofmann, F.; et al. Patient-specific induced pluripotent stem-cell models for long-QT syndrome. N. Engl. J. Med. 2010, 363, 1397–1409. [Google Scholar] [CrossRef] [PubMed]
  4. Bellin, M.; Casini, S.; Davis, R.P.; D’Aniello, C.; Haas, J.; Ward-van Oostwaard, D.; Tertoolen, L.G.J.; Jung, C.B.; Elliott, D.A.; Welling, A.; et al. Isogenic human pluripotent stem cell pairs reveal the role of a KCNH2 mutation in long-QT syndrome. EMBO J. 2013, 32, 3161–3175. [Google Scholar] [CrossRef] [PubMed] [Green Version]
  5. Lahti, A.L.; Kujala, V.J.; Chapman, H.; Koivisto, A.-P.; Pekkanen-Mattila, M.; Kerkela, E.; Hyttinen, J.; Kontula, K.; Swan, H.; Conklin, B.R.; et al. Model for long QT syndrome type 2 using human iPS cells demonstrates arrhythmogenic characteristics in cell culture. Dis. Model. Mech. 2012, 5, 220–230. [Google Scholar] [CrossRef] [PubMed]
  6. Ma, D.; Wei, H.; Zhao, Y.; Lu, J.; Li, G.; Binte, N.; Sahib, E.; Hong, T.; Yean, K.; Shim, W.; et al. Modeling type 3 long QT syndrome with cardiomyocytes derived from patient-specific induced pluripotent stem cells. Int. J. Cardiol. 2013, 168, 5277–5286. [Google Scholar] [CrossRef] [PubMed]
  7. Rocchetti, M.; Sala, L.; Dreizehnter, L.; Crotti, L.; Sinnecker, D.; Mura, M.; Pane, L.S.; Altomare, C.; Torre, E.; Mostacciuolo, G.; et al. Elucidating arrhythmogenic mechanisms of long-QT syndrome CALM1-F142L mutation in patient-specific induced pluripotent stem cell-derived cardiomyocytes. Cardiovasc. Res. 2017, 113, 531–541. [Google Scholar] [CrossRef] [PubMed]
  8. Kujala, K.; Paavola, J.; Lahti, A.; Larsson, K.; Pekkanen-Mattila, M.; Viitasalo, M.; Lahtinen, A.M.; Toivonen, L.; Kontula, K.; Swan, H.; et al. Cell model of catecholaminergic polymorphic ventricular tachycardia reveals early and delayed afterdepolarizations. PLoS ONE 2012, 7, e44660. [Google Scholar] [CrossRef] [PubMed]
  9. Ojala, M.; Prajapati, C.; Pölönen, R.P.; Rajala, K.; Pekkanen-Mattila, M.; Rasku, J.; Larsson, K.; Aalto-Setälä, K. Mutation-specific phenotypes in hiPSC-derived cardiomyocytes carrying either myosin-binding protein C or alfa-tropomyosin mutation for hypertrophic cardiomyopathy. Stem Cells Int. 2016, 2016. [Google Scholar] [CrossRef] [PubMed]
  10. Davis, R.P.; Casini, S.; van den Berg, C.W.; Hoekstra, M.; Remme, C.A.; Dambrot, C.; Salvatori, D.; Oostwaard, D.W.; Wilde, A.A.M.; Bezzina, C.R.; et al. Cardiomyocytes derived from pluripotent stem cells recapitulate electrophysiological characteristics of an overlap syndrome of cardiac sodium channel disease. Circulation 2012, 125, 3079–3091. [Google Scholar] [CrossRef] [PubMed]
  11. Paci, M.; Hyttinen, J.; Aalto-Setälä, K.; Severi, S. Computational models of ventricular- and atrial-like human induced pluripotent stem cell derived cardiomyocytes. Ann. Biomed. Eng. 2013, 41, 2334–2348. [Google Scholar] [CrossRef] [PubMed]
  12. Paci, M.; Sartiani, L.; Lungo, M.; Jaconi, M.; Mugelli, A.; Cerbai, E.; Severi, S. Mathematical modelling of the action potential of human embryonic stem cell derived cardiomyocytes. Biomed. Eng. Online 2012, 11, 61. [Google Scholar] [CrossRef] [PubMed] [Green Version]
  13. Ma, J.; Guo, L.; Fiene, S.J.; Anson, B.D.; Thomson, J.A.; Kamp, T.J.; Kolaja, K.L.; Swanson, B.J.; January, C.T. High purity human-induced pluripotent stem cell-derived cardiomyocytes: Electrophysiological properties of action potentials and ionic currents. AJP Hear. Circ. Physiol. 2011, 301, H2006–H2017. [Google Scholar] [CrossRef] [PubMed]
  14. Dutta, S.; Chang, K.C.; Beattie, K.A.; Sheng, J.; Tran, P.N.; Wu, W.W.; Wu, M.; Strauss, D.G.; Colatsky, T.; Li, Z. Optimization of an in silico cardiac cell model for proarrhythmia risk assessment. Front. Physiol. 2017, 8, 1–15. [Google Scholar] [CrossRef]
  15. Paci, M.; Hyttinen, J.; Rodriguez, B.; Severi, S. Human induced pluripotent stem cell-derived versus adult cardiomyocytes: An in silico electrophysiological study on effects of ionic current block. Br. J. Pharmacol. 2015, 172, 5147–5160. [Google Scholar] [CrossRef] [PubMed]
  16. Knollmann, B.C. Induced pluripotent stem cell-derived cardiomyocytes: Boutique science or valuable arrhythmia model? Circ. Res. 2013, 112, 969–976. [Google Scholar] [CrossRef] [PubMed]
  17. Britton, O.J.; Bueno-Orovio, A.; Van Ammel, K.; Lu, H.R.; Towart, R.; Gallacher, D.J.; Rodriguez, B. Experimentally calibrated population of models predicts and explains intersubject variability in cardiac cellular electrophysiology. Proc. Natl. Acad. Sci. USA 2013, 110, E2098–E2105. [Google Scholar] [CrossRef] [PubMed]
  18. Paci, M.; Passini, E.; Severi, S.; Hyttinen, J.; Rodriguez, B. Phenotypic variability in LQT3 human induced pluripotent stem cell-derived cardiomyocytes and their response to antiarrhythmic pharmacologic therapy: An in silico approach. Hear. Rhythm 2017, 14, 1704–1712. [Google Scholar] [CrossRef] [PubMed]
  19. Passini, E.; Britton, O.J.; Lu, H.R.; Rohrbacher, J.; Hermans, A.N.; Gallacher, D.J.; Greig, R.J.H.; Bueno-Orovio, A.; Rodriguez, B. Human In Silico Drug Trials Demonstrate Higher Accuracy than Animal Models in Predicting Clinical Pro-Arrhythmic Cardiotoxicity. Front. Physiol. 2017, 8, 1–15. [Google Scholar] [CrossRef] [PubMed]
  20. Paci, M.; Pölönen, R.-P.; Cori, D.; Penttinen, K.; Aalto-Setälä, K.; Severi, S.; Hyttinen, J. Automatic optimization of an in silico model of human iPSC derived cardiomyocytes recapitulating calcium handling abnormalities. Front. Physiol. 2018, 9, 709. [Google Scholar] [CrossRef] [PubMed]
  21. Morita, H.; Wu, J.; Zipes, D.P. The QT syndromes: Long and short. Lancet 2008, 372, 750–763. [Google Scholar] [CrossRef]
  22. Varró, A.; Baczkó, I. Cardiac ventricular repolarization reserve: A principle for understanding drug-related proarrhythmic risk. Br. J. Pharmacol. 2011, 164, 14–36. [Google Scholar] [CrossRef] [PubMed]
  23. Roden, D.M. Editorial: Repolarization reserve: A moving target. Circulation 2008, 118, 981–982. [Google Scholar] [CrossRef] [PubMed]
  24. Lemoine, M.D.; Krause, T.; Koivumäki, J.T.; Prondzynski, M.; Schulze, M.L.; Girdauskas, E.; Willems, S.; Hansen, A.; Eschenhagen, T.; et al. Human Induced Pluripotent Stem Cell–Derived Engineered Heart Tissue as a Sensitive Test System for QT Prolongation and Arrhythmic Triggers. Circ. Arrhythmia Electrophysiol. 2018, 11, e006035. [Google Scholar] [CrossRef] [PubMed]
  25. Zhang, M.; D’Aniello, C.; Verkerk, A.O.; Wrobel, E.; Frank, S.; Ward-van Oostwaard, D.; Piccini, I.; Freund, C.; Rao, J.; Seebohm, G.; et al. Recessive cardiac phenotypes in induced pluripotent stem cell models of Jervell and Lange-Nielsen syndrome: Disease mechanisms and pharmacological rescue. Proc. Natl. Acad. Sci. USA 2014, 111, E5383–E5392. [Google Scholar] [CrossRef] [PubMed] [Green Version]
  26. Christ, T.; Horvath, A.; Eschenhagen, T. LQT1-phenotypes in hiPSC: Are we measuring the right thing? Proc. Natl. Acad. Sci. USA 2015, 112, E1968. [Google Scholar] [CrossRef] [PubMed]
  27. Chen, Z.; Xian, W.; Bellin, M.; Dorn, T.; Tian, Q.; Goedel, A.; Dreizehnter, L.; Schneider, C.M.; Ward-Van Oostwaard, D.; Ng, J.K.M.; et al. Subtype-specific promoter-driven action potential imaging for precise disease modelling and drug testing in hiPSC-derived cardiomyocytes. Eur. Heart J. 2017, 38, 292–301. [Google Scholar] [CrossRef] [PubMed]
  28. Passini, E.; Mincholé, A.; Coppini, R.; Cerbai, E.; Rodriguez, B.; Severi, S.; Bueno-Orovio, A. Mechanisms of pro-arrhythmic abnormalities in ventricular repolarisation and anti-arrhythmic therapies in human hypertrophic cardiomyopathy. J. Mol. Cell. Cardiol. 2016, 96, 72–81. [Google Scholar] [CrossRef] [PubMed] [Green Version]
  29. Krogh-Madsen, T.; Jacobson, A.F.; Ortega, F.A.; Christini, D.J. Global optimization of ventricular myocyte model to multi-variable objective improves predictions of drug-induced Torsades de Pointes. Front. Physiol. 2017, 8, 1–10. [Google Scholar] [CrossRef] [PubMed]
  30. Kuusela, J.; Kujala, V.J.; Kiviaho, A.; Ojala, M.; Swan, H.; Kontula, K.; Aalto-Setälä, K. Effects of cardioactive drugs on human induced pluripotent stem cell derived long QT syndrome cardiomyocytes. Springerplus 2016, 5, 1–13. [Google Scholar] [CrossRef] [PubMed]
  31. Woosley, R.; Heise, C.; Romero, K. CredibleMeds, QTdrugs List. Available online: https://crediblemeds.org/ (accessed on 28 August 2018).
  32. Casini, S.; Verkerk, A.O.; Remme, C.A. Human iPSC-Derived Cardiomyocytes for Investigation of Disease Mechanisms and Therapeutic Strategies in Inherited Arrhythmia Syndromes: Strengths and Limitations. Cardiovasc. Drugs Ther. 2017, 31, 325–344. [Google Scholar] [CrossRef] [PubMed] [Green Version]
  33. Paci, M.; Passini, E.; Severi, S.; Hyttinen, J.; Rodriguez, B. A population of in silico models to face the variability of human induced pluripotent stem cell-derived cardiomyocytes: The hERG block case study. In Proceedings of the 2016 Computing in Cardiology Conference (CinC), Vancouver, BC, Canada, 11–14 September 2016; pp. 1189–1192. [Google Scholar]
  34. Ten Tusscher, K.H.W.J.; Noble, D.; Noble, P.J.; Panfilov, A. V A model for human ventricular tissue. Am. J. Physiol. Hear. Circ. Physiol. 2004, 286, H1573–H1589. [Google Scholar] [CrossRef] [PubMed]
  35. Fatima, A.; Kaifeng, S.; Dittmann, S.; Xu, G.; Gupta, M.K.; Linke, M.; Zechner, U.; Nguemo, F.; Milting, H.; Farr, M.; et al. The disease-specific phenotype in cardiomyocytes derived from induced pluripotent stem cells of two long QT syndrome type 3 patients. PLoS ONE 2013, 8, e83005. [Google Scholar] [CrossRef] [PubMed]
  36. Duda, R.O.; Hart, P.E.; Stork, D.G. Pattern Classification; Wiley-Interscience: New York, NY, USA, 2000; ISBN 978-0-471-05669-0. [Google Scholar]
  37. Kramer, J.; Obejero-Paz, C.A.; Myatt, G.; Kuryshev, Y.A.; Bruening-Wright, A.; Verducci, J.S.; Brown, A.M. MICE models: Superior to the HERG model in predicting Torsade de Pointes. Sci. Rep. 2013, 3, 2100. [Google Scholar] [CrossRef] [PubMed]
  38. Crumb, W.J.; Vicente, J.; Johannesen, L.; Strauss, D.G. An evaluation of 30 clinical drugs against the comprehensive in vitro proarrhythmia assay (CiPA) proposed ion channel panel. J. Pharmacol. Toxicol. Methods 2016. [Google Scholar] [CrossRef] [PubMed]
  39. Strauss, D.G.; Gintant, G.; Li, Z.; Wu, W.; Blinova, K.; Vicente, J.; Turner, J.R.; Sager, P.T. Comprehensive In Vitro Proarrhythmia Assay (CiPA) Update from a Cardiac Safety Research Consortium/Health and Environmental Sciences Institute/FDA Meeting. Ther. Innov. Regul. Sci. 2018. [Google Scholar] [CrossRef] [PubMed]
Figure 1. Action potentials included in the two populations built using the IKs experiments by Moretti et al. [3]: (a) LQT1_CTRL; (b) LQT1_MUT. A magnified version of this figure is reported as Figure S2 in the Supplementary Material.
Ijms 19 03583 g001
Figure 2. Comparison of the AP mean biomarkers of LQT1_CTRL (cyan) and LQT1_MUT (magenta). Error bars represent the standard deviation. Significant differences in the AP biomarkers are marked with a black star * (Mann-Whitney U-test, p-value < 0.01).
Ijms 19 03583 g002
Figure 3. AP biomarker distributions in the populations LQT1_CTRL vs. LQT1_MUT (blue circles). The black lines represent the identity lines, i.e., when the AP biomarkers are equals in LQT1_CTRL and LQT1_MUT. The grey rectangles represents the boundaries built on the experimental data from the Moretti 2010 [3] control and mutant datasets, obtained in spontaneously beating hiPSC-CMs (see Table 2): lower bound (mean − 2SD) and upper bound (mean + 2SD) for each AP biomarker.
Ijms 19 03583 g003
Figure 4. Distribution of the APD90 changes due to LQT1 in spontaneous APs, expressed as percent of the APD90 control value. The average ΔAPD90% is +14%.
Ijms 19 03583 g004
Figure 5. Action potentials included in the two populations built using the IKr experiments by Bellin et al. [4]: (a) LQT2_CTRL; (b) LQT2_MUT. A magnified version of this figure is reported as Figure S4 in the Supplementary Material.
Ijms 19 03583 g005
Figure 6. Comparison of the AP mean biomarkers computed on spontaneous APs in LQT2_CTRL (cyan) and LQT2_MUT (magenta). Error bars represent the standard deviation. Significant differences in the AP biomarkers are marked with a black star * (Mann-Whitney U-test, p-value < 0.01).
Ijms 19 03583 g006
Figure 7. AP biomarker distributions in the populations LQT2_CTRL vs. LQT2_MUT in the non-paced (blue circles) and paced (red circles) cases. The black lines represent the identity lines, i.e., when the AP biomarkers are equals in LQT2_CTRL and LQT2_MUT. The grey rectangles represents the boundaries built on the experimental AP biomarkers from the Bellin 2013 control and mutant datasets [4] recorded in paced hiPSC-CMs and reported in Table 3: lower bound (mean − 2SD) and upper bound (mean + 2SD) for each AP biomarker except for the Rate biomarker (pacing rate set to 60 bpm).
Ijms 19 03583 g007
Figure 8. Distribution of the APD90 changes due to the LQT2 mutation, expressed as percent of the APD90 control value. The average ΔAPD90% is +39% and +41% for the in silico spontaneous (a) and externally paced (b) hiPSC-CMs, respectively.
Ijms 19 03583 g008
Figure 9. Distribution of the sampling coefficients of the maximum conductances/currents (see Section 4.4) for the main ionic currents in the at risk and normal-like groups into which LQT1_MUT and LQT2_MUT were split. For each population, we considered a median difference of at least 10% to identify the main ionic mechanisms that differ between the two groups. (a) LQT1_MUT: at risk models exhibited smaller IKr (−25%) and larger ICaL (+41%). (b) LQT2_MUT: at risk models exhibited smaller IKr (−32%) and IpCa (−11%). Outliers are represented as red crosses.
Ijms 19 03583 g009aIjms 19 03583 g009b
Figure 10. Distribution of APD50 (green) and APD90 (black) among the at risk and normal-like groups for the LQT1_MUT (upper row) and LQT2_MUT (lower row). The AP biomarker distribution in the corresponding control population is reported in blue. Outliers are represented as red crosses.
Ijms 19 03583 g010
Figure 11. APD90 quinidine–induced prolongation in the four in silico populations. APD90 values were computed only for the models that did not develop abnormalities in response to quinidine administration. Error bars represent the standard deviation.
Ijms 19 03583 g011
Figure 12. Abnormalities induced by quinidine. (a) Single and multiple EADs and repolarization failure. (b) Single and multiple EADs and repolarization failure. (c) Single EADs and repolarization failure. (d) Anticipated APs, EADs and DAD-like abnormalities. (e) Multiple EADs and repolarization failure. (f) Repolarization failure. (g) Single EADs. (h) Anticipated APs, EADs and DAD-like abnormalities.
Ijms 19 03583 g012
Figure 13. Fitting of the IKs experimental data from Moretti et al. [3]. The black stars and curve represent the Moretti et al. control data [3] and fitting, respectively. The grey stars and curve represent the Moretti et al. mutant data [3] and fitting, respectively. The diamonds and the dashed curve represent the IKs measurements from Ma et al. [13] and the IKs simulated by the Paci2018 model [20]. (a) IKs peak current (a zoom on the Paci2018 IKs peak current is reported in Figure S7). (b) IKs tail current. (c) Voltage dependence of IKs deactivation kinetics. (d) Voltage dependence of IKs activation.
Ijms 19 03583 g013
Figure 14. Fitting of the IKr experimental data from Bellin et al. [4]. The black stars and curve represent the Bellin et al. control data [4] and fitting, respectively. The grey stars and curve represent the Bellin et al. mutant data [4] and fitting, respectively. The diamonds and the dashed curve represent the IKr measurements from Ma et al. [13] and the IKr simulated by the Paci2018 model [20]. (a) IKr step current. (b) IKr tail current. (c) IKr activation time constant.
Ijms 19 03583 g014
Table 1. Summary of the main AP biomarkers (mean ± SD) for the in silico hiPSC-CM populations. APA: AP amplitude. APD50: AP duration at 50% of repolarization. APD90: AP duration at 90% of repolarization. dV/dtmax: maximum upstroke velocity. MDP: maximum diastolic potential. Peak: peak voltage. Rate: rate of the spontaneous APs.
Population (# Models)Rate (bpm)MDP (mV)Peak (mV)APA (mV)dV/dtmax (V/s)APD50 (ms)APD90 (ms)
LQT1_CTRL (3584)46 ± 15−77 ± 338 ± 7114 ± 937 ± 21274 ± 63344 ± 74
LQT1_MUT (3238)44 ± 14−77 ± 338 ± 7114 ± 936 ± 21317 ± 94389 ± 102
LQT2_CTRL spontaneous (1226)45 ± 14−76 ± 335 ± 5111 ± 740 ± 21209 ± 55254 ± 63
LQT2_MUT spontaneous (1008)40 ± 12−77 ± 340 ± 4116 ± 641 ± 21292 ± 58340 ± 64
LQT2_CTRL paced (979)60 ± 0−76 ± 337 ± 5114 ± 755 ± 24233 ± 60288 ± 72
LQT2_MUT paced (650)60 ± 0−76 ± 342 ± 4118 ± 552 ± 23322 ± 62380 ± 70
Table 2. AP biomarkers experimentally recorded in spontaneously beating control and mutant hiPSC-CMs in [3]. AP biomarkers are expressed as mean ± SD. APA: AP amplitude. APD50 and APD90: AP duration at 50% and 90% of repolarization. dV/dtmax: maximum upstroke velocity. MDP: maximum diastolic potential. Peak: peak voltage. Rate: rate of the spontaneous APs.
AP BiomarkersMoretti 2010 [3] Control (n = 21)Moretti 2010 [3] Mutant (n = 14)
Rate (bpm)68 ± 1260 ± 8
MDP (mV)−64 ± 10−65 ± 10
Peak (mV)44 ± 746 ± 8
APA (mV)108 ± 10110 ± 10
dV/dtmax (V/s)9 ± 18 ± 1
APD50 (ms)323 ± 139654 ± 328
APD90 (ms)381 ± 162745 ± 342
Table 3. AP biomarkers measured in control and mutant hiPSC-CMs paced at 60 bpm by Bellin et al. [4]. AP biomarkers are expressed as mean ± SD. APA: AP amplitude. APD50 and APD90: AP duration at 50% and 90% of repolarization, respectively. dV/dtmax: maximum upstroke velocity. MDP: maximum diastolic potential. Peak: peak voltage. Rate: stimulation frequency.
AP biomarkersBellin 2013 [4] Control (n = 10)Bellin 2013 [4] Mutant (n = 14)
Rate (bpm)60 ± 060 ± 0
MDP (mV)−75 ± 6−75 ± 6
APA (mV)116 ± 10120 ± 9
dV/dtmax (V/s)71 ± 3966 ± 42
APD50 (ms)164 ± 78227 ± 66
APD90 (ms)207 ± 92292 ± 81
Table 4. Percent of models in each population showing abnormalities in response to increasing doses of quinidine. The values in brackets in the LQT1_MUT and LQT2_MUT columns represent the percent of models producing abnormalities in the at risk and normal-like groups in the respective mutant population.
Dose (µM)LQT1_CTRLLQT1_MUT
(at Risk vs. Normal-Like)
LQT2_CTRLLQT2_MUT
(at Risk vs. Normal-Like)
00%0% (0% vs. 0%)0%0% (0% vs. 0%)
1.55%11% (16% vs. 7%)1%1% (2% vs. 0%)
311%23% (29% vs. 18%)4%6% (10% vs. 4%)
935%54% (55% vs. 53%)46%46% (50% vs. 44%)
Table 5. Datasets used for calibrating the random populations. Lower (LB) and upper (UB) bounds for each AP biomarker are reported in columns two and three. Missing data are marked as ---. This table has been reproduced from the Supplementary Material of [18].
Dataset (# Cells) Ma2011 [13] (32)Moretti2010 [3] (21)Ma2013 [6] (12)Fatima2013 [35] (6)Lahti2012 [5] (13)Kujala2012 [8] (16)
AP biomarkersLBUBMeanSDMeanSDMeanSDMeanSDMeanSDMeanSD
Rate (bpm)>02093512681269391184572224124
MDP (mV)−89−44−767−6410−615−646−635−687
Peak (mV)1758286447------393------------
APA (mV)761391046108108651025113911810
dV/dtmax (V/s)>082282791131624122723------
APD10 (ms)201287427------------------------------
APD20 (ms)>0290------------13876------------------
APD30 (ms)5930118061------------------------------
APD50 (ms)>0601------3231393381151751062655420481
APD70 (ms)146631------------388121------------------
APD90 (ms)17054151233811624341082981483146333090

