Therapeutic Potential of Autologous Adipose-Derived Stem Cells for the Treatment of Liver Disease

 ,
,
Abstract
: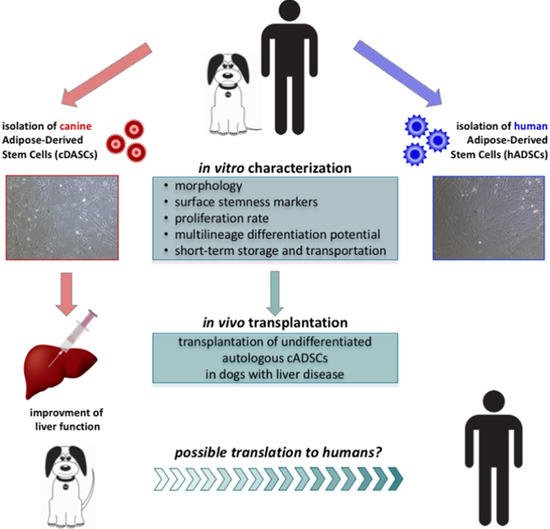
1. Introduction
2. Results
2.1. Isolation and Characterization of Canine and Human Stem Cells
2.2. Proliferation, Growth Rate, and Colony Formation of Canine and Human Stem Cells
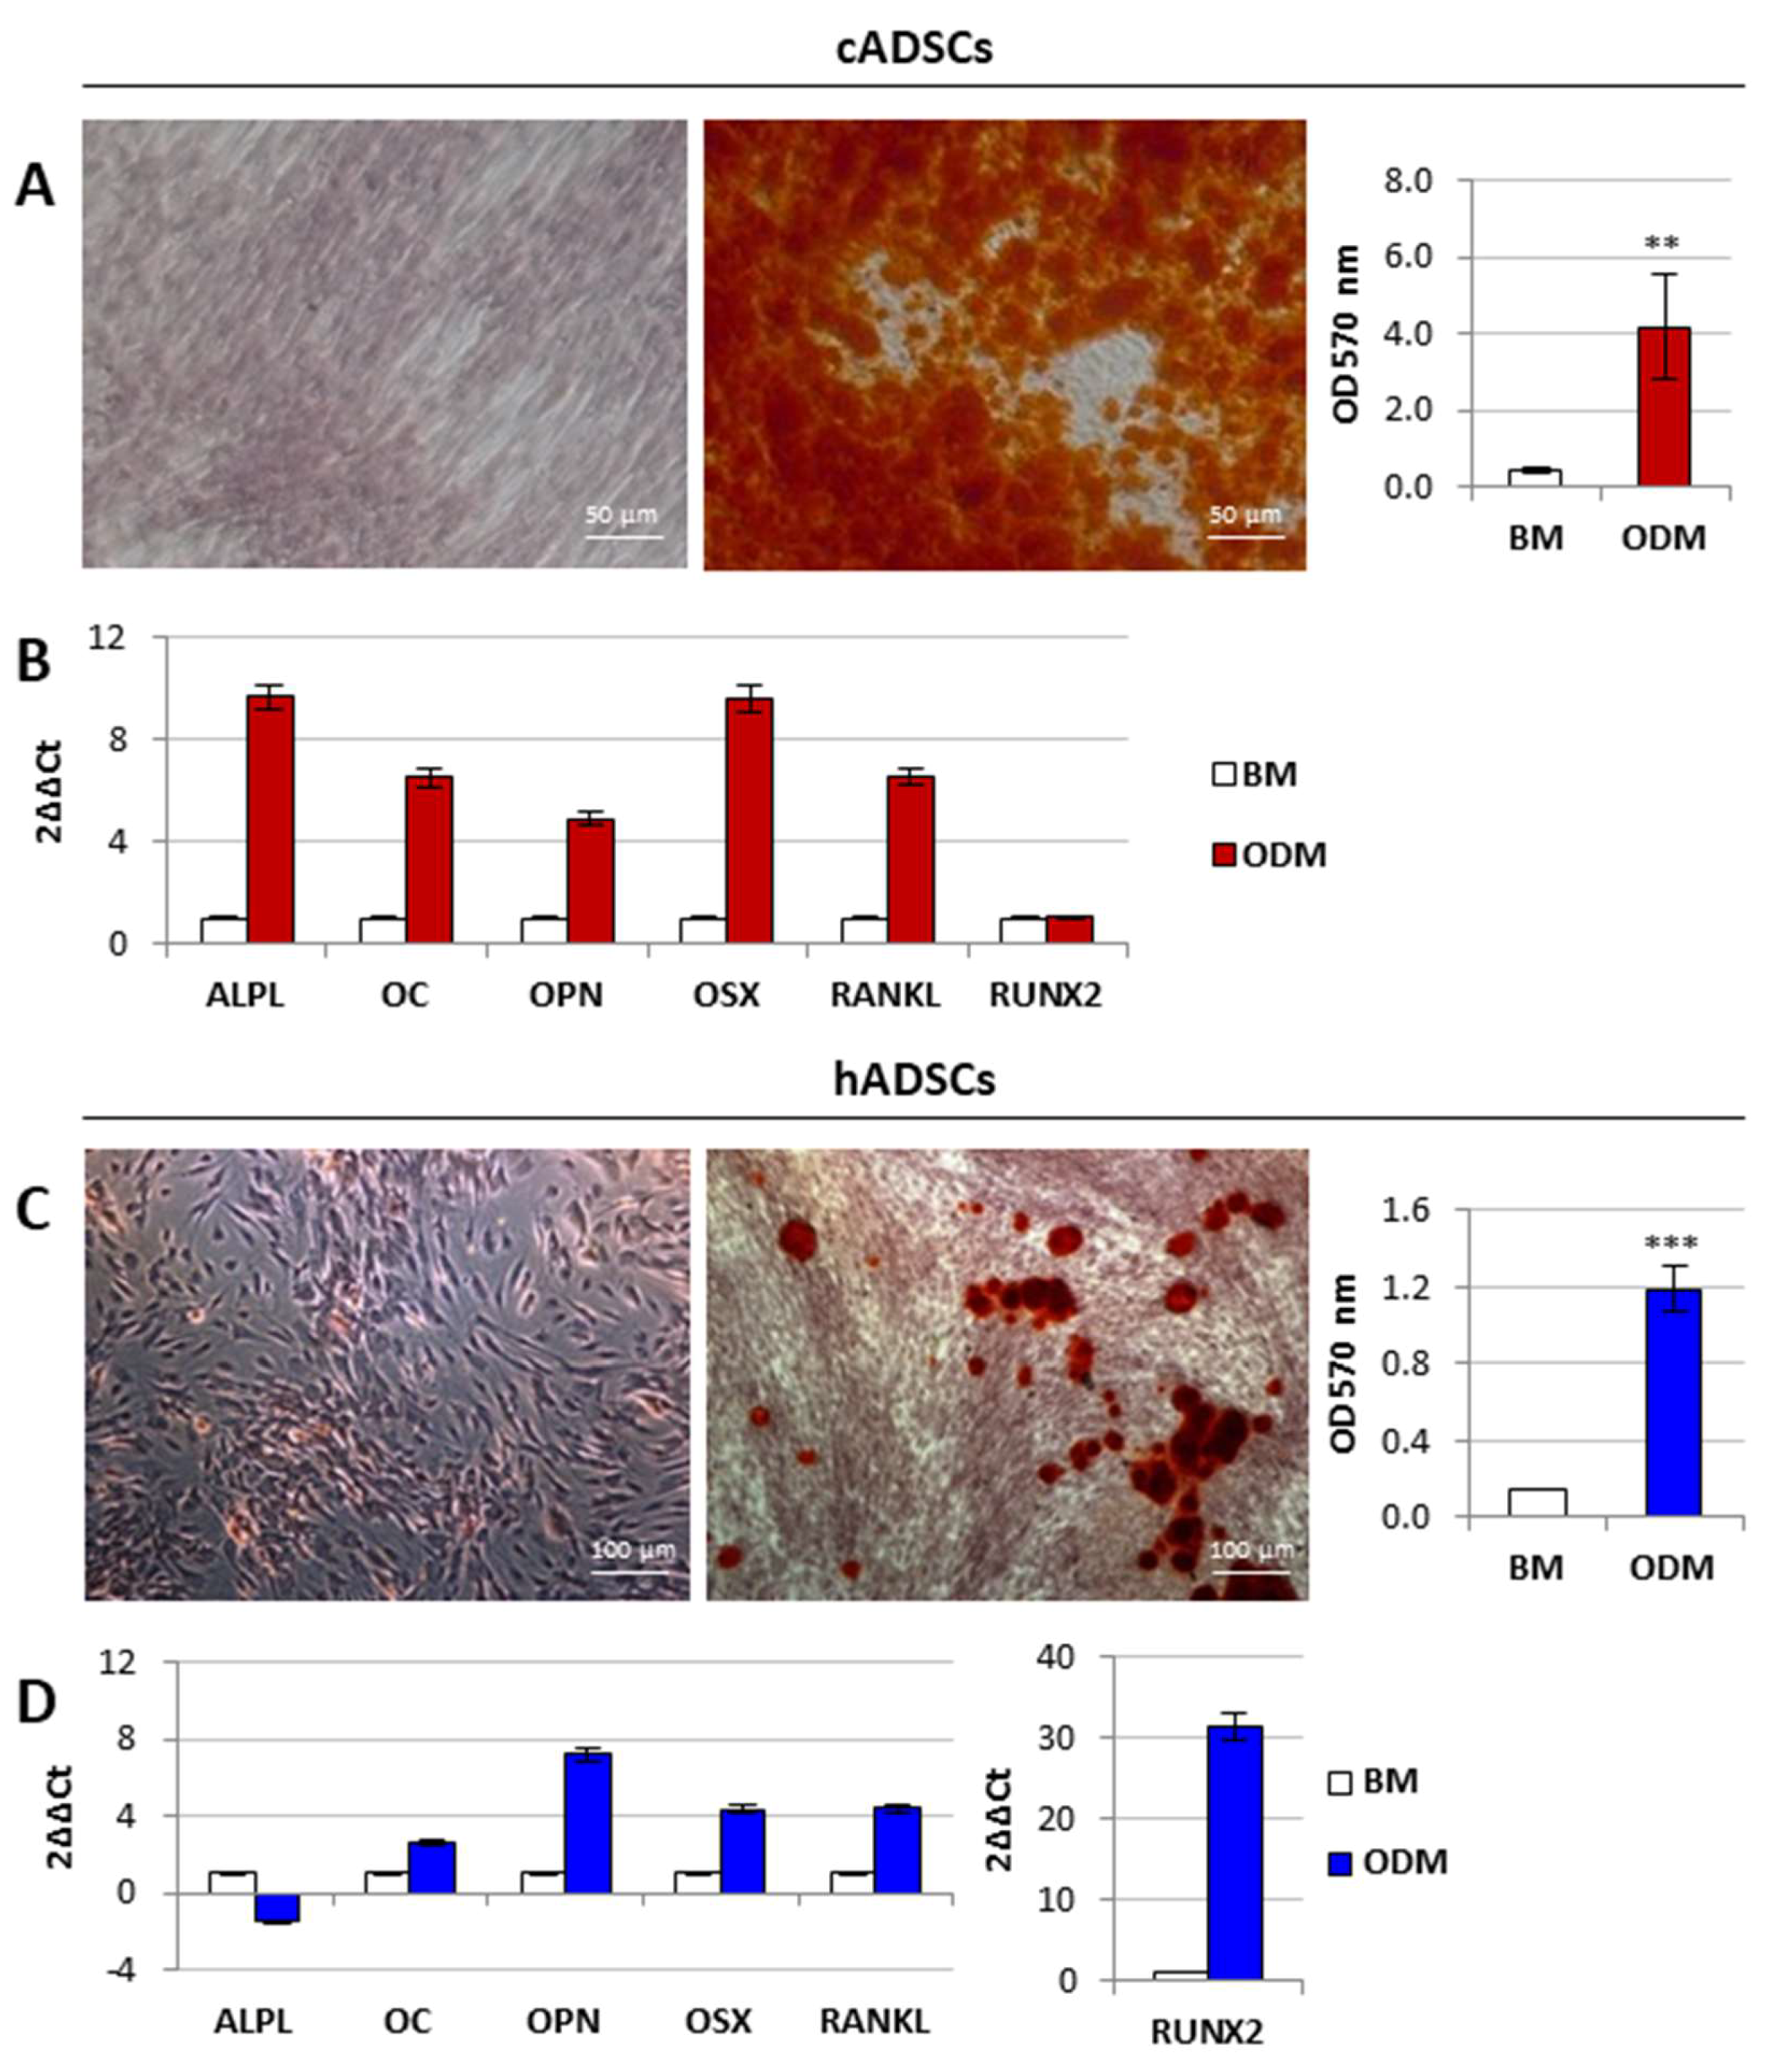
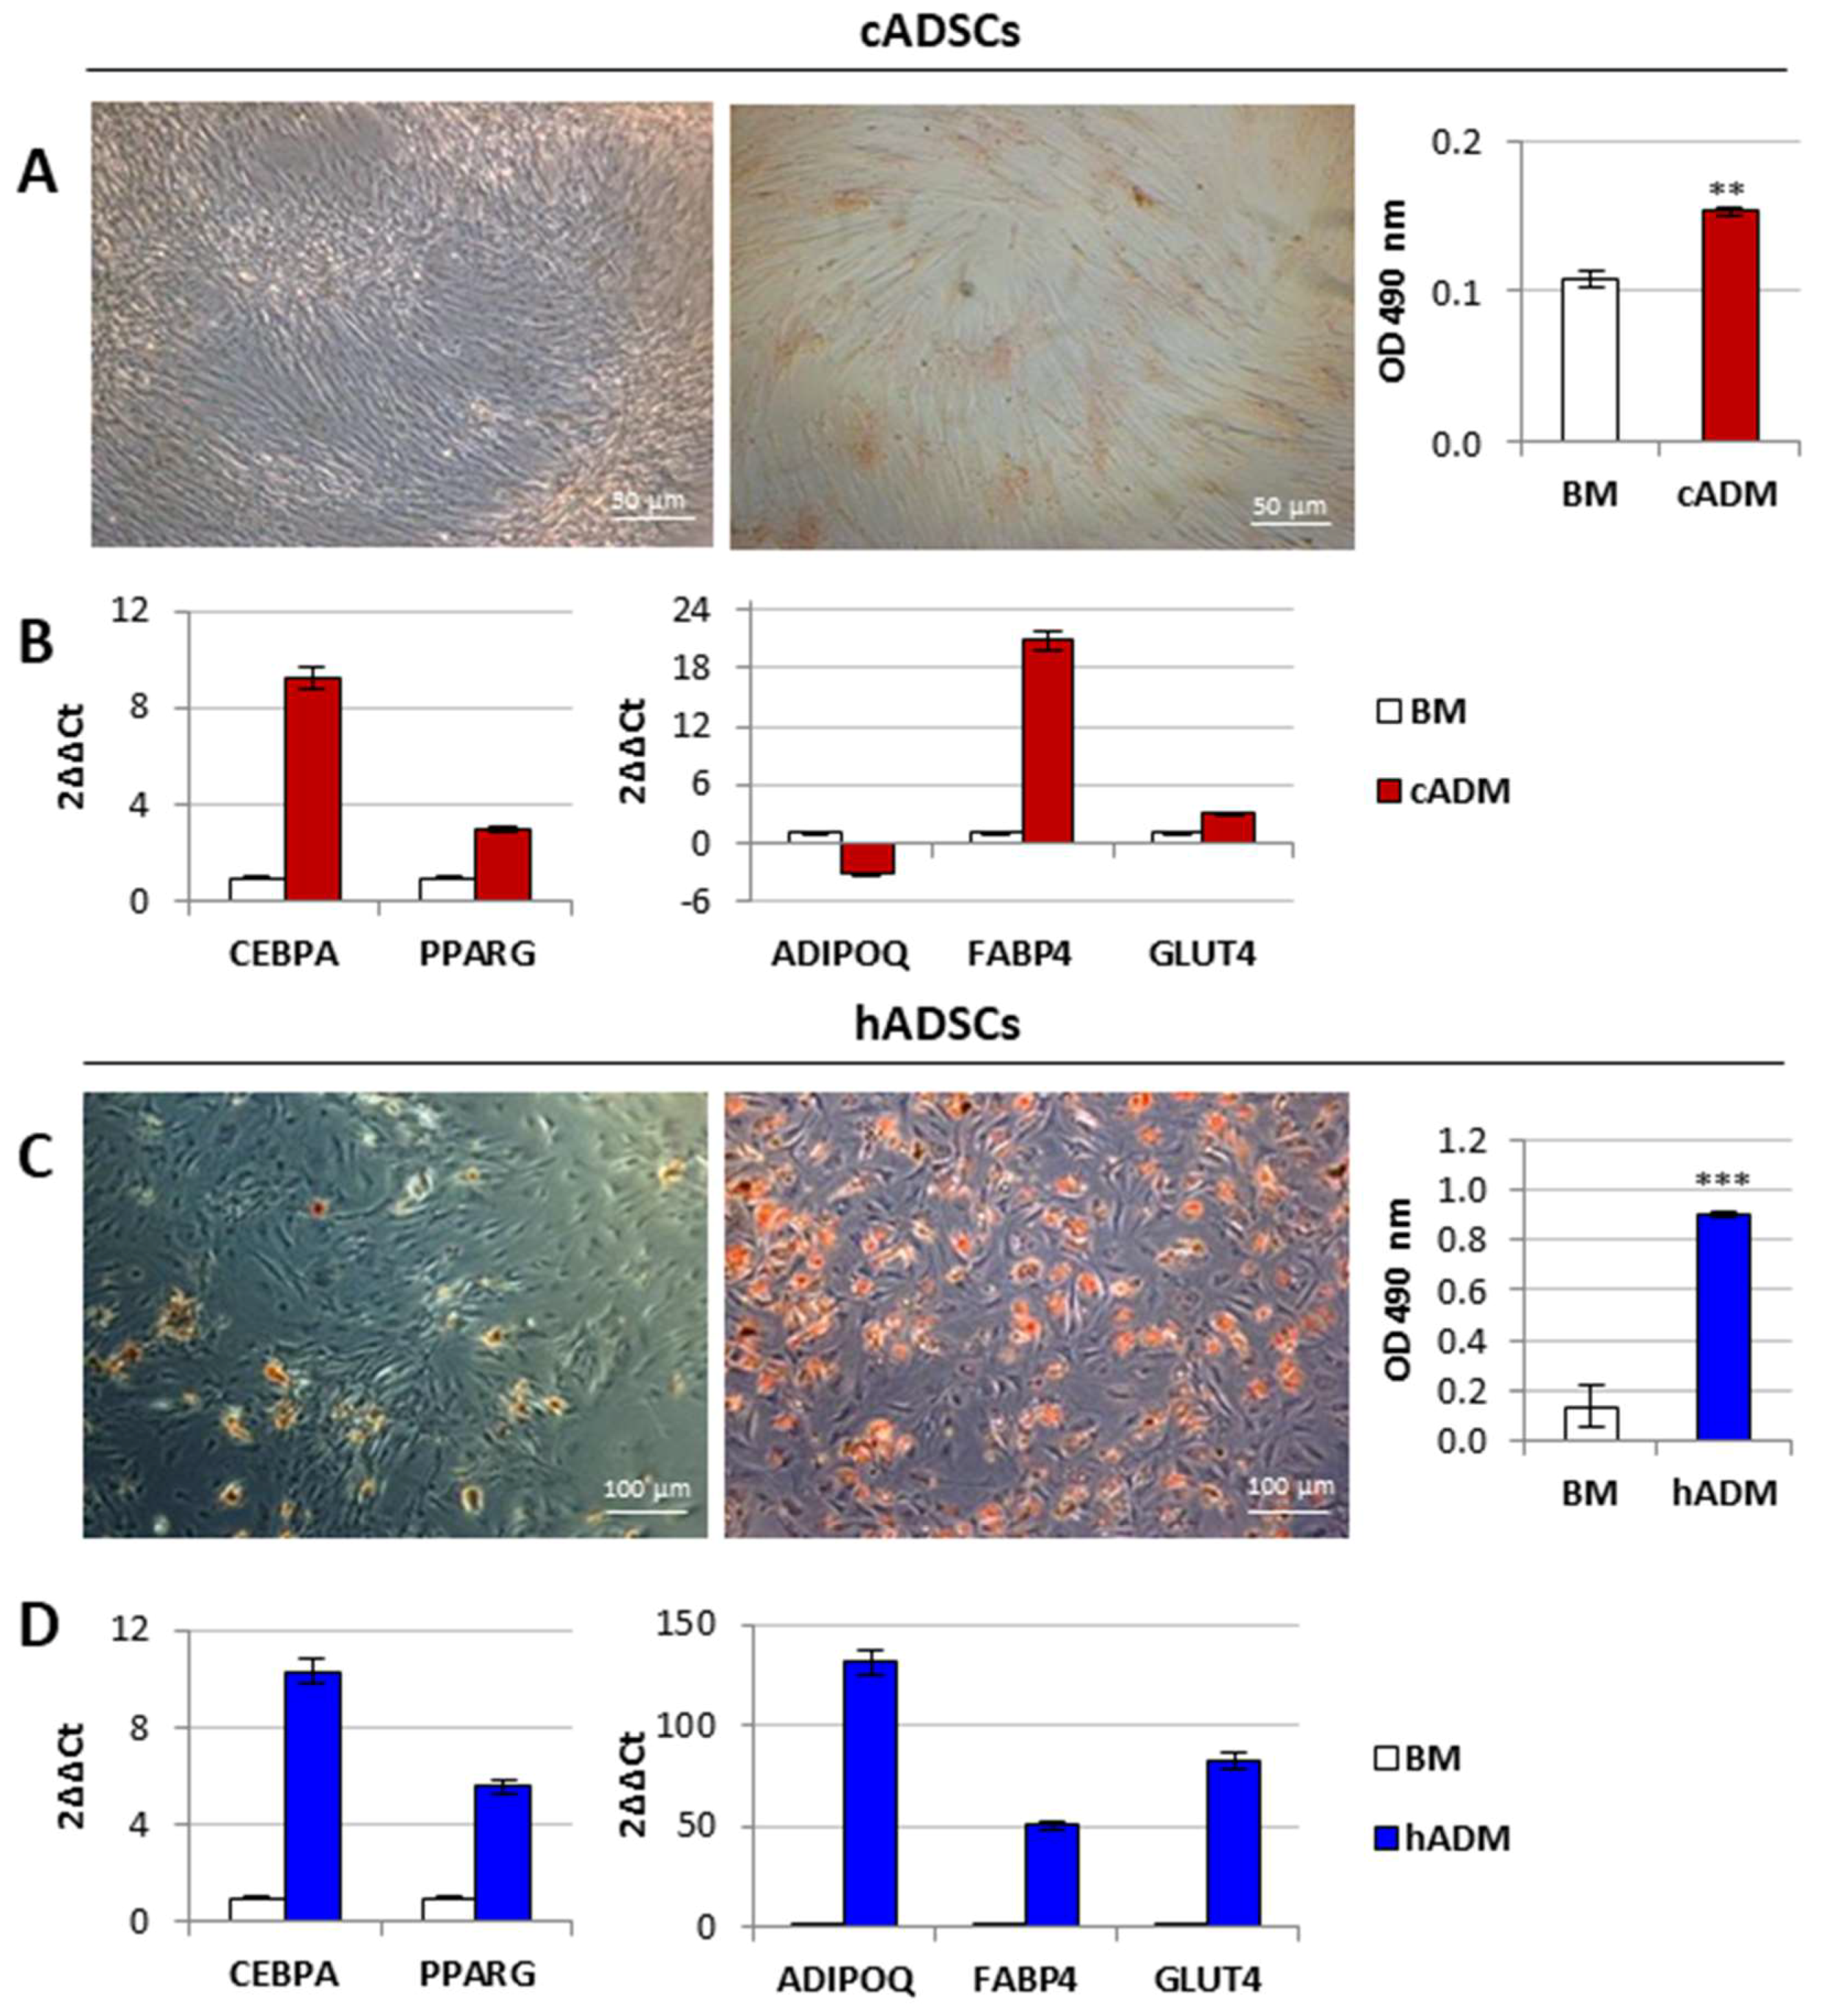
2.3. In Vitro Osteogenic and Adipogenic Differentiation of Canine and Human Stem Cells
2.4. Preservation of Canine and Human Cells under Simulated Transportation Conditions
2.5. Transplantation of Autologous cADSCs in Dogs and Evaluation of Liver Biomarker Levels
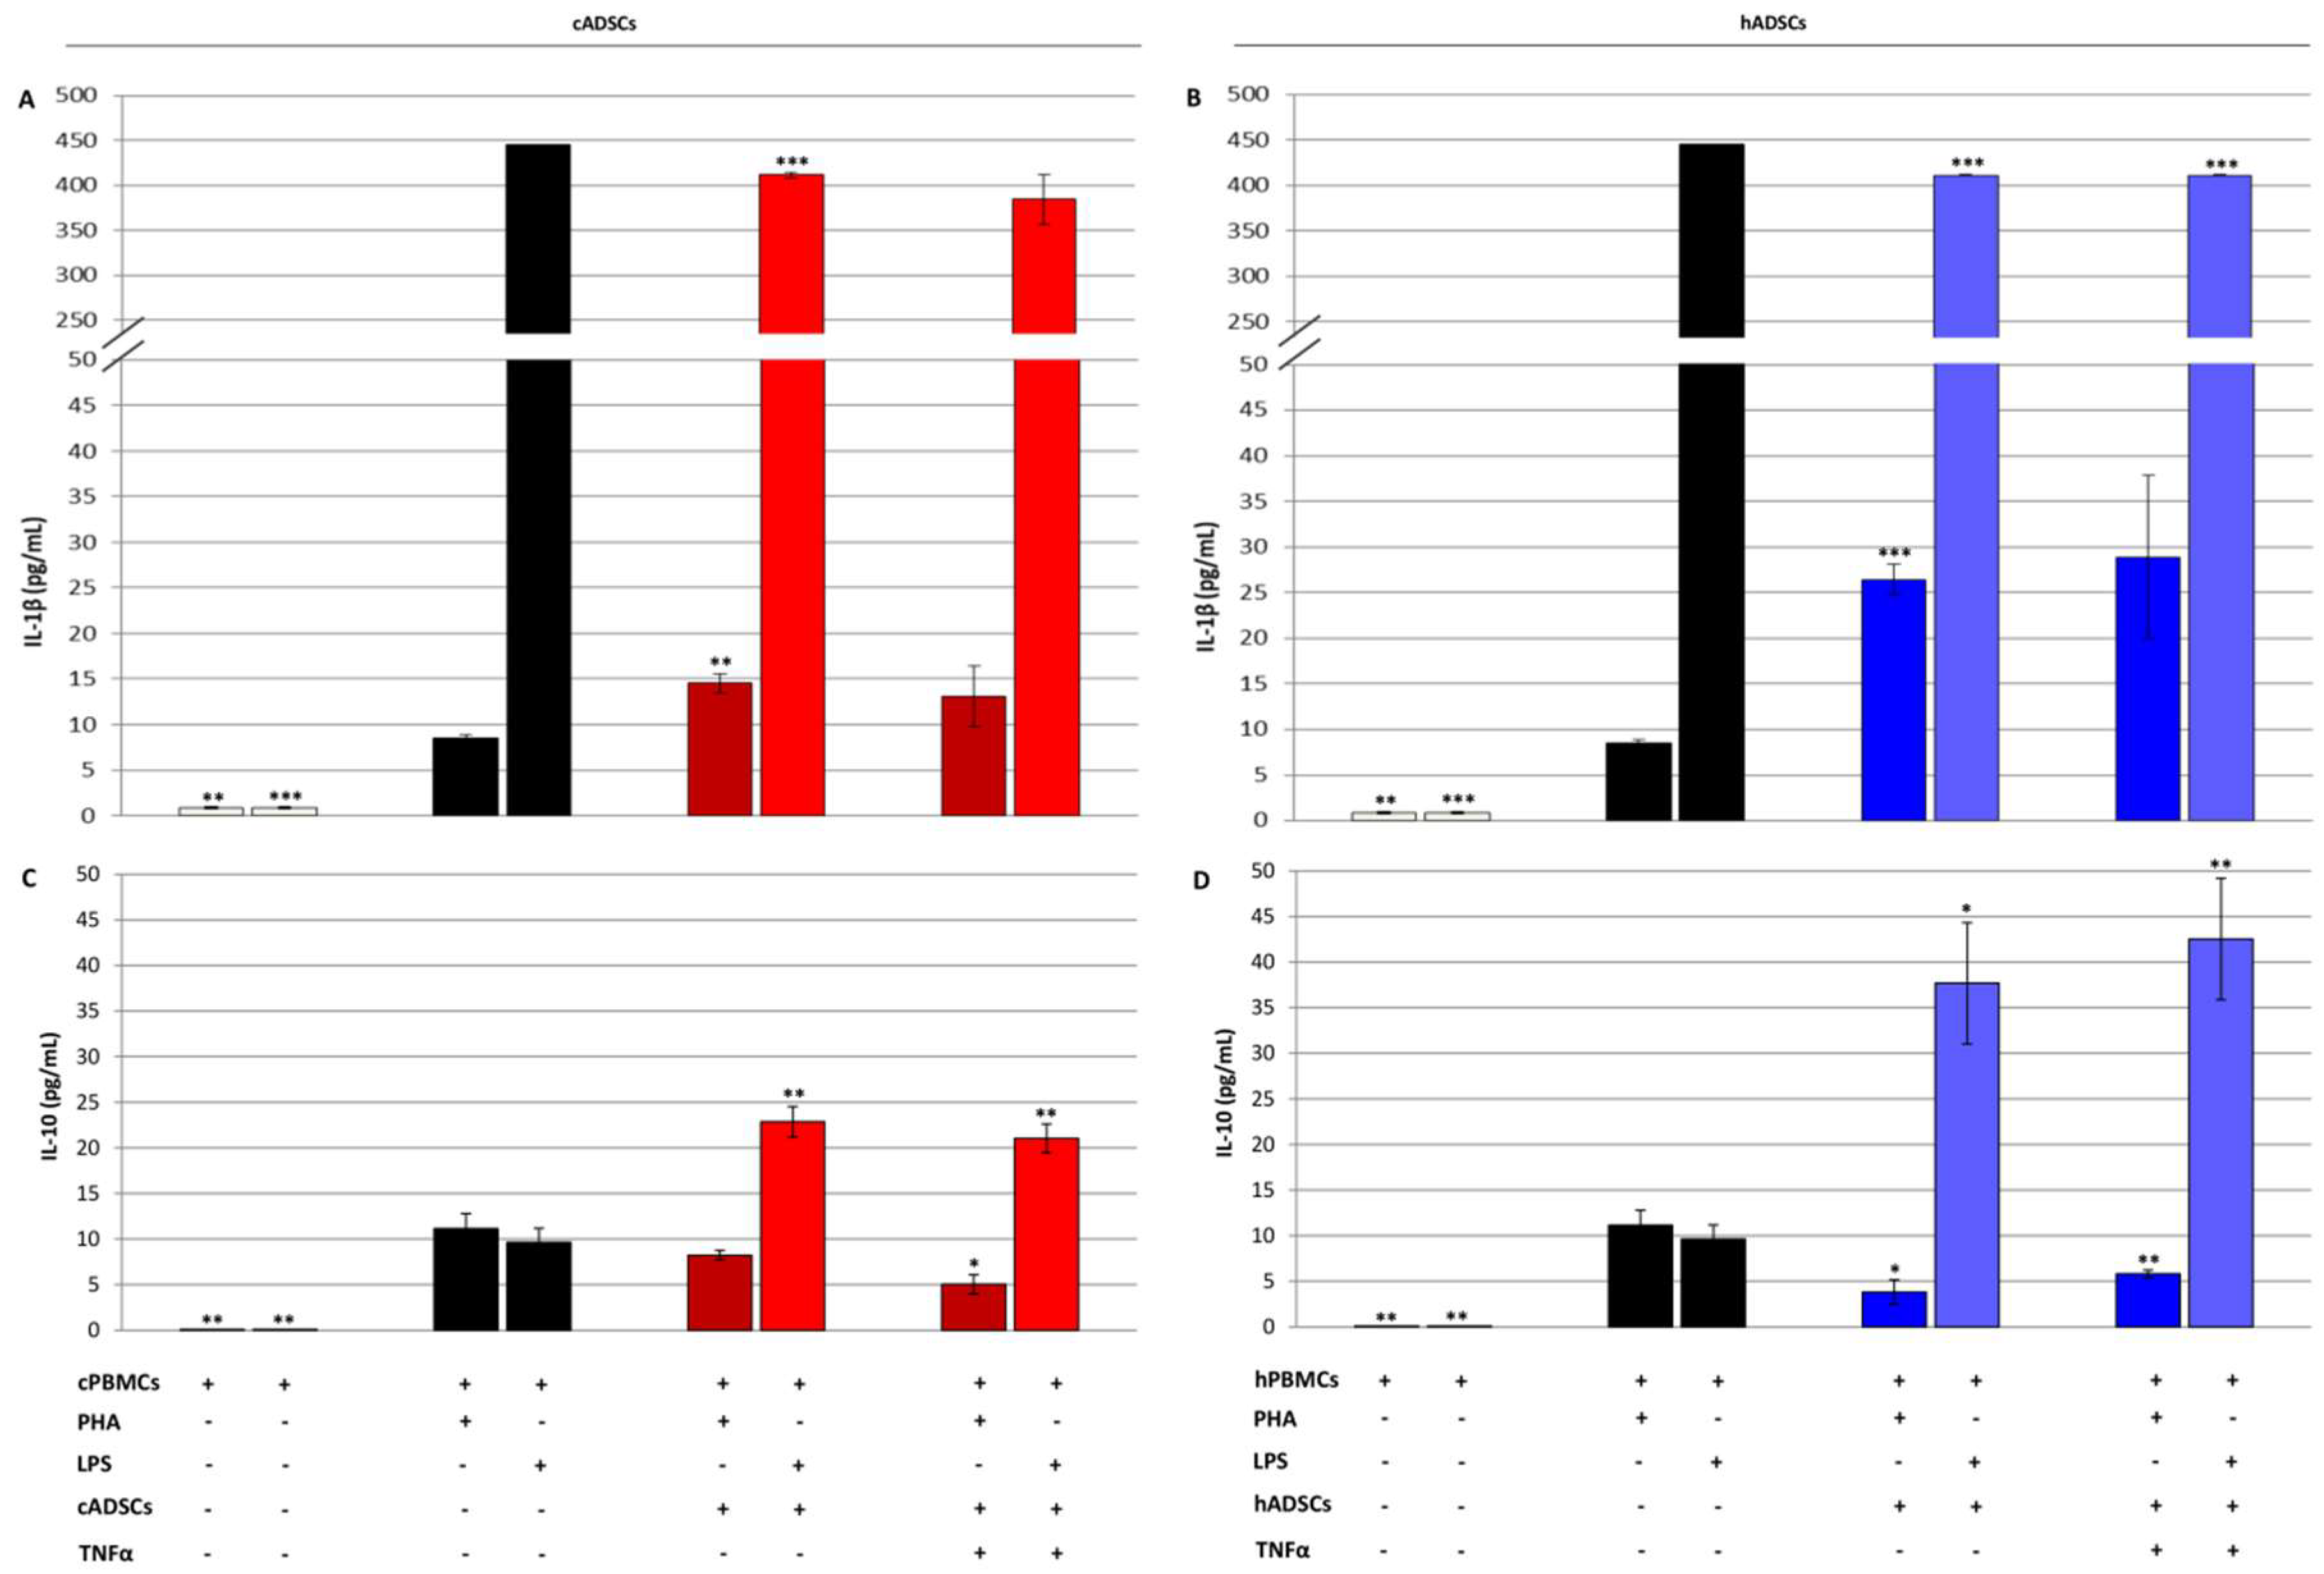
2.6. Immunomodulatory Properties of Canine and Human Stem Cells
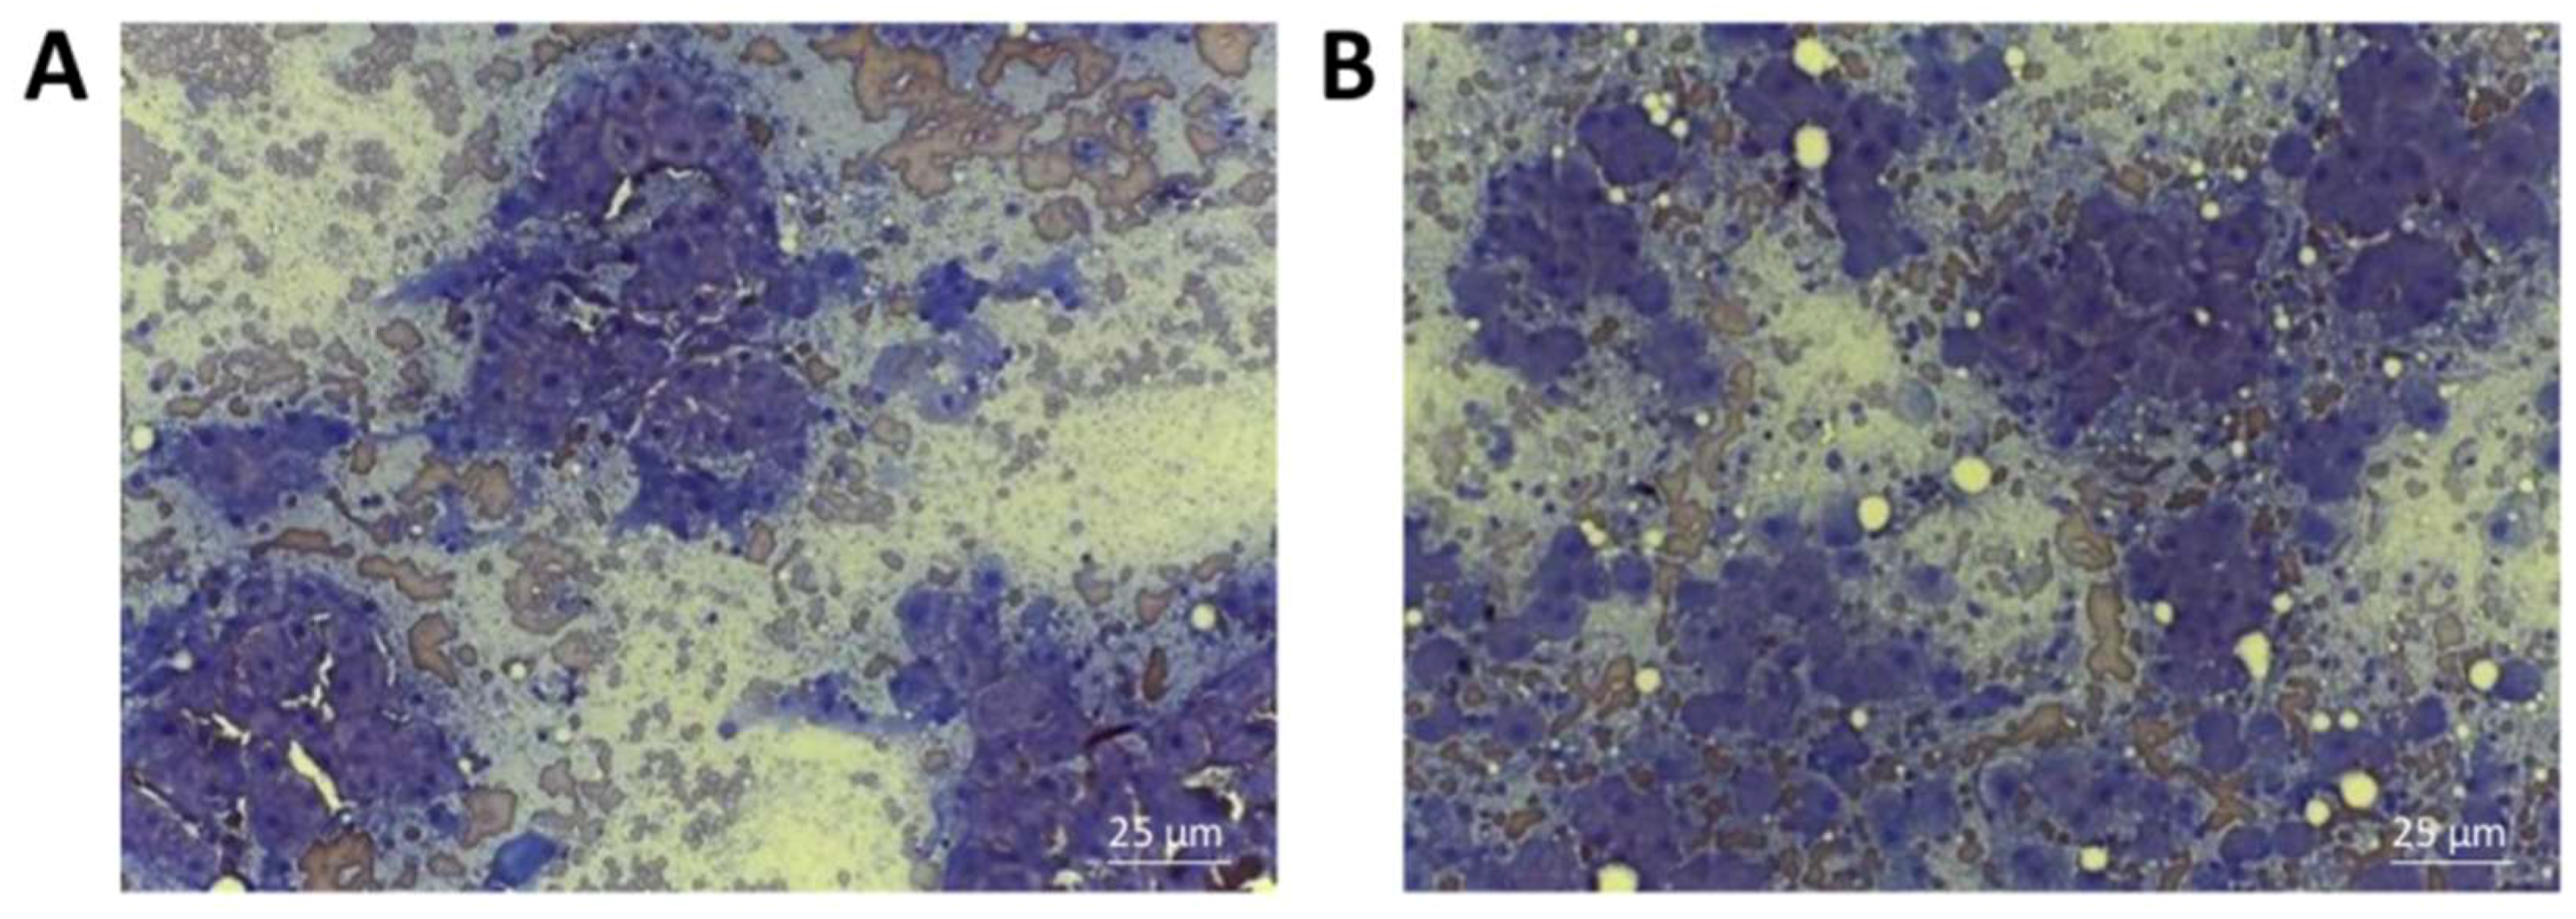
2.7. Cytological Evaluation
3. Discussion
4. Materials and Methods
4.1. Isolation and Culture of Canine and Human ADSCs
4.2. Immunofluorescence Analysis
4.3. Flow Cytometry
4.4. MTT Assay
4.5. PD Assay
4.6. Limiting Dilution CFUs-F Assay
4.7. In Vitro Differentiation of cADSCs and hADSCs
4.8. ARS Staining and Quantification
4.9. ORO Staining and Quantification
4.10. Real-Time PCR
4.11. Cell Preservation under Transportation Conditions
4.12. Transplantation of Autologous cADSCs
4.13. PBMCs Proliferation Assay and Cytokine Production Analysis
4.14. Statistical Analyses
5. Conclusions
Author Contributions
Funding
Conflicts of Interest
Abbreviations
| MSCs | mesenchymal stem cells |
| hADSCs | human adipose-derived stem cells |
| cADSCs | canine adipose-derived stem cells |
| BM | basal medium |
| ODM | osteogenic differentiation medium |
| hADM | human adipogenic differentiation medium |
| cADM | canine adipogenic differentiation medium |
References
- Zhu, W.; Shi, X.L.; Xiao, J.Q.; Gu, G.X.; Ding, Y.T.; Ma, Z.L. Effects of xenogeneic adipose-derived stem cell transplantation on acute-on-chronic liver failure. Hepatobiliary Pancreat. Dis. Int. 2013, 12, 60–67. [Google Scholar] [CrossRef]
- Kholodenko, I.V.; Yarygin, K.N. Cellular Mechanisms of Liver Regeneration and Cell-Based Therapies of Liver Diseases. Biomed. Res. Int. 2017, 2017, 8910821. [Google Scholar] [CrossRef] [PubMed]
- Rush, G.F.; Gorski, J.R.; Ripple, M.G.; Sowinski, J.; Bugelski, P.; Hewitt, W.R. Organic hydroperoxide-induced lipid peroxidation and cell death in isolated hepatocytes. Toxicol. Appl. Pharmacol. 1985, 78, 473–483. [Google Scholar] [CrossRef]
- Yu, Y.; Fisher, J.E.; Lillegard, J.B. Cell therapies for liver diseases. Liver Transpl. 2012, 18, 9–21. [Google Scholar] [CrossRef]
- Aurich, H.; Sgodda, M.; Kaltwasser, P.; Vetter, M.; Weise, A.; Liehr, T.; Brulport, M.; Hengstler, J.G.; Dollinger, M.M.; Fleig, W.E.; et al. Hepatocyte differentiation of mesenchymal stem cells from human adipose tissue in vitro promotes hepatic integration in vivo. Gut 2009, 58, 570–581. [Google Scholar] [CrossRef] [PubMed]
- Gnecchi, M.; Danieli, P.; Malpasso, G.; Ciuffreda, M.C. Paracrine Mechanisms of Mesenchymal Stem Cells in Tissue Repair. Methods Mol. Biol. 2016, 1416, 123–146. [Google Scholar] [CrossRef]
- Shi, M.; Liu, Z.W.; Wang, F.S. Immunomodulatory properties and therapeutic application of mesenchymal stem cells. Clin. Exp. Immunol. 2011, 164, 1–8. [Google Scholar] [CrossRef] [Green Version]
- Harn, H.J.; Lin, S.Z.; Hung, S.H.; Subeq, Y.M.; Li, Y.S.; Syu, W.S.; Ding, D.C.; Lee, R.P.; Hsieh, D.K.; Lin, P.C.; et al. Adipose-derived stem cells can abrogate chemical-induced liver fibrosis and facilitate recovery of liver function. Cell Transplant. 2012, 21, 2753–2764. [Google Scholar] [CrossRef]
- Koellensperger, E.; Niesen, W.; Kolbenschlag, J.; Gramley, F.; Germann, G.; Leimer, U. Human adipose tissue derived stem cells promote liver regeneration in a rat model of toxic injury. Stem Cells Int. 2013, 2013, 534263. [Google Scholar] [CrossRef]
- Fiore, E.; Malvicini, M.; Bayo, J.; Peixoto, E.; Atorrasagasti, C.; Sierra, R.; Rodríguez, M.; Gómez Bustillo, S.; García, M.G.; Aquino, J.B.; et al. Involvement of hepatic macrophages in the antifibrotic effect of IGF-I-overexpressing mesenchymal stromal cells. Stem Cell Res. Ther. 2016, 7, 172. [Google Scholar] [CrossRef]
- Roskams, T.A.; Theise, N.D.; Balabaud, C.; Bhagat, G.; Bhathal, P.S.; Bioulac-Sage, P.; Brunt, E.M.; Crawford, J.M.; Crosby, H.A.; Desmet, V.; et al. Nomenclature of the finer branches of the biliary tree: Canals, ductules, and ductular reactions in human livers. Hepatology 2004, 39, 1739–1745. [Google Scholar] [CrossRef] [PubMed] [Green Version]
- Ijzer, J.; Schotanus, B.A.; Vander Borght, S.; Roskams, T.A.; Kisjes, R.; Penning, L.C.; Rothuizen, J.; van den Ingh, T.S. Characterisation of the hepatic progenitor cell compartment in normal liver and in hepatitis: An immunohistochemical comparison between dog and man. Vet. J. 2010, 184, 308–314. [Google Scholar] [CrossRef] [PubMed]
- Yang, D.; Wang, Z.Q.; Deng, J.Q.; Liao, J.Y.; Wang, X.; Xie, J.; Deng, M.M.; Lü, M.H. Adipose-derived stem cells: A candidate for liver regeneration. J. Dig. Dis. 2015, 16, 489–498. [Google Scholar] [CrossRef]
- Spee, B.; Arends, B.; van den Ingh, T.S.; Brinkhof, B.; Nederbragt, H.; Ijzer, J.; Roskams, T.; Penning, L.C.; Rothuizen, J. Transforming growth factor beta-1 signalling in canine hepatic diseases: New models for human fibrotic liver pathologies. Liver Int. 2006, 26, 716–725. [Google Scholar] [CrossRef] [PubMed]
- Dominici, M.; Le Blanc, K.; Mueller, I.; Slaper-Cortenbach, I.; Marini, F.; Krause, D.; Deans, R.; Keating, A.; Prockop, D.J.; Horwitz, E. Minimal criteria for defining multipotent mesenchymal stromal cells. The International Society for Cellular Therapy position statement. Cytotherapy 2006, 8, 315–317. [Google Scholar] [CrossRef] [PubMed]
- Bühring, H.J.; Battula, V.L.; Treml, S.; Schewe, B.; Kanz, L.; Vogel, W. Novel markers for the prospective isolation of human MSC. Ann. N. Y. Acad. Sci. 2007, 1106, 262–271. [Google Scholar]
- Krešić, N.; Šimić, I.; Lojkić, I.; Bedeković, T. Canine Adipose Derived Mesenchymal Stem Cells Transcriptome Composition Alterations: A Step towards Standardizing Therapeutic. Stem Cells Int. 2017, 2017, 4176292. [Google Scholar] [CrossRef] [PubMed]
- Takemitsu, H.; Zhao, D.; Yamamoto, I.; Harada, Y.; Michishita, M.; Arai, T. Comparison of bone marrow and adipose tissue-derived canine mesenchymal stem cells. BMC Vet. Res. 2012, 8, 150. [Google Scholar] [CrossRef]
- Teshima, T.; Matsumoto, H.; Koyama, H. Soluble factors from adipose tissue-derived mesenchymal stem cells promote canine hepatocellular carcinoma cell proliferation and invasion. PLoS ONE 2018, 13, e0191539. [Google Scholar] [CrossRef]
- Carrade, D.D.; Borjesson, D.L. Immunomodulation by mesenchymal stem cells in veterinary species. Comp. Med. 2013, 63, 207–217. [Google Scholar]
- Russell, K.A.; Chow, N.H.; Dukoff, D.; Gibson, T.W.; LaMarre, J.; Betts, D.H.; Koch, T.G. Characterization and Immunomodulatory Effects of Canine Adipose Tissue- and Bone Marrow-Derived Mesenchymal Stromal Cells. PLoS ONE 2016, 11, e0167442. [Google Scholar] [CrossRef] [PubMed]
- Ivanovska, A.; Grolli, S.; Borghetti, P.; Ravanetti, F.; Conti, V.; De Angelis, E.; Macchi, F.; Ramoni, R.; Martelli, P.; Gazza, F.; et al. Immunophenotypical characterization of canine mesenchymal stem cells from perivisceral and subcutaneous adipose tissue by a species-specific panel of antibodies. Res. Vet. Sci. 2017, 114, 51–58. [Google Scholar] [CrossRef] [PubMed]
- Chow, L.; Johnson, V.; Coy, J.; Regan, D.; Dow, S. Mechanisms of Immune Suppression Utilized by Canine Adipose and Bone Marrow-Derived Mesenchymal Stem Cells. Stem Cells Dev. 2017, 26, 374–389. [Google Scholar] [CrossRef] [PubMed] [Green Version]
- Alcayaga-Miranda, F.; Cuenca, J.; Luz-Crawford, P.; Aguila-Díaz, C.; Fernandez, A.; Figueroa, FE.; Khoury, M. Characterization of menstrual stem cells: Angiogenic effect, migration and hematopoietic stem cell support in comparison with bone marrow mesenchymal stem cells. Stem Cell Res Ther. 2015, 6, 32. [Google Scholar] [CrossRef] [PubMed]
- Strijbosch, L.W.; Buurman, W.A.; Does, R.J.; Zinken, P.H.; Groenewegen, G. Limiting dilution assays. Experimental design and statistical analysis. J. Immunol. Methods. 1987, 97, 133–140. [Google Scholar] [CrossRef]
- Binato, R.; de Souza Fernandez, T.; Lazzarotto-Silva, C.; Du Rocher, B.; Mencalha, A.; Pizzatti, L.; Bouzas, L.F.; Abdelhay, E. Stability of human mesenchymal stem cells during in vitro culture: Considerations for cell therapy. Cell Prolif. 2013, 46, 10–22. [Google Scholar] [CrossRef] [PubMed]
- Spencer, N.D.; Chun, R.; Vidal, M.A.; Gimble, J.M.; Lopez, M.J. In vitro expansion and differentiation of fresh and revitalized adult canine bone marrow-derived and adipose tissue-derived stromal cells. Vet. J. 2012, 191, 231–239. [Google Scholar] [CrossRef] [Green Version]
- Zhang, N.; Dietrich, M.A.; Lopez, M.J. Canine intra-articular multipotent stromal cells (MSC) from adipose tissue have the highest in vitro expansion rates, multipotentiality, and MSC immunophenotypes. Vet. Surg. 2013, 42, 137–146. [Google Scholar] [CrossRef]
- Dmitrieva, R.I.; Minullina, I.R.; Bilibina, A.A.; Tarasova, O.V.; Anisimov, S.V.; Zaritskey, A.Y. Bone marrow- and subcutaneous adipose tissue-derived mesenchymal stem cells: Differences and similarities. Cell Cycle 2012, 11, 377–383. [Google Scholar] [CrossRef] [Green Version]
- Otto, F.; Thornell, A.P.; Crompton, T.; Denzel, A.; Gilmour, K.C.; Rosewell, I.R.; Stamp, G.W.; Beddington, R.S.; Mundlos, S.; Olsen, B.R.; et al. Cbfa1, a candidate gene for cleidocranial dysplasia syndrome, is essential for osteoblast differentiation and bone development. Cell 1997, 89, 765–771. [Google Scholar] [CrossRef]
- Zou, L.; Kidwai, F.K.; Kopher, R.A.; Motl, J.; Kellum, C.A.; Westendorf, J.J.; Kaufman, D.S. Use of RUNX2 expression to identify osteogenic progenitor cells derived from human embryonic stem cells. Stem Cell Rep. 2015, 4, 190–198. [Google Scholar] [CrossRef] [PubMed]
- Sinha, K.M.; Zhou, X. Genetic and molecular control of osterix in skeletal formation. J. Cell Biochem. 2013, 114, 975–984. [Google Scholar] [CrossRef] [PubMed] [Green Version]
- Pittenger, M.F.; Mackay, A.M.; Beck, S.C.; Jaiswal, R.K.; Douglas, R.; Mosca, J.D.; Moorman, M.A.; Simonetti, D.W.; Craig, S.; Marshak, D.R. Multilineage potential of adult human mesenchymal stem cells. Science 1999, 284, 143–147. [Google Scholar] [CrossRef] [PubMed]
- Neupane, M.; Chang, C.C.; Kiupel, M.; Yuzbasiyan-Gurkan, V. Isolation and characterization of canine adipose-derived mesenchymal stem cells. Tissue Eng. Part A 2008, 14, 1007–1015. [Google Scholar] [CrossRef] [PubMed]
- Contador, D.; Ezquer, F.; Espinosa, M.; Arango-Rodriguez, M.; Puebla, C.; Sobrevia, L.; Conget, P. Dexamethasone and rosiglitazone are sufficient and necessary for producing functional adipocytes from mesenchymal stem cells. Exp. Biol. Med. (Maywood) 2015, 240, 1235–1246. [Google Scholar] [CrossRef] [PubMed]
- Bertolo, A.; Schlaefli, P.; Malonzo-Marty, C.; Staal, J.; Bühring, H.J.; Martens, A.C. Comparative Characterization of Canine and Human Mesenchymal Stem Cells Derived from Bone Marrow. Int. J. Stem Cell Res. Ther. 2015, 2, 005. [Google Scholar] [CrossRef]
- Yaneselli, K.M.; Kuhl, C.P.; Terraciano, P.B.; de Oliveira, F.S.; Pizzato, S.B.; Pazza, K.; Magrisso, A.B.; Torman, V.; Rial, A.; Moreno, M.; et al. Comparison of the characteristics of canine adipose tissue-derived mesenchymal stem cells extracted from different sites and at different passage numbers. J. Vet. Sci. 2018, 19, 13–20. [Google Scholar] [CrossRef] [PubMed] [Green Version]
- Farmer, S.R. Transcriptional control of adipocyte formation. Cell Metab. 2006, 4, 263–273. [Google Scholar] [CrossRef]
- Mastick, C.C.; Aebersold, R.; Lienhard, G. Characterization of a major protein in GLUT4 vesicles. Concentration in the vesicles and insulin-stimulated translocation to the plasma membrane. J. Biol. Chem. 1994, 269, 6089–6092. [Google Scholar]
- Wittig, O.; Diaz-Solano, D.; Cardier, J. Viability and functionality of mesenchymal stromal cells loaded on collagen microspheres and incorporated into plasma clots for orthopaedic application: Effect of storage conditions. Injury 2018, 49, 1052–1057. [Google Scholar] [CrossRef]
- Muraki, K.; Hirose, M.; Kotobuki, N.; Kato, Y.; Machida, H.; Takakura, Y.; Ohgushi, H. Assessment of viability and osteogenic ability of human mesenchymal stem cells after being stored in suspension for clinical transplantation. Tissue Eng. 2006, 12, 1711–1719. [Google Scholar] [CrossRef] [PubMed]
- Sohn, H.S.; Heo, J.S.; Kim, H.S.; Choi, Y.; Kim, H.O. Duration of in vitro storage affects the key stem cell features of human bone marrow-derived mesenchymal stromal cells for clinical transplantation. Cytotherapy 2013, 15, 460–466. [Google Scholar] [CrossRef] [PubMed]
- Bronzini, I.; Patruno, M.; Iacopetti, I.; Martinello, T. Influence of temperature, time and different media on mesenchymal stromal cells shipped for clinical application. Vet. J. 2012, 194, 121–123. [Google Scholar] [CrossRef] [PubMed]
- Liedtke, C.; Luedde, T.; Sauerbruch, T.; Scholten, D.; Streetz, K.; Tacke, F.; Tolba, R.; Trautwein, C.; Trebicka, J.; Weiskirchen, R. Experimental liver fibrosis research: Update on animal models, legal issues and translational aspects. Fibrogenesis Tissue Repair. 2013, 6, 19. [Google Scholar] [CrossRef] [PubMed]
- Hao, T.; Chen, J.; Zhi, S.; Zhang, Q.; Chen, G.; Yu, F. Comparison of bone marrow-vs. adipose tissue-derived mesenchymal stem cells for attenuating liver fibrosis. Exp. Ther. Med. 2017, 14, 5956–5964. [Google Scholar] [CrossRef] [PubMed]
- Zare, H.; Jamshidi, S.; Dehghan, M.M.; Saheli, M.; Piryaei, A. Bone marrow or adipose tissue mesenchymal stem cells: Comparison of the therapeutic potentials in mice model of acute liver failure. J. Cell. Biochem. 2018, 119, 5834–5842. [Google Scholar] [CrossRef] [PubMed]
- Volk, S.W.; Theoret, C. Translating stem cell therapies: The role of companion animals in regenerative medicine. Wound Repair Regen. 2013, 21, 382–394. [Google Scholar] [CrossRef] [Green Version]
- Arzi, B.; Mills-Ko, E.; Verstraete, F.J.; Kol, A.; Walker, N.J.; Badgley, M.R.; Fazel, N.; Murphy, W.J.; Vapniarsky, N.; Borjesson, D.L. Therapeutic Efficacy of Fresh, Autologous Mesenchymal Stem Cells for Severe Refractory Gingivostomatitis in Cats. Stem Cells Transl. Med. 2016, 5, 75–86. [Google Scholar] [CrossRef]
- Teshima, T.; Matsumoto, H.; Michishita, M.; Matsuoka, A.; Shiba, M.; Nagashima, T.; Koyama, H. Allogenic Adipose Tissue-Derived Mesenchymal Stem Cells Ameliorate Acute Hepatic Injury in Dogs. Stem Cells Int. 2017, 2017, 3892514. [Google Scholar] [CrossRef]
- Spriet, M.; Hunt, G.B.; Walker, N.J.; Borjesson, D.L. Scintigraphic tracking of mesenchymal stem cells after portal, systemic intravenous and splenic administration in healthy beagle dogs. Vet. Radiol. Ultrasound 2015, 56, 327–334. [Google Scholar] [CrossRef]
- McGill, M.R. The past and present of serum aminotransferases and the future of liver injury biomarkers. EXCLI J. 2016, 15, 817–828. [Google Scholar] [CrossRef] [PubMed]
- Yamazaki, M.; Miyake, M.; Sato, H.; Masutomi, N.; Tsutsui, N.; Adam, K.P.; Alexander, D.C.; Lawton, K.A.; Milburn, M.V.; Ryals, J.A.; et al. Perturbation of bile acid homeostasis is an early pathogenesis event of drug induced liver injury in rats. Toxicol. Appl. Pharmacol. 2013, 268, 79–89. [Google Scholar] [CrossRef] [PubMed]
- Luo, L.; Schomaker, S.; Houle, C.; Aubrecht, J.; Colangelo, J.L. Evaluation of serum bile acid profiles as biomarkers of liver injury in rodents. Toxicol. Sci. 2014, 137, 12–25. [Google Scholar] [CrossRef] [PubMed]
- Kim, S.J.; Park, K.C.; Lee, J.U.; Kim, K.J.; Kim, D.G. Therapeutic potential of adipose tissue-derived stem cells for liver failure according to the transplantation routes. J. Korean Surg. Soc. 2011, 81, 176–186. [Google Scholar] [CrossRef] [PubMed]
- Deng, L.; Liu, G.; Wu, X.; Wang, Y.; Tong, M.; Liu, B.; Wang, K.; Peng, Y.; Kong, X. Adipose derived mesenchymal stem cells efficiently rescue carbon tetrachloride-induced acute liver failure in mouse. Sci. World J. 2014, 2014, 103643. [Google Scholar] [CrossRef] [PubMed]
- Chen, G.; Jin, Y.; Shi, X.; Qiu, Y.; Zhang, Y.; Cheng, M.; Wang, X.; Chen, C.; Wu, Y.; Jiang, F.; et al. Adipose-derived stem cell-based treatment for acute liver failure. Stem Cell Res. Ther. 2015, 6, 40. [Google Scholar] [CrossRef] [PubMed] [Green Version]
- Vilalta, M.; Dégano, I.R.; Bagó, J.; Gould, D.; Santos, M.; García-Arranz, M.; Ayats, R.; Fuster, C.; Chernajovsky, Y.; García-Olmo, D.; et al. Biodistribution, long-term survival, and safety of human adipose tissue-derived mesenchymal stem cells transplanted in nude mice by high sensitivity non-invasive bioluminescence imaging. Stem Cells Dev. 2008, 17, 993–1003. [Google Scholar] [CrossRef] [PubMed]
- Singer, N.G.; Caplan, A.I. Mesenchymal stem cells: Mechanisms of inflammation. Annu. Rev. Pathol. 2011, 6, 457–478. [Google Scholar] [CrossRef]
- Kang, J.W.; Kang, K.S.; Koo, H.C.; Park, J.R.; Choi, E.W.; Park, Y.H. Soluble factors-mediated immunomodulatory effects of canine adipose tissue-derived mesenchymal stem cells. Stem Cells Dev. 2008, 17, 681–693. [Google Scholar] [CrossRef]
- Le Blanc, K.; Tammik, L.; Sundberg, B.; Haynesworth, S.E.; Ringdén, O. Mesenchymal stem cells inhibit and stimulate mixed lymphocyte cultures and mitogenic responses independently of the major histocompatibility complex. Scand. J. Immunol. 2003, 57, 11–20. [Google Scholar] [CrossRef]
- Zhao, Q.; Ren, H.; Han, Z. Mesenchymal stem cells: Immunomodulatory capability and clinical potential in immune diseases. J. Cell. Immunother. 2016, 2, 3–20. [Google Scholar] [CrossRef]
- Aggarwal, S.; Pittenger, M.F. Human mesenchymal stem cells modulate allogeneic immune cell responses. Blood 2005, 105, 1815–1822. [Google Scholar] [CrossRef] [PubMed] [Green Version]
- da Silva Meirelles, L.; Fontes, A.M.; Covas, D.T.; Caplan, A.I. Mechanisms involved in the therapeutic properties of mesenchymal stem cells. Cytokine Growth Factor Rev. 2009, 20, 419–427. [Google Scholar] [CrossRef] [PubMed]
- de Swart, R.L.; Kluten, R.M.; Huizing, C.J.; Vedder, L.J.; Reijnders, P.J.; Visser, I.K.; UytdeHaag, F.G.; Osterhaus, A.D. Mitogen and antigen induced B and T cell responses of peripheral blood mononuclear cells from the harbour seal (Phoca vitulina). Vet. Immunol. Immunopathol. 1993, 37, 217–230. [Google Scholar] [CrossRef]
- Ulmer, A.J.; Flad, H.; Rietschel, T.; Mattern, T. Induction of proliferation and cytokine production in human T lymphocytes by lipopolysaccharide (LPS). Toxicology 2000, 152, 37–45. [Google Scholar] [CrossRef]
- Ren, G.; Zhang, L.; Zhao, X.; Xu, G.; Zhang, Y.; Roberts, A.I.; Zhao, R.C.; Shi, Y. Mesenchymal stem cell-mediated immunosuppression occurs via concerted action of chemokines and nitric oxide. Cell Stem Cell. 2008, 2, 141–150. [Google Scholar] [CrossRef] [PubMed]
- Kim, H.S.; Kim, K.H.; Kim, S.H.; Kim, Y.S.; Koo, K.T.; Kim, T.I.; Seol, Y.J.; Ku, Y.; Rhyu, I.C.; Chung, C.P.; et al. Immunomodulatory effect of canine periodontal ligament stem cells on allogenic and xenogenic peripheral blood mononuclear cells. J. Periodontal Implant Sci. 2010, 40, 265–270. [Google Scholar] [CrossRef] [PubMed]
- Li, W.; Ren, G.; Huang, Y.; Su, J.; Han, Y.; Li, J.; Chen, X.; Cao, K.; Chen, Q.; Shou, P.; et al. Mesenchymal stem cells: A double-edged sword in regulating immune responses. Cell Death Differ. 2012, 19, 1505–1513. [Google Scholar] [CrossRef]
- Wojdasiewicz, P.; Poniatowski, Ł.A.; Szukiewicz, D. The role of inflammatory and anti-inflammatory cytokines in the pathogenesis of osteoarthritis. Mediat. Inflamm. 2014, 2014, 561459. [Google Scholar] [CrossRef]
- Bertolo, A.; Pavlicek, D.; Gemperli, A.; Baur, M.; Pötzel, T.; Stoyanov, J. Increased motility of mesenchymal stem cells is correlated with inhibition of stimulated peripheral blood mononuclear cells in vitro. J. Stem Cells Regen. Med. 2017, 13, 62–74. [Google Scholar]
- Wu, H.; Wen, D.; Mahato, R.I. Third-party mesenchymal stem cells improved human islet transplantation in a humanized diabetic mouse model. Mol. Ther. 2013, 21, 1778–1786. [Google Scholar] [CrossRef]
- Rasmusson, I.; Ringdén, O.; Sundberg, B.; Le Blanc, K. Mesenchymal stem cells inhibit lymphocyte proliferation by mitogens and alloantigens by different mechanisms. Exp. Cell Res. 2005, 305, 33–41. [Google Scholar] [CrossRef]
- Jessop, J.J.; Hoffman, T. Production and release of IL-1 beta by human peripheral blood monocytes in response to diverse stimuli: Possible role of “microdamage” to account for unregulated release. Lymphokine Cytokine Res. 1993, 12, 51–58. [Google Scholar] [PubMed]
- Janský, L.; Reymanová, P.; Kopecký, J. Dynamics of cytokine production in human peripheral blood mononuclear cells stimulated by LPS or infected by Borrelia. Physiol. Res. 2003, 52, 593–598. [Google Scholar]
- Németh, K.; Leelahavanichkul, A.; Yuen, P.S.; Mayer, B.; Parmelee, A.; Doi, K.; Robey, P.G.; Leelahavanichkul, K.; Koller, B.H.; Brown, J.M.; Hu, X.; et al. Bone marrow stromal cells attenuate sepsis via prostaglandin E(2)-dependent reprogramming of host macrophages to increase their interleukin-10 production. Nat. Med. 2009, 15, 42–49. [Google Scholar]
- Poyet, P.; Doualla-Bell, F.; Lévesque, D.; Ritchot, N.; Guay, J.M.; Marceau, F.; Gaudreault, R.C. Down-regulation of interleukin-1beta production and PGE2 accumulation by an indomethacin-phenylalanine derivative in human monocytes. Life Sci. 1998, 62, 2241–2247. [Google Scholar] [CrossRef]
- Walker, N.M.; Badri, L.N.; Wadhwa, A.; Wettlaufer, S.; Peters-Golden, M.; Lama, V.N. Prostaglandin E2 as an inhibitory modulator of fibrogenesis in human lung allografts. Am. J. Respir. Crit. Care Med. 2012, 185, 77–84. [Google Scholar] [CrossRef]
- Eulenberg, V.M.; Lidbury, J.A. Hepatic Fibrosis in Dogs. J. Vet. Intern. Med. 2018, 32, 26–41. [Google Scholar] [CrossRef]
- Masserdotti, C.; Bertazzolo, W. Cytologic features of hepatic fibrosis in dogs: A retrospective study on 22 cases. Vet. Clin. Pathol. 2016, 45, 361–367. [Google Scholar] [CrossRef]
- Sivolella, S.; Brunello, G.; Ferroni, L.; Berengo, M.; Meneghello, R.; Savio, G.; Piattelli, A.; Gardin, C.; Zavan, B. A Novel In Vitro Technique for Assessing Dental Implant Osseointegration. Tissue Eng. Part C Methods 2015, 22, 132–141. [Google Scholar] [CrossRef]
- Ferroni, L.; Gardin, C.; Bressan, E.; Calvo-Guirado, J.L.; Isola, M.; Piattelli, A.; Zavan, B. Ionized Ti Surfaces Increase Cell Adhesion Properties of Mesenchymal Stem Cells. J. Biomater. Tissue Eng. 2015, 5, 417–425. [Google Scholar] [CrossRef]
- Cristofalo, V.J.; Allen, R.G.; Pignolo, R.J.; Martin, B.G.; Beck, J.C. Relationship between donor age and the replicative lifespan of human cells in culture: A reevaluation. Proc. Natl. Acad. Sci. USA 1998, 95, 10614–10619. [Google Scholar] [CrossRef] [PubMed] [Green Version]
- Wu, X.; Peters, J.M.; Gonzalez, F.J.; Prasad, H.S.; Rohrer, M.D.; Gimble, J.M. Frequency of stromal lineage colony forming units in bone marrow of peroxisome proliferator-activated receptor-alpha-null mice. Bone 2000, 26, 21–26. [Google Scholar] [CrossRef]
- Ferroni, L.; Tocco, I.; De Pieri, A.; Menarin, M.; Fermi, E.; Piattelli, A.; Gardin, C.; Zavan, B. Pulsed magnetic therapy increases osteogenic differentiation of mesenchymal stem cells only if they are pre-committed. Life Sci. 2016, 152, 44–51. [Google Scholar] [CrossRef] [PubMed]
- Gardin, C.; Ricci, S.; Ferroni, L.; Guazzo, R.; Sbricoli, L.; De Benedictis, G.; Finotti, L.; Isola, M.; Bressan, E.; Zavan, B. Decellularization and Delipidation Protocols of Bovine Bone and Pericardium for Bone Grafting and Guided Bone Regeneration Procedures. PLoS ONE 2015, 10, e0132344. [Google Scholar] [CrossRef] [PubMed]
- Pfaffl, M.W. A new mathematical model for relative quantification in real-time RT-PCR. Nucleic Acids Res. 2001, 29, e45. [Google Scholar] [CrossRef]


| Surface Marker | cADSCs | hADSCs |
|---|---|---|
| CD29 | 99.714 ± 0.130 | 95.481 ± 0.325 |
| CD44 | 99.206 ± 0.105 | 99.811 ± 0.075 |
| CD73 | 0.011 ± 0.005 | 98.938 ± 0.025 |
| CD90 | 93.480 ± 0.350 | 99.299 ± 0.020 |
| CD105 | 0.013 ± 0.010 | 99.649 ± 0.025 |
| CD14 | 0.163 ± 0.000 | 0.045 ± 0.000 |
| CD34 | 0.006 ± 0.100 | 0.388 ± 0.250 |
| CD45 | 0.000 ± 0.000 | 0.000 ± 0.000 |
| CFUs-F | cADSCs | hADSCs |
|---|---|---|
| p1 | 1/(1.92 × 103 ± 27) | 1/(1.86 × 103 ± 32) |
| p3 | 1/(2.34 × 103 ± 26) | 1/(2.18 × 103 ± 28) |
| Gene | Sequence FOR (5′–3′) | Sequence REV (5′–3′) | Length (bp) |
|---|---|---|---|
| cADIPOQ | CCGTTCGGCATTCAGTGTG | TGTCTTTCTTGTAGAGGCTGACC | 206 |
| cALPL | CATTGCCCACTCCTCTCTGAA | GTTTCTTTCTCTTCCTCACTGACCA | 167 |
| cCEBPA | GCCTTGGAAACGCAAACTCG | GTCCCTGTATGTCCTCCCTTC | 219 |
| cFABP4 | CCATCCTATTCTAGACCGTTGAGAG | GCCACCATAAGAACATTTGCATCA | 211 |
| cGLUT4 | TCTCCTGCTCGCCTTCTTC | CCTAAGTAATCGAGTTCCGTGCTG | 147 |
| cOC | CCTTTGGGATTTGGCGTCC | GGTTCTGTCTGGGTCTGTGAG | 199 |
| cOPN | TGACTTAGATGACGACTCCAACG | TGGGACTTCTTAGATTTGGACCTC | 174 |
| cOSX | ACGACACTGGGCAAAGCAG | ATGTCCAGGGAGGTGTAGAC | 285 |
| cPPARG | GCAGGAGATCACAGAGTACGC | CATCAAGGACGCCAGCATC | 124 |
| cRANKL | ACACTGATGAAAGGAGGTAGCAC | TGTTGCATCTTGATCTGGGTCC | 159 |
| cRUNX2 | GCAAGTTCCAGCAGATCGC | GTGGTTGTCAGGAGTGGTCA | 168 |
| cTFRC | AGCCACCTCCAGACTAACG | GCAGAGTGTGAGAGCCAGA | 176 |
| Gene | Sequence FOR (5′–3′) | Sequence REV (5′–3′) | Length (bp) |
|---|---|---|---|
| hADIPOQ | GTTGTGTGCCTGTTTCTGACC | GCATCTATCATCCACTCTCCTATTTCTG | 153 |
| hALPL | GGCTTCTTCTTGCTGGTGGA | CAAATGTGAAGACGTGGGAATGG | 181 |
| hCEBPA | GGACTTGGTGCGTCTAAGATGAG | GCATTGGAGCGGTGAGTTTG | 147 |
| hFABP4 | TGACCTGGACTGAAGTTCGC | AAGCACAATGAATACATCATTACATCACC | 193 |
| hGLUT4 | CCAGTATGTTGCGGAGGCTA | TCAAGTTCTGTGCTGGGTTTCA | 189 |
| hOC | GCAGCGAGGTAGTGAAGAGAC | AGCAGAGCGACACCCTA | 193 |
| hOPN | TGGAAAGCGAGGAGTTGAATGG | GCTCATTGCTCTCATCATTGGC | 192 |
| hOSX | TCAGAATCTCAGTTGATAGGGTTTCTC | GGGTACATTCCAGTCCTTCTCC | 183 |
| hPPARG | CAGGAGATCACAGAGTATGCCAA | TCCCTTGTCATGAAGCCTTGG | 173 |
| hRANKL | TCAGCATCGAGGTCTCCAAC | CCATGCCTCTTAGTAGTCTCACA | 194 |
| hRUNX2 | AGCCTTACCAAACAACACAACAG | CCATATGTCCTCTCAGCTCAGC | 175 |
| hTFRC | TGTTTGTCATAGGGCAGTTGGAA | ACACCCGAACCAGGAATCTC | 222 |
© 2018 by the authors. Licensee MDPI, Basel, Switzerland. This article is an open access article distributed under the terms and conditions of the Creative Commons Attribution (CC BY) license (http://creativecommons.org/licenses/by/4.0/).
Share and Cite
Gardin, C.; Ferroni, L.; Bellin, G.; Rubini, G.; Barosio, S.; Zavan, B. Therapeutic Potential of Autologous Adipose-Derived Stem Cells for the Treatment of Liver Disease. Int. J. Mol. Sci. 2018, 19, 4064. https://doi.org/10.3390/ijms19124064
Gardin C, Ferroni L, Bellin G, Rubini G, Barosio S, Zavan B. Therapeutic Potential of Autologous Adipose-Derived Stem Cells for the Treatment of Liver Disease. International Journal of Molecular Sciences. 2018; 19(12):4064. https://doi.org/10.3390/ijms19124064
Chicago/Turabian StyleGardin, Chiara, Letizia Ferroni, Gloria Bellin, Giuseppe Rubini, Simone Barosio, and Barbara Zavan. 2018. "Therapeutic Potential of Autologous Adipose-Derived Stem Cells for the Treatment of Liver Disease" International Journal of Molecular Sciences 19, no. 12: 4064. https://doi.org/10.3390/ijms19124064