Abstract
Propagation of some Olea europaea L. cultivars is strongly limited due to recalcitrant behavior in adventitious root formation by semi-hardwood cuttings. One example is the cultivar ”Galega vulgar”. The formation of adventitious roots is considered a morphological response to stress. Alternative oxidase (AOX) is the terminal oxidase of the alternative pathway of the plant mitochondrial electron transport chain. This enzyme is well known to be induced in response to several biotic and abiotic stress situations. This work aimed to characterize the alternative oxidase 1 (AOX1)-subfamily in olive and to analyze the expression of transcripts during the indole-3-butyric acid (IBA)-induced in vitro adventitious rooting (AR) process. OeAOX1a (acc. no. MF410318) and OeAOX1d (acc. no. MF410319) were identified, as well as different transcript variants for both genes which resulted from alternative polyadenylation events. A correlation between transcript accumulation of both OeAOX1a and OeAOX1d transcripts and the three distinct phases (induction, initiation, and expression) of the AR process in olive was observed. Olive AOX1 genes seem to be associated with the induction and development of adventitious roots in IBA-treated explants. A better understanding of the molecular mechanisms underlying the stimulus needed for the induction of adventitious roots may help to develop more targeted and effective rooting induction protocols in order to improve the rooting ability of difficult-to-root cultivars.
1. Introduction
Olive (Olea europaea L.) is one of the oldest agricultural fruit crops worldwide and is mostly cultivated for olive oil production. Olive orchards are predominantly concentrated in the Mediterranean basin [], although they have recently expanded to new regions due to the importance of olive oil in the human diet. Portugal has a production area of 430,000 ha of olive orchards, which represents about 5% of the world olive oil production. Portuguese olive oils are known worldwide for their exceptional organoleptic characteristics. Nowadays, olive plants are mostly propagated by semi-hardwood cuttings, a process in which adventitious root formation is a key factor. However, some of the agronomically interesting Portuguese olive cultivars used for oil production have been revealed to be recalcitrant to adventitious rooting (AR), which leads to a reduced availability of those varieties in the nurseries that are to be used in new orchard plantations. For example, ”Galega vulgar” usually presents average rooting rates of 5–20% when semi-hardwood cuttings are used, being considered a difficult-to-root cultivar []. Similar recalcitrant behaviour has been described for autochthone cultivars with high agronomical interest in different countries (for review see []). In this frame, the study of AR in O. europaea, in view of the optimization of the process in stem cuttings of recalcitrant olive cultivars, has become an important research topic, which requires fundamental and applied research at different levels.
The process of AR at the base of stem cuttings is considered a morphological response to stress [] that can be influenced by a large number of interacting internal and external factors. It involves hormone-transmitted metabolic changes, molecular transduction pathway activation, protein degradation, and protein de novo synthesis, as well as adaptive global genome regulation (for review see []). The cutting’s removal from the mother tree and subsequent treatment with auxin are both stress factors that are highly involved in cell response towards AR. AR, as a directed growth response, can be supposed as a plant strategy to diminish stress exposure [].
Mitochondria, as a physical platform for networks, signal perception, and signal canalization, play a central role in plant cell response to fluctuating cellular conditions, such as is often seen in environmental stresses, and in the further reacquisition of metabolic homeostasis [,,]. The alternative respiratory pathway, localized in mitochondria, has been a relevant research topic regarding plant stress acclimation and adaptation in many reports focused on the involvement of the alternative oxidase (AOX; EC 1.10.3.11 ubiquinol:O2 oxidoreductase id IPR002680) gene family members [,,,,,]. Clifton et al. [,] pointed to the importance of this alternative respiratory pathway as an early-sensing system for cell programming. The involvement of AOX in AR has been also taken as an important research topic, not only in view of understanding the role of the genes during the AR process, but also to further develop functional markers in order to be able to select genotypes that show efficient cell reprogramming [,,].
AOX is a terminal quinol oxidase located on the matrix side of the inner mitochondrial membrane, and it works as the key enzyme in the alternative respiratory pathway. It has been described in a wide variety of species from different kingdoms, like plants, protists, fungi, and also in some animals []. However, AOX has been best studied in the plant kingdom, particularly in angiosperm plant species [,,], where it is often encoded by a small multigene family composed of one to six genes distributed in two discrete gene subfamilies termed AOX1 and AOX2 [,,,,]. The number of AOX genes and their distribution within the two subfamilies is species-specific []. Due to the high diversity in terms of gene duplication pattern [], some AOX classification schemes for angiosperm plant species have been developed [,,]. In dicot plant species, genes belonging to both subfamilies have been described. Only recently, the AOX2-subfamily was identified in species within the Araceae family [], which is due to the availability of increasing information regarding monocot whole genome sequencing data.
AOX can play a number of roles in the optimization of the respiratory metabolism and in the integration of the respiratory metabolism with other metabolic pathways that impact the supply of or demand for carbon skeletons, reducing power and ATP [,,]. This enzyme also modulates the levels of signalling molecules, thus supporting the crosstalk between the metabolic status of mitochondria and the nucleus that regulates gene expression []. For a long time, genes belonging to the AOX1-subfamily have been implicated in plant responses to a diversity of abiotic and biotic stresses (for reviews see [,,]), while AOX2-subfamily members were described as housekeeping genes or more involved in plant development [,,]. Nevertheless, the paradigm that AOX1-subfamily members are the only ones related to the stress response has been challenged [,,,].
In the context of AR in olive, the AOX2-subfamily gene member has been the main focus of AOX research. In addition to understanding the involvement of AOX gene members in the AR process, and in view of the development of further functional markers that are able to discriminate between genotypes with different potential to develop adventitious roots, gene sequence variability has been investigated [,,]. AOX sequence variability, located in the protein coding and non-coding regions, has been reported in different plant species [,,,,,]. However, despite the studies carried out by direct mutagenesis to investigate the effect that a specific single nucleotide polymorphism (SNP) has on the protein functionality (see overview in []), there are few reports in natural systems showing the link between sequence polymorphisms and changes in the phenotype. Abe et al. [] were the first research group to indicate the relevance of AOX polymorphisms in abiotic stress tolerance by identifying in the Oryza sativa AOX1a a SNP that mapped to a region of a QTL for low temperature tolerance in anthers at the booting stage. More recently, Hedayati et al. [] reported the existence of two SNPs located at intron 3 of OeAOX2 that correlate with differences in rooting ability.
In addition to the SNPs present within AOX gene sequences, other forms of sequence variability have been reported, whose differential processing can be influenced by physiological conditions, such as cell growth, differentiation, development, or pathological events []. Variability at the 3′-UTR sequence that encompasses sequence and length variability due to alternative polyadenylation (APA) events has been reported in AOX gene members from different plant species [,]. APA allows a single gene to encode multiple mRNA transcripts. Depending on the location of the alternative poly(a) signal (PAS), APA events may affect gene expression qualitatively by the production of different protein isoforms, or quantitatively if miRNAs binding sites and/or other regulatory elements are concerned that can act as negative regulators.
Considering that stress stimulus is a key factor for the AR process to be successful, it becomes relevant to investigate the involvement of the AOX1-subfamily members in the process, as well as to explore whether mechanisms related to the gene expression regulation might be involved in AR. Here, we characterize the gene members of the AOX1 sub-family at the cDNA and gDNA levels, and we analyze the expression of its transcripts during AR in olive.
2. Results
2.1. Characterization of AOX1-Subfamily Members
In a first attempt to clarify the information about the composition of the AOX1-subfamily in olive, a blast search was carried out at the web page of the olive whole genome sequencing project that uses the O. europaea L. cv. ”Farga” as target genome (Oe6 browser at http://denovo.cnag.cat/genomes/olive/). For that search, AOX1a sequence from Arabidopsis thaliana L. deposited at the NCBI GenBank (acc. no. AT3G22370) was used. Three sequences with high similarity were identified. A blast search made at the wgs NCBI database also identified those sequences, corresponding to the scaffolds Oe6_s00216c09 (acc. no. FKYM01004812.1), Oe6_s05781c34 (acc. no. FKYM01030627.1), and Oe6_s00133c14 (acc. no. FKYM01003481.1). Additionally, a blast search using the same AtAOX1a sequence was made at the NCBI databases nr/nt and transcriptome shotgun assembly (TSA), which allowed for the identification of complete OeAOX sequences from cv. ”Leccino” (acc. no. GCJV01040584, KM514918, and KM514919), cv. “Picual” (acc. no. GBKW01105538), and cv. “Dolce Agogia” (acc. no. KM514920 and KM514921). Extracted sequences were used to construct a dendrogram using the in silico translated sequences together with sequences retrieved from 56 plant species at Phytozome and Plaza databases, which include monocot and eudicot plant species. To determine the relationship between the OeAOX from O. europaea and those retrieved sequences, a NJ tree was constructed using the translated sequences. There are clearly two different clusters composed by OeAOX1-subfamily members and a single cluster corresponding to the OeAOX2-subfamily members from all O. europaea cultivars (in yellow the three clusters that include OeAOX sequences) (Figure 1). Members from cv. “Galega vulgar” belonging to the AOX1 clusters were named as OeAOX1a (acc. no. MF410314) and OeAOX1d (acc. no. MF410315 and JX912721), the later one considering the high similarity with the AOX1d members from different plant species, and the AOX2 as OeAOX2 (acc. no. JX912722). A clear separation of AOX2-subfamily members can be seen (cluster in green). AOX1 members from monocot plant species form a separated group within the AOX1-subfamily (cluster in light blue). AOX1-subfamily members identified from other olive cultivars, not annotated as AOX gene members, appeared deposited as TSA in both cases transcribed upon cold stress.
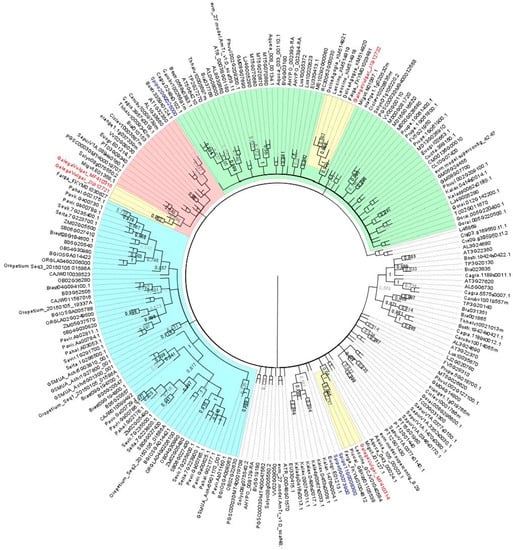
Figure 1.
Neighbor-Joining (NJ) tree showing the relationships among deduced AOX sequences from 56 plant species, including monocot and eudicot plant species. Putative peptide sequences corresponding to the isolated AOX1-subfamily members of Olea europaea L. were included (shown in red). 206 AOX sequences from higher plants were included (correspondence of accession numbers and the plant species is included in supplementary Tables S3 and S4). The NJ tree was obtained using the complete peptide sequences. The alignments were bootstrapped with 1000 replicates by the NJ method using the MEGA 7 software. AOX sequence from Neurospora crassa and two sequences of Chlamydomonas reinhardtii were used as outgroups. The scale bar indicates the relative amount of change along branches. In green: the branch corresponding to the AOX2-subfamily members. AOX1d members are in red and AOX1 members from monocot plant species are in the branch colored in light blue. Clusters grouping olive AOX members are in yellow and accessions corresponding to AOX from cv. ”Galega vulgar” are in red (OeAOX1a, acc. no. MF410314; OeAOX1d, acc. no. MF410315 and JX912721; OeAOX2, acc. no. JX912722).
Based on the available information [], it was possible to successfully produce the 5′ and 3′ ends of both AOX1-subfamily members in cv. ”Galega vulgar”. RACE work developed for the isolation of 3′ ends of both OeAOX1 gene members allowed the identification of high sequence variability due to different APA events. OeAOX1a transcripts presented the coding region unchanged but the 3′-UTR length variable, which ranged between 144 and 229 bp (Figure 2). Figures S1 and S2 show the complete cDNA sequences of OeAOX1a_transcript variant X1 with 1462 bp (deposited at the NCBI as acc. no. MF410314) and OeAOX1a_transcript variant X2 with 1249 bp (acc. no. MG208095). OeAOX1a sequences present an open reading frame (ORF) of 1086 bp, which encodes a putative polypeptide of 362 amino acid residues, that corresponds to a putative peptide with 40.6 kDa and a pI of 8.19.
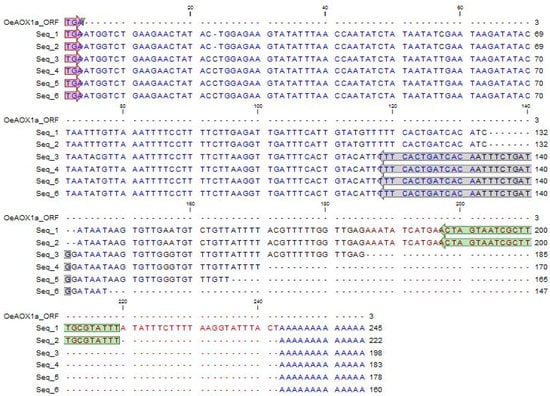
Figure 2.
Alignment of the six different isolated sequences corresponding to the 3′-UTR of OeAOX1a gene. The sequences are presented starting at the stop codon TGA shown in red. The reverse primers used in RT-qPCR analysis for each transcript variant are shown in different colors (green: variant X1, acc. no. MF410314; grey: variant X2, acc. no. MG208095) (for primers sequence see Table S2).
Variability at the 3′ end of OeAOX1d was not due to 3′-UTR length size variability but to differences on the protein coding sequence, also due to an APA event. This event gave rise to two different transcripts named as variant X1 and variant X2 (deposited at the NCBI with the acc. no. MF410315 and JX912721, respectively) with 1277 bp (Figure S3) and 1597 bp (Figure S4), respectively. While OeAOX1d_transcript variant X1 results from the transcription of the four exons, typical of the general structure of plant AOX composed by four exons interrupted by three introns, transcript variant X2 includes the transcription of the N-terminal region of intron 3 with transcript cleavage located 125 bp downstream the 5′ conserved GT dinucleotide at splice site (described below). This sequence variability can lead to different putative peptide sequences. Transcript variant X1 is characterized by an ORF with 996 bp, which encodes a polypeptide with 332 aa and the variant X2 with an ORF with 1062 bp that encodes a polypeptide with 354 aa, which will give a putative peptide with 38 (pI of 6.7) and 40.7 kDa (pI 7.79), respectively.
Figures S1–S4 indicate the cDNA sequences for AOX1 genes including the putative translated peptide and the conserved sites for intron positions. The difference in the overall length for the complete ORF sequences between OeAOX1a and transcript variant X1 of OeAOX1d (considering for this last one the transcript with the conserved gene structure) is due to the size variability at the N-terminal region of exon 1. The first exon has a size of 411 bp for OeAOX1a and 318 bp for OeAOX1d_transcript variant X1. Variation on both OeAOX1d complete ORF sequences is due to the exon 4, which shows 57 bp in transcript variant X1, leading to a peptide sequence homologous to the most common sequence across higher plants (see polypeptide alignment in Figure 3).
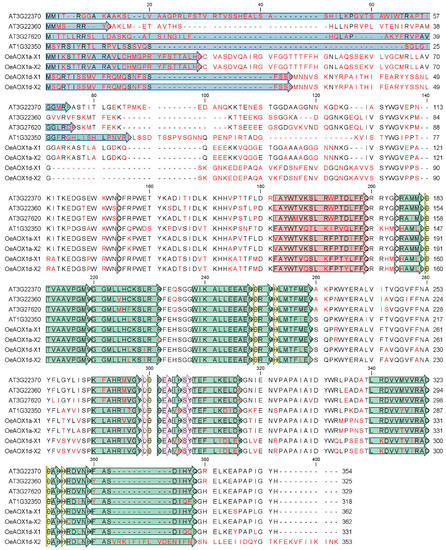
Figure 3.
Multiple alignment of putative amino acid translated sequences of previously reported AOX proteins from A. thaliana (AtAOX1a_AT3G22370, AtAOX1b_AT3G22360, AtAOX1c_AT3G27620, AtAOX1d_AT1G32350) and AOX from O. europaea L. cv. ”Galega vulgar” (OeAOX1a_transcript variant X1_MF410314 and OeAOX1a_transcript variant X2_MG208095, OeAOX1d_transcript variant X1_ MF410315 and OeAOX1d_ transcript variant X2_JX91272). The alignment was performed using CLC Main Workbench 6.7.1 software. The data were retrieved from public web-based database Plaza v2.5, freely available at http://bioinformatics.psb.ugent.be/plaza/versions/plaza_v2_5/. Amino acid residues differing are shown in red, deletions are shown by minus signs. The putative mitochondrial transit peptides (mTP) are shown in blue boxes. The sites of two conserved cysteins (CysI and CysII) involved in dimerization of the AOX protein by S–S bond formation [] are indicated in dark grey boxes. Helices α1 and α4, which form the hydrophobic region on the AOX molecular surface and are involved in membrane binding, are shown in red; helices α2, α3, α5, and α6, which form the four-helix bundle accommodating the diiron center, are shown in green []. Amino acids residues that coordinate the diiron center (E, glutamate and H, histidine) and those that interact with the inhibitor are in yellow and light pink boxes, respectively.
Forward and reverse gene specific primers located at the 5′ and 3′ gene ends, respectively, were used at the genomic level and allowed the isolation of both OeAOX1 gene members: OeAOX1a with 2215 bp and OeAOX1d with 2054 bp length (from start to stop codon). To identify gene structure, genomic and transcript sequences were used at the Splign software. A four exons structure showing size conservation at the three last exons (exon 2: 129, exon 3: 489 and exon 4: 57 bp), interrupted by three size variable introns, was identified at the OeAOX1a and OeAOX1d (Figures S5 and S6). In both OeAOX1 genes, introns were flanked by a GT sequence at the 5′ end and an AG at the 3′ end known as donor and acceptor splicing sites, respectively.
Comparing the isolated sequences from cv. ”Galega vulgar” with the sequences available at the whole genome databases from cv. ”Farga”, high conservation was found at the protein encoding sequence. However, high variability was found at intonic regions (see Figure S7). In silico analysis also revealed that OeAOX1d_transcript variant X2 cannot be transcribed on cv.”Farga” due to the existence of a stop codon previous to the polyadenylation site (also known as the poly(A) site—PAS) [].
A search for the identification of putative sequences coding for miRNAs located at the intronic regions revealed their absence in both OeAOX1a and OeAOX1d. Also, no other regulatory elements related to transposable elements and repetitive sequences were identified within gene sequences of cv. ”Galega vulgar”. In OeAOX1d genomic sequence of cv. ”Farga”, a putative transposable element (data not shown) was identified. The availability of upstream and downstream sequences of both OeAOX1 genes in the cv. ”Farga” allowed us to search for transposable elements located in the vicinity of both genes and to perform the analysis of promoter region to scan for cis-elements regulated by auxins. The in silico analysis allowed the identification of several copies of copia and gypsy LTR retrotransposons. Details of the identified full length LTR insertions are presented in Table 1. Directly upstream to OeAOX1a, there were two gypsy elements; a copy of 84856_A was nested within 95401_A (Figure S8). The latter element was inserted ca. 1 Kb upstream from the start codon of OeAOX1a. Interestingly, another copy of 95401_A was found directly upstream from the OeAOX1d gene (Figure S9), albeit at a larger distance (ca. 3.5 Kb) to the start codon and in the opposite orientation as related to the copy associated with OeAOX1a. Repetitive sequences were present directly downstream OeAOX1d; however, owing to the lack of contiguous assembly of that region, a detailed analysis was not performed.

Table 1.
Information regarding the full length elements identified in the upstream and downstream region of OeAOX1 genes in cv. ”Farga”. For visualization of elements position within genomic sequence see Figures S7 and S8.
OeAOX1a and OeAOX1d promoter sequences up to 1.5 kbp upstream from the translation start site were scanned using PlantCARE and New Place software’s for the identification of auxin cis-acting regulatory elements (CAREs). Four CAREs were identified in the OeAOX1a’s promoter region and 3 CAREs were identified in the OeAOX1d (see details in Table S5). From the four CAREs identified in OeAOX1a, three were located at a region prior to −500 bp upstream of the translation start site (New PLACE IDs: NTBBF1ARROLB, ARFAT and SURECOREATSULTR11). In the case of OeAOX1d, from the three motifs identified, only one is located closer to the start codon, prior to −500 bp upstream of the translation start site (New PLACE ID: ASF1MOTIFCAM, with sequence TGACG, at position −164). Comparing CAREs of the promoter regions for both OeAOX1 genes, only one is common, the New PLACE ID: NTBBF1ARROLB, with sequence ACTTTA. However, in terms of its location, the sequence ACTTTA is not conserved between the two genes. It is located at −266 upstream from the translation start site for OeAOX1a, while for OeAOX1d, it is located at −668 and repeated at +1109. In addition, it is interesting to note that the sequence of auxin response factor binding site found in promoters of primary/early auxin responsive genes (New PLACE ID: ARFAT, with sequence TGTCTC) was only identified in OeAOX1a (at positions +305 and −306).
A multiple sequence alignment including AOX1-translated peptides from A. thaliana and O. europaea cv. ”Galega vulgar”was used to highlight similarities and differences in the putative protein sequences (Figure 3). OeAOX1a and OeAOX1d encoded by both transcript variants (X1 and X2) revealed structural features usually found in most of the higher plants’ AOX with the identification of two conserved cysteines (CystI and CystII) and di-iron-binding sites. Sequence diversity at the C-terminal region is here restricted to putative peptide of OeAOX1d_transcript variant X2. This change is implicated in the sequence of helice α6, one of the four-helix bundles accommodating the diiron center.
In order to gain insight into the possible protein structural effects of the sequence change present in OeAOX1d_transcript variant X2, we turned to the structure of the AOX from Trypanosoma brucei (PDB ID: 3VV9) [], which is the only homologous protein whose structure is available. Unfortunately, the N- and C-terminal regions of OeAOX1 do not align well with the sequence of AOX from T. brucei and, therefore, we could only model the region between helices α2 and α6 (Figure 4A). However, based on the alignment of OeAOX1d and AOX from T. brucei, we can infer that the sequence change of OeAOX1d_transcript variant X2 is located between the end of helix α6 (one of the four-helix bundle accommodating the diiron center) and the C-terminus (Figure 4B). The region that is affected by this change is close to the diiron center and is also implicated in inter-subunit interactions in the dimeric form of AOX.
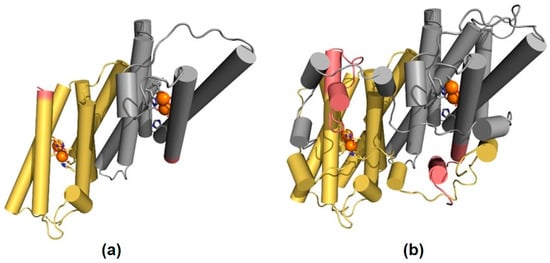
Figure 4.
Structural mapping of the sequence diversity of OeAOX1d. The homology-based model of (a) OeAOX1d_transcript variant X2 and the structure of (b) AOX from T. brucei are displayed using a cartoon representation, with the helices shown as cylinders. The two identical functional subunits are colored in yellow (subunit A) and grey (subunit B), and the iron atoms that form the diiron center are represented by orange spheres, with the coordinating residues displayed using sticks. The region that corresponds to the sequence change in OeAOX1d_transcript variant X2 is highlighted in pink.
High sequence diversity was detected at the N-terminal region, which consequently lead to high diversity on the mitochondrial transit peptide (see Figure 3). Both putative OeAOX1 translated peptides were predicted to be localized in mitochondria (mTP score of 0.672 and 0.604 regarding the OeAOX1a and OeAOX1d, respectively). The predicted length of the cleavage site of the mitochondrial targeting sequence for OeAOX1a and OeAOX1d is 28 and 45 amino acid residues, respectively. The predicted mitochondrial transit peptide is shown in the alignment of Figure 3, in which no conservation across protein sequences is visible, not within the AOX1-subfamily members across species and not even within the AOX1-subfamily genes from a single plant species.
2.2. Analysis of Transcript Expression
2.2.1. OeAOX1 Genes are Differentially Expressed during IBA-induced AR
In order to verify whether the expression levels of OeAOX1a and OeAOX1d genes were changed during IBA-induced rooting, quantitative real time PCR was performed. Both OeAOX1a and OeAOX1d genes showed a similar expression pattern throughout the rooting assay (Figure 5A,B). The maximum peak of up-regulation for both genes occurred at 8 h after IBA treatment. OeAOX1a showed, however, higher levels of expression at this time point (36.0-fold change, p ≤ 0.01) (Figure 5A) than OeAOX1d (13.2-fold change, p ≤ 0.001) (Figure 5B) when compared to the levels observed at the corresponding controls (0 h, without IBA treatment). Looking at days 1 and 2, which can be seen as the recovery time point after the maximum peak of expression, it can be observed that both genes decreased drastically reaching even, at day 2, expression values close to the ones observed at 0 h. A second increment of expression for both genes, although lower than the first increment, was observed at day 4. Here, and again, the expression levels at this time point, and compared with the ones observed at 0 h, were higher for OeAOX1a (3.2-fold change, p ≤ 0.001) than for OeAOX1d (1.8-fold change, not statistically significant). Day 4 corresponds to the end of the induction phase and beginning of the initiation phase in AR process in olive []. From this time point forward, the expression levels decreased again reaching the minimum peak at day 8, for both genes. A third increment occurs for both genes around days 10–14. Around days 12–14 corresponds to the time when calli formation becomes apparent before root emergence. From these time points on and until the end of the rooting trial (30 days), and in opposition to what was previously observed, the expression levels for OAOX1a were lower than the ones observed for OeAX1d. For example, at day 22, which corresponds to the end of the initiation phase and the beginning of the expression phase of the AR process [], OeAOX1a had a slight 1.8-fold (p ≤ 0.01) increase, whereas OeAOX1d had a higher increment of 3.7-fold (p ≤ 0.001) when compared to the expression levels of the corresponding controls.
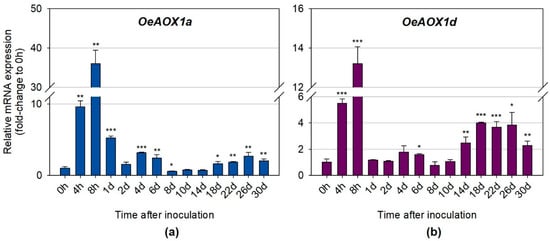
Figure 5.
Relative mRNA expression of (a) OeAOX1a and (b) OeAOX1d in stem basal segments of O. europaea L. microcuttings during IBA-induced adventitious rooting. OeACT and OeEF1a were used as reference genes in data normalization. The relative expression values are depicted as the mean ± standard deviation of four biological replicates for each time point. The bars represent the fold-change related to the time point 0 hours after microcuttings treatment and inoculation, which was set to 1. Statistical significances (* p ≤ 0.05, ** p ≤ 0.01, and *** p ≤ 0.001) between the two means were determined by the t-test using IBM® SPSS® Statistics version 22.0 (SPSS Inc., Armonk, NY, USA), h: hours, d: days.
2.2.2. Distinct Transcripts Variants Show Different Expression Levels
Quantitative real time PCR was also performed to further investigate whether the distinct transcript variants (primers were designed for a specific region of each transcript variant) for each gene (OeAOX1a and OeAOX1d), produced due to APA events, were differentially expressed during IBA-induced AR. OeAOX1a transcripts with longer 3′-UTRs (OeAOX1a_transcript variant X1) (Figure 6A) showed higher expression levels at the time points corresponding to the first and second increments than the transcripts with shorter 3′-UTRs (OeAOX1a_transcript variant X2) (Figure 6B). For example, the expression levels at 8 h in relation to the control (time point 0 h) for OeAOX1a_transcript variant X1 were about 48.7–fold higher (p ≤ 0.05), while for OeAOX1a_transcript variant X2 was around 33.5-fold higher (p ≤ 0.01). At day 4, variant X1 showed a 4.1-fold change (p ≤ 0.05) and variant X2 a 2.9-fold change (p ≤ 0.05) compared with the time point 0 h. A very similar expression pattern throughout the rooting assay was observed for both transcript variants. On the contrary, the shorter OeAOX1d transcripts composed by the four exons (OeAOX1d_transcript variant X1) (Figure 6C) showed higher expression levels at these time points (8 h: 16.1-fold change, p ≤ 0.001; 4 days: 1.8-fold change, p ≤ 0.001) than the longer transcripts with an alternative PAS located at the intron 3 (OeAOX1d_transcript variant X2) (Figure 6D) and lacking the exon 4 sequence (8 h: 6.9-fold change, p ≤ 0.001; 4 days: 1.3-fold change, not statistically significant). As for OeAOX1a, a similar expression profile over all the time points tested was observed for both variants. Additionally, the expression profile of transcript variants was very similar to the expression profile exhibited by the OeAOX1a and OeAOX1d genes (including all sets of transcripts, since primers were designed in a common region). From day 14 onwards, which corresponds to the time point when roots start to emerge, both OeAOX1a transcript variants (with shorter (variant X2) and longer (variant X1) 3′-UTRs) showed a similar level of expression between them when compared to the levels of the corresponding controls. On the other hand, OeAOX1d transcripts corresponding to the variant X1 were more expressed than the variant X2. While the expression levels of OeAOX1a gene correlate to the ones shown by each transcript variant, in the case of OeAOX1d gene this does not happen. The expression levels of OeAOX1d gene were higher (almost double) than the expression levels of the most expressed transcript variant (variant X1). This result suggests that OeAOX1d gene may have other transcript variants that were not analysed here separately, despite the fact that they have been detected by the primers designed to a common region among the transcript variants.
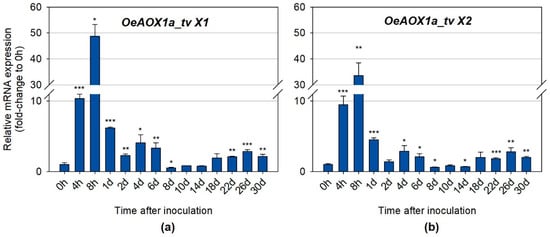
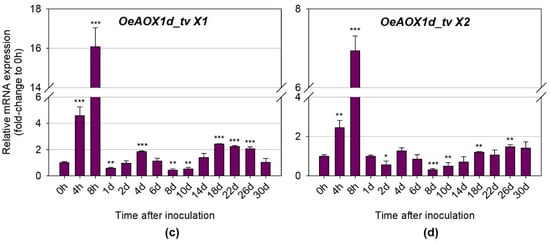
Figure 6.
Relative mRNA expression of (a) OeAOX1a_transcript variant X1, (b) OeAOX1a_transcript variant X2, (c) OeAOX1d_transcript variant X1, and (d) OeAOX1d_transcript variant X2 (D) in stem basal segments of O. europaea L. microcuttings during IBA-induced adventitious rooting. OeACT and OeEF1a were used as reference genes in data normalization. The relative expression values are depicted as the mean ± standard deviation of four biological replicates for each time point. The bars represent the fold-change related to the time point 0 hours after stem microcuttings treatment and inoculation, which was set to 1. Statistical significances (* p ≤ 0.05, ** p ≤ 0.01 and *** p ≤ 0.001) between the two means were determined by the t-test using IBM® SPSS® Statistics version 22.0 (SPSS Inc., Armonk, NY, USA), h: hours, d: days, tv: transcript variant.
3. Discussion
Correct classification of homologous AOX genes across plant species is challenging []. However, it gains high importance when the physiological role of those genes should be comparable across species. Thus, classification is a dynamic process that needs regular updates to develop knowledge []. Based on the most recent classification system available for AOX, basal angiosperms and eudicots contain both AOX-subfamilies (AOX1 and AOX2) subdivided into specific types (AOX1a-c/e, AOX1d, AOX2a-c, and AOX2d) []. Here, 206 sequences from public data bases were analysed. The distribution of the putative translated peptide encoded by the isolated OeAOX1 sequences in two different clusters within the main cluster of AOX1-subfamily revealed the existence of two AOX1-subfamily members in olive. One of those sequences clustered together with the AOX1d member of A. thaliana (AT1G32350) and the sequence of Solanum lycopersium available at the NCBI as AOX1b (NP_001234120.1) but renamed by Costa et al. [] as AOX1d. Considering this homology, the olive member was named as OeAOX1d and submitted to the NCBI databases at cDNA and gDNA levels (acc. no. MF410315, JX912721, and MF410319). Putative AOX2 translated peptides from different O. europaea cultivars clustered together within the AOX2-subfamily, confirming a single AOX2 member in this species.
Across kingdoms, there is a lack of a general pattern with respect to intron/exon structure in AOX genes []. However, within plants, the most common gene structure described for AOX comprises four exons interrupted by three introns [,]. Exceptions to this gene structure have been reported in some AOX gene members and different plant species, due to events of intron loss and gain []. From the known examples, an intron loss leads to a structure of three exons, and an intron gain to a structure of five-exons. Despite the typical structure of four exons, AOX gene members are well known by exons size conservation achieved at the three last exons (129, 489 and 57 bp, respectively). The combination between gene homology, gene structure, and exons size allows us to be more confident about the classification of a gene as a member of the AOX family. Cases of miss-annotation regarding AOX gene members and genes from another membrane-bound di-iron carboxylate protein, the plastid terminal oxidase (PTOX; EC 1.10.3.11 ubiquinol:O2 oxidoreductase id IPR002680), are still common, since AOX and PTOX share high level of homology []. In general, the exon size conservation in the 4-exons structure of AOX gene members is one of the factors that contributes to the low variability in protein size. Normally, exon 1 is the one that is variable not only in length but in sequence composition as well. Protein size typically ranges between 32–41 kDa depending on the species [,,]. Putative translated OeAOX1 peptides from cv. “Galega vulgar” showed, by in silico analysis, a size that is in range from 38–40.7 kDa. Both OeAOX1a and OeAOX1d were predicted, with high score, to be located in the mitochondria. However, high variability in the N-terminal region was observed within AOX1 members. Sequence variability located in that gene region was previously reported across AOX members within and between species [,,]. Nevertheless, how this variability can affect the regulation of gene expression and/or the protein transport and activity is still not known. The N-terminal region determines interaction with the protein transport system that regulates integration into the organelle. In many cases, amino acids comprising the signal peptide are cleaved off the protein once they reach their final destination. A comparison between A. thaliana and O. sativa using a high set of proteins showed high variability at that region, going from 19 to 109 amino acids in A. thaliana, and from 18 to 117 amino acids in O. sativa []. Specifically on AOX, Campos et al. [] described mTP sequence length variability across plant species and between protein isoforms within the same plant species. More recently, a study that aimed the identification of allelic variation within the AOX1 gene member considering 39 carrot genotypes described high variability at that region, going from a mTP sequence with 20 to 41 amino acid residues [].
Contrarily to the conservation at AOX protein coding sequences, high variability can be seen in protein non-coding regions, which include introns and untranslated regions (5′-UTR and 3′-UTR) [,,,,,,,]. Size and sequence variability located at these regions can have an important physiological role. Gene architecture, which considers not only the number but also the length of exons and introns, is nowadays considered as one important regulatory player. Several studies indicate that gene architecture toward short genes with few introns allows for efficient expression during short cell cycles. In contrast, genes composed by long introns can be expected to exhibit delayed expression []. Long introns are described as a timing mechanism that works for biological signal feedback regulatory networks []. Despite this role in regulation of gene expression, which is associated with gene expression delays, it is also known that the presence of introns could enhance gene transcription []. Some introns harbour non-coding RNAs (e.g., miRNAs and snoRNAs) for which the processing from introns can speed up or slow down the rate of expression of the host gene []. Despite the fact that no miRNAs were identified within the OeAOX1 sequences, an in silico analysis, performed to search for TEs, revealed the existence of several putative retrotransposons located in the adjacent regions upstream and downstream of the AOX gene position. TEs located in intergenic regions (up- or downstream target genes) or within a gene sequence (promoter or intron sequences) may provide regulatory elements affecting gene expression through a variety of mechanisms (for review see []). In plants, TEs can constitute from ca. 10% of A. thaliana genome (Arabidopsis Genome Initiative 2000) to 85% of the B73 Zea mays genome []. Several reports point out the existence of TEs within AOX gene sequences [,,]. These results lead us to hypothesize that expression of AOX genes might be influenced by adjacent TEs.
Simultaneously, introns offer the potential for regulatory functions such as alternative splicing and APA events. It is nowadays evident that APA acts as a major mechanism of gene regulation being widespread across all eukaryotic species []. In plants, it was reported that 70% of A. thaliana genes and around 50% of O. sativa genes have at least one alternative poly(A) site []. In some specific cases, variability in transcripts is associated with regulation of flowering time, growth, and developmental processes [,]. As a result of APA events, a single pre-mRNA can produce more than one mRNA. If alternative PAS is located in internal introns/exons, APA events may lead to the production of different protein isoforms with differences in subcellular localization, stability, or function by changing or completely removing functional domains (for review see []). It may also result in unstable mRNA isoforms with a negative feedback on gene expression by generation of truncated transcripts that are recognized and degraded by a specific mechanism named nonsense-mediated decay (NMD) []. From OeAOX1d, two putative protein isoforms could be produced due to an alternative PAS located at intron 3: (a) OeAOX1d_transcript variant X1 with four exons that encodes the structural feature typical of AOX in plants, and (b) OeAOX1d_transcript variant X2 with three exons and a partial sequence of intron 2 that replaced exon 4. This latter transcript encodes a putative truncated protein that lacks 19 amino acids at the C-terminal end. When this transcript variant was analyzed during IBA-induced rooting assay, it demonstrated lower differential expression levels (compared to the control) than variant X1. The sequence alteration present in the OeAOX1d_transcript variant X2 will affect the structure of helix α6, which can have an impact on the coordination of the diiron center. This can be predicted by referring to the structure of AOX from T. brucei []. In AOX from T. brucei, the C-terminal region is involved in important inter-subunit interactions. Therefore, it is possible that the sequence alteration present in the OeAOX1d_transcript variant X2 will also affect interaction between the two polypeptide chains. This can have implications on the stability of the dimer. However, further studies will be required to investigate whether both transcripts would be translated to two different protein isoforms, and if so, whether both are functional. Additionally, if PAS are located in the 3′-UTRs, APA events will lead to the synthesis of transcripts conserving unchanged the protein coding sequence but presenting different 3′-UTR lengths. 3′-UTR length can affect the transcript stability, localization, transport, and translational properties []. 3′-UTRs often harbor miRNAs binding sites and/or other regulatory elements [] that can act as negative regulators, mostly of larger transcripts. Many mRNAs use 3′-UTR alternative PAS to achieve tissue-specific expression and function [,]. We found in our study alternative PAS located at the 3′-UTR of the OeAOX1a, which generates short and long 3′-UTRs. The identification of OeAOX1a sequences carrying 3′-UTR regions with different sizes may suggest the possibility of differential post-transcriptional regulation. It should be noted that in our system (IBA-induced AR in olive explants), although both OeAOX1a transcript variants X1 and X2 (carrying 3′-UTR with different sizes) showed a similar expression pattern throughout the process, indicating co-regulation, OeAOX1a_transcript variant X1 showed more pronounced differential expression levels (compared to the control) than variant X2, up to day 8. Differential 3′-UTR sizes of a gene can have positive, negative, or even neutral effects on mRNA stability and on the resulting protein levels depending on whether the availability of RNA-binding sites, such as miRNA-binding sites, is influenced [,,,]. Many different RNA-binding proteins (RBPs) and a variety of signals located at that transcript region can regulate mRNA localization, decay, and translation [].
The expression of both genes, OeAOX1a and OeAOX1d, was dramatically increased in the early stages of rooting with the maximum peak of transcript accumulation at 8 h after IBA treatment. Three previous studies addressed the involvement of AOX genes in the process of IBA-induced AR [,,]. They were based on the earlier raised hypothesis, which proposed AOX as a functional marker candidate for efficient adventitious rooting of O. europaea L. [,]. Santos Macedo et al. [,] showed first in semi-hardwood shoot cuttings of an easy-to-root olive cultivar (cv. ”Cobrançosa”) that root induction was significantly reduced by treatment with an inhibitor of AOX activity (salicylhydroxamic acid—SHAM). This observation could be confirmed in an in vitro system for olive propagation (cv. ”Galega vulgar”), thus pointing to the general importance of AOX genes during the process of induced rooting []. In the latter work, it could be shown that SHAM-inhibition was in fact specific to rooting and did not interfere with preceding callus formation. This observation was later confirmed by Porfirio et al. [] using the same experimental system. In a first approach, OeAOX2 was identified as a promising gene candidate for functional marker development towards improving rooting efficiency in olive []. First evidence of an association between rooting ability and OeAOX2 gene expression in olive cuttings was then provided by Hedayati et al. []. This group also confirmed the presence of polymorphisms in OeAOX2 with a possible correlation to distinct rooting behavior. The present work adds new information to the rooting system of olive by showing the expression of the OeAOX1a and OeAOX1d genes by quantitative real time PCR during IBA-induced AR in microcuttings.
Adventitious rooting is considered a developmental process organized in a sequence of interdependent stages [,,,,,]. It includes three phases: (1) induction, corresponding to the period preceding any visible histological occurrence, with molecular and biochemical events; (2) initiation, starting with the first histological events, like root primordia organization; here, small cells with large nuclei and dense cytoplasm start to be apparent; and (3) expression, involving the development of the typical dome shape structures, intra-stem growth, and emergence of root primordial [,,,]. In olive, induction phase corresponds to the first 4 days after microcuttings treatment and inoculation, when cells regain meristematic features. From 4 until 14 days, the first meristemoids and morphogenetic root zones were observed, events corresponding to the initiation phase. These events are followed by high mitotic activity that eventually leads to the expression phase, which starts at 22 days after the root-inducing treatment []. From our results, it can be seen that both OeAOX1a and OeAOX1d genes exhibited three increments in their expressions throughout the rooting assay. The first one, as mentioned above, was the most pronounced, and occurred at 8 h after microcuttings treatment and inoculation, and corresponded to the beginning of the induction phase. The second increment was observed at 4 days, which corresponds to the end of the induction phase and beginning of the initiation phase. The third increment was observed from the end (14 days for OeAOX1d and 18 days for OeAOX1a) of the initiation phase onwards. It is likely that the first observed increment may be related to the stress associated with the cut injury and auxin treatment. In fact, as suggested by Santos Macedo et al. [], the initial cut of olive microcuttings and its subsequent treatment with auxins may constitute a stress to the involved cells, and therefore olive AR can be seen as stress-induced reprogramming of shoot cells [,,]. The second and third increments may be related to the role that AOX might have on cell differentiation and growth/development. The link between AOX and cell differentiation and plant growth has been indicated by several reports [,,,].
Interestingly, Porfirio et al. [], using the same experimental system, observed elevated free IAA (indole-3-acetic acid) levels in the first hours after treatment, peaking also at 8 h. It would be worth investigating further this correlation between the levels of free IAA observed by Porfirio et al. [] and the accumulation of AOX1 transcripts found in the present study during the induction phase of olive rooting. It is likely that a link may exist between altered auxin homeostasis and induced OeAOX gene expression, as suggested by others [,], during AR in olive. In this context, it would be desirable to investigate also genes involved in the auxin signaling and transport.
It is tempting to speculate that, in our study, AOX genes were highly induced, probably by increased levels of ROS as a consequence of a stressful situation (cut injury plus auxin treatment) and by IBA application to promote rooting. Indeed, it has been reported that different abiotic stresses are likely to cause the formation of different ROS signatures in plant cells (for review see []). Moreover, the production of ROS by mitochondria was suggested to be a critical factor for the induction of AOX [,], which in turn regulates the amounts of ROS, and therefore AOX has a large impact on redox regulation at a cellular level on environmental stresses []. Auxins can induce the production of ROS [] and regulate ROS homeostasis [], hinting at the relationship between auxin signaling and oxidative stress []. Thus, the marked accumulation of OeAOX transcripts at 8 h observed in our study may also be the result of the increased levels of free IAA detected by Porfírio et al. [], which possibly contributed to elevate the levels of ROS. Moreover, in silico analysis at the OeAOX1 promoter region in search of cis-acting regulation elements identified different auxin responsive elements (AuxREs) that could be involved in regulation of AOX gene expression. The identification of different AuxREs in the promoter region of both OeAOX1 genes allows us to speculate that regulation might be done in a differential way. Presence of the TGTCTC-motif in OeAOX1a, which belongs to the family of Auxin Response Factors (ARFs) (see review in []), could explain the higher increase in gene expression in comparison to OeAOX1d that lacks this motif.
In summary, two genes were identified as members of the AOX1-subfamily in the cv.”Galega vulgar”, with both showing the most common structure of AOX gene members with four exons interrupted by three introns. Alternative polyadenylation (APA) events were responsible for the production of transcript variants in both genes. OeAOX1a transcript variants show different 3′-UTR lengths with no changes at the protein coding sequence. OeAOX1d shows an alternative PAS located at the intron 3 that leads to the synthesis of one transcript variant showing a truncated protein coding sequence that lacks the exon 4 sequence. The sequence alteration found in the OeAOX1d_transcript variant X2 will prevent the structure of helix α6 having an impact on the coordination of the diiron center and also it can affect the interaction between the two polypeptide chains having implications in the stability of the dimer. Our findings showed a strong correlation between OeAOX1a and OeAOX1d transcripts accumulation and the three distinct phases (induction, initiation, and expression) of the AR process in olive, with the expression of these genes more pronounced at the induction phase. The elevated IBA-induced expressions at this phase may be related to the stressful conditions associated with AR process and the application of IBA for rooting induction. A possible link between OeAOX1 induction and altered auxin homeostasis in olive AR may exist, since OeAOX1 transcripts were increased at the same time point for which earlier studies showed elevated levels of free auxins. Additionally, different transcript variants for each gene studied here, although showing a similar expression pattern, demonstrated different levels of expression during AR, which would be worth exploring further. Further studies will be required to clarify whether the diverse transcripts encountered may give rise to distinct functional protein isoforms and also to understand the physiological role of such variability. Taken together, these results contribute to a better understanding of the molecular mechanisms underlying the stress stimulus needed for the induction of adventitious roots. Thus, the results may allow us to develop more targeted and effective rooting induction protocols, which in turn can help to increase the rooting ability of difficult-to-root cultivars.
4. Materials and Methods
4.1. Characterization of the AOX Genes at the cDNA and Genomic Levels
4.1.1. Plant Material
Olea europaea L. explants of cv. ”Galega vulgar” (clone 1441), established under in vitro conditions since 2005, were maintained until today following the procedure described by Peixe et al. []. The derived in vitro grown plantlets were used for gene isolation. Leaves were collected from a single plantlet and used for total RNA and genomic DNA (gDNA) extractions.
4.1.2. Isolation of Complete OeAOX1-Subfamily Gene Members
The isolation of complete gene sequences was performed in several steps. The first one was based on the protocol described by Saisho et al. [] for isolation of the AOX gene members in A. thaliana and further referred to by different authors for gene isolation in different plant species [,,]. The isolation of mainly two different sequences belonging to the AOX1-subfamily was previously reported by Santos Macedo et al. []. Based on that information, gene specific primers were designed in order to isolate gene ends of the identified OeAOX gene fragments by 5′ and 3′ RACE-PCRs. Total RNA used for cDNA synthesis was previously extracted using the RNeasy Plant Mini Kit (Qiagen, Hilden, Germany) with on-column digestion of DNA applying the RNase-Free DNase Set (Qiagen, Hilden, Germany), according to the manufacturer’s protocol. The concentration of total RNA and its purity was determined with the NanoDrop-2000C spectrophotometer (Thermo Scientific, Wilmington, DE, USA). For both ends, 1 μg of total RNA was used to synthesize the first-strand cDNA using the SMARTerTM RACE cDNA Amplification kit (Clontech Laboratories, Inc., Mountain View, CA, USA) according to the manufacturer’s instructions. RACE-PCRs were carried out separately using 1 μL of the corresponding single strand cDNA as template and 0.2 μM of the forward/reverse gene specific primers (depending if 3′ or 5′ end isolation) (Table S1) combined with 0.2 μM of the Universal Primer Mix (provided with the kit) following the instructions recommended by the manufacturer. PCRs were all carried out in a 2770 thermocycler (Applied Biosystems, Foster City, CA, USA).
For complete gene isolation, gDNA was isolated using the DNeasy Plant Mini Kit (Qiagen, Hilden, Germany) according to the manufacturer’s protocol. The amount of gDNA and its purity was determined with the NanoDrop-2000C spectrophotometer (Thermo Scientific, Wilmington, DE, USA). One gene-specific primer set was designed for each OeAOX gene (Table S1) based on the previously isolated 5′ and 3′-UTR sequences. Ten ng of gDNA were used as template with 0.2 μM of each specific primers. PCRs were performed using the Phusion™ High-Fidelity DNA Polymerase (Finnzymes, Espoo, Finland) according to the manufacturer’s protocol. PCR was carried out in a 2770 thermocycler (Applied Biosystems, Foster City, CA, USA) running for 35 cycles each one consisting in 10 s at 98 °C, 30 s at 55 °C, and 2 min at 72 °C. An initial step at 98 °C for 30 s and a final step at 72 °C for 10 min were used.
4.1.3. Cloning and in Silico Sequence Analysis
PCR fragments were separately cloned into a pGem®-T Easy vector (Promega, Madison, WI, USA) and used to transform E. coli JM109 (Promega, Madison, WI, USA) competent cells. Plasmid DNA was further extracted from putative recombinant clones by using the GeneJET Plasmid Miniprep kit (Thermo Scientific, Vilnius, Lithuania) and further sequenced in sense and antisense strands (Macrogen company, Seoul, South Korea: www.macrogen.com).
CLC Main Workbench 7.5.1 software (ClCbio, Aarhus N, Denmark) was used to edit sequences. Intron location was made using the software Splign (https://www.ncbi.nlm.nih.gov/sutils/splign/splign.cgi?textpage=online&level=form).
In order to clarify the question related to the number of genes that compose the AOX1-subfamily, a blast search using the AOX1 from A. thaliana L. (acc. no.AT3G22370) deposited at the NCBI—National Center for Biotechnology Information (GenBank) was made at the web page of olive genome databases (http://denovo.cnag.cat/genomes/olive/) using the Oe6 browser. To get confirmation, the retrieved sequences were then blasted at the NCBI data bases using the BLAST algorithm [] (http://www.ncbi.nlm.nih.gov/) (BLASTn) at the whole-genome shot gun contigs (wgs). To identify AOX sequences from other olive cultivars, a BLASTn search using the same sequence was made at different NCBI databases (nucleotide collection, nr/nt; transcriptome shotgun assembly, TSA; expressed sequence tags, est).
To perform a comparison between AOX proteins from higher plants, sequences were retrieved from the whole genomes available at the Plaza (http://bioinformatics.psb.ugent.be/plaza/) and the Phytozome (https://phytozome.jgi.doe.gov/pz/portal.html) databases using a BLAST search analysis based on the exon 3 as the most conservative region across AOX genes and plant species.
Sequences retrieved were aligned in MUSCLE (http://www.ebi.ac.uk/Tools/msa/muscle/) following the standard parameters. Phylogenetic reconstruction was performed in MEGA 7 software [] by Neighbor-Joining (NJ) and the inferred tree was tested by bootstrap analysis using 1000 replicates, “number of differences” as the substitution model, and “pairwise deletion” for gaps/missing data treatment. Graphical view was edited in the Fig Tree v14.0 software (http://tree.bio.ed.ac.uk/software/figtree/).
The freely available TargetP software [] was used to predict the protein subcellular localization and the position of the cleavage sites of mitochondrial targeting signals (http://www.cbs.dtu.dk/services/TargetP/) using the translated peptide corresponding to exon 1. The prediction of putative isoelectric point (pI) and the molecular weight was obtained using the freely available tool PeptideMass at the Expasy software (http://web.expasy.org/peptide_mass/).
4.1.4. Homology-Based Model
The model of AOX1d was generated using the structure of AOX from T. brucei (PDB ID: 3VV9) [] as a template. Only the region between residues 159 and 313 was modelled, since the N- and C-terminal regions did not align well with the template. The model was built using the software modeler [], version 9.6, and setting the refinement degree to slow. The final model corresponds to the one with the lowest value of the objective function, out of 20 generated structures.
4.1.5. In Silico Identification of Regulatory Elements Located at the AOX Gene Boundaries
For the identification of putative miRNA precursor sequences located at the introns and UTRs of the isolated OeAOX genes, the publicly available software miR-abela (http://www.mirz.unibas.ch/cgi/pred_miRNA_genes.cgi) was used. Further steps related with pre-miRNAs validation, prediction of the secondary structure of predicted pre-miRNA, screening of potential miRNAs, and identification of target genes candidates were developed according to the procedure described by Velada et al. [].
For identification of transposable elements (TE) in the vicinity of the OeAOX genes (using olive genome sequencing information), contigs encompassing these genes were self-aligned using Blast2Seq at the NCBI (blast.ncbi.nlm.nih.gov). The contigs were also used as queries to search GeneBank nucleotide database restricted for the Olea genus (taxid:4145). Hits matching known O. europaea TEs were retained. Regions flanked by putative LTRs not showing similarity to known Olea retrotransposons were used as queries for Censor (www.girinst.org) to search for the most similar elements in the RepBase. Target site duplications (TSDs) were identified manually. Additional manipulations and alignments were performed in BioEdit 7.2.5 []. All names of olive LTR retrotransposons are reported after Barghini et al. [].
For identification of transposable elements (TE) in the vicinity of the OeAOX genes (using olive genome sequencing information), contigs encompassing these genes were self-aligned using Blast2Seq at the NCBI (blast.ncbi.nlm.nih.gov). The contigs were also used as queries to search GeneBank nucleotide database restricted for the Olea genus (taxid:4145). Hits matching known O. europaea TEs were retained. Regions flanked by putative LTRs not showing similarity to known Olea retrotransposons were used as queries for Censor (www.girinst.org) to search for the most similar elements in the RepBase. Target site duplications (TSDs) were identified manually. Additional manipulations and alignments were performed in BioEdit 7.2.5 []. All names of olive LTR retrotransposons are reported after Barghini et al. [].
To screen for the presence of cis-regulatory elements located at the promoter region that could be related with regulation of gene expression by auxins, a region comprising 1.5 Kb upstream the translation start site of both AOX1 gene sequences was considered for analysis. Promoter region of OeAOX1a (Oe6_s00216) and OeAOX1d (Oe6_s05781) was retrieved from the whole genome sequencing project (http://denovo.cnag.cat/genomes/olive/). The freely available New PLACE tool—A Database of Plant Cis-acting Regulatory DNA elements (https://sogo.dna.affrc.go.jp/cgi-bin/sogo.cgi?lang=en&pj=640&action=page&page=newplace, []) and PlantCARE (http://bioinformatics.psb.ugent.be/webtools/plantcare/html/, []) were used.
4.2. Transcript Expression of the AOX1-subfamily Members during AR on in Vitro Cultured Stem Segments
4.2.1. Plant Material and in Vitro Rooting Experiments
The in vitro grown plantlets of cv. ”Galega vulgar” (clone 1441), described above, were used as initial explant source for the AR experiment. Rooting treatments and culture conditions were adapted from Macedo et al. []. In brief, stem segments (microcuttings) with four-to-five nodes were prepared from the upper part of in vitro-cultured plantlets and all leaves were removed with the exception of the upper four. The base (approx. 1.0 cm) of each microcutting was immersed in a sterile solution of 14.7 mM IBA (indole-3-butyric acid) [] for 10 s. Subsequently, the microcuttings were aseptically inoculated in 500 mL glass flasks containing 75 mL semi-solid olive culture medium (OM), without plant growth regulators and supplemented with 7 g/L commercial agar-agar, 30 g/L d-mannitol, and 2 g/L activated charcoal []. Medium pH was adjusted to 5.8 prior autoclaving (20 min at 121 °C, 1 kg/cm2). Twenty microcuttings were inoculated per flask, and four flasks were used per time point (4 and 8 h and 1, 2, 4, 6, 8, 10, 14, 18, 22, 26, and 30 days). All cultures were kept in a plant growth chamber at 24 °C/21 °C (±1 °C) day/night temperatures, with a 15 h photoperiod, under cool-white fluorescent light at a photosynthetically active radiation (PAR) level of 36 μmol/m2 s−2 at culture height. During the in vitro rooting experiment, the segments from the basal portion (approx. 1 cm from the base) of the microcuttings were collected from each flask at the time points mentioned above. Basal segments from microcuttings prepared as described above, but not immersed in IBA and not inoculated in OM medium, were also collected and these corresponded to the time point 0 h (control group). All samples were flash frozen in liquid nitrogen and stored at −80 °C for subsequent analyses.
4.2.2. RNA Isolation and First-Strand cDNA Synthesis
Total RNA was isolated with the Maxwell 16 LEV simplyRNA purification kit (Promega, Madison, WI, USA) on the Maxwell 16 Instrument (Promega, Madison, WI, USA) according to the supplier’s instructions, and eluted in 50 μL volume of RNase-free water. The concentration of total RNA was determined with the NanoDrop-2000C spectrophotometer (Thermo Scientific, Wilmington, DE, USA), and the total RNA integrity was analyzed by agarose gel electrophoresis through visualization of the two ribosomal subunits in a Gene Flash Bio Imaging system (Syngene, Cambridge, UK). GoScript Reverse Transcription System (Promega, Madison, WI, USA) was used to synthesize complementary DNA (cDNA) from RNA samples (using 1 μg of total RNA), according to the manufacturer’s instructions.
4.2.3. Quantitative Real-Time PCR
Real-time PCR was performed in the Applied Biosystems 7500 Real-Time PCR System (Applied Biosystems, Foster City, CA, USA). Real-time PCR reactions were carried out using 1X Maxima SYBR Green qPCR Master Mix, 10 ng of cDNA, and the primers for each target gene and the corresponding transcript variants, as well as for the reference genes used here, as shown in Table S2, in a total volume of 18 μL. Primers for the OeAOX1a and OeAOX1d genes were designed to a common region in the exon 4 in order to detect and amplify all set of distinct transcripts variants. Primers to detect and amplify transcript variants for each gene were designed for a specific region for each variant (see primers localization in Figure 2 (for OeAOX1a) and Figure S6 (for OeAOX1d)). Primers were designed based on the OeAOX1a and OeAOX1d sequences deposited in the NCBI with the Primer Express v3.0 (Applied Biosystems, Foster City, CA, USA), using the default properties given by the software. Regarding the reference genes, actin (OeACT) and the elongation factor 1a (OeEF1a) were selected in a previous analysis as the most stable genes for this experimental system, following an analysis described by Velada et al. []. All primer pairs were checked for their probability to form dimers and secondary structures using the primer test tool of the software. The reactions were performed using the following thermal profile: 10 min at 95 °C, and 40 cycles of 15 s at 95 °C and 60 s at 60 °C. No-template controls (NTCs) were used to assess contaminations and primer dimers formation. A standard curve was performed using an undiluted pool containing all cDNA samples and three four-fold serial dilutions, with a total of four points. All samples were run in duplicate. Melting curve analysis was done to ensure amplification of the specific amplicon. Quantification cycle (Cq) values were acquired for each sample with the Applied Biosystems 7500 software (Applied Biosystems, Foster City, CA, USA).
4.2.4. Expression Analysis of Transcripts
For expression levels normalization of the transcripts under study, Cq values were converted into relative quantities (RQ) by the delta-Ct method described by Vandesompele and co-authors []. The normalization factor was determined by the GeNorm algorithm [] and corresponds to the geometric mean between the RQ of the selected reference genes for each sample. For each gene of interest, calculating the ratio between the RQ for each sample and the corresponding normalization factor, a normalized gene expression value was obtained. The graphs show the mean ± standard deviation of four biological replicates, and the bars represent the fold-change related to the control group (0 h), which was set to 1. Statistical significances (p ≤ 0.05, p ≤ 0.01, and p ≤ 0.001) between means were determined by the t-test method using the IBM® SPSS® Statistics version 22.0 (SPSS Inc., Armonk, NY, USA).
Supplementary Materials
Supplementary materials can be found at http://www.mdpi.com/1422-0067/19/2/597/s1.
Acknowledgments
This work was financially supported by the Project OLEAVALOR (ALT20-03-0145-FEDER-000014) funded by FEDER funds through the Program Alentejo 2020; by national funds through FCT (Foundation for Science and Technology) under the Project UID/AGR/00115/2013; by the Project LISBOA-01-0145-FEDER-007660 (Microbiologia Molecular, Estrutural e Celular) funded by FEDER funds through COMPETE2020—Programa Operacional Competitividade e Internacionalização (POCI); and by FCT. Hélia G. Cardoso and Diana Lousa were supported by the FCT post-doc fellowship SFRH/BPD/109849/2015 and SFRH/BPD/92537/2013, respectively. Isabel Velada was supported by the post-doc1_oleavalor fellowship within the Project OLEAVALOR (ALT20-03-0145-FEDER-000014). Dariusz Grzebelus was supported by the Ministry of Science and Higher Education of the Republic of Poland. The authors are grateful to Virginia Sobral for helpful technical assistance.
Author Contributions
Augusto Peixe, Birgit Arnholdt-Schmitt, and Hélia G. Cardoso conceived and designed the experiments; Isabel Velada, Elisete Santos Macedo, and Hélia G. Cardoso performed the experiments; Isabel Velada, Dariusz Grzebelus, Diana Lousa, Cláudio M. Soares, and Hélia G. Cardoso analyzed the data; Augusto Peixe, Dariusz Grzebelus, Diana Lousa, Cláudio M. Soares, and Hélia G. Cardoso contributed reagents/materials/analysis tools; Isabel Velada, Dariusz Grzebelus, Diana Lousa, and Hélia G. Cardoso wrote the paper. All co-authors read the text, made comments, and approved the final version.
Conflicts of Interest
The authors declare no conflict of interest.
Abbreviations
| AOX | Alternative oxidase |
| AR | Adventitious rooting |
| IBA | indole-3-butyric acid |
| AR | adventitious rooting |
| SNP | single nucleotide polymorphism |
| QTL | Quantitative Trait Locus |
| UTR | Untranslated region |
| APA | alternative polyadenylation |
| mRNA | Messenger Ribonucleic acid |
| PAS | poly(a) site |
| gDNA | Genomic Deoxyribonucleic acid |
| NCBI | National Center for Biotechnology Information |
| TSA | transcriptome shotgun assembly |
| NJ | Neighbor-Joining |
| RACE | Rapid amplification of cDNA ends |
| RT-qPCR | Reverse transcription-quantitative real time polymerase chain reaction |
| ORF | Open reading frame |
| cDNA | complementary DNA |
| LTR | long terminal repeats |
| TSD | Target site duplications |
| PCR | polymerase chain reaction |
| mTP | mitochondrial transit peptides |
| snoRNAs | Small nucleolar RNAs |
| TEs | transposable elements |
| NMD | nonsense-mediated decay |
| RBPs | RNA-binding proteins |
| SHAM | salicylhydroxamic acid |
| ROS | Reactive oxygen species |
| ACT | actin |
| EF1a | elongation factor 1a |
| Cq | Quantification cycle |
| RQ | relative quantities |
References
- Baldoni, L.; Belaj, A. Olive. In Oil Crops; Handbook of Plant Breeding, Vollmann, J., Rajean, I., Eds.; Springer Science Business Media: New York, NY, USA, 2009; pp. 397–421. [Google Scholar]
- Peixe, A.; Santos Macedo, E.; Vieira, C.M.; Arnholdt-Schmitt, B. A histological evaluation of adventitious root formation in olive (Olea europaea L. cv. Galega vulgar) microshoots cultured in vitro. In Proceedings of the 28th International Horticultural Congress, Lisbon, Portugal, 22–27 August 2010; pp. S08–S214. [Google Scholar]
- Porfírio, S.; Gomes da Silva, M.D.R.; Cabrita, M.J.; Azadi, P.; Peixe, A. Reviewing current knowledge on olive (Olea europaea L.) adventitious root formation. Sci. Hortic. (Amsterdam) 2016, 198, 207–226. [Google Scholar] [CrossRef]
- Santos MacEdo, E.; Cardoso, H.G.; Hernández, A.; Peixe, A.A.; Polidoros, A.; Ferreira, A.; Cordeiro, A.; Arnholdt-Schmitt, B. Physiologic responses and gene diversity indicate olive alternative oxidase as a potential source for markers involved in efficient adventitious root induction. Physiol. Plant. 2009, 137, 532–552. [Google Scholar] [CrossRef] [PubMed]
- Potters, G.; Pasternak, T.P.; Guisez, Y.; Palme, K.J.; Jansen, M.A.K. Stress-induced morphogenic responses: Growing out of trouble? Trends Plant Sci. 2007, 12, 98–105. [Google Scholar] [CrossRef] [PubMed]
- Vanlerberghe, G.C.; Cvetkovska, M.; Wang, J. Is the maintenance of homeostatic mitochondrial signaling during stress a physiological role for alternative oxidase? Physiol. Plant. 2009, 137, 392–406. [Google Scholar] [CrossRef] [PubMed]
- Vanlerberghe, G.C. Alternative oxidase: A mitochondrial respiratory pathway to maintain metabolic and signaling homeostasis during abiotic and biotic stress in plants. Int. J. Mol. Sci. 2013, 14, 6805–6847. [Google Scholar] [CrossRef] [PubMed]
- Saha, B.; Borovskii, G.; Panda, S.K. Alternative oxidase and plant stress tolerance. Plant Signal. Behav. 2016, 11, e1256530. [Google Scholar] [CrossRef] [PubMed]
- Simons, B.H.; Lambers, H. The alternative oxidase: Is it a respiratory pathway allowing a plant to cope with stress? In Plant Responses to Environmental Stress: From Phytohormones to Gene Reorganization; Lerner, H.R., Ed.; Marcel Dekker Inc.: New York, NY, USA, 1999; pp. 265–286. [Google Scholar]
- Finnegan, P.M.; Soole, P.M.; Umbach, A.L. Alternative electron transport proteins. In Plant Mitochondria: From Gene to Function. Advances in Photosynthesis and Respiration; Day, D., Millar, H., Whelan, J., Eds.; Kluwer Academic Publishers: Dordrecht, The Netherlands, 2004; p. 182. [Google Scholar]
- Finnegan, P.M.; Soole, K.L.; Umbach, A.L. Alternative mitochondrial electron transport proteins in higher plants. In Plant Mitochondria Advances in Photosynthesis and Respiration; Day, D.A., Millar, A.H., Whelan, J., Eds.; Kluwer Academic Publishers: Dordrecht, The Netherlands, 2004; pp. 163–230. [Google Scholar]
- Clifton, R.; Lister, R.; Parker, K.L.; Sappl, P.G.; Elhafez, D.; Millar, A.H.; Day, D.A.; Whelan, J. Stress-induced co-expression of alternative respiratory chain components in Arabidopsis thaliana. Plant Mol. Biol. 2005, 58, 193–212. [Google Scholar] [CrossRef] [PubMed]
- Clifton, R.; Millar, A.H.; Whelan, J. Alternative oxidases in Arabidopsis: A comparative analysis of differential expression in the gene family provides new insights into function of non-phosphorylating bypasses. Biochim. Biophys. Acta-Bioenerg. 2006, 1757, 730–741. [Google Scholar] [CrossRef] [PubMed]
- Santos Macedo, E.; Sircar, D.; Cardoso, H.G.; Peixe, A.; Arnholdt-Schmitt, B. Involvement of alternative oxidase (AOX) in adventitious rooting of Olea europaea L. microshoots is linked to adaptive phenylpropanoid and lignin metabolism. Plant Cell Rep. 2012, 31, 1581–1590. [Google Scholar] [CrossRef] [PubMed]
- Hedayati, V.; Mousavi, A.; Razavi, K.; Cultrera, N.; Alagna, F.; Mariotti, R.; Hosseini-Mazinani, M.; Baldoni, L. Polymorphisms in the AOX2 gene are associated with the rooting ability of olive cuttings. Plant Cell Rep. 2015, 34, 1151–1164. [Google Scholar] [CrossRef] [PubMed]
- McDonald, A.E.; Costa, J.H.; Nobre, T.; De Melo, D.F.; Arnholdt-Schmitt, B. Evolution of AOX genes across kingdoms and the challenge of classification. In Alternative Respiratory Pathways in Higher Plants; John Wiley & Sons, Inc.: Hoboken, NJ, USA, 2015; pp. 267–272. ISBN 9781118789971. [Google Scholar]
- Costa, J.H.; McDonald, A.E.; Arnholdt-Schmitt, B.; Fernandes de Melo, D. A classification scheme for alternative oxidases reveals the taxonomic distribution and evolutionary history of the enzyme in angiosperms. Mitochondrion 2014, 19, 172–183. [Google Scholar] [CrossRef] [PubMed]
- Costa, J.H.; dos Santos, C.P.; de Sousa e Lima, B.; Moreira Netto, A.N.; Saraiva, K.D.d.C.; Arnholdt-Schmitt, B. In silico identification of alternative oxidase 2 (AOX2) in monocots: A new evolutionary scenario. J. Plant Physiol. 2017, 210, 58–63. [Google Scholar] [CrossRef] [PubMed]
- Cardoso, H.G.; Nogales, A.; Frederico, A.M.; Svensson, J.T.; Macedo, E.S.; Valadas, V.; Arnholdt-Schmitt, B. Exploring AOX gene diversity. In Alternative Respiratory Pathways in Higher Plants; John Wiley & Sons, Inc.: Hoboken, NJ, USA, 2015; pp. 239–254. ISBN 9781118789971. [Google Scholar]
- Whelan, J.; Millar, A.H.; Day, D.A. The alternative oxidase is encoded in a multigene family in soybean. Planta 1996, 198, 197–201. [Google Scholar] [CrossRef] [PubMed]
- Saisho, D.; Nambara, E.; Naito, S.; Tsutsumi, N.; Hirai, A.; Nakazono, M. Characterization of the gene family for alternativa oxidase from Arabidopsis thaliana. Plant Mol. Biol. 1997, 35, 585–596. [Google Scholar] [CrossRef] [PubMed]
- Considine, M.J.; Holtzapffel, R.C.; Day, D.A.; Whelan, J.; Millar, A.H. Molecular distinction between alternative oxidase from monocots and dicots. Plant Physiol. 2002, 129, 949–953. [Google Scholar] [CrossRef] [PubMed]
- Costa, J.H.; dos Santos, C.P.; da Cruz Saraiva, K.D.; Arnholdt-Schmitt, B. A step-by-step protocol for classifying AOX proteins in flowering plants. Methods Mol. Biol. 2017, 1670, 225–234. [Google Scholar] [PubMed]
- Feng, H.; Guan, D.; Sun, K.; Wang, Y.; Zhang, T.; Wang, R. Expression and signal regulation of the alternative oxidase genes under abiotic stresses. Acta Biochim. Biophys. Sin. (Shanghai) 2013, 45, 985–994. [Google Scholar] [CrossRef] [PubMed]
- Costa, J.H.; Mota, E.F.; Cambursano, M.V.; Lauxmann, M.A.; De Oliveira, L.M.N.; Silva Lima, M.D.G.; Orellano, E.G.; Fernandes De Melo, D. Stress-induced co-expression of two alternative oxidase (VuAox1 and 2b) genes in Vigna unguiculata. J. Plant Physiol. 2010, 167, 561–570. [Google Scholar] [CrossRef] [PubMed]
- Cavalcanti, J.H.F.; Oliveira, G.M.; Saraiva, K.D.d.C.; Torquato, J.P.P.; Maia, I.G.; Fernandes de Melo, D.; Costa, J.H. Identification of duplicated and stress-inducible Aox2b gene co-expressed with Aox1 in species of the Medicago genus reveals a regulation linked to gene rearrangement in leguminous genomes. J. Plant Physiol. 2013, 170, 1609–1619. [Google Scholar] [CrossRef] [PubMed]
- Velada, I.; Ragonezi, C.; Arnholdt-Schmitt, B.; Cardoso, H. Reference Genes Selection and Normalization of Oxidative Stress Responsive Genes upon Different Temperature Stress Conditions in Hypericum perforatum L. PLoS ONE 2014, 9, e115206. [Google Scholar] [CrossRef] [PubMed]
- Guerra Cardoso, H.; Doroteia Campos, M.; Rita Costa, A.; Catarina Campos, M.; Nothnagel, T.; Arnholdt-Schmitt, B. Carrot alternative oxidase gene AOX2a demonstrates allelic and genotypic polymorphisms in intron 3. Physiol. Plant. 2009, 137, 592–608. [Google Scholar] [CrossRef] [PubMed]
- Cardoso, H.; Campos, M.D.; Nothnagel, T.; Arnholdt-Schmitt, B. Polymorphisms in intron 1 of carrot AOX2b–a useful tool to develop a functional marker? Plant Genet. Resour. 2011, 9, 177–180. [Google Scholar] [CrossRef]
- Ferreira, A.O.; Cardoso, H.G.; Macedo, E.S.; Breviario, D.; Arnholdt-Schmitt, B. Intron polymorphism pattern in AOX1b of wild St John’s wort (Hypericum perforatum) allows discrimination between individual plants. Physiol. Plant. 2009, 137, 520–531. [Google Scholar] [CrossRef] [PubMed]
- Nogales, A.; Nobre, T.; Cardoso, H.G.; Muñoz-Sanhueza, L.; Valadas, V.; Campos, M.D.; Arnholdt-Schmitt, B. Allelic variation on DcAOX1 gene in carrot (Daucus carota L.): An interesting simple sequence repeat in a highly variable intron. Plant Gene 2016, 5, 49–55. [Google Scholar] [CrossRef]
- Nobre, T.; Campos, M.D.; Lucic-Mercy, E.; Arnholdt-Schmitt, B. Misannotation Awareness: A Tale of Two Gene-Groups. Front. Plant Sci. 2016, 7, 868. [Google Scholar] [CrossRef] [PubMed]
- Albury, M.S.; Elliott, C.; Moore, A.L. Towards a structural elucidation of the alternative oxidase in plants. Physiol. Plant. 2009, 137, 316–327. [Google Scholar] [CrossRef] [PubMed]
- Abe, F.; Saito, K.; Miura, K.; Toriyama, K. A single nucleotide polymorphism in the alternative oxidase gene among rice varieties differing in low temperature tolerance. FEBS Lett. 2002, 527, 181–185. [Google Scholar] [CrossRef]
- Di Giammartino, D.C.; Nishida, K.; Manley, J.L. Mechanisms and Consequences of Alternative Polyadenylation. Mol. Cell 2011, 43, 853–866. [Google Scholar] [CrossRef] [PubMed]
- Polidoros, A.N.; Mylona, P.V.; Arnholdt-Schmitt, B. Aox gene structure, transcript variation and expression in plants. Physiol. Plant. 2009, 137, 342–353. [Google Scholar] [CrossRef] [PubMed]
- Umbach, A.L.; Siedow, J.N. Covalent and Noncovalent Dimers of the Cyanide-Resistant Alternative Oxidase Protein in Higher Plant Mitochondria and Their Relationship to Enzyme Activity. Plant Physiol. 1993, 103, 845–854. [Google Scholar] [CrossRef] [PubMed]
- Moore, A.L.; Shiba, T.; Young, L.; Harada, S.; Kita, K.; Ito, K. Unraveling the Heater: New Insights into the Structure of the Alternative Oxidase. Annu. Rev. Plant Biol. 2013, 64, 637–663. [Google Scholar] [CrossRef] [PubMed]
- Tian, B.; Manley, J.L. Alternative polyadenylation of mRNA precursors. Nat. Rev. Mol. Cell Biol. 2017, 18, 18–30. [Google Scholar] [CrossRef] [PubMed]
- Macedo, E.; Vieira, C.; Carrizo, D.; Porfírio, S.; Hegewald, H.; Arnholdt-Schmitt, B.; Calado, M.L.; Peixe, A. Adventitious root formation in olive (Olea europaea L.) microshoots: Anatomical evaluation and associated biochemical changes in peroxidase and polyphenoloxidase activities. J. Hortic. Sci. Biotechnol. 2013, 88, 53–59. [Google Scholar] [CrossRef]
- Campos, M.D.; Cardoso, H.G.; Linke, B.; Costa, J.H.; De Melo, D.F.; Justo, L.; Frederico, A.M.; Arnholdt-Schmitt, B. Differential expression and co-regulation of carrot AOX genes (Daucus carota). Physiol. Plant. 2009, 137, 578–591. [Google Scholar] [CrossRef] [PubMed]
- Velada, I.; Cardoso, H.G.; Ragonezi, C.; Nogales, A.; Ferreira, A.; Valadas, V.; Arnholdt-Schmitt, B. Alternative Oxidase Gene Family in Hypericum perforatum L.: Characterization and Expression at the Post-germinative Phase. Front. Plant Sci. 2016, 7, 1–16. [Google Scholar] [CrossRef] [PubMed]
- Liang, W.-S. Respiratory pathways in bulky tissues and storage organs. In Alternative Respiratory Pathways in Higher Plants; Gupta, K.J., Mur, L.A.J., Neelwarne, B., Eds.; John Wiley & Sons, Ltd.: Chichester, UK, 2015; pp. 221–232. ISBN 9781118789971. [Google Scholar]
- Vishwakarma, A.; Dalal, A.; Tetali, S.D.; Kirti, P.B.; Padmasree, K. Genetic engineering of AtAOX1a in Saccharomyces cerevisiae prevents oxidative damage and maintains redox homeostasis. FEBS Open Bio 2016, 6, 135–146. [Google Scholar] [CrossRef] [PubMed]
- Huang, S.; Taylor, N.L.; Whelan, J.; Millar, A.H. Refining the Definition of Plant Mitochondrial Presequences through Analysis of Sorting Signals, N-Terminal Modifications, and Cleavage Motifs. Plant Physiol. 2009, 150, 1272–1285. [Google Scholar] [CrossRef] [PubMed]
- Heyn, P.; Kalinka, A.T.; Tomancak, P.; Neugebauer, K.M. Introns and gene expression: Cellular constraints, transcriptional regulation, and evolutionary consequences. BioEssays 2015, 37, 148–154. [Google Scholar] [CrossRef] [PubMed]
- Oswald, A.; Oates, A.C. Control of endogenous gene expression timing by introns. Genome Biol. 2011, 12, 107. [Google Scholar] [CrossRef] [PubMed]
- Brinster, R.L.; Allen, J.M.; Behringer, R.R.; Gelinas, R.E.; Palmiter, R.D. Introns increase transcriptional efficiency in transgenic mice. Proc. Natl. Acad. Sci. USA 1988, 85, 836–840. [Google Scholar] [CrossRef] [PubMed]
- Pawlicki, J.M.; Steitz, J.A. Primary microRNA transcript retention at sites of transcription leads to enhanced microRNA production. J. Cell Biol. 2008, 182, 61–76. [Google Scholar] [CrossRef] [PubMed]
- Hirsch, C.D.; Springer, N.M. Transposable element influences on gene expression in plants. Biochim. Biophys. Acta-Gene Regul. Mech. 2017, 1860, 157–165. [Google Scholar] [CrossRef] [PubMed]
- Schnable, P.S.; Ware, D.; Fulton, R.S.; Stein, J.C.; Wei, F.; Pasternak, S.; Liang, C.; Zhang, J.; Fulton, L.; Graves, T.A.; et al. The B73 Maize Genome: Complexity, Diversity, and Dynamics. Science 2009, 326, 1112–1115. [Google Scholar] [CrossRef] [PubMed]
- Ohtsu, K.; Hirano, H.Y.; Tsutsumi, N.; Hirai, A.; Nakazono, M. Anaconda, a new class of transposon belonging to the Mu superfamily, has diversified by acquiring host genes during rice evolution. Mol. Genet. Genom. 2005, 274, 606–615. [Google Scholar] [CrossRef] [PubMed]
- Costa, J.H.; De Melo, D.F.; Gouveia, Z.; Cardoso, H.G.; Peixe, A.; Arnholdt-Schmitt, B. The alternative oxidase family of Vitis vinifera reveals an attractive model to study the importance of genomic design. Physiol. Plant. 2009, 137, 553–565. [Google Scholar] [CrossRef] [PubMed]
- Macko-Podgorni, A.; Nowicka, A.; Grzebelus, E.; Simon, P.W.; Grzebelus, D. DcSto: Carrot Stowaway-like elements are abundant, diverse, and polymorphic. Genetica 2013, 141, 255–267. [Google Scholar] [CrossRef] [PubMed]
- Li, Q.Q.; Liu, Z.; Lu, W.; Liu, M. Interplay between Alternative Splicing and Alternative Polyadenylation Defines the Expression Outcome of the Plant Unique OXIDATIVE TOLERANT-6 Gene. Sci. Rep. 2017, 7, 2052. [Google Scholar] [CrossRef] [PubMed]
- Tantikanjana, T. An Alternative Transcript of the S Locus Glycoprotein Gene in a Class II Pollen-Recessive Self-Incompatibility Haplotype of Brassica oleracea Encodes a Membrane-Anchored Protein. Plant Cell Online 1993, 5, 657–666. [Google Scholar] [CrossRef] [PubMed]
- Simpson, G.G.; Dijkwel, P.P.; Quesada, V.; Henderson, I.; Dean, C. FY is an RNA 3′ end-processing factor that interacts with FCA to control the Arabidopsis floral transition. Cell 2003, 113, 777–787. [Google Scholar] [CrossRef]
- Lykke-Andersen, S.; Jensen, T.H. Nonsense-mediated mRNA decay: An intricate machinery that shapes transcriptomes. Nat. Rev. Mol. Cell Biol. 2015, 16, 665–677. [Google Scholar] [CrossRef] [PubMed]
- Fabian, M.R.; Sonenberg, N.; Filipowicz, W. Regulation of mRNA Translation and Stability by microRNAs. Annu. Rev. Biochem. 2010, 79, 351–379. [Google Scholar] [CrossRef] [PubMed]
- Lianoglou, S.; Garg, V.; Yang, J.L.; Leslie, C.S.; Mayr, C. Ubiquitously transcribed genes use alternative polyadenylation to achieve tissue-specific expression. Genes Dev. 2013, 27, 2380–2396. [Google Scholar] [CrossRef] [PubMed]
- Smibert, P.; Miura, P.; Westholm, J.O.; Shenker, S.; May, G.; Duff, M.O.; Zhang, D.; Eads, B.D.; Carlson, J.; Brown, J.B.; et al. Global Patterns of Tissue-Specific Alternative Polyadenylation in Drosophila. Cell Rep. 2012, 1, 277–289. [Google Scholar] [CrossRef] [PubMed]
- Sandberg, R.; Neilson, J.R.; Sarma, A.; Sharp, P.A.; Burge, C.B. Proliferating cells express mRNAs with shortened 3′ UTRs and fewer microRNA target sites. Science 2008, 320, 1643–1647. [Google Scholar] [CrossRef] [PubMed]
- Mayr, C.; Bartel, D.P. Widespread Shortening of 3’UTRs by Alternative Cleavage and Polyadenylation Activates Oncogenes in Cancer Cells. Cell 2009, 138, 673–684. [Google Scholar] [CrossRef] [PubMed]
- Gupta, I.; Clauder-Münster, S.; Klaus, B.; Järvelin, A.I.; Aiyar, R.S.; Benes, V.; Wilkening, S.; Huber, W.; Pelechano, V.; Steinmetz, L.M. Alternative polyadenylation diversifies post-transcriptional regulation by selective RNA-protein interactions. Mol. Syst. Biol. 2014, 10. [Google Scholar] [CrossRef] [PubMed]
- Gruber, A.R.; Martin, G.; Müller, P.; Schmidt, A.; Gruber, A.J.; Gumienny, R.; Mittal, N.; Jayachandran, R.; Pieters, J.; Keller, W.; et al. Global 3′UTR shortening has a limited effect on protein abundance in proliferating T cells. Nat. Commun. 2014, 5, 5465. [Google Scholar] [CrossRef] [PubMed]
- Arnholdt-Schmitt, B.; Santos Macedo, E.; Peixe, A.; Cardoso, H.; Cordeiro, A. AOX—A potential functional marker for efficient rooting in olive shoot cuttings. In Proceedings of the Second International Seminar Olivebioteq, Mazara del Vallo, Italy, 5–10 November 2006; pp. 249–254. [Google Scholar]
- Arnholdt-Schmitt, B.; Costa, J.H.; de Melo, D.F. AOX-a functional marker for efficient cell reprogramming under stress? Trends Plant Sci. 2006, 11, 281–287. [Google Scholar] [CrossRef] [PubMed]
- Porfirio, S.; Calado, M.L.; Noceda, C.; Cabrita, M.J.; da Silva, M.G.; Azadi, P.; Peixe, A. Tracking biochemical changes during adventitious root formation in olive (Olea europaea L.). Sci. Hortic. (Amsterdam) 2016, 204, 41–53. [Google Scholar] [CrossRef]
- De Klerk, G. Markers of adventitious root formation. Agronomie 1996, 16, 609–616. [Google Scholar] [CrossRef]
- Gaspar, T.; Kevers, C.; Hausman, J.; Berthon, J.; Ripetti, V. Practical uses of peroxidase activity as a predictive marker of rooting performance of micropropagated shoots. Agronomie 1992, 12, 757–765. [Google Scholar] [CrossRef]
- Gaspar, T.; Kevers, C.; Hausman, J.-F. Indissociable Chief Factors in the Inductive Phase of Adventitious Rooting BT-Biology of Root Formation and Development; Altman, A., Waisel, Y., Eds.; Springer: Boston, MA, USA, 1997; pp. 55–63. ISBN 978-1-4615-5403-5. [Google Scholar]
- Jarvis, B.C. Endogenous Control of Adventitious Rooting in Non-Woody Cuttings. In BT-New Root Formation in Plants and Cuttings; Jackson, M.B., Ed.; Springer: Dordrecht, The Netherlands, 1986; pp. 191–222. ISBN 978-94-009-4358-2. [Google Scholar]
- Kevers, C.; Hausman, J.F.; Faivre-Rampant, O.; Evers, D.; Gaspar, T. Hormonal control of adventitious rooting: Progress and questions. J. Appl. Bot. 1997, 71, 71–79. [Google Scholar]
- Rout, G.R.; Samantaray, S.; Das, P. In vitro rooting of Psoralea corylifolia Linn: Peroxidase activity as a marker. Plant Growth Regul. 2000, 30, 215–219. [Google Scholar] [CrossRef]
- Berthon, J.Y.; Ben Tahar, S.; Gaspar, T.; Boyer, N. Rooting phases of shoots of Sequoiadendron giganteum in vitro and their requirements. Plant Physiol. Biochem. 1990, 28, 631–638. [Google Scholar]
- Heloir, M.C.; Kevers, C.; Hausman, J.F.; Gaspar, T. Changes in the concentrations of auxins and polyamines during rooting of in-vitro-propagated walnut shoots. Tree Physiol. 1996, 16, 515–519. [Google Scholar] [CrossRef] [PubMed]
- Li, S.W.; Xue, L.; Xu, S.; Feng, H.; An, L. Mediators, genes and signaling in adventitious rooting. Bot. Rev. 2009, 75, 230–247. [Google Scholar] [CrossRef]
- Pacurar, D.I.; Perrone, I.; Bellini, C. Auxin is a central player in the hormone cross-talks that control adventitious rooting. Physiol. Plant. 2014, 151, 83–96. [Google Scholar] [CrossRef] [PubMed]
- Campos, D.M.; Nogales, A.; Cardoso, H.G.; Kumar, S.R.; Nobre, T.; Sathishkumar, R.; Arnholdt-Schmitt, B. Stress-induced accumulation of DcAoX1 and DcAoX2a transcripts coincides with critical time point for structural biomass prediction in carrot primary cultures (Daucus carota L.). Front. Genet. 2016, 7. [Google Scholar] [CrossRef] [PubMed]
- Frederico, A.M.; Campos, M.D.; Cardoso, H.G.; Imani, J.; Arnholdt-Schmitt, B. Alternative oxidase involvement in Daucus carota somatic embryogenesis. Physiol. Plant. 2009, 137, 498–508. [Google Scholar] [CrossRef] [PubMed]
- Ivanova, A.; Law, S.R.; Narsai, R.; Duncan, O.; Lee, J.-H.; Zhang, B.; Van Aken, O.; Radomiljac, J.D.; van der Merwe, M.; Yi, K.; et al. A Functional Antagonistic Relationship between Auxin and Mitochondrial Retrograde Signaling Regulates Alternative Oxidase1a Expression in Arabidopsis. Plant Physiol. 2014, 165, 1233–1254. [Google Scholar] [CrossRef] [PubMed]
- Kerchev, P.I.; De Clercq, I.; Denecker, J.; Mühlenbock, P.; Kumpf, R.; Nguyen, L.; Audenaert, D.; Dejonghe, W.; Van Breusegem, F. Mitochondrial perturbation negatively affects auxin signaling. Mol. Plant 2014, 7, 1138–1150. [Google Scholar] [CrossRef] [PubMed]
- Choudhury, F.K.; Rivero, R.M.; Blumwald, E.; Mittler, R. Reactive oxygen species, abiotic stress and stress combination. Plant J. 2017, 90, 856–867. [Google Scholar] [CrossRef] [PubMed]
- Rhoads, D.M.; Umbach, A.L.; Subbaiah, C.C.; Siedow, J.N. Mitochondrial reactive oxygen species. Contribution to oxidative stress and interorganellar signaling. Plant Physiol. 2006, 141, 357–366. [Google Scholar] [CrossRef] [PubMed]
- Tognetti, V.B.; Mühlenbock, P.; van Breusegem, F. Stress homeostasis-the redox and auxin perspective. Plant Cell Environ. 2012, 35, 321–333. [Google Scholar] [CrossRef] [PubMed]
- Pasternak, T.; Potters, G.; Caubergs, R.; Jansen, M.A.K. Complementary interactions between oxidative stress and auxins control plant growth responses at plant, organ, and cellular level. J. Exp. Bot. 2005, 56, 1991–2001. [Google Scholar] [CrossRef] [PubMed]
- Guilfoyle, T.J.; Hagen, G. Auxin response factors. Curr. Opin. Plant Biol. 2007, 10, 453–460. [Google Scholar] [CrossRef] [PubMed]
- Peixe, A.; Raposo, A.; Lourenço, R.; Cardoso, H.; Macedo, E. Coconut water and BAP successfully replaced zeatin in olive (Olea europaea L.) micropropagation. Sci. Hortic. (Amsterdam) 2007, 113, 1–7. [Google Scholar] [CrossRef]
- Karlin, S.; Altschul, S.F. Applications and statistics for multiple high-scoring segments in molecular sequences. Proc. Natl. Acad. Sci. USA 1993, 90, 5873–5877. [Google Scholar] [CrossRef] [PubMed]
- Kumar, S.; Stecher, G.; Tamura, K. MEGA7: Molecular Evolutionary Genetics Analysis Version 7.0 for Bigger Datasets. Mol. Biol. Evol. 2016, 33, 1870–1874. [Google Scholar] [CrossRef] [PubMed]
- Emanuelsson, O.; Nielsen, H.; Brunak, S.; von Heijne, G. Predicting Subcellular Localization of Proteins Based on their N-terminal Amino Acid Sequence. J. Mol. Biol. 2000, 300, 1005–1016. [Google Scholar] [CrossRef] [PubMed]
- Šali, A.; Blundell, T.L. Comparative Protein Modelling by Satisfaction of Spatial Restraints. J. Mol. Biol. 1993, 234, 779–815. [Google Scholar] [CrossRef] [PubMed]
- Hall, T.A. BioEdit: A user-friendly biological sequence alignment editor and analysis program for Windows 95/98/NT. Nucleic Acids Symp. Ser. 1999, 41, 95–98. [Google Scholar]
- Barghini, E.; Natali, L.; Giordani, T.; Cossu, R.M.; Scalabrin, S.; Cattonaro, F.; Šimková, H.; Vrána, J.; Doležel, J.; Morgante, M.; et al. LTR retrotransposon dynamics in the evolution of the olive (Olea europaea) genome. DNA Res. 2015, 22, 91–100. [Google Scholar] [CrossRef] [PubMed]
- Higo, K.; Ugawa, Y.; Iwamoto, M.; Korenaga, T. Plant cis-acting regulatory DNA elements (PLACE) database: 1999. Nucleic Acids Res. 1999, 27, 297–300. [Google Scholar] [CrossRef] [PubMed]
- Lescot, M.; Déhais, P.; Thijs, G.; Marchal, K.; Moreau, Y.; Van de Peer, Y.; Rouzé, P.; Rombauts, S. PlantCARE, a database of plant cis-acting regulatory elements and a portal to tools for in silico analysis of promoter sequences. Nucleic Acids Res. 2002, 30, 325–327. [Google Scholar] [CrossRef] [PubMed]
- Rugini, E. In vitro propagation of some olive (Olea europaea sativa L.) cultivars with different root-ability, and medium development using analytical data from developing shoots and embryos. Sci. Hortic. (Amsterdam) 1984, 24, 123–134. [Google Scholar] [CrossRef]
- Vandesompele, J.; De Preter, K.; Pattyn, F.; Poppe, B.; Van Roy, N.; De Paepe, A.; Speleman, F. Accurate normalization of real-time quantitative RT-PCR data by geometric averaging of multiple internal control genes. Genome Biol. 2002, 3. [Google Scholar] [CrossRef]
© 2018 by the authors. Licensee MDPI, Basel, Switzerland. This article is an open access article distributed under the terms and conditions of the Creative Commons Attribution (CC BY) license (http://creativecommons.org/licenses/by/4.0/).