Article

Transcriptome Analysis Reveals Molecular Signatures of Luteoloside Accumulation in Senescing Leaves of Lonicera macranthoides

1
Research Institute for Special Plants, Chongqing University of Arts and Sciences, Yongchuan 402160, China
2
Collaborative Innovation Center of Special Plant Industry in Chongqing, Chongqing 400000, China
3
Chongqing Key Laboratory of Economic Plant Biotechnology, Chongqing 400000, China
4
School of Life Sciences, Chongqing University, Chongqing 400030, China
*
Authors to whom correspondence should be addressed.
Int. J. Mol. Sci. 2018, 19(4), 1012; https://doi.org/10.3390/ijms19041012
Submission received: 8 December 2017 / Revised: 22 March 2018 / Accepted: 27 March 2018 / Published: 28 March 2018
(This article belongs to the Section Biochemistry)

Abstract

:
Lonicera macranthoides is an important medicinal plant widely used in traditional Chinese medicine. Luteoloside is a critical bioactive compound in L. macranthoides. To date, the molecular mechanisms underlying luteoloside biosynthesis are still largely unknown. In this work, high performance liquid chromatography (HPLC) was employed to determine the luteoloside contents in leaves, stems, and flowers at different developmental stages. Results showed that senescing leaves can accumulate large amounts of luteoloside, extremely higher than that in young and semi-lignified leaves and other tissues. RNA-Seq analysis identified that twenty-four differentially expressed unigenes (DEGs) associated with luteoloside biosynthesis were significantly up-regulated in senescing leaves, which are positively correlated with luteoloside accumulation. These DEGs include phenylalanine ammonia lyase 2, cinnamate 4-hydroxylase 2, thirteen 4-coumarate-CoA ligases, chalcone synthase 2, six flavonoid 3′-monooxygenase (F3′H) and two flavone 7-O-β-glucosyltransferase (UFGT) genes. Further analysis demonstrated that two F3′Hs (CL11828.Contig1 and CL11828.Contig2) and two UFGTs (Unigene2918 and Unigene97915) might play vital roles in luteoloside generation. Furthermore, several transcription factors (TFs) related to flavonoid biosynthesis including MYB, bHLH and WD40, were differentially expressed during leaf senescence. Among these TFs, MYB12, MYB75, bHLH113 and TTG1 were considered to be key factors involved in the regulation of luteoloside biosynthesis. These findings provide insights for elucidating the molecular signatures of luteoloside accumulation in L. macranthoides.

1. Introduction

Lonicera macranthoides, a member of the Caprifoliaceae family, is a medicinal plant primarily distributed in Southern China. It has been widely used as a critical raw material in traditional Chinese medicine for thousands of years, because it can effectively treat H1N1, respiratory syndrome, and hand-foot-and-mouth disease (China Pharmacopeia Commission, 2010). Furthermore, L. macranthoides extracts are utilized as important and indispensable ingredients in functional foods, beverages, wine and cosmetics [1,2]. A subset of secondary metabolites, including flavonoids, phenolic acid, volatile oil and saponins, is present in whole plants of L. macranthoides [3]. These components possess a wide range of pharmacological activities, such as antioxidant, anti-inflammatory, antibacterial, antiviral, antipyretic, liver protective and anticancer effects [4,5,6]. However, the quality and medicinal value of L. macranthoides remain controversial because of the distinctive accumulation patterns of bioactive compounds, especially flavones in flower buds. Luteolin and luteoloside are the main flavones in Lonicera. Previous studies demonstrated that the flavones are accumulated at high levels in L. japonica, which are approximately two fold higher than those in flower buds of L. macranthoides [7]. According to the China Pharmacopoeia, L. macranthoides was distinguished from L. japonica indicated by the report that luteoloside is less abundant in flowers of L. macranthoides than in those of L. japonica (China Pharmacopeia Commission, 2015). However, Yuan et al. [8] found no significant difference in luteoloside content between the flower buds of L. japonica and L. macranthoides. To date, there has been a longstanding controversy regarding the luteoloside accumulation in L. macranthoides. Hence, the knowledge of quantitative profiling for luteoloside is of major importance for characterizing molecular basis of luteoloside biosynthesis and has significant implications for health benefits of L. macranthoides.
Luteoloside is an important plant flavone [8], which exhibits diverse pharmacological activities for promoting nutrition and health [9]. Therefore, an increasing number of researchers attempted to increase biosynthesis and accumulation of luteoloside in Lonicera by using engineering strategies. Luteoloside is derived from the phenylpropanoid pathway, which can be divided into two stages [10]. First, phenylalanine is catalyzed to trans-cinnamic acid via phenylalanine ammonia-lyase (PAL, EC:4.3.1.24) and then to p-coumaric acid via trans-cinnamate 4-hydroxylase (C4H, EC:1.14.13.11). Subsequently, p-coumaroyl-CoA is generated via 4-coumarate-CoA ligase (4CL, EC:6.2.1.12), which is the precursor for a variety of important secondary metabolites [11]. Yuan et al. [8] observed that the expression of PAL1, C4H2 and 4CL2 positively correlates with the content of luteolin, the substrate of luteoloside biosynthesis, in the leaves and flower buds of L. japonica. These findings are consistent with the reports showing a positive correlation was found between the enzyme activities of PAL, C4H and 4CL and the accumulation of luteoloside [1]. The above results indicate the essential roles of these genes in luteoloside biosynthesis in L. japonica. Chalcone synthase (CHS, EC:2.3.1.74) and chalcone isomerase (CHI, EC:5.5.1.6) are the key regulatory enzymes required for the conversion of p-coumaroyl-CoA to naringenin [12].Naringenin serves as an important branch point for luteoloside biosynthesis, which is catalyzed to either apigenin or eriodictyol through flavones synthase (FNS, EC:1.14.11.23) or flavonoid 3′-hydroxylase (F3′H, EC:1.14.13.21), respectively. The two flavones are converted to luteolin via F3′H and FNS, respectively. Luteoloside is further synthesized via UDP-glucose flavone 7-O-β-glucosyltransferase (UF7GT, EC:2.4.1.81) [13]. CHI exhibits a close correlation with variations in luteoloside content at different flowering stages in L. japonica [1,8]. Other genes encoding CHS, FNSII, F3′H and UFGT were identified by RNA-Seq to be possibly associatedwith luteoloside biosynthesis in L. japonica [10,14]. Very recently, Wu et al. [7] reported a FNSII gene, LmFNSII-1.1, might be the key gene involved in flavone accumulation in the buds of L. macranthoides. Despite recent advances, the publications concerning the molecular evidence for a relationship between luteoloside abundance and organ development of L. macranthoides are limited. It remains a mystery that which enzymes or genes are responsible for luteoloside accumulation in L. macranthoides.
Flavonoid biosynthesis involves a multitude of regulatory proteins. Some transcription factors (TFs), such as R2R3-MYB, bHLH and WD40, can regulate the genes encoding biosynthetic enzymes by binding their promoters. To date, MYBs controlling flavonoid biosynthesis have been identified in many plant species. MYB11/12/111 in Arabidopsis [15,16], VvMYBF1 in Vitis vinifera [17] and EsMYBF1 in Epimedium sagittatum [18] were characterized to activate flavonol accumulation. Several MYBs, including MdMYBA [19], MdMYB1 [20] and MdMYB10 [21] in apple, VvMYBA1 and VvMYBA2 in grape [22,23], and PyMYB10 in pears [24] control anthocyanin biosynthesis positively. Aside from the activators, several repressor MYBs are also isolated, including AtMYBL2 [25], AtMYB4, AtMYB60 [26,27], AmMYB308 [28] and FaMYB1 [29]. Furthermore, several bHLH and WD40 proteins, such as TT8 and TTG1, act as positive regulators for flavonoid biosynthesis [30]. Although more TF members of MYB-bHLH-WD40 related to flavonoid biosynthesis are characterized, scare reports on the transcriptional regulation of flavonoid biosynthesis in Lonicera are available [31]. Thus, identifying the TFs involved in the regulation of luteoloside accumulation is essential for elucidating the molecular features of luteoloside biosynthesis.
In the present study, luteoloside in different tissues and developmental stages was determined using high performance liquid chromatography (HPLC) and transcriptome-wide sequencing in L. macranthoides was performed using the Illumina HiSeq™ 2000 platform to explore the key genes encoding biosynthetic enzymes and regulator proteins associated with the luteoloside biosynthesis in L. macranthoides. These results provide genomic resources for future enhancement of luteoloside production by genetic strategies in L. macranthoides.

2. Results

2.1. Luteoloside Contents in Different Tissues and Developmental Stages of L. macranthoides

Luteoloside contents in the leaves, stems and flowers were quantified by HPLC (Figure S1). The contents differed significantly among the three tissues and different developmental stages (Figure 1). Senescing leaves (SL) can accumulate very large amounts of luteoloside (up to 1.625 mg/g DW), which was approximately 35- and 160-fold higher than that in young leaves (YL) and semi-lignified leaves, respectively (Figure 1A,B). There was no obvious change in luteoloside accumulation among the various developmental stages of stems (Figure 1C,D). Luteoloside contents fluctuated throughout the flower development and the highest luteoloside level in flowers was found in white flower, followed by green flower buds in length of 10 mm (Figure 1E,F). For all tissues examined, flowers displayed remarkably higher luteoloside contents than that in leaves and stems of various developmental stages except for senescing leaves.

2.2. RNA-Seq Analysis

To further explore the candidate genes involved in luteoloside biosynthesis of L. macranthoides, two libraries including SL and YL were established for RNA-Seq analysis. The raw data generated by sequencing for each library ranged from 82.4 to 87.5 million reads. After filtering, a total of 76.8 to 82 million clean reads were obtained, accounting for 93% of the raw reads, with an average GC % of 44.19% for all clean reads being (Supplementary Table S1).
These clean reads were assembled into 260,079 and 173,214 contigs for SL and YL libraries, respectively. After processing by using Trinity and TGICL software, the contigs of SL were further incorporated into 183,667 unigenes with an average length of 903 bps and an N50 length of 1501 bps. Moreover, a total of 122,824 unigenes were obtained in YL library, with an average length of 1131 bp and an N50 value of 1859 bps (Table 1). The length distribution for all unigenes in L. macranthoides is shown in Figure S2. The numbers of unigenes with sequence length longer than 500 bp, 1000 bp, 2000 bp and 3000 bp accounted for 70.05% (111,272), 41.3% (65,614), 16.8% (26,673) and 5.7% (9053) of the total unigenes, respectively (Figure S2). The assembled data for L. macranthoides in this study was improved compared to our earlier published transcriptome assemblies, with remarkable increases in overall unigene length and N50 value [11].
The unigene sequences were subjected to BLASTx for further annotation, with a threshold of 10−5. A total of 111,811 unigenes (70.4%) showed significant similarity to known proteins. Among them, 101,618, 68,308, 68,713, 67,523, 55,312 and 56,734 unigenes can be annotated in the NCBI nonredundant (Nr), nucleotide sequence (Nt), Swiss-Prot, Kyoto Encyclopedia of Genes and Genomes (KEGG), Clusters of Orthologous Groups of proteins (COG), and GO databases, respectively (Supplementary Table S2). Similarity distribution analysis of the top-hits in the Nr database indicated that 49% of the unigenes showed more than 60% similarity (Figure S3A). Species distribution analysis demonstrated that 42.6% of the unigenes showed close homology with seven plant species, including V. vinifera, ‘Chlorella vulgaris’ C-169, Theobroma cacao, Solanum tuberosum, Amygdalus persica, Hordeum sativum and Populus trichocarpa, of which, 17.8% of the annotated sequences were assigned to V. vinifera (Figure S3B).

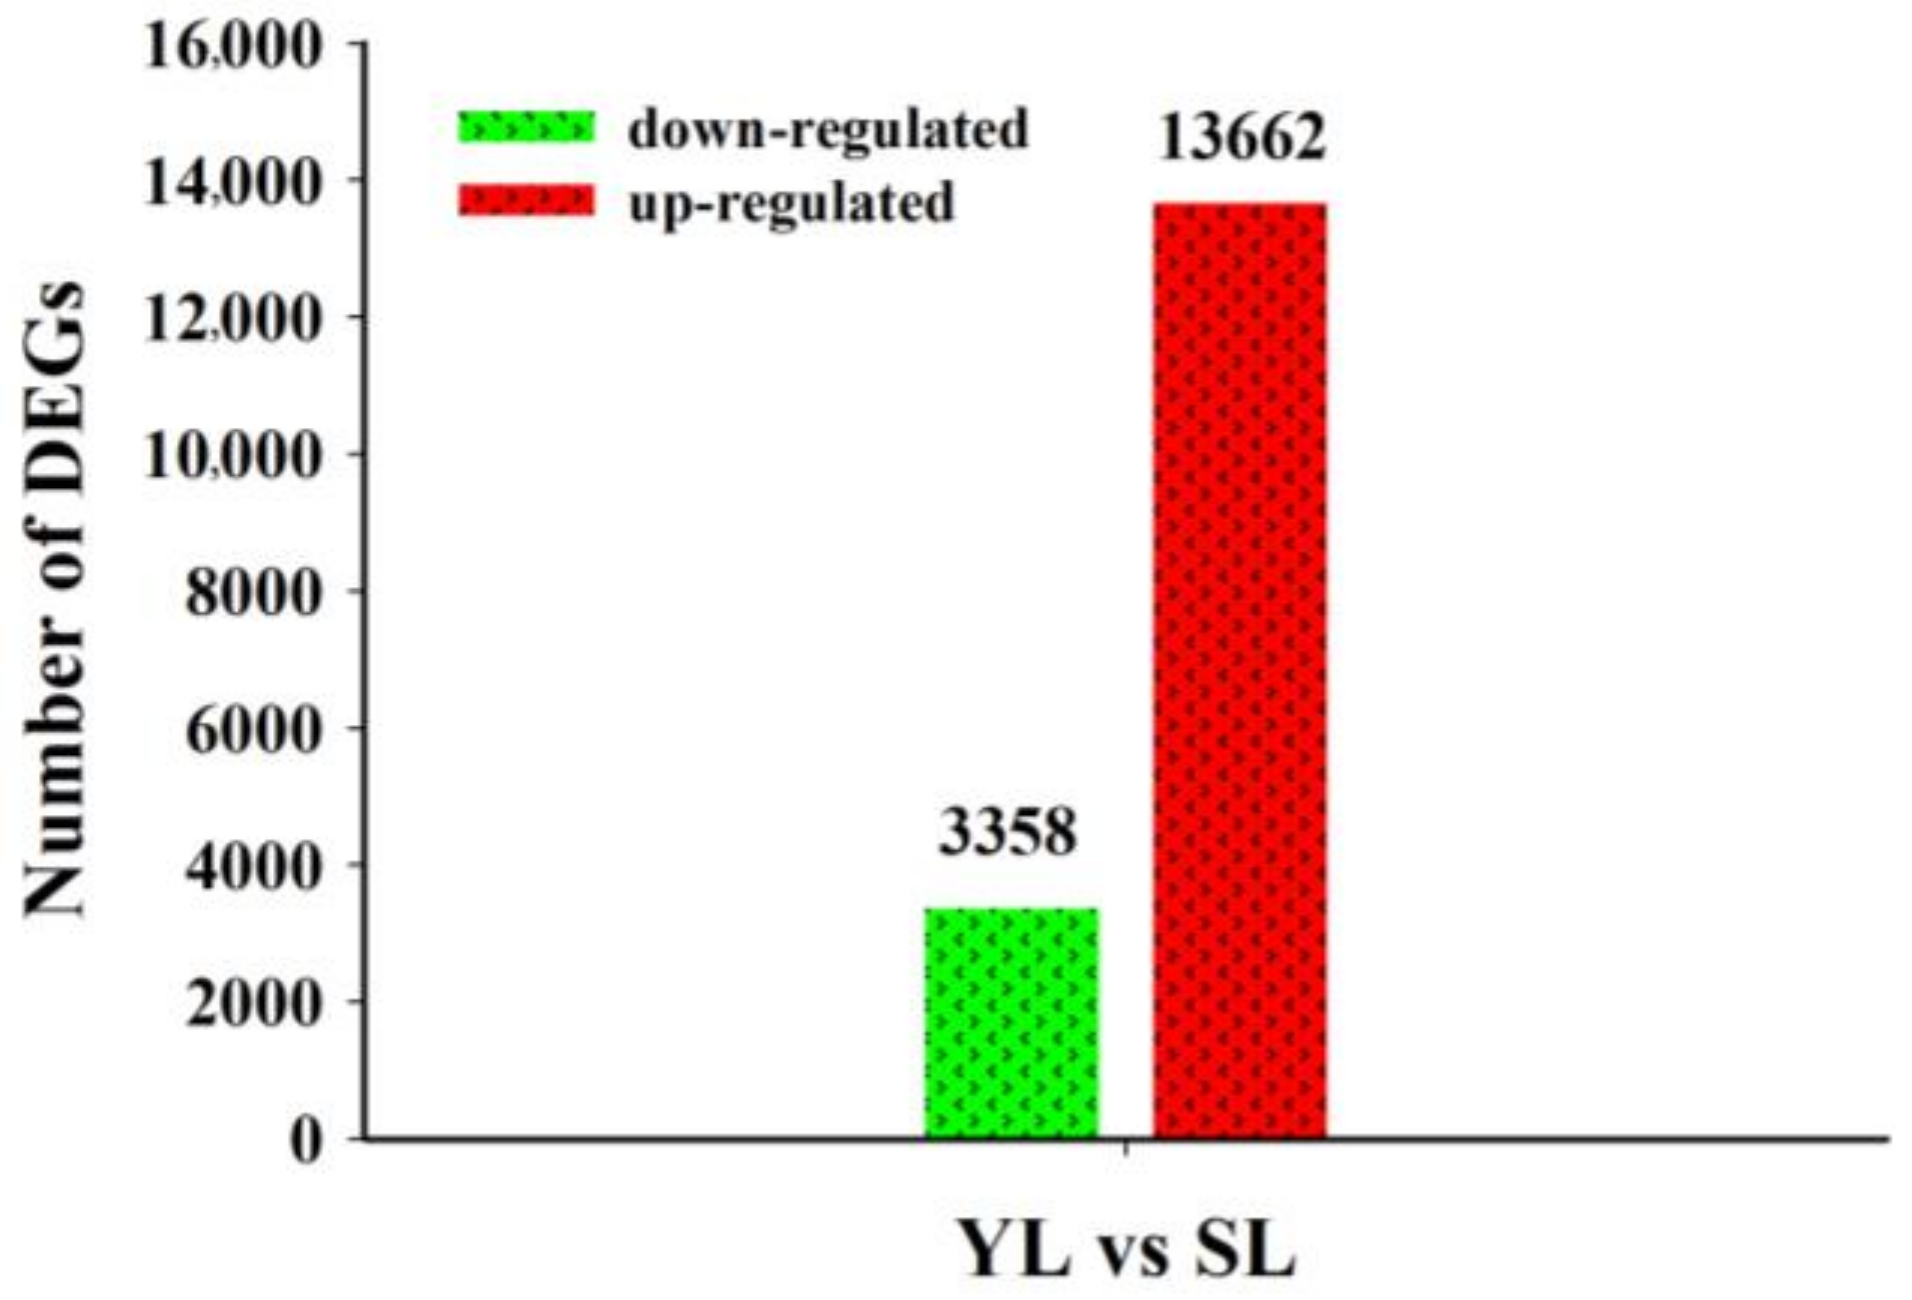
2.3. Differentially Expressed Unigenes (DEGs) in Senescing and Young Leaves

To improve the accuracy of the RNA-Seq data, two independent biological replicates were performed for each sample in this study. The Pearson and Spearman correlation coefficients were calculated to investigate the correlation of the gene expression data among the biological replicates and visualized with a color-coded diagram. The Pearson correlation coefficients were 0.99 and 0.83 between the two libraries of SL and YL, respectively. And the Spearman correlation coefficients were 0.79 and 0.95 (Figure S4A,B). These results indicate strong correlation between variables and reliability of the RNA-Seq data.
The DEGs between senescing leaves and young leaves were identified (Supplementary Table S3), and the distribution of log-fold changes was visualized in the volcano plot (Figure S4C). With respect to young leaves, a total of 17,020 unigenes were differentially expressed in senescing leaves, of which 13,662 unigenes were up-regulated and 3,358 unigenes were down-regulated (Figure 2).

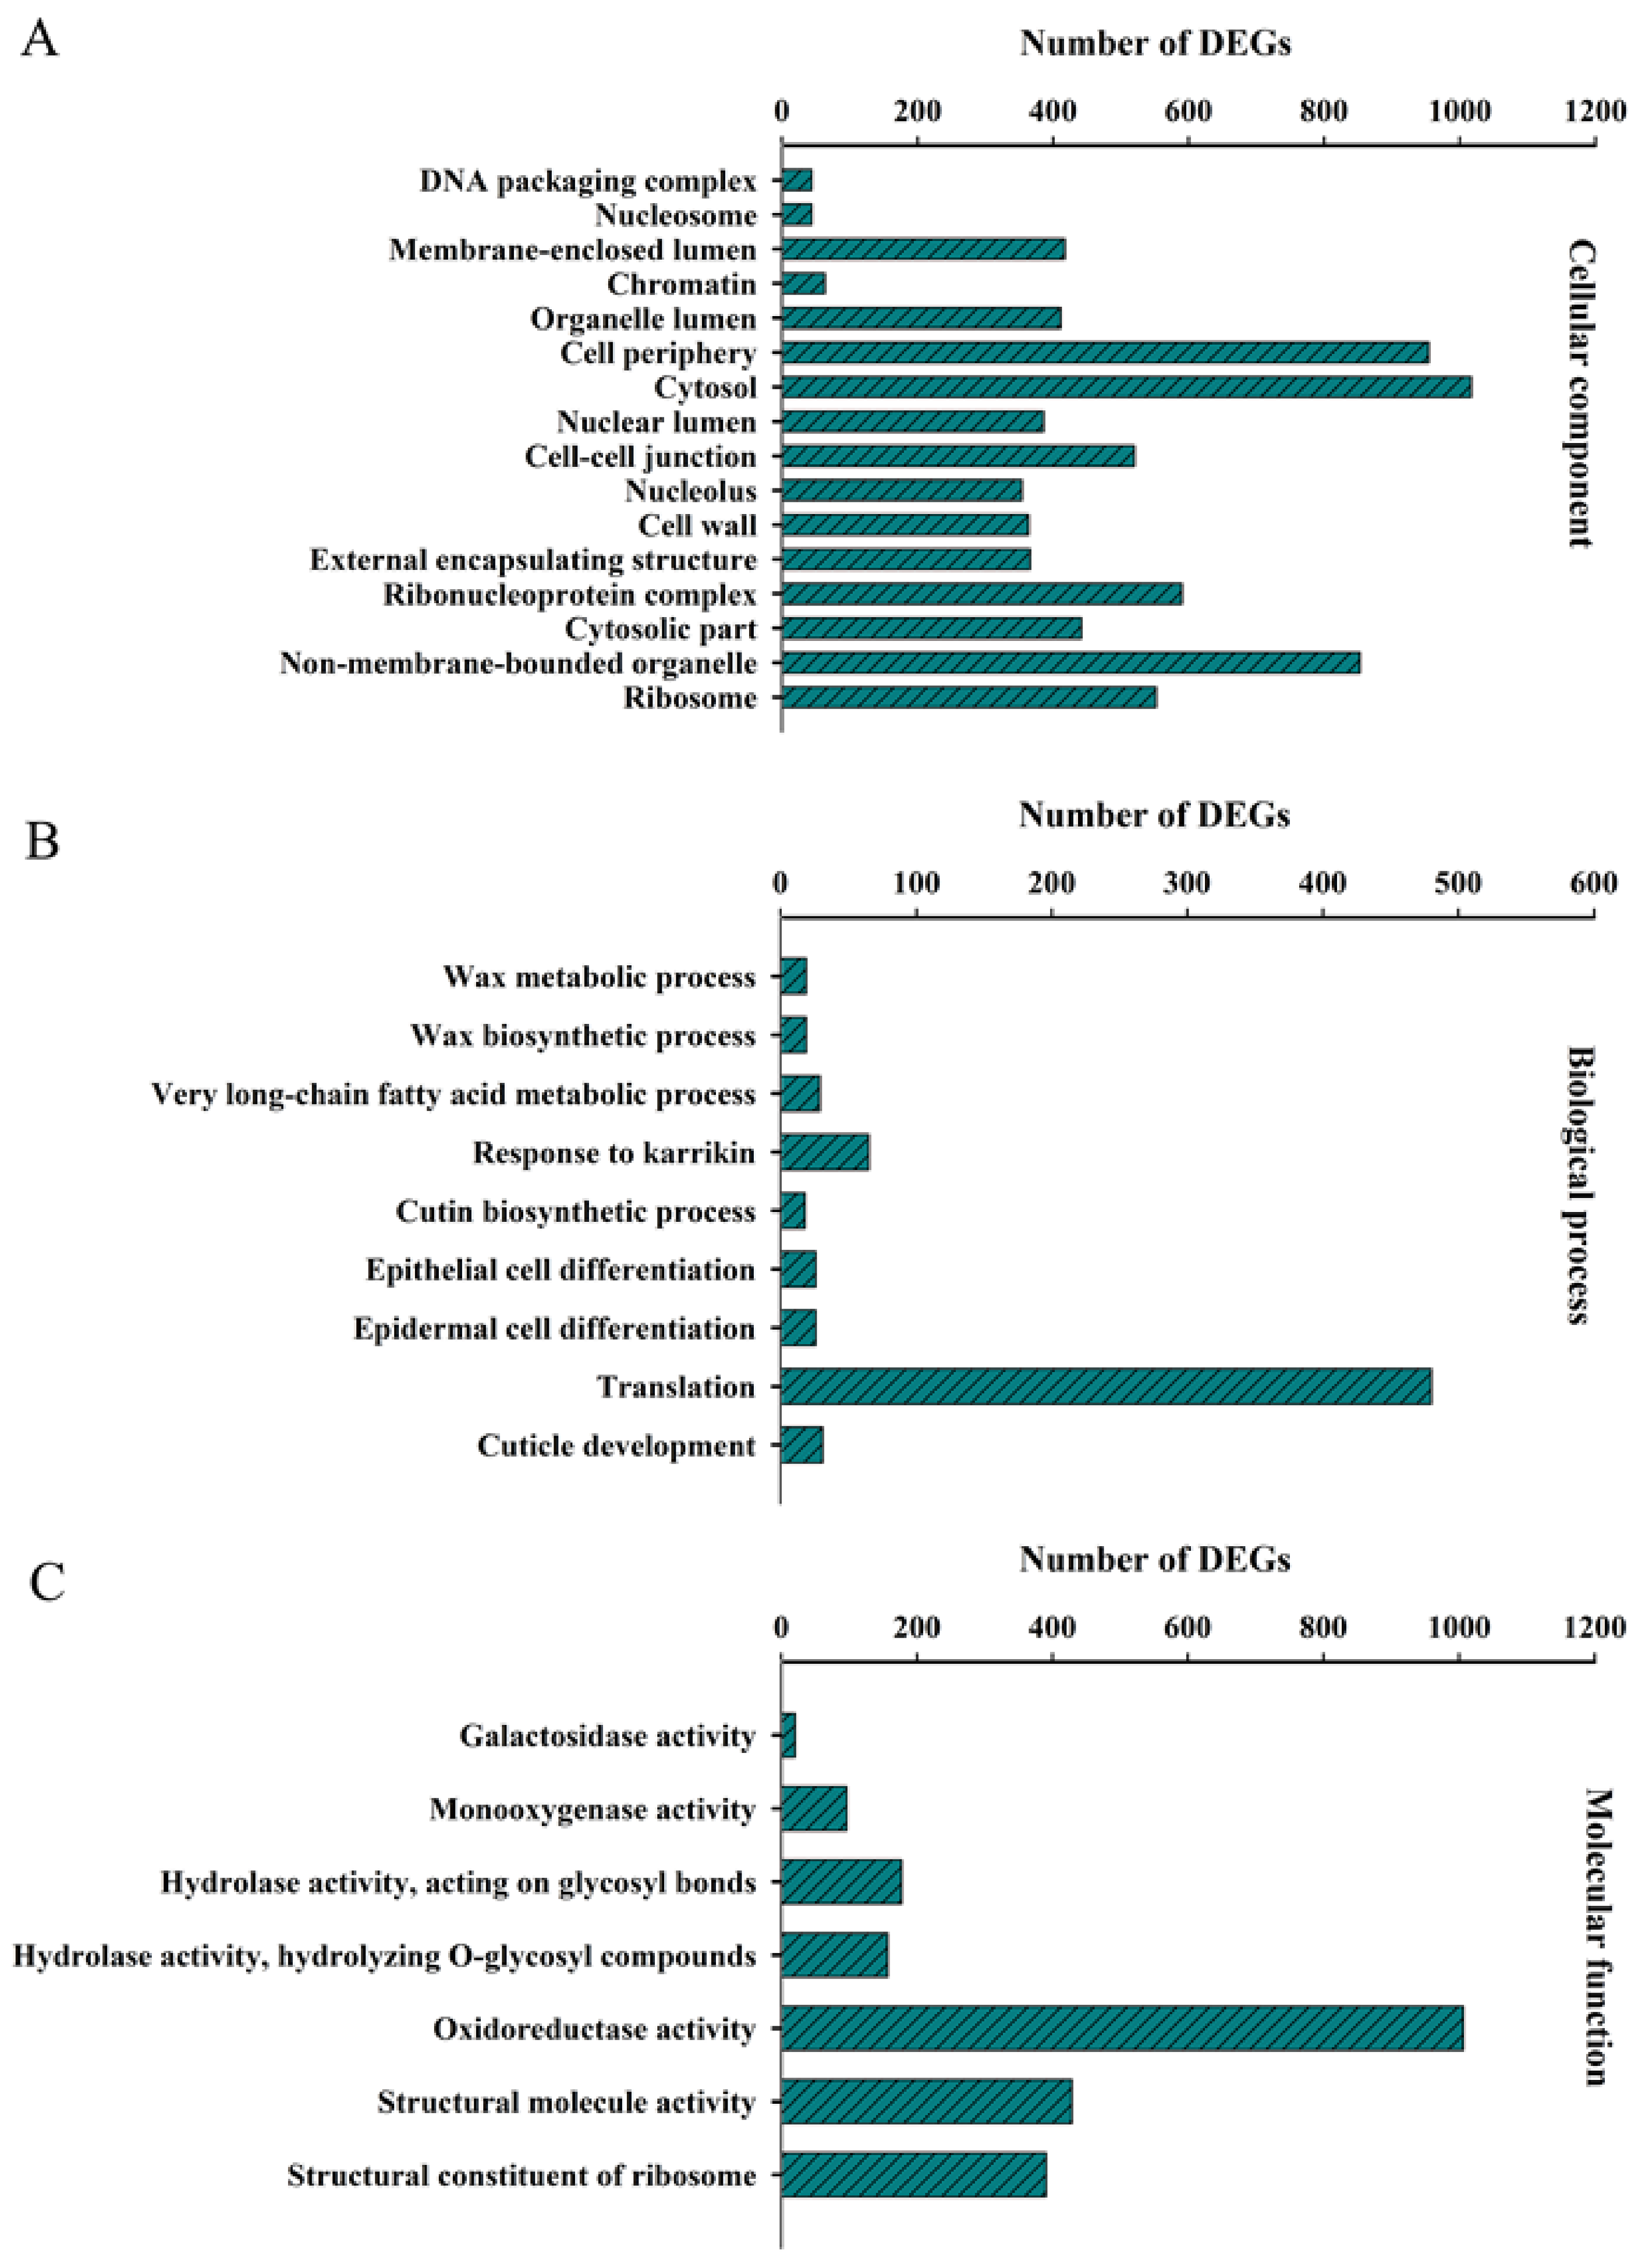
2.4. GO- and KEGG-Based Functional Classification of DEGs

To gain an insight into the functional characterization of DEGs, GO-based classification was performed by using the Blast2GO program v 3.0 [32]. Significantly enriched GO categories were identified (p < 0.05), 16 for cellular component (Figure 3A), 9 for biological process (Figure 3B), and 7 for molecular function (Figure 3C). Several biological processes, such as cuticle development, epidermal and epithelial cell differentiation, long-chain fatty acid metabolic process and wax biosynthetic process, were differentially regulated at various developmental stages of leaves (Figure 3B). Moreover, for the molecular function category, GO terms corresponding to oxidoreductase activity, hydrolase activity and monooxygenase activity were remarkably enriched (Figure 3C). This result indicates the potential roles of these GO terms in luteoloside biosynthesis.
To better understand the gene function, we assigned 10,216 of the DEGs to one of 128 KEGG terms by using the KEGG database. Significantly altered biological pathways were identified during leaf senescence (Q value ≤ 0.05). Several metabolic pathways, including biosynthesis of secondary metabolites, phenylpropanoid biosynthesis, lipid and fatty acid metabolism, starch and sucrose metabolism, tryptophan metabolism, cutin and wax biosynthesis, and flavone and flavonol biosynthesis displayed outstanding enrichments (Figure S5). This finding indicates a significant difference in primary and second metabolism between young and senescing leaves in L. macranthoides. A total of 339 and 67 DEGs were assigned to phenylpropanoid metabolic and flavone/flavonol biosynthetic pathways, respectively (Figure S5), by which generate precursors for luteoloside biosynthesis.

2.5. Identification of Candidate Genes Associated with Luteoloside Biosynthetic Pathways

To elucidate the key genes for luteoloside biosynthesis, DEGs involved in phenylpropanoid pathway were screened, including three PAL, one C4H, fourteen 4CL, eight CHS, two CHI, one FNS, eight F3′H and seven UFGT genes (Figure 4). PAL2 (Unigene109136), C4H2 (CL11118.Contig2) and the majority of 4CL genes (13 out of 14) were significantly upregulated in senescing leaves compared with young leaves. We also found that CHS2 (CL19869.Contig1), six F3′H (CL11828.Contig1, CL11828.Contig2, CL7653.Contig1, Unigene102655, Unigene65437 and Unigene76746), two UFGT (Unigene2918 and Unigene97915) genes displayed dramatic increases in transcript levels during leaf senescence. Meanwhile, CHI and FNS paralogous genes appeared remarkable down-regulation in senescing leaves, compared with those in young leaves (Table 2). The mRNA levels of ten unigenes possibly involved in luteoloside biosynthesis were validated by qRT-PCR, which displayed similar expression patterns to the results obtained by RNA-Seq (Figure 5A–J).These DEGs, especially those functioning downstream in the metabolic pathway, may provide valuable clues to illustrate the luteoloside biosynthetic pathway. The high expression levels of CHS2, F3′H and UFGT genes in senescing leaves were consistent with the large amounts of luteoloside, indicating their fundamental involvement in luteoloside biosynthesis.
To further characterize the molecular properties of the F3′H and UFGT genes, phylogenetic analyses of protein sequences were performed. Two F3′H genes, namely CL11828.Contig1 and CL11828.Contig2, were grouped into the same clade as the F3′H genes in Sesamum indicum, Solanum lycopersicum, Ziziphus jujube and Nicotiana tabacum and also shared high sequence homology to the F3′H genes in Arabidopsis lyrata and Oryza sativa. This result suggests the similar functions of these F3′H genes. However, the four remaining F3′H genes showed relatively lower levels of similarity to those genes in other species (Figure S6A). Two UFGTs were classified into the same subcluster with UDP-glucose flavonoid 3-O-glucosyltransferase (UF3GTs) in several species and also displayed amino acid sequence similarities with UF7GTs in Arabidopsis and Scutellaria (Figure S6B).

2.6. Identification of DEGs Involved in MYB, bHLH and WD40 Transcription Factors

MYB, bHLH, and WD40 have been previously identified to regulate flavonoids biosynthesis [30]. RNA-seq data showed that thirty MYB, thirty-one bHLH and eighty-six WD40 TFs in senescing leaves displayed differential expression with respect to young leaves (Table 3 and Supplementary Table S4). In contrast to young leaves, approximately half of the differentially expressed MYBs (16 out of 30) underwent significant down-regulation in senescing leaves, such as those orthologous to TT2, AtMYB12, PsMYB1, SlMYB46, VvMYB44, and VvMYB306. Meanwhile, the remaining differentially expressed MYBs, including those homologous to AtMYB48, VvMYB1R1, VvMYB75, AmMYB305, EsMYB13, and GhMYB9, showed dramatically increased transcripts in senescing leaves (Table 3). Moreover, out of the 30 bHLHs, 14 bHLHs, which include bHLH25, bHLH49, bHLH66, bHLH78, bHLH113, bHLH123 and bHLH143, were strongly up-regulated during leaf senescence (Table 3). In addition, among the DEGs involved in WD40 repeat-containing proteins, one transparent testa glabrous1 (TTG1) ortholog was remarkably upregulated in senescing leaves compared with that in young leaves (Supplementary Table S4). This gene contained five WD repeats and showed 37% amino acid identity with TTG1 in Arabidopsis (XP_020877597), 38% identity with TTG in Medicago (XP_003624554) and 37% identity with TTG1 in Malus (AHM88209). QRT-PCR analysis also showed that the transcripts of several unigenes, including those homologous to MYB, bHLH and TTG1, were in dramatic regulation during leaf senescence (Figure 6A–I).

3. Discussion

Luteoloside belongs to a group of natural flavonoids isolated from Lonicera, that exerts human health benefits, including antiallergic, free radical scavenging and antioxidant, antihyperglycemic and anticholestatic activities [9]. Luteoloside accumulation is a precisely regulated process that varies considerably depending on plant species, developmental stages and different tissues. To date, fingerprint analysis of luteoloside has been carried out in Lonicera. The amounts of luteoloside are remarkably lower in flower buds of L. hypoglauca than inthose of L. japonica, whereas no obvious change is observed between the flower buds of L. japonica and L. macranthoides [8]. However, according to the description in the Chinese pharmacopoeia 2010 and the view reported by Wu et al. [7], luteolin and luteoloside are in lower abundance in flower buds of L. macranthoides than in those of L. japonica [33]. In the present study, luteoloside accumulation initially increased from stage 2 to stage 4 and then decreased in stage 5 during flower development in L. macranthoides (Figure 1F), which is in accordance with the results of previous reports in L. japonica [1,7]. Moreover, in contrast to the findings of Yuan et al. in L. japonica [8], our results revealed that luteoloside displayed significantly higher level in flowers than that in stems and leaves at different growth stages except for senescing leaves (Figure 1). In general, luteoloside is relatively low in L. macranthoides (only 0.01 to 0.2 mg/g). Our study demonstrated that luteoloside was accumulated at extremely higher level in senescing leaves of L. macranthoides (Figure 1B). This finding provides us with the view of significant medical value of the senescing leaves and new insights into the molecular basis underlying luteoloside biosynthesis.

3.1. Molecular Features Underlying Abundant Accumulation of Luteoloside during Leaf Senescence in L. macranthoides

Transcriptome analysis in leaves at different developmental stages was aimed at elucidating molecular mechanism underlying high accumulation of luteoloside in senescing leaves of L. macranthoides. Several genes encoding PAL, C4H and 4CL displayed higher transcript levels in senescing leaves (Figure 4), which might contribute to luteoloside accumulation and thus were considered to be critical members associated with luteoloside generation. These findings are in accordance with the previous observations that the activities and expressions of PAL, C4H and 4CL positively correlate with luteoloside biosynthesis [1,8]. However, the three enzymes are located upstream of the luteoloside metabolic pathway and as common enzymes regulating biosynthesis of various secondary metabolites, such as lignin [34] and flavonoids [35]. Therefore, other genes enabling irreversible commitments to luteoloside biosynthetic pathways need to be further investigated. LjCHS1 and LjCHI2 were proposed to be the important genes participating in luteolin biosynthesis [8], whereas the transcripts of two CHI genes exhibited negative correlation with luteoloside levels in our study (Figure 4), suggesting that the regulation of luteoloside accumulation differs among plant species.
Three enzymes including F3′H, FNS and UFGT, are proved to play crucial roles in luteoloside metabolic pathway [7,10,14,36]. In the present study, the enhanced expression of two F3′H homologs (CL11828.Contig1 and CL11828.Contig2) coincided precisely with the high level of luteoloside in senescing leaves (Table 2), indicating that they are potential candidates modulating the biosynthesis of luteolin and luteoloside. CYP75B3, a F3′H gene in Oryza sativa, exhibits similar preference for naringenin and apigenin, in nearly catalytic efficiencies for these substrates [36]. The two F3′H genes showed close homology with CYP75B3 (Figure S6A), suggesting that these genes were not altered to exhibit flavonoid-3-hydroxylation activity and might facilitate the biosynthesis of eriodictyol or luteolin from naringenin or apigenin, respectively. FNS is considered as the critical enzyme in the two routes of luteoloside metabolic pathway (Figure 4), which is implied by the accumulation of luteolin-7-O-glucoside (luteoloside) and apigenin-7-O-glucoside in FNSII-overexpression transgenic lines in Lonicera [7]. Wu et al. [7] also demonstrated that FNSII in L. japonica (LjFNSII-1.1) exhibits an apparently higher catalytic activity (approximate 4-fold) than that in L. macranthoides (LmFNSII-1.1). They concluded that the less abundance of flavones in flowers of L. macranthoides compared with that in L. japonica might be attributed to the weak catalytic efficiency of LmFNSII. However, in our dataset, a FNSII gene (Unigene2335) exhibiting 99% identity with LmFNSII-1.1 (deletion of a leucine at position 22 in LmFNSII-1.1) displayed lower transcript abundance in senescing leaves than in young leaves (Table 2). Thus, it seems not to be responsible for luteoloside generation. In addition, high levels of luteoloside in senescing leaves might result from the highly-expressed UFGTs (Unigene2918 and Unigene97915), homologs of AtUF7GT and SbUF7GT (Figure S6B), which can maximize the luteolin conversion. Hence, the extremely higher amounts of luteoloside in senescing leaves might be attributed to significantly higher transcript levels of F3′H in senescing leaves compared to that in young leaves. The increase in F3′H expression might provide sufficient eriodictyol to FNSII, and then large amounts of luteolin would accumulatedue to the relatively high background expression of FNSII (Table 2). Given that the FNSII enzymes prefer eriodictyol as a substrate over naringenin in Lonicera [7], the role of FNSII in luteolin generation from the other routes (naringenin-apigenin-luteolin) could be neglected. On the basis of our results and the findings in the literature described above, we hypothesized that luteoloside is preferentially biosynthesized via the following alternative route: naringenin is hydroxylated by F3′H (CL11828.Contig1 and CL11828.Contig2) to produce eriodictyol and then FNSII converts eriodictyol to luteolin, which can be metabolized to luteoloside via UFGTs. Therefore, although the transcript levels of FNSII in young leaves were approximately 7-fold higher than that in senescing leaves (Table 2), lower levels of luteoloside accumulation were observed due to the lower expressions of F3′Hs in young leaves than that in senescing leaves (Figure 1B).

3.2. Transcription Factors as Potential Regulators of Luteoloside Accumulation in Leaves of L. macranthoides

Flavonoid biosynthesis is transcriptionally regulated by a multitude of transcription factors, of which R2R3-MYB, bHLH and WD40 repeat proteins are proven to be vital [37]. Numerous studies have demonstrated that MYB12/11/111 can modulate flavonol synthesis by activating the early biosynthetic genes including PAL, C4H, CHS, CHI and F3′H [16,17,38,39,40,41]. A recent study in E. sagittatum showed that EsMYBF1, a homolog of AtMYB12 and VvMYBF1, functions as an activator regulating the flavonol synthesis. Ectopic expression of EsMYBF1 resulted in the enhanced accumulation of kaempferol and quercetin via upregulating the expression of CHS, CHI, F3H and FLS genes but a decline in the content of anthocyanin via downregulating the transcripts of DFR and ANS genes, suggesting that EsMYBF1 is a flavonol-specific regulator [18]. Moreover, our results indicated that two putative MYB12 genes in L. macranthoides (Unigene36582 and Unigene52460), which are homologs of AtMYB12, were more abundantly expressed in young leaves (Table 3), in which the phenylpropanoid products, chlorogenic acid and rutin, were largely accumulated (unpublished data) but extremely low content of luteoloside was observed (Figure 1B). These findings suggest that the two MYB12 homologs might regulate the phenylpropanoid and flavonoid biosynthetic pathways in L. macranthoides. The disparate accumulation patterns of the related main metabolites and derivatives upon both up- and down-regulation of MYB12 might be preferentially ascribed to a flux shift in the metabolic pathway rather than a direct outcome of transcriptional activation or repression in leaves, which is manifested by the reports that overexpression of AtMYB12 in tomato activates the caffeoylquinic acid biosynthetic pathway, while down-regulation of SlMYB12 also leads to the accumulation of caffeic acid derivatives [42]. Moreover, several novel MYBs were observed to correlate with the accumulation pattern of luteoloside during leaf senescence, in particular the positive-correlated genes, such as those homologs to AtMYB48, VvMYB1R1, VvMYB75, AmMYB305, EsMYB13 and GhMYB9 (Table 3), indicating their involvement in the regulation of luteoloside biosynthesis in L. macranthoides leaves.
bHLH, the key component involved in the regulation of flavonoid biosynthesis, was observed to activate late biosynthetic genes (i.e., F3′H, ANR, DFR, and UFGT) through formation of highly dynamic MYB/bHLH/WD40 (MBW) complexes [43,44,45]. In Arabidopsis, three bHLH activators including TRANSPARENT TESTA 8(TT8), enhancer of glabra3 (EGL3), glabra3 (GL3), were reported to act in the transcriptional regulation of anthocyanin and proanthocyanidins (PAs) production via interacting directly or indirectly with Mybs [30,46]. Other bHLH proteins, such as MdbHLH3 in apple and BobHLH1 in cauliflower, interact with MdMYB10 and BoMYB2 respectively, were observed to confer anthocyanin accumulation [21,47]. In the current study, a subset of bHLHs, such as two AtbHLH113 homologs (CL3655.Contig4 and Unigene11884) and four AtbHLH78 homologs, displayed higher mRNA levels in senescing leaves than that in young leaves, which is positively correlated with the accumulation of luteoloside, suggesting their involvements in the regulation of luteoloside generation. This result is in accordance with the findings in Arabidopsis that AtbHLH113 is predicted to interact with PAP1/MYB75 modulating anthocyanin biosynthesis [48].
WD40 repeat protein is another pivotal factor of MBW complexes [46]. In this study, a TTG1 ortholog (Unigene108470) (Supplementary Table S4) in L. macranthoides was isolated and displayed a positive correlation with luteoloside production. In terms of the roles of TTG1 in regulating flavonoid biosynthesis, we considered that Unigene108470 might be the candidate factor in controlling luteoloside biosynthesis. The transcription factors, particularly R2R3 MYB TFs, may activate distinct sets of structural genes of flavonoid biosynthesis [49]. In our dataset, several novel candidate genes participating in the transcriptional regulation of flavonoids biosynthesis in L. macranthoides were identified. Further work will be required to determine whether these genes significantly induce or limit luteoloside biosynthesis in plants and if so, their molecular mechanisms have to be explored via genetic and biochemical approaches in vitro and in vivo.

4. Materials and Methods

4.1. Plant Materials

Lonicera macranthoides Hand-Mazz (cv. Yu Lei 1#) used in the experiments was planted in a greenhouse of Chongqing University of Arts and Sciences (Chongqing, China). Plant tissues including leaves, stems and flowers at different developmental stages were collected from 5-year-old seedlings. Leaves and stems at three developmental stages including young leaves and stems, semi-lignified leaves and stems, senescing leaves and stems were obtained and illustrated in Figure 1A, and C. Flowers at five developmental stages were harvest in June. These stages are illustrated in Figure 1E. Stage 1 and stage 2 flowers are defined by green flower buds with length of 10 mm and 20–30 mm, respectively. Stage 3flowers are defined by white flower buds with length of 30–40 mm, while stage 4 and stage 5 flowers are defined by white flowers and yellow flowers, respectively. All the samples used for HPLC and RNA-Seq analysis were collected from 18 individual plants and tissues from 6 plants were pooled and set as one replicate. Three biological replicates were performed in each experiment (approximately 25 leaves, 25 stems, and 40 flowers in each replicate). All collected samples were placed in 50mL Falcon tubes, frozen in liquid nitrogen and then stored at −80 °C until further use.

4.2. Determination of Luteoloside Contents by High Performance Liquid Chromatography (HPLC)

Tissue samples were subjected to lyophilization and homogenization with a grinding miller. The powder was then passed through a 40-mesh (420 μm) standard sieve before extraction. A total of 0.25 g homogenized samples was extracted with 20 mL of ethanol (70%, v/v) by ultrasonication for 30 min. The extracts were cooled to room temperature and centrifuged at 4000 rpm for 10 min. Afterward, the supernatant was filtered through a 0.22 µM microfiltration membrane for luteoloside analysis by HPLC.
HPLC was performed on a Shimadzu LC-20A HPLC analyzer (Shimadzu Corporation, Kyoto, Japan), equipped with a LC-20AT pump, a SIL-20A auto sampler, a CBM-20A system controller, a SPD-M20A diode array detector (DAD)and a CTO-20A column oven. Separation was carried out on a Shimadzu Shim-Pack VP-ODS C18 column (5 μm, 250 × 4.6 mm) using gradient elution. Mobile phase A was 2% formic acid in deionized water, while phase B was 2% formic acid in methanol (80:20, v/v). A 15% B linear gradient was conducted from 0.01 min to 8.00 min, followed by a 15~50% B linear gradient from 8.01 min to 25.00 min, and finally a 50% B linear gradient from 25.01 min to 40.00 min, at a flow rate of 0.7 mL/min. The column and the detector were operated at 35 °C. A volume of 20 μL supernatant was injected and the detection wavelength was monitored at 360 nm. Luteoloside standard (>98%) was purchased from SIGMA (Sigma-Aldrich, St. Louis, MO, USA). The luteoloside contents were analyzed in triplicate and calculated based on peak area measurements. Statistical significance was performed with SPSS using Duncan’s new multiple range test.

4.3. RNA Extraction and Illumina Sequencing

Total RNA from young and senescing leaves was isolated and purified using QIAGEN RNeasy Plant Mini kit and RNase-free DNase set (QIAGEN, Hilden, Germany) according to manufacturer’s instruction. RNA-Seq was performed at Hangzhou 1GENE Technology Co., Ltd. (Hangzhou, China). Illumina TruSeq™ RNA Sample Prep Kit (Cat# RS-122-2001) (Illumina, San Diego, CA, USA) was employed to construct cDNA library according to the manufacturer’s protocol. Briefly, Poly(A) mRNA was enriched from 5 µg total RNA using oligo (dT) magnetic beads and fragmented in a thermomixer. The short fragments were used as templates to synthesize first- and second-strand cDNAs. Afterward, cDNA was end-repaired, A-tailed and ligated with Illumina-specific adaptors. Finally, the fragments were size selected and PCR amplified to generate the cDNA library. RNA-sequencing was performed using the Illumina HiSeq™ 2000 platform. Each sample was analyzed in two biological replicates in this RNA-Seq experiment.

4.4. De Novo Transcriptome Assembly and Functional Annotation

The raw reads were filtered by removing adaptors and low-quality reads. After that, the clean reads were generated. Trinity (version 2.0.6) (http://trinityrnaseq.github.io/) and TGICL software (version r2013-04-11) (https://sourceforge.net/projects/tgicl/) were employed to assemble our clean data. The clean reads from the SL and YL libraries were first processed independently. To obtain complete reference sequences, the clean reads from all the samples were mixed and assembled again. To assess the quality of de novo assembly, the length distribution of assembled contigs and unigenes were collected. To obtain functional annotation of a given unigene, the sequence was aligned against protein sequence database entries including those in the Nr, Swiss-Prot, KEGGand COG databases using BLASTx (E-value < 0.00001). The unigenes were also aligned against the Nt database using BLASTn and we declared sequences similar if the corresponding E-value for the alignment was less than 10−5.

4.5. Screening of Differentially Expressed Unigenes

Gene expression was calculated using the number of reads aligned to a single gene and the total number of reads aligned to reference sequences in the reads per kb per million reads (RPKM) method [50]. R package DEGseq was employed to identify DEGs with random sampling model [51]. A p-value can denote its expression difference between the two libraries, while false discovery rates (FDRs) were used to determine the threshold of p value. We set “FDR < 0.001 and the absolute value of log2Ratio > 1” as the threshold to judge the significance of gene expression difference according to described method in the literature [52].

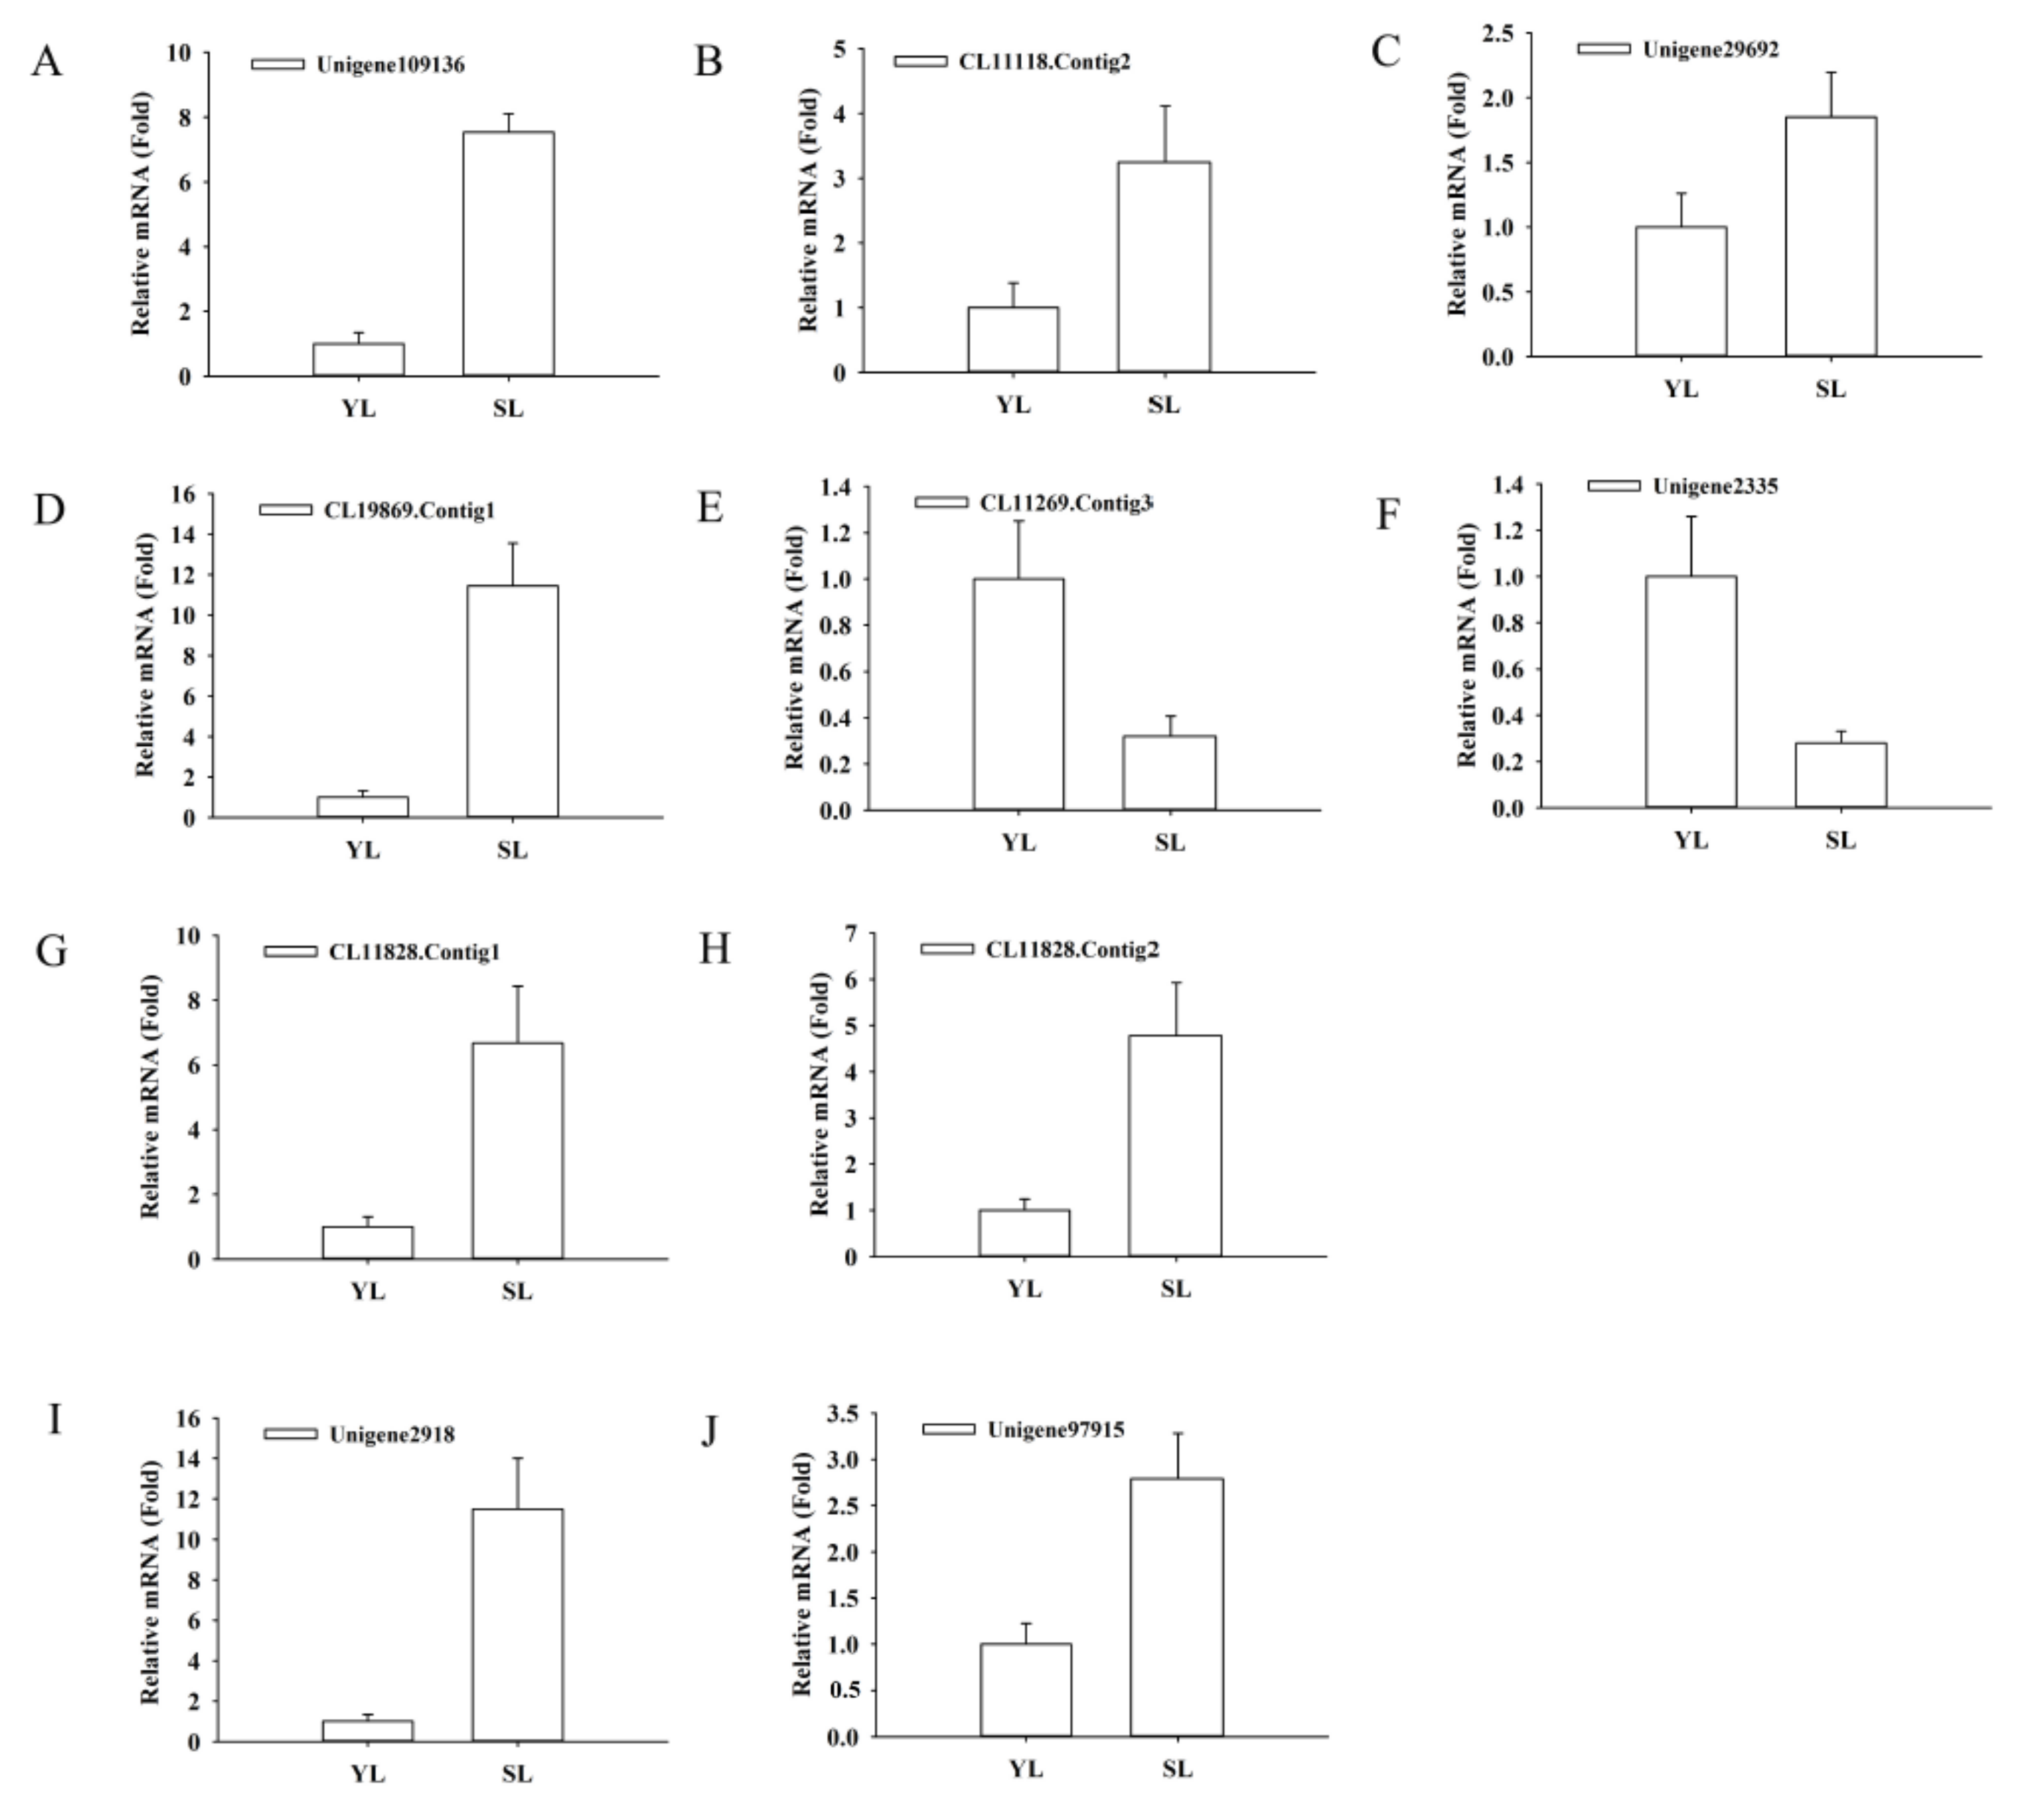
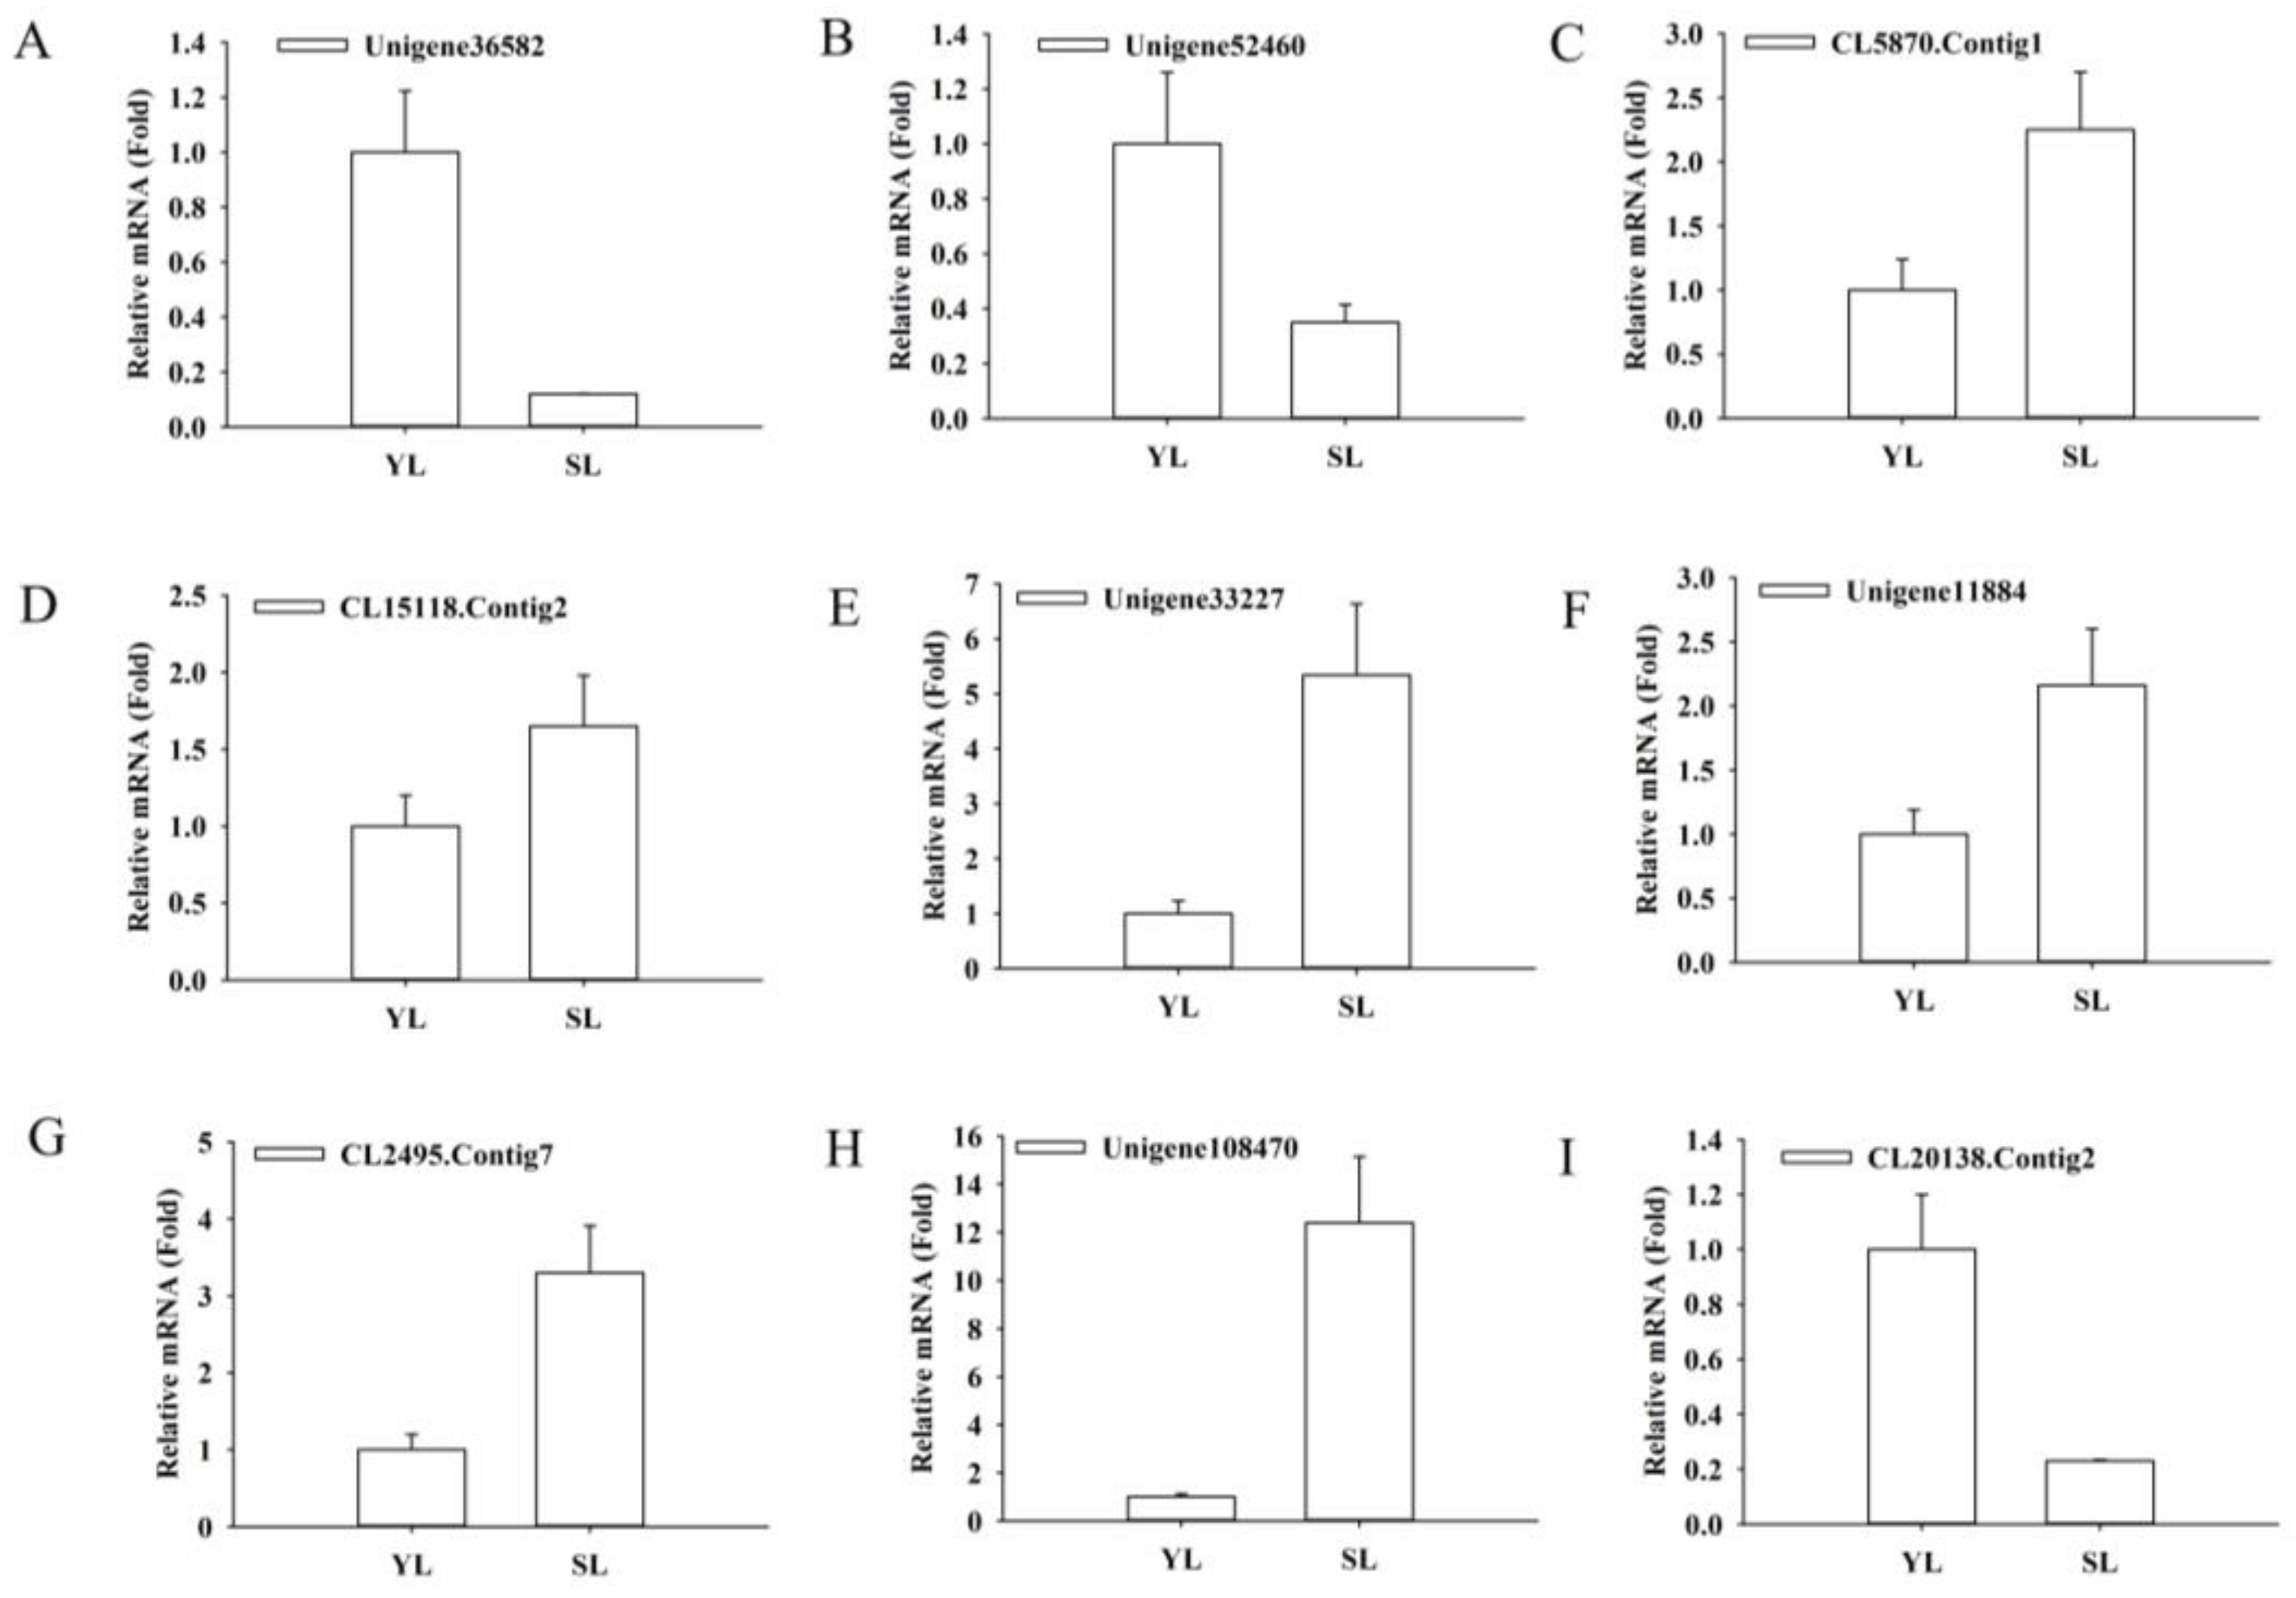
4.6. Validation of RNA-Seq Data by Quantitative Real-Time PCR (qRT-PCR)

To validate the accuracy of the gene expression levels of DEGs obtained from the RNA-Seq analysis, 19 genes possibly associated with luteoloside synthesis were randomly selected and subjected to qPCR detection. Gene-specific primers for the selected genes were designed using an online primer design software (https://www.genscript.com/ssl-bin/app/primer) (Supplementary Table S5) and a melting curve analysis was used to confirm specificity. qRT-PCR was performed using a Fast SYBR Mixture (CWBIO, Beijing, China) on a Bio-Rad CFX connect real-time PCR detection system using of 95 °C incubation for 10 min, then 40 cycles of 95 °C for 15 s and 60 °C for 60 s. For all qPCR experiments, three biological replicates were performed. Relative expression levels were calculated based on the 2−ΔΔCt method using tubulin as a reference gene.

4.7. Sequence Deposition

The raw transcriptome reads reported here have been deposited in the NCBI Short Read Archive under the Accession Nos. SAMN08289417 (SL1), SAMN08289418 (SL2), SAMN08289419 (YL1), and SAMN08289420 (YL2).

5. Conclusions

In this study, we demonstrated senescing leaves in L. macranthoides can accumulate very large amounts of luteoloside, which was extremely higher than those in other leaf samples and organs including stems and flowers. Transcriptome analysis of senescing leaves and young leaves screened a subset of candidate genes associated with luteoloside biosynthesis. The elevated mRNA levels of twenty-four unigenes including PAL2, C4H2, thirteen 4CLs, CHS2, six F3′Hs and two UFGTs were considered to contribute to luteoloside accumulation in senescing leaves with respect to young leaves. Thus, we hypothesized that luteoloside may be preferentially biosynthesized using the following route: naringenin-eriodictyol-luteolin. Furthermore, several unigenes encoding MYB, bHLH and WD40 TFs, such as MYB12, MYB75, bHLH113 and TTG1, involved in flavonoid biosynthesis, were coexpressed with luteoloside biosynthetic unigenes in our dataset. Their roles in regulating luteoloside biosynthesis in L. macranthoides will be characterized via genetic and biochemical approaches in vitro and in vivo in our future work.

Supplementary Materials

Supplementary materials can be found at https://www.mdpi.com/1422-0067/19/4/1012/s1. Table S1. Overview of RNA-Seq data; Table S2. Statistical results for functional annotation of transcriptome in Lonicera macranthoides; Table S3. Differentially expressed genes (DEGs) identified by transcriptomic approach during leaf senescence in Lonicera macranthoides; Table S4. DEGs involved in WD40 transcription factors during leaf senescence in Lonicera macranthoides; Table S5. Primer sequences used for qRT-PCR. Figure S1. HPLC chromatogram of luteoloside with detection at 360 nm; Figure S2. Length distribution of All-Unigene sequence; Figure S3. Statistical analysis results of unigene sequences against the NCBI non-redundant protein (Nr) database; Figure S4. The Pearson and Spearman correlation coefficients of gene expression data between the biological replicates. Figure S5. Identification of significantly altered KEGG pathways during leaf senescence in Lonicera macranthoides. The left Y-axis indicates the top 20 enrichment KEGG pathways between young and senescing leaves. The different dot sizes indicate the number of DEGs corresponding to each KEGG pathway; Figure S6. Phylogenetic analysis of putative F3′Hs and UFGTs in Lonicera macranthoides. The phylogenetic tree was constructed using MEGA software (version 5.1) based on Neighbor-Joining method. Values above the branches are bootstrap percentages (1000 replicates). (A). F3H Gene/Protein ID was as follows. Nicotiana tabacum F3H, XP_016434126.1; Sesamum indicum F3H, XP_011095827.1; Solanum tuberosum cytochrome P450 71A1-like, XP_006363444.1; Solanum tuberosum F3H, XP_006355423.1; Ziziphus jujuba F3H, XP_015889029.1; Solanum lycopersicum F3H, XP_004250647.1; Nicotiana tabacum CYP92B2v3, ABC69387.1; Arabidopsis lyrata subsp. lyrata F3H, XP_020878236.1; Arabidopsis thaliana CYP71B37, OAP05943.1; Arabidopsis thaliana CYP78A10, OAP13456.1; Oryza sativa F3H, CYP75B3(Park et al.,2016). (B). UFGT Gene/Protein ID was as follows. Prunus mume UGT71A16, XP_008229642.1; Fragaria vesca UF3GT6, XP_004303955.1; Panax ginseng UGTpg19, AKA44592.1; Panax ginseng UGTPg42, AKA44601.1; Catharanthus roseus UGT, BAD29721.1; Eucommia ulmoides glucosyltransferase, AHX74090.1; Solanum pennellii UA3GT2, XP_015081102.1; Arabidopsis thaliana F7GT, AAL90934.1; Scutellaria baicalensis UF7GT, BAA83484.1; Nicotiana tabacum UGT71E, XP_016498099.1; Ziziphus jujube UA3GT2, XP_015880714.1; Solanum lycopersicum UF3GT6, XP_004243651.1; Nicotiana tomentosiformis UF3GT6, XP_009587669.1; Citrus sinensis UA3GT2, XP_006481379.1; Capsicum annuum UF3GT6, XP_016547987.1; Arabidopsis thaliana F3G7GT, Q9ZQ95.1; Arabidopsis thaliana F5GT, AAM91686.1; Glycyrrhiza echinata IF7GT, BAC78438.1. The putative F3H and UFGT proteins were labeled in black dots.

Acknowledgments

This work was supported by the National Natural Science Foundation of China (31770338) and The Chongqing Natural Science Foundation (cstc2017jcyjBX0026).

Author Contributions

Zexiong Chen, Ning Tang and Zhengguo Li designed this work. Zexiong Chen, Ning Tang and Guohua Liu performed the experiment. Zexiong Chen prepared the original draft the manuscript. Ning Tang and Zhengguo Li revised the manuscript. All authors read and approved the final manuscript.

Conflicts of Interest

The authors declare no conflict of interest. The funding sponsors had no role in the design of the study; in the collection, analyses, or interpretation of data; in the writing of the manuscript; and in the decision to publish the results.

References

  1. Kong, D.-X.; Li, Y.-Q.; Bai, M.; He, H.-J.; Liang, G.-X.; Wu, H. Correlation between the dynamic accumulation of the main effective components and their associated regulatory enzyme activities at different growth stages in Lonicera japonica Thunb. Ind. Crops Prod. 2017, 96, 16–22. [Google Scholar] [CrossRef]
  2. Chen, Z.; Liu, G.; Liu, Y.; Xian, Z.; Tang, N. Overexpression of the LmHQT1 gene increases chlorogenic acid production in Lonicera macranthoides Hand-Mazz. Acta Physiol. Plant. 2017, 39, 27. [Google Scholar] [CrossRef]
  3. Chen, J.; Song, Y.; Li, P. Capillary high-performance liquid chromatography with mass spectrometry for simultaneous determination of major flavonoids, iridoid glucosides and saponins in Flos Lonicerae. J. Chromatogr. A 2007, 1157, 217–226. [Google Scholar] [CrossRef] [PubMed]
  4. Chen, J.; Li, S.L.; Li, P.; Song, Y.; Chai, X.Y.; Ma, D.Y. Qualitative and quantitative analysis of active flavonoids in Flos Lonicerae by capillary zone electrophoresis coupled with solid-phase extraction. J. Sep. Sci. 2005, 28, 365–372. [Google Scholar] [CrossRef] [PubMed]
  5. Shang, X.; Pan, H.; Li, M.; Miao, X.; Ding, H. Lonicera japonica Thunb.: Ethnopharmacology, phytochemistry and pharmacology of an important traditional Chinese medicine. J. Ethnopharmacol. 2011, 138, 1–21. [Google Scholar] [CrossRef] [PubMed]
  6. Wang, J.; Zhao, X.Z.; Qi, Q.; Tao, L.; Zhao, Q.; Mu, R.; Gu, H.Y.; Wang, M.; Feng, X.; Guo, Q.L. Macranthoside B, a hederagenin saponin extracted from Lonicera macranthoides and its anti-tumor activities in vitro and in vivo. Food Chem. Toxicol. 2009, 47, 1716–1721. [Google Scholar] [CrossRef] [PubMed]
  7. Wu, J.; Wang, X.-C.; Liu, Y.; Du, H.; Shu, Q.-Y.; Su, S.; Wang, L.-J.; Li, S.-S.; Wang, L.-S. Flavone synthases from Lonicera japonica and L. macranthoides reveal differential flavone accumulation. Sci. Rep. 2016, 6, 19245. [Google Scholar] [CrossRef] [PubMed]
  8. Yuan, Y.; Wang, Z.Y.; Jiang, C.; Wang, X.M.; Huang, L.Q. Exploiting genes and functional diversity of chlorogenic acid and luteolin biosyntheses in Lonicera japonica and their substitutes. Gene 2014, 534, 408–416. [Google Scholar] [CrossRef] [PubMed]
  9. Qiu, F.; Li, Z.; He, L.; Wang, D. HPLC-ESI-MS/MS analysis and pharmacokinetics of luteoloside, a potential anticarcinogenic component isolated from Lonicera japonica, in beagle dogs. Biomed. Chromatogr. 2013, 27, 311–317. [Google Scholar] [CrossRef] [PubMed]
  10. He, L.; Xu, X.; Li, Y.; Li, C.; Zhu, Y.; Yan, H.; Sun, Z.; Sun, C.; Song, J.; Bi, Y.A.; et al. Transcriptome Analysis of Buds and Leaves Using 454 Pyrosequencing to Discover Genes Associated with the Biosynthesis of Active Ingredients in Lonicera japonica Thunb. PLoS ONE 2013, 8, e62922. [Google Scholar] [CrossRef] [PubMed]
  11. Chen, Z.; Tang, N.; You, Y.; Lan, J.; Liu, Y.; Li, Z. Transcriptome Analysis Reveals the Mechanism Underlying the Production of a High Quantity of Chlorogenic Acid in Young Leaves of Lonicera macranthoides Hand.-Mazz. PLoS ONE 2015, 10, e0137212. [Google Scholar] [CrossRef] [PubMed]
  12. Kitada, C.; Gong, Z.; Tanaka, Y.; Yamazaki, M.; Saito, K. Differential expression of two cytochrome P450s involved in the biosynthesis of flavones and anthocyanins in chemo-varietal forms of Perilla frutescens. Plant Cell Physiol. 2001, 42, 1338–1344. [Google Scholar] [CrossRef] [PubMed]
  13. Yuan, Y.; Song, L.; Li, M.; Liu, G.; Chu, Y.; Ma, L.; Zhou, Y.; Wang, X.; Gao, W.; Qin, S.; et al. Genetic variation and metabolic pathway intricacy govern the active compound content and quality of the Chinese medicinal plant Lonicera japonica thunb. BMC Genom. 2012, 13, 195. [Google Scholar] [CrossRef] [PubMed]
  14. Rai, A.; Kamochi, H.; Suzuki, H.; Nakamura, M.; Takahashi, H.; Hatada, T.; Saito, K.; Yamazaki, M. De novo transcriptome assembly and characterization of nine tissues of Lonicera japonica to identify potential candidate genes involved in chlorogenic acid, luteolosides, and secoiridoid biosynthesis pathways. J. Nat. Med. 2017, 71, 1–15. [Google Scholar] [CrossRef] [PubMed]
  15. Mehrtens, F.; Kranz, H.; Bednarek, P.; Weisshaar, B. The Arabidopsis transcription factor MYB12 is a flavonol-specific regulator of phenylpropanoid biosynthesis. Plant Physiol. 2005, 138, 1083–1096. [Google Scholar] [CrossRef] [PubMed]
  16. Stracke, R.; Ishihara, H.; Barsch, G.H.A.; Mehrtens, F.; Niehaus, K.; Weisshaar, B. Differential regulation of closely related R2R3-MYB transcription factors controls flavonol accumulation in different parts of the Arabidopsis thaliana seedling. Plant J. 2007, 50, 660–677. [Google Scholar] [CrossRef] [PubMed]
  17. Czemmel, S.; Stracke, R.; Weisshaar, B.; Cordon, N.; Harris, N.N.; Walker, A.R.; Robinson, S.P.; Bogs, J. The Grapevine R2R3-MYB Transcription Factor VvMYBF1 Regulates Flavonol Synthesis in Developing Grape Berries. Plant Physiol. 2009, 151, 1513–1530. [Google Scholar] [CrossRef] [PubMed]
  18. Huang, W.; Khaidun, A.B.M.; Chen, J.; Zhang, C.; Lv, H.; Yuan, L.; Wang, Y. A R2R3-MYB Transcription Factor Regulates the Flavonol Biosynthetic Pathway in a Traditional Chinese Medicinal Plant, Epimedium sagittatum. Front. Plant Sci. 2016, 7, 1089. [Google Scholar] [CrossRef] [PubMed]
  19. Ban, Y.; Honda, C.; Hatsuyama, Y.; Igarashi, M.; Bessho, H.; Moriguchi, T. Isolation and functional analysis of a MYB transcription factor gene that is a key regulator for the development of red coloration in apple skin. Plant Cell Physiol. 2007, 48, 958–970. [Google Scholar] [CrossRef] [PubMed]
  20. Takos, A.M.; Jaffe, F.W.; Jacob, S.R.; Bogs, J.; Robinson, S.P.; Walker, A.R. Light-induced expression of a MYB gene regulates anthocyanin biosynthesis in red apples. Plant Physiol. 2006, 142, 1216–1232. [Google Scholar] [CrossRef] [PubMed]
  21. Espley, R.V.; Hellens, R.P.; Putterill, J.; Stevenson, D.E.; Kutty-Amma, S.; Allan, A.C. Red colouration in apple fruit is due to the activity of the MYB transcription factor, MdMYB10. Plant J. 2007, 49, 414–427. [Google Scholar] [CrossRef] [PubMed]
  22. Kobayashi, S.; Ishimaru, M.; Hiraoka, K.; Honda, C. MYB-related genes of the Kyoho grape (Vitis labruscana) regulate anthocyanin biosynthesis. Planta 2002, 215, 924–933. [Google Scholar] [PubMed]
  23. Walker, A.R.; Lee, E.; Bogs, J.; McDavid, D.A.J.; Thomas, M.R.; Robinson, S.P. White grapes arose through the mutation of two similar and adjacent regulatory genes. Plant J. 2007, 49, 772–785. [Google Scholar] [CrossRef] [PubMed]
  24. Feng, S.Q.; Wang, Y.L.; Yang, S.; Xu, Y.T.; Chen, X.S. Anthocyanin biosynthesis in pears is regulated by a R2R3-MYB transcription factor PyMYB10. Planta 2010, 232, 245–255. [Google Scholar] [CrossRef] [PubMed]
  25. Dubos, C.; Le Gourrierec, J.; Baudry, A.; Huep, G.; Lanet, E.; Debeaujon, I.; Routaboul, J.M.; Alboresi, A.; Weisshaar, B.; Lepiniec, L. MYBL2 is a new regulator of flavonoid biosynthesis in Arabidopsis thaliana. Plant J. 2008, 55, 940–953. [Google Scholar] [CrossRef] [PubMed]
  26. Jin, H.L.; Cominelli, E.; Bailey, P.; Parr, A.; Mehrtens, F.; Jones, J.; Tonelli, C.; Weisshaar, B.; Martin, C. Transcriptional repression by AtMYB4 controls production of UV-protecting sunscreens in Arabidopsis. Embo J. 2000, 19, 6150–6161. [Google Scholar] [CrossRef] [PubMed]
  27. Park, J.S.; Kim, J.B.; Cho, K.J.; Cheon, C.I.; Sung, M.K.; Choung, M.G.; Roh, K.H. Arabidopsis R2R3-MYB transcription factor AtMYB60 functions as a transcriptional repressor of anthocyanin biosynthesis in lettuce (Lactuca sativa). Plant Cell Rep. 2008, 27, 985–994. [Google Scholar] [CrossRef] [PubMed]
  28. Tamagnone, L.; Merida, A.; Parr, A.; Mackay, S.; Culianez-Macia, F.A.; Roberts, K.; Martin, C. The AmMYB308 and AmMYB330 transcription factors from antirrhinum regulate phenylpropanoid and lignin biosynthesis in transgenic tobacco. Plant Cell 1998, 10, 135–154. [Google Scholar] [CrossRef] [PubMed]
  29. Aharoni, A.; de Vos, C.H.R.; Wein, M.; Sun, Z.K.; Greco, R.; Kroon, A.; Mol, J.N.M.; O’Connell, A.P. The strawberry FaMYB1 transcription factor suppresses anthocyanin and flavonol accumulation in transgenic tobacco. Plant J. 2001, 28, 319–332. [Google Scholar] [CrossRef] [PubMed]
  30. Li, S. Transcriptional control of flavonoid biosynthesis: Fine-tuning of the MYB-bHLH-WD40 (MBW) complex. Plant Signal. Behav. 2014, 9, e27522. [Google Scholar] [CrossRef] [PubMed]
  31. Huo, J.-W.; Liu, P.; Wang, Y.; Qin, D.; Zhao, L.-J. De novo transcriptome sequencing of blue honeysuckle fruit (Lonicera caerulea L.) and analysis of major genes involved in anthocyanin biosynthesis. Acta Physiol. Plant. 2016, 38, 180. [Google Scholar] [CrossRef]
  32. Conesa, A.; Gotz, S. Blast2GO: A comprehensive suite for functional analysis in plant genomics. Int. J. Plant Genom. 2008, 2008, 619832. [Google Scholar] [CrossRef] [PubMed]
  33. Wang, Q.; Quan, Q.; Zhou, X.; Zhu, Y.; Lan, Y.; Li, S.; Yu, Y.; Cheng, Z. A comparative study of Lonicera japonica with related species: Morphological characteristics, ITS sequences and active compounds. Biochem. Syst. Ecol. 2014, 54, 198–207. [Google Scholar] [CrossRef]
  34. Shi, R.; Sun, Y.H.; Li, Q.Z.; Heber, S.; Sederoff, R.; Chiang, V.L. Towards a Systems Approach for Lignin Biosynthesis in Populus trichocarpa: Transcript Abundance and Specificity of the Monolignol Biosynthetic Genes. Plant Cell Physiol. 2010, 51, 144–163. [Google Scholar] [CrossRef] [PubMed]
  35. Saito, K.; Yonekura-Sakakibara, K.; Nakabayashi, R.; Higashi, Y.; Yamazaki, M.; Tohge, T.; Fernie, A.R. The flavonoid biosynthetic pathway in Arabidopsis: Structural and genetic diversity. Plant Physiol. Biochem. 2013, 72, 21–34. [Google Scholar] [CrossRef] [PubMed]
  36. Park, S.; Choi, M.J.; Lee, J.Y.; Kim, J.K.; Ha, S.-H.; Lim, S.-H. Molecular and Biochemical Analysis of Two Rice Flavonoid 3′-Hydroxylase to Evaluate Their Roles in Flavonoid Biosynthesis in Rice Grain. Int. J. Mol. Sci. 2016, 17, 1549. [Google Scholar] [CrossRef] [PubMed]
  37. Hichri, I.; Barrieu, F.; Bogs, J.; Kappel, C.; Delrot, S.; Lauvergeat, V. Recent advances in the transcriptional regulation of the flavonoid biosynthetic pathway. J. Exp. Bot. 2011, 62, 2465–2483. [Google Scholar] [CrossRef] [PubMed]
  38. Misra, P.; Pandey, A.; Tiwari, M.; Chandrashekar, K.; Sidhu, O.P.; Asif, M.H.; Chakrabarty, D.; Singh, P.K.; Trivedi, P.K.; Nath, P.; et al. Modulation of transcriptome and metabolome of tobacco by Arabidopsis transcription factor, AtMYB12, leads to insect resistance. Plant Physiol. 2010, 152, 2258–2268. [Google Scholar] [CrossRef] [PubMed]
  39. Nakabayashi, R.; Yonekura-Sakakibara, K.; Urano, K.; Suzuki, M.; Yamada, Y.; Nishizawa, T.; Matsuda, F.; Kojima, M.; Sakakibara, H.; Shinozaki, K.; et al. Enhancement of oxidative and drought tolerance in Arabidopsis by overaccumulation of antioxidant flavonoids. Plant J. 2014, 77, 367–379. [Google Scholar] [CrossRef] [PubMed]
  40. Pandey, A.; Misra, P.; Trivedi, P.K. Constitutive expression of Arabidopsis MYB transcription factor, AtMYB11, in tobacco modulates flavonoid biosynthesis in favor of flavonol accumulation. Plant Cell Rep. 2015, 34, 1515–1528. [Google Scholar] [CrossRef] [PubMed]
  41. Stracke, R.; Jahns, O.; Keck, M.; Tohge, T.; Niehaus, K.; Fernie, A.R.; Weisshaar, B. Analysis of PRODUCTION OF FLAVONOL GLYCOSIDES-dependent flavonol glycoside accumulation in Arabidopsis thaliana plants reveals MYB11-, MYB12-and MYB111-independent flavonol glycoside accumulation. New Phytol. 2010, 188, 985–1000. [Google Scholar] [CrossRef] [PubMed]
  42. Adato, A.; Mandel, T.; Mintz-Oron, S.; Venger, I.; Levy, D.; Yativ, M.; Dominguez, E.; Wang, Z.; de Vos, R.C.H.; Jetter, R.; et al. Fruit-Surface Flavonoid Accumulation in Tomato is Controlled by a SIMYB12-Regulated Transcriptional Network. PLoS Genet. 2009, 5, e1000777. [Google Scholar] [CrossRef] [PubMed]
  43. Gonzalez, A.; Zhao, M.; Leavitt, J.M.; Lloyd, A.M. Regulation of the anthocyanin biosynthetic pathway by the TTG1/bHLH/Myb transcriptional complex in Arabidopsis seedlings. Plant J. 2008, 53, 814–827. [Google Scholar] [CrossRef] [PubMed]
  44. Pireyre, M.; Burow, M. Regulation of MYB and bHLH Transcription Factors: A Glance at the Protein Level. Mol. Plant 2015, 8, 378–388. [Google Scholar] [CrossRef] [PubMed]
  45. Xu, W.J.; Dubos, C.; Lepiniec, L. Transcriptional control of flavonoid biosynthesis by MYB-bHLH-WDR complexes. Trends Plant Sci. 2015, 20, 176–185. [Google Scholar] [CrossRef] [PubMed]
  46. Xu, W.J.; Grain, D.; Bobet, S.; Le Gourrierec, J.; Thevenin, J.; Kelemen, Z.; Lepiniec, L.; Dubos, C. Complexity and robustness of the flavonoid transcriptional regulatory network revealed by comprehensive analyses of MYB-bHLH-WDR complexes and their targets in Arabidopsis seed. New Phytol. 2014, 202, 132–144. [Google Scholar] [CrossRef] [PubMed] [Green Version]
  47. Chiu, L.W.; Zhou, X.J.; Burke, S.; Wu, X.L.; Prior, R.L.; Li, L. The Purple Cauliflower Arises from Activation of a MYB Transcription Factor. Plant Physiol. 2010, 154, 1470–1480. [Google Scholar] [CrossRef] [PubMed]
  48. Shin, D.H.; Cho, M.; Choi, M.G.; Das, P.K.; Lee, S.K.; Choi, S.B.; Park, Y.I. Identification of genes that may regulate the expression of the transcription factor production of anthocyanin pigment 1 (PAP1)/MYB75 involved in Arabidopsis anthocyanin biosynthesis. Plant Cell Rep. 2015, 34, 805–815. [Google Scholar] [CrossRef] [PubMed]
  49. Quattrocchio, F.; Wing, J.F.; Leppen, H.T.C.; Mol, J.N.M.; Koes, R.E. Regulatory Genes-Controlling Anthocyanin Pigmentation Are Functionally Conserved among Plant-Species and Have Distinct Sets of Target Genes. Plant Cell 1993, 5, 1497–1512. [Google Scholar] [CrossRef] [PubMed]
  50. Mortazavi, A.; Williams, B.A.; McCue, K.; Schaeffer, L.; Wold, B. Mapping and quantifying mammalian transcriptomes by RNA-Seq. Nat. Methods 2008, 5, 621–628. [Google Scholar] [CrossRef] [PubMed]
  51. Wang, L.; Feng, Z.; Wang, X.; Wang, X.; Zhang, X. DEGseq: An R package for identifying differentially expressed genes from RNA-seq data. Bioinformatics 2010, 26, 136–138. [Google Scholar] [CrossRef] [PubMed]
  52. Benjamini, Y.; Yekutieli, D. The control of the false discovery rate in multiple testing under dependency. Ann. Stat. 2001, 29, 1165–1188. [Google Scholar]
Figure 1. The luteoloside contents in different tissues at different developmental stages in Lonicera macranthoides. (A). Leaves at three developmental stages. YL, SLL and SL indicate young leaves, semi-lignified leaves and senescing leaves, respectively. (B). Luteoloside contents in leaves were determined by HPLC. (C). Stems at three developmental stages. SS1, SS2 and SS3 indicate young stems, semi-lignified stems and senescing stems, respectively. (D). Luteoloside contents in stems were determined by HPLC. (E). Flowers at five stages of development, including green flower buds in length of 10 mm (FS1) and 20–30 mm (FS2), white flower buds in length of 30–40 mm (FS3), white flower (FS4) and yellow flower (FS5). (F). Luteoloside contents in flowers were determined by HPLC. Three biological replications were performed for each examination. Values are means ± SD (n = 3). Duncan’s multiple range test was used to analyze the significance and the different lower-case letters (e.g., a and b) indicate significant (p < 0.05) differences between samples.
Ijms 19 01012 g001
Figure 2. Number of differentially expressed unigenes during leaf senescence identified by RNA-Seq data in Lonicera macranthoides. Differentially expressed unigenes (DEGs) between young and senescing leaves were illustrated by bar chart. Red and green bars represent the up-regulated and down-regulated unigenes in senescing leaves (SL) compared with those in young leaves (YL), respectively in Lonicera macranthoides.
Ijms 19 01012 g002
Figure 3. Gene Ontology enrichment analysis of DEGs during leaf senescence in Lonicera macranthoides. Significantly enriched gene ontology (GO) terms (FDR < 0.05) for DEGs between young and senescing leaves based on cellular component (A), molecular function (B) and biological process (C) were identified using the Blast2GO program. The left y-axis indicates the enrichment GO terms and the top x-axis indicates the number of DEGs in each category.
Ijms 19 01012 g003
Figure 4. Transcriptomic mapping of genes associated with luteoloside biosynthesis in Lonicera macranthoides. Proposed pathways for luteoloside biosynthesis in Lonicera macranthoides were illustrated by RNA-Seq analysis. Luteolin, the precursor of luteoloside, is biosynthesized from the general flavonoid precursor: naringenin. Circle 1(①) indicates that luteolin is biosynthesized directly from apigenin catalyzed by F3’H. Circle 2(②) indicates that luteolin is generated directly from eriodictyol catalyzed by FNS. Expression profile for each gene was shown in colored blocks and each blocks represented the expression changes (represented by Log2Ratio) in senescing leaves with respect to young leaves. Red colors/green colors correspond to up-/down-regulation of these genes and Log2Ratio ≥ 1 is considered statistically significant. Details were showed in Table 2. Abbreviations: PAL, phenylalanine ammonia lyase; C4H, cinnamate 4-hydroxylase; 4CL, 4-hydroxycinnamoyl CoA ligase/4-coumarate-CoA ligase; CHS, chalcone synthase; CHI, chalcone isomerase; FNS, flavone synthase; F3H, flavonoid 3′-monooxygenase/flavonoid 3′-hydroxylase; UF7GT, flavone 7-O-β-glucosyltransferase.
Ijms 19 01012 g004
Figure 5. Expression patterns of selected unigenes related to luteoloside biosynthesis identified by RNA-Seq were validated by qRT-PCR. Expressions of unigenes located upstream of luteoloside metabolic pathway (A) Unigene109136 (PAL), (B) CL11118.Contig2 (C4H), (C) Unigene29692(4CL) and downstream of luteoloside metabolic pathway (D) CL11269.Contig3(CHI), (E) CL19869.Contig1(CHS), (F) Unigene2335(FNSII), (G) CL11828.Contig1 and (H) CL11828.Contig2(F3’H), (I) Unigene2918 and (J) Unigene97915(UFGT) in young and senescing leaves were analyzed by qRT-PCR. Relative expression levels were determined based on the reference young leaves set to 1. Values are means ± SD of three biological repetitions (n = 3). Two technical replicates for each biological replicate were performed in each qRT-PCR experiments.
Ijms 19 01012 g005
Figure 6. Expression patterns of selected unigenes related to transcription factors identified by RNA-Seq were validated by qRT-PCR. Expressions of unigenes, homologs to AtMYB12 (A) Unigene36582 and (B) Unigene52460, homologs to VvMYB75 (C) CL5870.Contig1, homologs to VvMYB1R1 (D) CL15118.Contig2, homologs to AtbHLH113 (E) Unigene33227 and (F) Unigene11884, homologs to AtbHLH78 (G) CL2495.Contig7, homologs to TTG1 (H) Unigene108470 and homologs to AtMYB5 (I) CL20138.Contig2 in young and senescing leaves were analyzed by qRT-PCR. Relative expression levels were determined based on the reference young leaves set to 1. Values are means ± SD of three biological repetitions (n = 3). Two technical replicates for each biological replicate were performed in each qRT-PCR experiments.
Ijms 19 01012 g006
Table 1. Statistical analysis of de novo assembly of L. macranthoides unigenes.
SamplesTotal NumberTotal Length (nt)Mean Length (nt)N50Distinct ClustersDistinct Singletons
SL-Trinity260,079202,070,1317771238--
YL-Trinity173,214165,117,5239531607--
SL-Unigene183,667165,907,666903150157,995125,672
YL-Unigene122,824138,943,9271131185948,50774,317
All-Unigene158,842171,974,9021083174357,337101,505
SL-Unigene and YL-Unigene represent unigenes generated after assembling and processing the clean reads from senescing leaves (SL) and young leaves (YL) libraries, respectively. All-Unigene indicates the non-redundant unigenes generated via assembling the total clean reads from SL and YL libraries.
Table 2. DEGs involved in luteoloside biosynthesis during leaf senescence in Lonicera macranthoides.
EC NumberAccession No.Reads Mean YLReads Mean SLlog2Ratio (SL/YL)Annotation
EC:4.3.1.24Unigene1091360.5667.44Solanum tuberosum PAL2
Unigene274502273.5394.5−2.21Lonicera japonica PAL3
Unigene2900390489.5−3.01Lonicera japonica PAL2
EC:1.14.13.11CL11118.Contig214511173.3Lonicera japonica C4H
EC:6.2.1.12CL15146.Contig1040InfArabidopsis thaliana 4CLL7
CL7954.Contig31612138−3.22Arabidopsis thaliana 4CLL10
Unigene100595069.5InfPetroselinum crispum 4CL2
Unigene1410500165.5InfArabidopsis thaliana 4CLL10
Unigene2659319504922.51.67Arabidopsis thaliana 4CLL7
Unigene296921735.547661.79Arabidopsis thaliana 4CLL7
Unigene66358029.5InfOryza sativa 4CL5
Unigene735870.51558.67Petroselinum crispum 4CL2
Unigene75066049InfArabidopsis thaliana 4CL4
Unigene80421049InfNicotiana tabacum 4CL2
Unigene816060124InfArabidopsis thaliana 4CLL10
Unigene825860.51548.67Arabidopsis thaliana 4CLL1
Unigene84369034.5InfArabidopsis thaliana 4CLL10
Unigene996380181.5InfArabidopsis thaliana 4CLL7
EC:2.3.1.74CL11967.Contig1588628.5−7.34Lonicera japonica CHS
CL19869.Contig10.5597.273Hordeum vulgare CHS2
Unigene127312367−4.74Lonicera macranthoides CHS
Unigene1352529415.5−8.06Lonicera japonica CHS
Unigene2368331,797852.5−4.89Lonicera hypoglauca CHS2
Unigene2368412,441.5400−4.63Lonicera japonica CHS2
Unigene401514161−8.35Lonicera japonica CHS
Unigene69273129135−4.88Lonicera japonica CHS2
EC:5.5.1.6CL11269.Contig31217.5110.5−3.13Lonicera japonica CHI2
CL16735.Contig24566377.5−3.27Lonicera japonica CHI1
EC:1.14.11.22Unigene23356778781−2.77Lonicera macranthoidesFNS II
EC:1.14.13.21CL11828.Contig1184026,424.54.2Petunia hybrida F3′H
CL11828.Contig213.5196.54.25Arabidopsis thaliana F3′H
CL7653.Contig1031.5InfSolanum melongena F3′H
Unigene102655056InfCatharanthus roseus F3′H
Unigene3751799.521−4.9Petunia hybrida F3′H
Unigene65437044InfArabidopsis thaliana F3′H
Unigene76746024InfZea mays F3′H
Unigene1895838,7381897−4Petunia hybrida F3′H
EC:2.4.1.81CL5848.Contig31370161−2.8Fragaria ananassa UFGT6
CL8885.Contig1147737.5−5Fragaria ananassa UFGT6
CL8885.Contig2172527−5.7Fragaria ananassa UFGT6
CL8885.Contig37073−7.6Manihot esculenta GT2
Unigene291812279.54.82Fragaria ananassa UFGT6
Unigene45672083−5.8Fragaria ananassa UFGT7
Unigene979155.51144.69Fragaria ananassa UFGT6
“Inf” and “−Inf” indicate that the Log2Ratio of SL to YL is infinity and negetive infinity, respectively.
Table 3. DEGs involved in MYB and bHLH family during leaf senescence.
Accession No.Reads Mean YLReads Mean SLlog2Ratio (SL/YL)Annotation
MYB
CL11844.Contig2363.535−3.04Paeonia suffruticosa MYB1
CL13949.Contig1147.51.5−6.27Vitis vinifera AS1
CL13949.Contig2880.5−7.2Vitis vinifera AS1
CL13949.Contig346610−5.22Vitis vinifera AS1
CL14249.Contig3267.514142.70Gossypium hirsutum GhMYB9
CL14844.Contig239.50−InfVitis vinifera MYB39
CL15118.Contig23419.58646.51.67Vitis vinifera MYB1R1
CL20138.Contig1205.519−3.11Arabidopsis thaliana TT2
CL20138.Contig2700.542−3.75Arabidopsis thaliana MYB5
CL2957.Contig10163.5InfSolanum tuberosum MYB1R1
CL3616.Contig12.5258.57.05Arabidopsis thaliana MYB48
CL3616.Contig3351308.55.51Arabidopsis thaliana MYB48
CL3616.Contig510197.54.58Arabidopsis thaliana MYB48
CL4609.Contig1124.5528.52.43Theobroma cacao myb2
CL5870.Contig1483.51731.52.21Vitis vinifera MYB75
CL5870.Contig2191711.52.27Vitis vinifera MYB75
CL6351.Contig21209−3.43Theobroma cacao Myb 106
CL6351.Contig3229.58.5−4.4Theobroma cacao Myb 106
CL8018.Contig251625.37Antirrhinum majus MYB340
CL8018.Contig423266965.18Antirrhinum majus MYB305
Unigene2023834198733.51.71Epimedium sagittatum MYB13
Unigene23056863602.42Petunia hybrida ODO1
Unigene323791639358.5−1.88Vitis vinifera MYB44
Unigene36582901.50.5−10.4Arabidopsis thaliana MYB12
Unigene3794959.50.5−6.48Arabidopsis thaliana MYB46
Unigene4280545.50.5−6.12Vitis vinifera MYB6
Unigene437581384−4.85Vitis vinifera myb306
Unigene4706763.50-InfSolanum lycopersicum MYB46
Unigene524601320−InfArabidopsis thaliana MYB12
Unigene704071.5615.68Oryza sativa MYB4
bHLH
CL10785.Contig3243.50.5−8.66Arabidopsis thaliana bHLH93
CL10785.Contig6107.50−InfArabidopsis thaliana bHLH93
CL10785.Contig7199.51−7.32Arabidopsis thaliana bHLH93
CL11820.Contig21238.56.5−4.85Arabidopsis thaliana bHLH4
CL11820.Contig61194.5−4.38Arabidopsis thaliana bHLH4
CL12435.Contig232737−2.81Arabidopsis thaliana bHLH74
CL18193.Contig2970−InfArabidopsis thaliana bHLH25
CL2495.Contig1037.53173.42Arabidopsis thaliana bHLH78
CL2495.Contig382904.53.79Arabidopsis thaliana bHLH78
CL2495.Contig725.52183.42Arabidopsis thaliana bHLH78
CL2495.Contig910.51113.72Arabidopsis thaliana bHLH78
CL3128.Contig3384.519472.7Arabidopsis thaliana bHLH47
CL3403.Contig464294.5−2.42Arabidopsis thaliana bHLH93
CL3655.Contig48.599.53.93Arabidopsis thaliana bHLH113
CL4290.Contig2245.5870.52.18Arabidopsis thaliana bHLH143
CL4720.Contig637211.52.88Arabidopsis thaliana bHLH123
CL661.Contig420.52313.88Arabidopsis thaliana bHLH25
CL7365.Contig10145.54672.02Arabidopsis thaliana bHLH66
CL8229.Contig1480−InfArabidopsis thaliana bHLH135
CL8229.Contig238.50−InfArabidopsis thaliana bHLH135
Unigene11884221062.65Arabidopsis thaliana bHLH113
Unigene19084163443.5−4.9Arabidopsis thaliana bHLH117
Unigene2295412.553.5−2.61Vitis vinifera bHLH74
Unigene2303481351.52.47Arabidopsis thaliana bHLH147
Unigene29099650.5112−2.21Arabidopsis thaliana bHLH79
Unigene33227274274.37Arabidopsis thaliana bHLH113
Unigene37456135.51−6.77Arabidopsis thaliana bHLH71
Unigene48118139.51−6.83Arabidopsis thaliana bHLH14
Unigene6423312.554.5−2.2Arabidopsis thaliana bHLH79
Unigene770680.5497.02Arabidopsis thaliana bHLH49

