Abstract
Malnutrition of iron (Fe) affects two billion people worldwide. Therefore, enhancing grain Fe concentration (GFeC) in wheat (Triticum aestivum L.) is an important goal for breeding. Here we study the genetic factors underlying GFeC trait by genome-wide association studies (GWAS) and the prediction abilities using genomic prediction (GP) in a panel of 369 European elite wheat varieties which was genotyped with 15,523 mapped single-nucleotide polymorphism markers (SNP) and a subpanel of 183 genotypes with 44,233 SNP markers. The resulting means of GFeC from three field experiments ranged from 24.42 to 52.42 μg·g−1 with a broad-sense heritability (H2) equaling 0.59 over the years. GWAS revealed 41 and 137 significant SNPs in the whole and subpanel, respectively, including significant marker-trait associations (MTAs) for best linear unbiased estimates (BLUEs) of GFeC on chromosomes 2A, 3B and 5A. Putative candidate genes such as NAC transcription factors and transmembrane proteins were present on chromosome 2A (763,689,738–765,710,113 bp). The GP for a GFeC trait ranged from low to moderate values. The current study reported GWAS of GFeC for the first time in hexaploid wheat varieties. These findings confirm the utility of GWAS and GP to explore the genetic architecture of GFeC for breeding programs aiming at the improvement of wheat grain quality.
1. Introduction
Wheat is the second most produced and consumed food crop worldwide and its products form a fundamental diet in the daily life for people in the whole world (FAOSTAT 2016; http://faostat.fao.org). Wheat grains contain mainly carbohydrates with a small proportion of proteins and essential micronutrients such as iron (Fe) and zinc (Zn) [1,2,3]. Micronutrient deficiency including Fe and Zn are among the most prevalent deficiencies in the developing countries and high-risk groups are women and children [4]. More than 2 billion people are affected with Fe deficiency which has an adverse effect on health, such as retarding the physical growth and affecting the motoric development, leading to fatigue and low productivity [5,6]. Therefore, in regions where the people depend mostly on cereal-based foods, deficiencies in micronutrients become a challenge. On the other side, improving Fe concentrations in the edible part of crops are linked with positive consequences on both grain yield and nutritional status as well as a positive effect on human health [7].
Understanding the genetic basis of Fe concentration in wheat grains is imperative for enhancing Fe values in newly developed varieties. Therefore, we performed a genome-wide association study (GWAS) approach which is one of the main approaches for dissecting complex traits including nutritional quality traits that are controlled by many genes and influenced by the environment [8,9]. Several genetic regions controlling mineral concentration traits in wheat have been identified by applying traditional quantitative trait loci (QTL) analysis using bi-parental mapping populations. For instance, Peleg et al. [10] detected five QTLs on chromosomes 2A, 3B, 5A, 6B and 7A for Fe concentration in a tetraploid wild emmer × durum wheat recombinant inbred lines (RILs) population. Another study identified five QTLs underlying grain Fe concentration (GFeC) in a Triticum spelta × T. aestivum RIL population, of which three mapped to chromosome 1A while two QTLs mapped to chromosomes 2A and 3B [11]. To our knowledge two GWAS studies have been reported on synthetic wheat lines. Gorafi et al. [12] studied grain iron content in 47 synthetic hexaploid wheat germplasm lines and Bhatta et al. [13] performed GWAS for various grain minerals including Fe on 123 synthetic hexaploid wheat lines. Association mapping for seed Fe content was also performed for other crops such as pearl millet [14] and seed Fe concentration in chickpea [15]; however, no GWAS study on released wheat varieties is available to our knowledge.
Recently, genomic prediction (GP) or genomic selection (GS) approaches were developed based on genome-wide marker information to predict the breeding value of complex traits for which only genotyping data are provided (test population) [16]. These predicted values are called genome estimate breeding values (GEBVs) and are based on actual phenotypic data related to genotypes in a training population [17]. Several methods were adopted for GP or GS calculation such as Bayesian methods, rrBLUP and Genomic best linear unbiased prediction (GBLUP), while the main affecting factor within these methods is the density of the markers [18]. Application of GP will be helpful particularly for complex traits and for traits that are costly to phenotype; therefore, applying GP could speed up the genetic gains in the development of nutrient-dense wheat varieties. To date, numerous plant breeding studies have been published to investigate complex traits such as nutritional quality traits in wheat [19,20].
The goals of this study were (i) to study the natural phenotypic variation of wheat GFeC in a panel of 369 elite wheat varieties grown for three years in the field, (ii) to investigate the genetic architecture of this trait and to identify QTLs by applying a GWAS approach, (iii) to define the gene content in the respective genomic region of the wheat reference sequence as well as to identify potential candidate genes, and (iv) to examine the prediction ability in the present wheat panel by using different statistical models.
2. Results
2.1. Phenotypic Analysis and Correlations
The analyses of variance (ANOVA) for Fe concentration in grains showed a significant effect of both genotype and years (p < 0.001) (Table S1). Wide genetic variation of GFeCs was found between the genotypes in both the whole panel and subpanel in each year (Figure S1, Table S2). The genotypic variation of Fe concentrations in each year appeared to be normally distributed (Figure S2). The average of grain Fe based on BLUE values was about 34 μg·g−1 dry weight (DW) in the whole and subpanel of genotypes (Figure 1) with a range of 24.42–52.42 μg·g−1 DW in the whole panel and 26.99–48.52 μg·g−1 DW in the subpanel of genotypes (Figure 1). This trend of GFeC decrease among years may be attributed to environmental effects including rain fall and temperature (Figure S3). In fact, this conclusion was supported by the resulting heritability for Fe concentration across the years which is equal to H2 = 0.59.
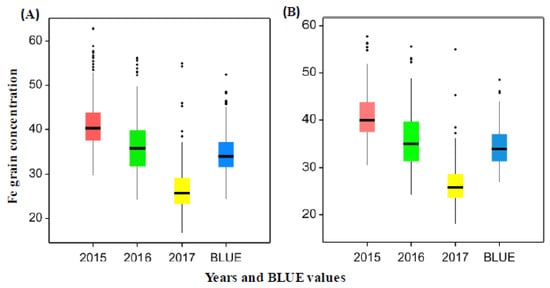
Figure 1.
(A) Grain iron concentration (µg·g−1) in all wheat genotypes of the whole panel for the years 2015, 2016 and 2017 and BLUE values. (B) Grain iron concentration (µg·g−1) for wheat genotypes in the subpanel for the years 2015, 2016 and 2017 and BLUE values.
A significant positive correlation ranging from r = 0.26 to 0.39 (p < 0.001) was found for grain Fe in all three years (Figure 2). As well, a significant positive correlation (0.11–0.26, p < 0.001) was present between Fe and thousand kernel weight (TKW) in all three years (Figure S4) and a strong correlation was found between Fe and Zn with values ranging between 0.51–0.68 (p < 0.001) over years (Figure S4). In the whole wheat panel, genotype “SW Tataros” showed the highest Fe concentration equaling 52.67 μg·g−1 DW based on the BLUEs (Figure 3).
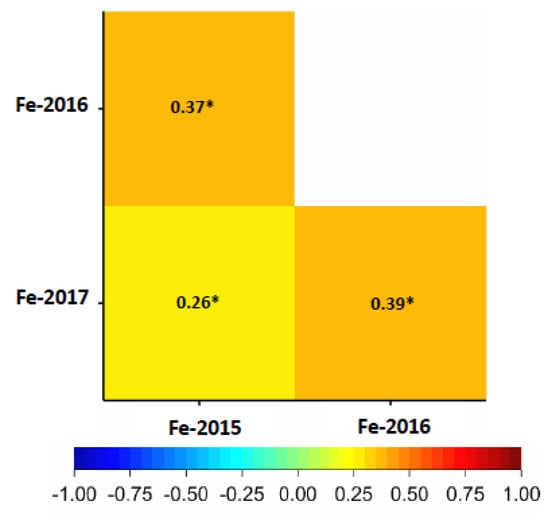
Figure 2.
Pearson correlation between Fe grain concentrations (µg·g−1) in the years 2015, 2016 and 2017. The degree of significance indicated as * p ≤ 0.05.
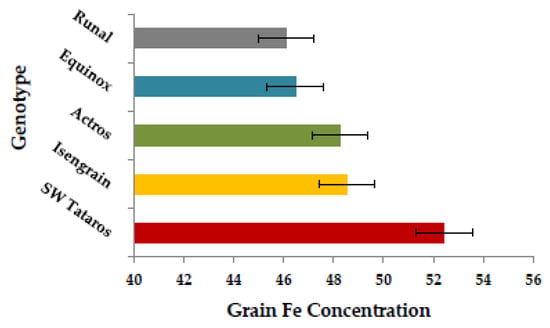
Figure 3.
The scale of the top five genotypes with the highest Fe concentration (µg·g−1) value crossing years (BLUE).
2.2. Genetic Analysis and Genes Underlying GFeC Trait
GWAS analysis for the whole panel identified 41 significant MTAs (−log10 (p-value) ≥ 3) (Figure 4A) which were distributed over the genome with R2 values ranging between 2.7% to 5.22%. In total 41 MTAs, of which 17 were located on chromosome 3B between 46.6 to 59.8 cM (Table S3). Due to no common associations among years, our analyses were based on BLUEs by including the most significant 3 SNPs for further analysis (Table S3). In the subpanel, the number of significant associations including unmapped markers was higher and mounted to 137 MTAs (Figure 5A) with R2 values ranging from 5.60% to 13.09% (Table S4). The highest phenotypic variation was related to unmapped markers (AX-158577508 and AX-158577509) and equaled 10.38% and 13.09%, respectively. Fifteen, four and two significant SNPs which were present on chromosomes 2A (763,689,738–765,710,113 bp), 3B (731,263,238–731,264,585 bp) and 5A (538,758,878–539,958,539 bp) were targeted for further analysis.
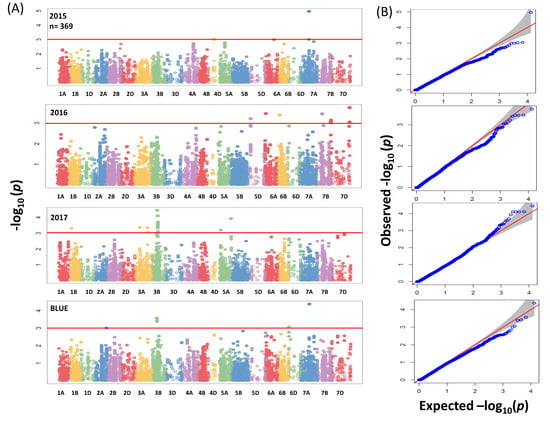
Figure 4.
(A) Summary of genome-wide association scans for the whole panel of wheat genotypes (369) which were analyzed by using the 90K iSELECT Infinium array and the 35K Affymetrix SNP array for each year (2015/2016/2017) and BLUEs. The horizontal red color line indicated the threshold of −log10 (p-value) of 3. (B) Quantile-quantile scale representing expected versus observed −log10 (p-value).
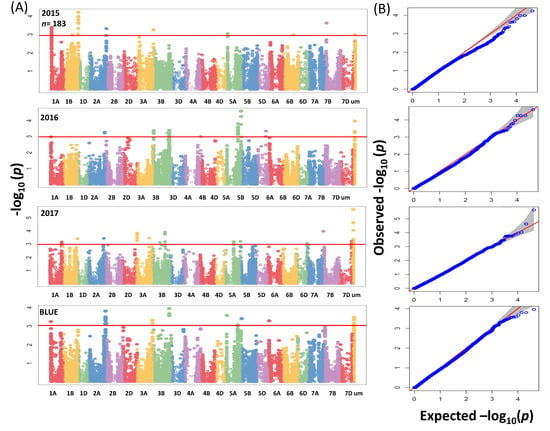
Figure 5.
(A) Summary of genome-wide association scans for the subpanel of wheat genotypes (183) which analyzed by using the 90K iSELECT Infinium array, the 35K Affymetrix SNP array and the 135K Affymetrix SNP array for each year (2015/2016/2017) and BLUEs. The horizontal red color line indicated the threshold of −log10 (p-value) of 3. (B) Quantile-quantile scale representing expected versus observed −log10 (p-value).
The QQ plots for SNP results revealed that the distribution of observed association p-values were close to the distribution of expected associations (Figure 4B and Figure 5B); that means the model which we implemented for GWAS was sufficiently stringent to control for false positive associations. In a previous study a total of 8 markers in the whole panel and 31 markers in the subpanel (Tables S3 and S4) had been found significant for grain Zn concentration in the same germplasm [9]. Based on BLUEs, significant markers from the whole and subpanel were selected for a query against IWGSC RefSeq annotation v1.0 to get their annotations.
In the subpanel, we detected several potential candidate genes that located on chromosome 2A (763,689,738–765,710,113 bp) (Table S5). Based on the functional annotation, we found genes which encode either a transcription factor (TF) related to the NAC (NAM (no apical meristem)) domain family or a transmembrane protein (Table 1). These genes are well known to play a role in nutrient remobilization in plants [21,22]. Therefore, we conclude that this genomic region harbors several putative candidate genes, which may have a significant role in grain Fe accumulation.

Table 1.
Potential candidate genes underlying GFeC trait in wheat.
2.3. Genomic Prediction of GFeC Trait
GP was evaluated for GFeC trait with three statistical models including GBLUP, ridge regression best linear unbiased prediction (RR-BLUP) and Bayes-Cπ in the whole panel. Prediction ability values were 0.29 to 0.38, 0.27 to 0.35, and 0.20 to 0.35 based on using these methods: GBLUP, RR-BLUP and Bayes-Cπ respectively (Figure 6). The highest value is equal 0.38 (GBLUP) and 0.35 (RR-BLUP and Bayes-Cπ) based on Fe BLUE values. The prediction values within years were almost the same and equaled around 0.2 (Figure 6). Based on the GP results, more accurate estimates of breeding values through marker-based relationship matrices could be obtained by increasing the number of genotypes in the training data.
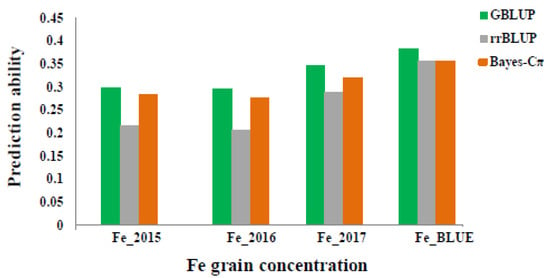
Figure 6.
Prediction ability values for grain Fe concentration (µg·g−1) according to different years (2015, 2016 and 2017) and BLUEs by using three different statistical models: GBLUP, rrBLUP and BayesC.
3. Discussion
3.1. The Usefulness of the Natural Phenotypic Variation
In human nutrition, the estimated average requirement (EAR) of Fe is 1460 μg/day/person, while the target level for sufficient Fe concentration in wheat grains was established as 52 μg·g−1 [23]. In our mapping panel, we observed high phenotypic variation in grain Fe concentrations ranging between 16.77–62.87 μg·g−1 among years and identifying 23 lines equal or above the required target (≥52 μg·g−1). A similar range of GFeCs was reported for a wheat RIL population (17.8–69.0 μg·g−1) which resulted from crossing Triticum boeoticum with Triticum monococcum [24]. Morgounov et al. [25] found GFeCs in the range of 34–43 μg·g−1 for 41 winter w·μg heat cultivars except for one spring wheat cultivar, that had GFeC of 56 μg·g−1. Also, the range of Fe concentrations in Indian and Pakistan hexaploid wheat grains was found to be in the range of (9.2 to 49.7 μg·g−1) [26]. Therefore, using lines with elevated GFeC are important to develop new varieties for crop improvement.
The heritability of Fe concentration among the years was moderate equaling H2 = 0.59, suggesting a quantitative nature of inheritance and a considerable environmental influence on the expression of the trait. Gorafi et al. [12] reported a broad-sense heritability value of Fe grain concentration in synthetic hexaploid wheat germplasm of 0.80. Khokhar et al. [27] reported broad-sense heritability equal to 0.75 for Fe grain concentrations in field-grown Indian wheat.
GFeCs showed a significant positive correlation among years (r = 0.25–0.38, p < 0.001), indicating a relatively stable measurement of the phenotypic data. The resulting correlation values were moderate; that may be attributed to the influence of genetics and environment on the GFe accumulation which can also explain the moderate heritability value (0.59) of GFe. Tiwari et al. [24] found a constant correlation between different locations for grain Fe concentrations which is compatible with our results.
The positive and highly significant correlation between Fe and Zn in addition to a significant positive correlation between Fe, Zn and TKW found in the current study, was also reported in earlier studies in wheat [10,25]. For instance, our results agree with Pandey et al. [26], who reported a positive correlation between GFeCs and Zn concentrations in 150 bread wheat lines. Additionally, Fe and Zn have the same families of transporter proteins in several steps during the transportation from the soil to the grain, for example nicotianamine (NA) related enzymes are important for both of Fe and Zn radial movement through the root [28,29]. As well, such a high correlation between Fe, Zn and TKW suggest that these traits (Fe and Zn) may have the same genetic basis and could be improved simultaneously with TKW or TKW determinants such as starch and protein. Krishnappa et al. [30] found common genetic regions between Fe, Zn, TKW and protein content. Peleg et al. [10] showed a positive correlation between Fe, Zn, TKW and protein content in wheat. Therefore, it is important to shed light on the genetic makeup of these traits together.
3.2. Putative Candidate Genes
Based on GWAS analysis, we found that different loci are controlling Fe accumulation in wheat grains indicating that it is a complex trait with polygenic control. In the whole panel, 137 significant associations were underlying grain Fe and were distributed on chromosomes 1A, 1B, 2A, 2B, 3A, 3B, 4A, 5A, 5B, 5D, 6A, 6D, 7B and 7D of which 3 significant SNPs were located on 3B (46.60–47.42 cM). There were no obvious candidate genes detected within the aforementioned region. In the subpanel, three physical regions contained significant SNPs, on chromosomes 2A (763,689,738–765,710,113 bp), 3B (731,263,238–731,264,585 bp) and 5A (538,758,878–539,958,539 bp), but only the 2A region conferred candidate genes involved in iron uptake or homeostasis.
Chromosome 2A conferred six putative genes related to the NAC (NAM (no apical meristem)) domain family proteins (Table 1), which are well known to be involved in accelerated senescence and an increase of nutrient remobilization from leaves to grains. Several studies reported about NAC gene and increasing Fe and Zn content in the grains of wheat [13,21,31,32]. Uauy et al. [21] described that a NAC TF (NAM-B1) accelerated senescence and nutrient remobilization from leaves to grains. The reduction in RNA levels of the multiple NAM homologs by RNA interference delayed the senescence process and reduced wheat grain protein, Zn, and Fe content by more than 30%. In the same context, Ricachenevsky et al. [31] showed that NAM-B1 which is one of the NAC TFs has a major role in regulating key genes responsible for the senescence process which leads to higher Fe and Zn concentrations in wheat grains.
Another four genes encoded transmembrane proteins on chromosome 2A. It has been reported that transmembrane proteins are responsible for nutrient uptake in plants and play an important role in enhancing the micronutrient content of grains [22,33]. Therefore, these genes could be important for GFeC in wheat; however, functional characterization studies are required to validate the function of these genes.
3.3. Genome-Wide Prediction Accuracy
GP or GS has been proposed as a method to improve the breeding efficiency of quantitative and complex traits. Therefore, we extended our analyses and included GP as a suggested tool for improving a polygenic trait such as GFeC in wheat. Our predictability results showed low to moderate values according to three different years and BLUE values, which agrees with another report that obtained low to moderate predictability values for the macro- and micro-nutrients including Fe in wheat landraces [19]. In spring wheat, GP showed moderate to high prediction accuracy for grain Fe by imputing different statistical models [20]. Based on our findings, GP may be considered as a promising approach for enhancing GFeC in wheat especially when larger size germplasm panels with additional genotypes are used to have more accurate estimates of breeding values.
4. Materials and Methods
4.1. Plant Germplasm
A population comprised of 369 elite European wheat varieties including 355 genotypes of winter wheat and 14 genotypes of spring wheat, mainly from Germany and France was used in this study. Field experiments were carried out at IPK, Gatersleben, Germany over three consecutive years (2014/2015, 2015/2016 and 2016/2017) using plot with a size of 2 × 2 m for each genotype with six rows spaced 0.20 m apart and more details were described in a previous study by Alomari et al. [9]. The grains were collected randomly from more than 250 plants of each plot to be used in the study. Standard agronomic wheat management practices were subjected without applying fertilizers to the soil.
4.2. Milling Process
Three hundred sixty-nine wheat genotypes harvested from three different field experimental trials were prepared for milling process by collecting 50 kernels for each genotype to measure thousand-grain weights (TGW) using a digital seed analyzer/counter Marvin (GTA Sensorik GmbH, Neubrandenburg, Germany). Wheat grains were milled by using a Retsch mill (MM300, Mettmann, Germany), afterward, the whole panel of the milled wheat grains was dried by incubating overnight at 40 °C in the oven.
4.3. Iron Concentration Measurements
Fifty mg of dried and milled wheat grain flour was taken to be digested by (2 mL) nitric acid (HNO3 69%, Bernd Kraft GmbH, Germany). The digestion process was completed using a high-performance microwave reactor (UltraClave IV, MLS, Leutkirch im Allgäu, Baden-Württemberg, Germany). All digested samples were filled up to 15 mL final volume with de-ionized distilled (Milli-Q) water (Milli-Q® Reference System, Merck, Germany). Element standards were prepared from Bernd Kraft multi-element standard solution (Germany). Fe as an external standard and Yttrium (Y) (ICP Standard Certipur® Merck, Germany) were used as internal standards for matrix correction. Fe concentrations were measured by Inductively Coupled Plasma Optical Emission Spectrometry (ICP-OES, iCAP 6000, Thermo Fisher Scientific, Dreieich, Germany) combined with a CETAC ASXPRESS™ PLUS rapid sample introduction system and a CETAC autosampler (CETAC Technologies, Omaha, NE, USA).
4.4. Statistical Analysis
We used Sigma Plot package 13 to perform the ANOVA and Pearson’s correlation coefficient (r) which were calculated for the grain Fe data resulted from the three years. The broad-sense heritability was calculated using the equation:
where σ2G is the genotype variance, σ2e represents the variance of the residual and nE is the environments number.
H2 = σ2G/(σ2G + (σ2e/nE),
Mixed linear model function and the residual maximum likelihood (REML) algorithm were applied to calculate the Best linear unbiased estimates (BLUEs) of Fe concentration in wheat grains for each genotype across the years [34] by considering the genotype as a fixed effect and the environment as a random effect. All these calculations were accomplished using GenStat v18 software (VSN International, Hemel Hempstead, UK).
4.5. Genotyping
The whole wheat germplasm (369 varieties) was genotyped using two marker arrays: a 90K iSELECT Infinium array [35] and a 35K Affymetrix SNP array (Axiom® Wheat Breeder’s Genotyping Array, http://www.cerealsdb.uk.net/) [36] and these two arrays were genotyped by TraitGenetics GmbH, Gatersleben, Germany (www.traitgenetics.com). Moreover, a novel 135K Affymetrix array was used to genotype a subpanel of 183 genotypes from the whole genotypes panel [9,37] and this chip was designed by TraitGenetics GmbH. As a reference map, the ITMI-DH population [38,39] was used to anchor the SNP markers of the 90K and 35K chips. The 135K chip markers were genetically mapped on four different F2-populations and then physically anchored on the chromosome-based sequence of hexaploid wheat [40].
4.6. GWAS Analysis
To identify the MTA and QTL (i.e., genomic regions) for Fe concentration in wheat grains, association analyses were conducted between SNP markers and Fe data for each genotype in each year and BLUEs value. For SNP markers, quality control was applied by considering a minor allele frequency (MAF) ≤3% (equaling 11 varieties out of 369) with rejecting SNPs having missing values or heterozygosity ≥3%, resulting in 15,523 polymorphic SNP markers from both of the 90K iSELECT array and the 35K Affymetrix array and 28,710 polymorphic SNP markers from the 135K Affymetrix array, which were used for association analysis.
GWAS was carried out for Fe concentration data from both panels (whole and subpanel) over individual year plus BLUE values by applying the implemented mixed linear model (MLM) and principal component analysis (PCA) as a correction factor for population structure. Whole wheat genotypes panel was analyzed by using the combination of two SNP chips (90K and the 35K chips) based on their genetic reference map whereas, the subpanel was analyzed by the combination of 90K, 35K and 135K chips which were anchored based on physical locations. The purpose of combining the SNP chips was to increase the density of the used markers, achieving good mapping resolution and to further enhance the power of GWAS output within the germplasm panel. All the detected marker-trait associations (MTAs) above the threshold of −log10 (p-value) ≥ 3 where considered as a significant MTA.
GWAS analysis was computed based on a MLM and PCA which was used for population correction and stratification by using Genome Association and Prediction Integrated Tool (GAPIT) in R [41]. The appropriateness of the used model was evaluated through Q–Q plots that were obtained by plotting “expected−log10 (p-values)” on the x-axis and “observed−log10 (p-values)” on the y-axis. The population structure of the investigated genotypes panel was described in a previous study by Kollers et al. [42].
4.7. Blasting and Annotation
The significant SNP markers which defined the significant associations underlying GFeC trait were listed to obtain their annotation based on the newly released reference genome sequence of Chinese Spring by blasting their sequance against IWGSC RefSeq annotation v1.0 to detect potential candidate genes [43,44].
4.8. Genomic Prediction
4.8.1. GBLUP
We used GBLUP to impute GP for GFeC trait data by using Tassel version 5.2.10 [45]. In this model, we evaluated the prediction accuracy by using fivefold cross-validation with 20 iterations as implemented in Tassel software.
4.8.2. RR-BLUP and Bayes-Cπ
We evaluate the prediction ability with the two GS models that are ridge regression best linear unbiased prediction (RR-BLUP) and Bayes-Cπ [16,46]. For both models, GSs were implemented in R using a fivefold cross-validation as described in previous literature Jiang et al. [47]. Simply, all the individuals were randomly divided into five subsets, in which four of the five were used as estimation set and the remaining one were used as test set. After all the genotypic values of individuals were obtained, we calculate the prediction ability that is the correlation between observed and predicted values. The whole process was repeated 100 times and then the mean value was used as the final prediction ability.
5. Conclusions
This study characterized many lines of a diverse wheat panel for GFeCs to understand the natural diversity that exists for Fe grain trait and to identify potential genes that contribute to this phenotypic variation and to examine the prediction accuracy. Broad-sense heritability calculation revealed moderate variation that could be attributed to both genetic and environmental effects. Overall, the resources generated in this study can be used to identify suitable candidate genes for further validation analysis. Results of applying GP models to GFeC showed that the correlation between observed and predicted values was relatively moderate; therefore, it would be useful to study the effects of GxE interactions that may improve the predictability value.
Supplementary Materials
Supplementary Materials can be found at http://www.mdpi.com/1422-0067/20/1/76/s1.
Author Contributions
D.Z.A. performed the data analysis including genome-wide association scan, candidate genes identification, genomic prediction (GBLUP) and other statistical analysis. K.E. and N.v.W. participated in Fe concentration measurements. F.L. performed the genomic prediction analysis (rrBLUB and BGLR). K.P. and M.S.R. designed the experiment. M.S.R. conceived the experiment and participated in the result interpretation. D.Z.A. and M.S.R. wrote the manuscript. All authors read and approved the final manuscript.
Funding
The project was funded by internal financial support of IPK Gatersleben.
Acknowledgments
We would like to acknowledge Ahmad M. Alqudah for critically reading the manuscript, as well as Murukarthick Jayakodi for sharing the physical position of markers. The authors are thankful for Ellen Weiß and Yudelsy Antonia Tandron Moya for excellent technical assistance. The genotyping data were created in the frame of the projects VALID and SELECT (project numbers 0,314,947 and 0315949) funded by the Plant Biotechnology Program of the German Federal Ministry of Education and Research (BMBF).
Conflicts of Interest
The authors declare no conflict of interest.
References
- Lafiandra, D.; Riccardi, G.; Shewry, P.R. Improving cereal grain carbohydrates for diet and health. J. Cereal Sci. 2014, 59, 312–326. [Google Scholar] [CrossRef] [PubMed]
- Al Omari, D.Z.; Abdul-Hussain, S.S.; Ajo, R.Y. Germinated lupin (Lupinus albus) flour improves Arabic flat bread properties. Qual. Assur. Saf. Crops Foods 2016, 8, 57–63. [Google Scholar] [CrossRef]
- Alomari, D.Z.; Abdul-Hussain, S.S. Effect of Lupin Flour Supplementation on Chemical, Physical and Sensory Properties of Mediterranean Flat Bread. Int. J. Food Sci. Nutr. Eng. 2013, 3, 49–54. [Google Scholar] [CrossRef]
- Graham, R.D. Micronutrient Deficiencies in Crops and Their Global Significance. In Micronutrient Deficiencies in Global Crop Production; Alloway, B.J., Ed.; Springer: Dordrecht, The Netherlands, 2008; pp. 41–61. [Google Scholar]
- Bouis, H.E. Micronutrient fortification of plants through plant breeding: Can it improve nutrition in man at low cost? Proc. Nutr. Soc. 2007, 62, 403–411. [Google Scholar] [CrossRef]
- Bouis, H.E. Plant breeding: A new tool for fighting micronutrient malnutrition. J. Nutr. 2002, 132, 491S–494S. [Google Scholar] [CrossRef] [PubMed]
- Graham, R.; Senadhira, D.; Beebe, S.; Iglesias, C.; Monasterio, I. Breeding for micronutrient density in edible portions of staple food crops: Conventional approaches. Field Crops Res. 1999, 60, 57–80. [Google Scholar] [CrossRef]
- Alomari, D.Z.; Eggert, K.; von Wiren, N.; Pillen, K.; Roder, M.S. Genome-Wide Association Study of Calcium Accumulation in Grains of European Wheat Cultivars. Front. Plant Sci. 2017, 8, 1797. [Google Scholar] [CrossRef]
- Alomari, D.Z.; Eggert, K.; von Wirén, N.; Alqudah, A.M.; Polley, A.; Plieske, J.; Ganal, M.W.; Pillen, K.; Röder, M.S. Identifying Candidate Genes for Enhancing Grain Zn Concentration in Wheat. Front. Plant Sci. 2018, 9. [Google Scholar] [CrossRef]
- Peleg, Z.; Cakmak, I.; Ozturk, L.; Yazici, A.; Jun, Y.; Budak, H.; Korol, A.B.; Fahima, T.; Saranga, Y. Quantitative trait loci conferring grain mineral nutrient concentrations in durum wheat x wild emmer wheat RIL population. Theor. Appl. Genet. 2009, 119, 353–369. [Google Scholar] [CrossRef] [PubMed]
- Srinivasa, J.; Arun, B.; Mishra, V.K.; Singh, G.P.; Velu, G.; Babu, R.; Vasistha, N.K.; Joshi, A.K. Zinc and iron concentration QTL mapped in a Triticum spelta × T. aestivum cross. Theor. Appl. Genet. 2014, 127, 1643–1651. [Google Scholar] [CrossRef]
- Gorafi, Y.S.A.; Ishii, T.; Kim, J.-S.; Elbashir, A.A.E.; Tsujimoto, H. Genetic variation and association mapping of grain iron and zinc contents in synthetic hexaploid wheat germplasm. Plant Genet. Resour. Charact. Utili. 2016, 16, 9–17. [Google Scholar] [CrossRef]
- Bhatta, M.; Baenziger, P.S.; Waters, B.M.; Poudel, R.; Belamkar, V.; Poland, J.; Morgounov, A. Genome-Wide Association Study Reveals Novel Genomic Regions Associated with 10 Grain Minerals in Synthetic Hexaploid Wheat. Int. J. Mol. Sci. 2018, 19, 3237. [Google Scholar] [CrossRef] [PubMed]
- Anuradha, N.; Satyavathi, C.T.; Bharadwaj, C.; Nepolean, T.; Sankar, S.M.; Singh, S.P.; Meena, M.C.; Singhal, T.; Srivastava, R.K. Deciphering Genomic Regions for High Grain Iron and Zinc Content Using Association Mapping in Pearl Millet. Front. Plant Sci. 2017, 8, 412. [Google Scholar] [CrossRef] [PubMed]
- Upadhyaya, H.D.; Bajaj, D.; Das, S.; Kumar, V.; Gowda, C.L.; Sharma, S.; Tyagi, A.K.; Parida, S.K. Genetic dissection of seed-iron and zinc concentrations in chickpea. Sci. Rep. 2016, 6, 24050. [Google Scholar] [CrossRef] [PubMed]
- Meuwissen, T.H.E.; Hayes, B.J.; Goddard, M.E. Prediction of Total Genetic Value Using Genome-Wide Dense Marker Maps. Genetics 2001, 157, 1819–1829. [Google Scholar] [PubMed]
- Roos, A.; Boron, W.F. Intracellular pH transients in rat diaphragm muscle measured with DMO. Am. J. Physiol. 1978, 235, C49–C54. [Google Scholar] [CrossRef] [PubMed]
- Jia, C.; Zhao, F.; Wang, X.; Han, J.; Zhao, H.; Liu, G.; Wang, Z. Genomic Prediction for 25 Agronomic and Quality Traits in Alfalfa (Medicago sativa). Front. Plant Sci. 2018, 9, 1220. [Google Scholar] [CrossRef]
- Manickavelu, A.; Hattori, T.; Yamaoka, S.; Yoshimura, K.; Kondou, Y.; Onogi, A.; Matsui, M.; Iwata, H.; Ban, T. Genetic Nature of Elemental Contents in Wheat Grains and Its Genomic Prediction: Toward the Effective Use of Wheat Landraces from Afghanistan. PLoS ONE 2017, 12, e0169416. [Google Scholar] [CrossRef]
- Velu, G.; Crossa, J.; Singh, R.P.; Hao, Y.; Dreisigacker, S.; Perez-Rodriguez, P.; Joshi, A.K.; Chatrath, R.; Gupta, V.; Balasubramaniam, A.; et al. Genomic prediction for grain zinc and iron concentrations in spring wheat. Theor. Appl. Genet. 2016, 129, 1595–1605. [Google Scholar] [CrossRef]
- Uauy, C.; Distelfeld, A.; Fahima, T.; Blechl, A.; Dubcovsky, J. A NAC Gene regulating senescence improves grain protein, zinc, and iron content in wheat. Science 2006, 314, 1298–1301. [Google Scholar] [CrossRef]
- Chrispeels, M.J.; Crawford, N.M.; Schroeder, J.I. Proteins for transport of water and mineral nutrients across the membranes of plant cells. Plant Cell 1999, 11, 661–676. [Google Scholar] [CrossRef]
- Bouis, H.E.; Welch, R.M. Biofortification—A Sustainable Agricultural Strategy for Reducing Micronutrient Malnutrition in the Global South. Crop Sci. 2010, 50, S-20. [Google Scholar] [CrossRef]
- Tiwari, V.K.; Rawat, N.; Chhuneja, P.; Neelam, K.; Aggarwal, R.; Randhawa, G.S.; Dhaliwal, H.S.; Keller, B.; Singh, K. Mapping of Quantitative Trait Loci for Grain Iron and Zinc Concentration in Diploid A Genome Wheat. J. Hered. 2009, 100, 771–776. [Google Scholar] [CrossRef] [PubMed]
- Morgounov, A.; Gómez-Becerra, H.F.; Abugalieva, A.; Dzhunusova, M.; Yessimbekova, M.; Muminjanov, H.; Zelenskiy, Y.; Ozturk, L.; Cakmak, I. Iron and zinc grain density in common wheat grown in Central Asia. Euphytica 2007, 155, 193–203. [Google Scholar] [CrossRef]
- Pandey, A.; Khan, M.K.; Hakki, E.E.; Thomas, G.; Hamurcu, M.; Gezgin, S.; Gizlenci, O.; Akkaya, M.S. Assessment of genetic variability for grain nutrients from diverse regions: Potential for wheat improvement. Springerplus 2016, 5, 1912. [Google Scholar] [CrossRef]
- Khokhar, J.S.; Sareen, S.; Tyagi, B.S.; Singh, G.; Wilson, L.; King, I.P.; Young, S.D.; Broadley, M.R. Variation in grain Zn concentration, and the grain ionome, in field-grown Indian wheat. PLoS ONE 2018, 13, e0192026. [Google Scholar] [CrossRef]
- Rellán-Álvarez, R.; Giner-Martínez-Sierra, J.; Orduna, J.; Orera, I.; Rodríguez-Castrillón, J.Á.; García-Alonso, J.I.; Abadía, J.; Álvarez-Fernández, A. Identification of a Tri-Iron(III), Tri-Citrate Complex in the Xylem Sap of Iron-Deficient Tomato Resupplied with Iron: New Insights into Plant Iron Long-Distance Transport. Plant Cell Physiol. 2010, 51, 91–102. [Google Scholar] [CrossRef]
- Deinlein, U.; Weber, M.; Schmidt, H.; Rensch, S.; Trampczynska, A.; Hansen, T.H.; Husted, S.; Schjoerring, J.K.; Talke, I.N.; Krämer, U.; et al. Elevated Nicotianamine Levels in Arabidopsis Halleri Roots Play a Key Role in Zinc Hyperaccumulation. Plant Cell 2012, 24, 708. [Google Scholar] [CrossRef]
- Krishnappa, G.; Singh, A.M.; Chaudhary, S.; Ahlawat, A.K.; Singh, S.K.; Shukla, R.B.; Jaiswal, J.P.; Singh, G.P.; Solanki, I.S. Molecular mapping of the grain iron and zinc concentration, protein content and thousand kernel weight in wheat (Triticum aestivum L.). PLoS ONE 2017, 12, e0174972. [Google Scholar] [CrossRef]
- Ricachenevsky, F.K.; Menguer, P.K.; Sperotto, R.A. kNACking on heaven’s door: How important are NAC transcription factors for leaf senescence and Fe/Zn remobilization to seeds? Front. Plant Sci. 2013, 4, 226. [Google Scholar] [CrossRef]
- Nadolska-Orczyk, A.; Rajchel, I.K.; Orczyk, W.; Gasparis, S. Major genes determining yield-related traits in wheat and barley. Theor. Appl. Genet. 2017, 130, 1081–1098. [Google Scholar] [CrossRef] [PubMed]
- Schroeder, J.I.; Delhaize, E.; Frommer, W.B.; Guerinot, M.L.; Harrison, M.J.; Herrera-Estrella, L.; Horie, T.; Kochian, L.V.; Munns, R.; Nishizawa, N.K.; et al. Using membrane transporters to improve crops for sustainable food production. Nature 2013, 497, 60–66. [Google Scholar] [CrossRef] [PubMed]
- Yu, J.; Pressoir, G.; Briggs, W.H.; Vroh Bi, I.; Yamasaki, M.; Doebley, J.F.; McMullen, M.D.; Gaut, B.S.; Nielsen, D.M.; Holland, J.B.; et al. A unified mixed-model method for association mapping that accounts for multiple levels of relatedness. Nat. Genet. 2006, 38, 203–208. [Google Scholar] [CrossRef] [PubMed]
- Wang, S.; Wong, D.; Forrest, K.; Allen, A.; Chao, S.; Huang, B.E.; Maccaferri, M.; Salvi, S.; Milner, S.G.; Cattivelli, L.; et al. Characterization of polyploid wheat genomic diversity using a high-density 90,000 single nucleotide polymorphism array. Plant Biotechnol. J. 2014, 12, 787–796. [Google Scholar] [CrossRef] [PubMed]
- Allen, A.M.; Winfield, M.O.; Burridge, A.J.; Downie, R.C.; Benbow, H.R.; Barker, G.L.; Wilkinson, P.A.; Coghill, J.; Waterfall, C.; Davassi, A.; et al. Characterization of a Wheat Breeders’ Array suitable for high-throughput SNP genotyping of global accessions of hexaploid bread wheat (Triticum aestivum). Plant Biotechnol. J. 2017, 15, 390–401. [Google Scholar] [CrossRef]
- Zanke, C.D.; Rodemann, B.; Ling, J.; Muqaddasi, Q.H.; Plieske, J.; Polley, A.; Kollers, S.; Ebmeyer, E.; Korzun, V.; Argillier, O.; et al. Genome-wide association mapping of resistance to eyespot disease (Pseudocercosporella herpotrichoides) in European winter wheat (Triticum aestivum L.) and fine-mapping of Pch1. TAG. Theor. Appl. Genet. 2017, 130, 505–514. [Google Scholar] [CrossRef] [PubMed]
- Poland, J.A.; Brown, P.J.; Sorrells, M.E.; Jannink, J.L. Development of high-density genetic maps for barley and wheat using a novel two-enzyme genotyping-by-sequencing approach. PLoS ONE 2012, 7, e32253. [Google Scholar] [CrossRef]
- Sorrells, M.E.; Gustafson, J.P.; Somers, D.; Chao, S.; Benscher, D.; Guedira-Brown, G.; Huttner, E.; Kilian, A.; McGuire, P.E.; Ross, K.; et al. Reconstruction of the synthetic W7984 x Opata M85 wheat reference population. Genome 2011, 54, 875–882. [Google Scholar] [CrossRef]
- Appels, R.; Eversole, K.; Feuillet, C.; Keller, B.; Rogers, J.; Stein, N.; Pozniak, C.J.; Stein, N.; Choulet, F.; Distelfeld, A.; et al. Shifting the limits in wheat research and breeding using a fully annotated reference genome. Science 2018, 361. [Google Scholar] [CrossRef]
- Lipka, A.E.; Tian, F.; Wang, Q.; Peiffer, J.; Li, M.; Bradbury, P.J.; Gore, M.A.; Buckler, E.S.; Zhang, Z. GAPIT: Genome association and prediction integrated tool. Bioinformatics 2012, 28, 2397–2399. [Google Scholar] [CrossRef]
- Kollers, S.; Rodemann, B.; Ling, J.; Korzun, V.; Ebmeyer, E.; Argillier, O.; Hinze, M.; Plieske, J.; Kulosa, D.; Ganal, M.W.; et al. Whole genome association mapping of Fusarium head blight resistance in European winter wheat (Triticum aestivum L.). PLoS ONE 2013, 8, e57500. [Google Scholar] [CrossRef] [PubMed]
- BLAST. Available online: https://wheat-urgi.versailles.inra.fr/Seq-Repository/BLAST (accessed on 22 November 2018).
- IWGSC Reference Sequence v1.0 Browser Now Available at URGI. Available online: https://www.wheatgenome.org/News/Latest-news/IWGSC-Reference-Sequence-v1.0-browser-now-available-at-URGI (accessed on 22 November 2018).
- Bradbury, P.J.; Zhang, Z.; Kroon, D.E.; Casstevens, T.M.; Ramdoss, Y.; Buckler, E.S. TASSEL: Software for association mapping of complex traits in diverse samples. Bioinformatics 2007, 23, 2633–2635. [Google Scholar] [CrossRef] [PubMed]
- Habier, D.; Fernando, R.L.; Kizilkaya, K.; Garrick, D.J. Extension of the bayesian alphabet for genomic selection. BMC Bioinform. 2011, 12, 186. [Google Scholar] [CrossRef] [PubMed]
- Jiang, Y.; Zhao, Y.; Rodemann, B.; Plieske, J.; Kollers, S.; Korzun, V.; Ebmeyer, E.; Argillier, O.; Hinze, M.; Ling, J.; et al. Potential and limits to unravel the genetic architecture and predict the variation of Fusarium head blight resistance in European winter wheat (Triticum aestivum L.). Heredity 2014, 114, 318. [Google Scholar] [CrossRef] [PubMed]
© 2018 by the authors. Licensee MDPI, Basel, Switzerland. This article is an open access article distributed under the terms and conditions of the Creative Commons Attribution (CC BY) license (http://creativecommons.org/licenses/by/4.0/).