Integrated Computational Analysis Highlights unique miRNA Signatures in the Subventricular Zone and Striatum of GM2 Gangliosidosis Animal Models


 and
and
Abstract
: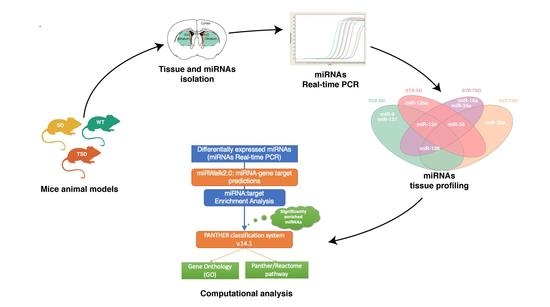
1. Introduction
2. Results
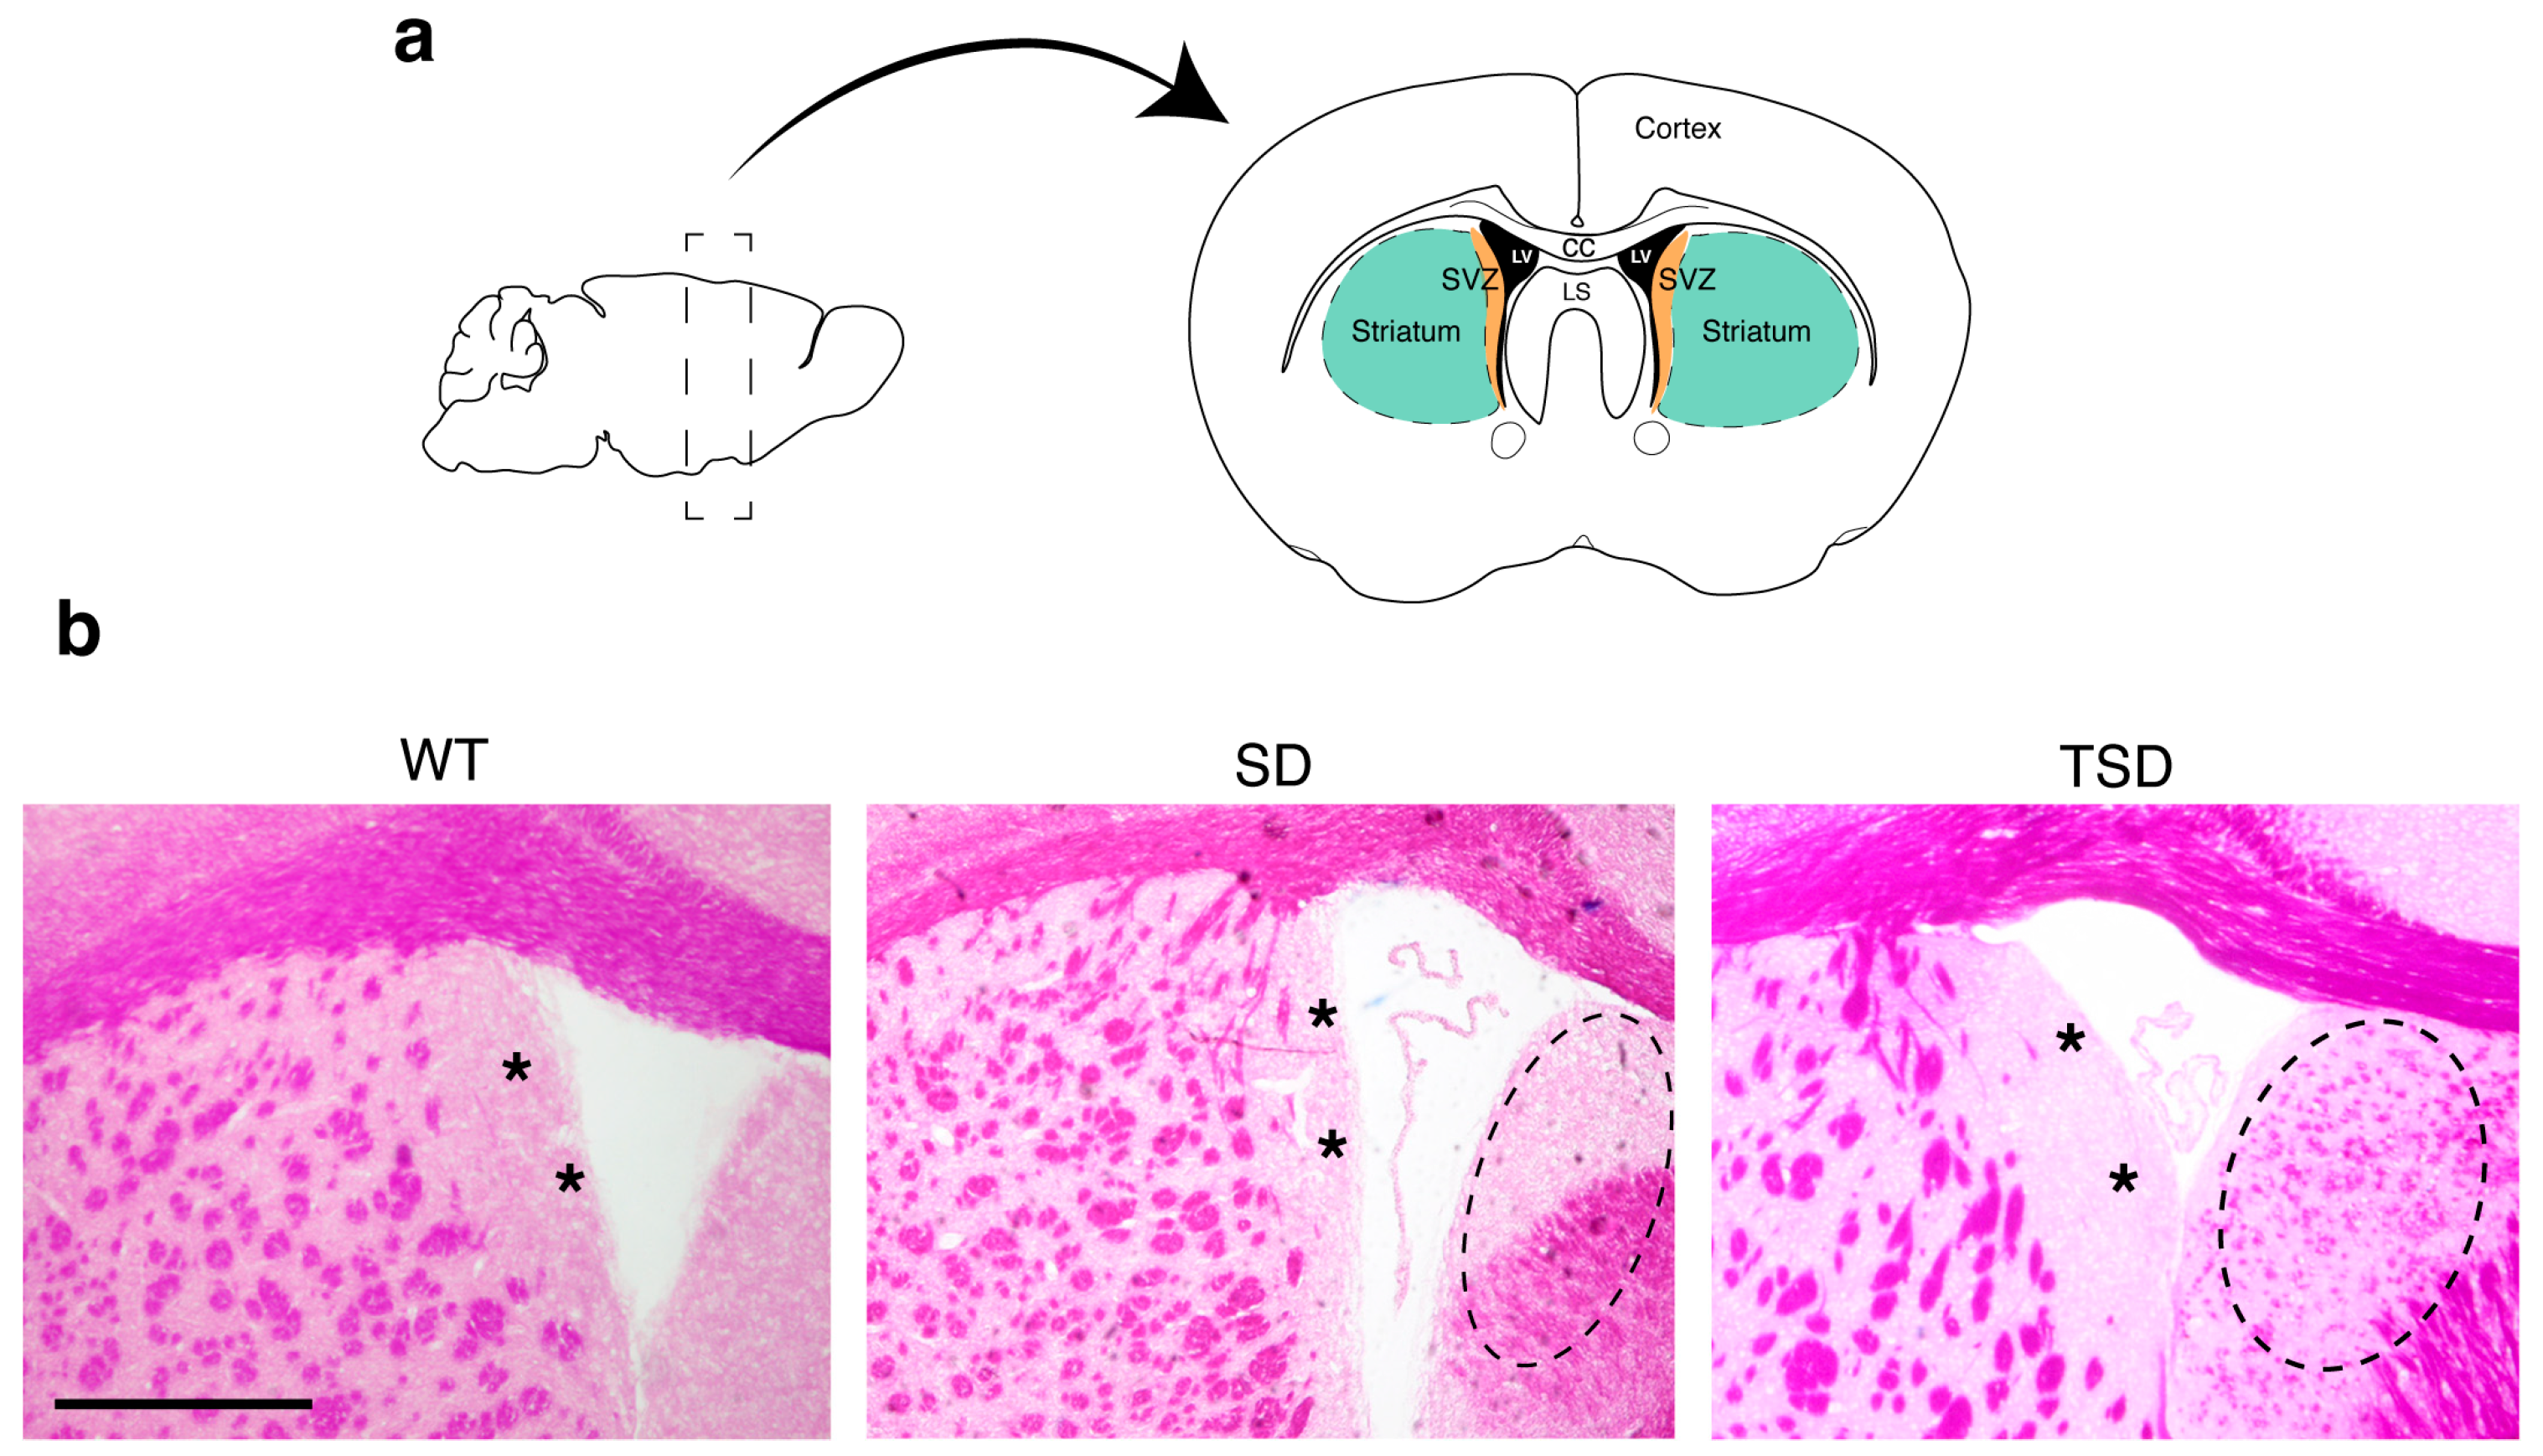
2.1. Isolation of SVZ and STR tissues from the brain of adult mice
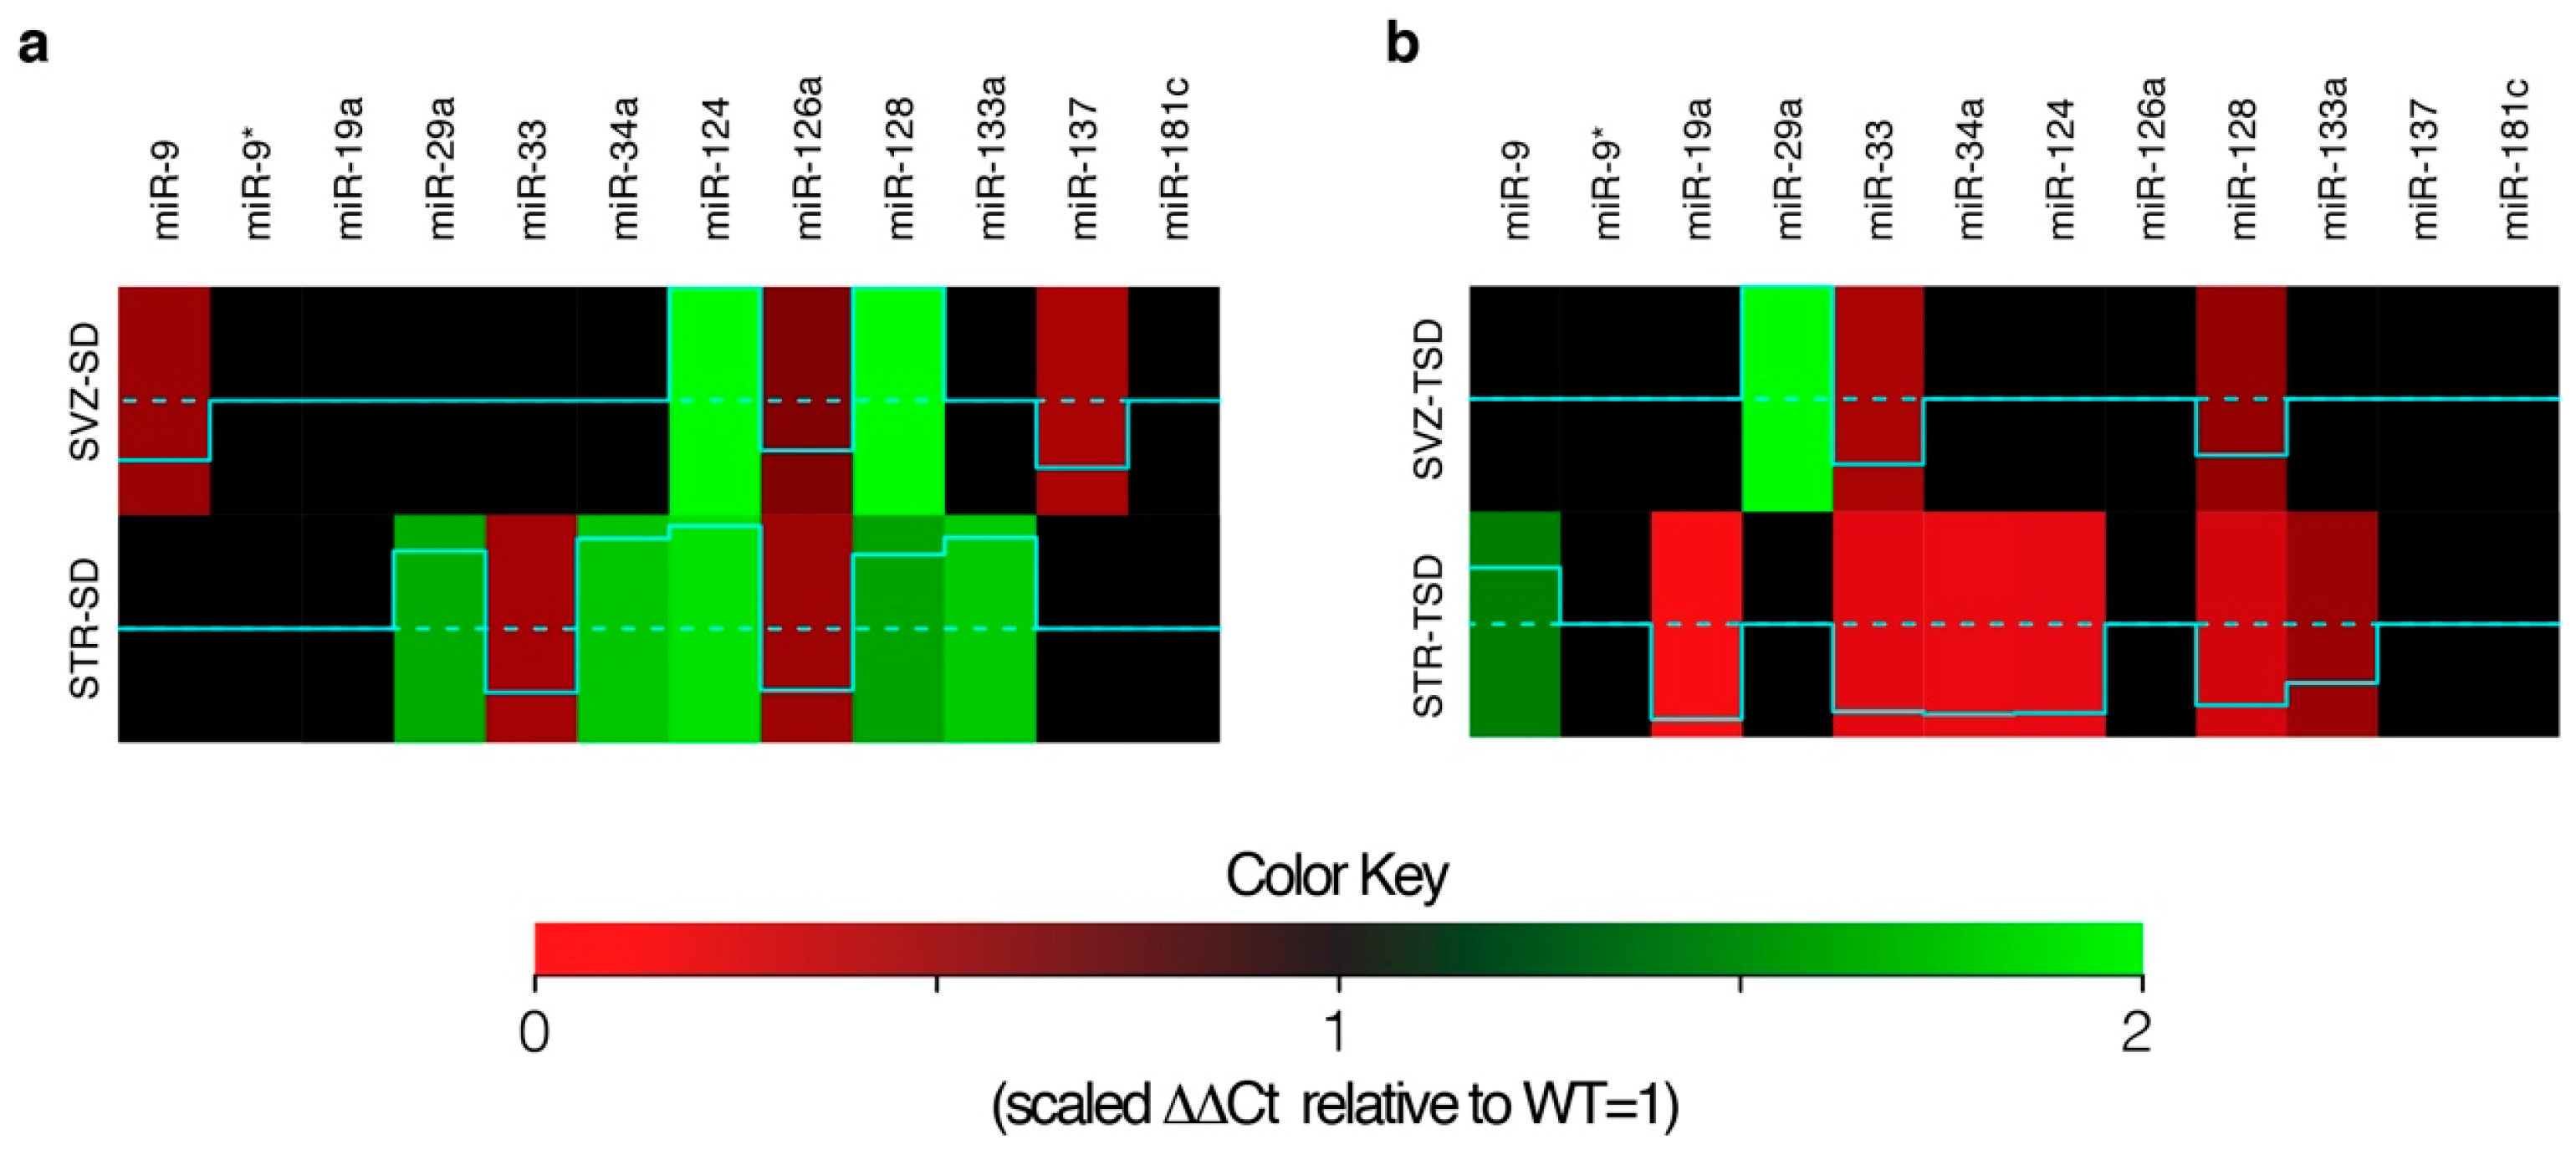
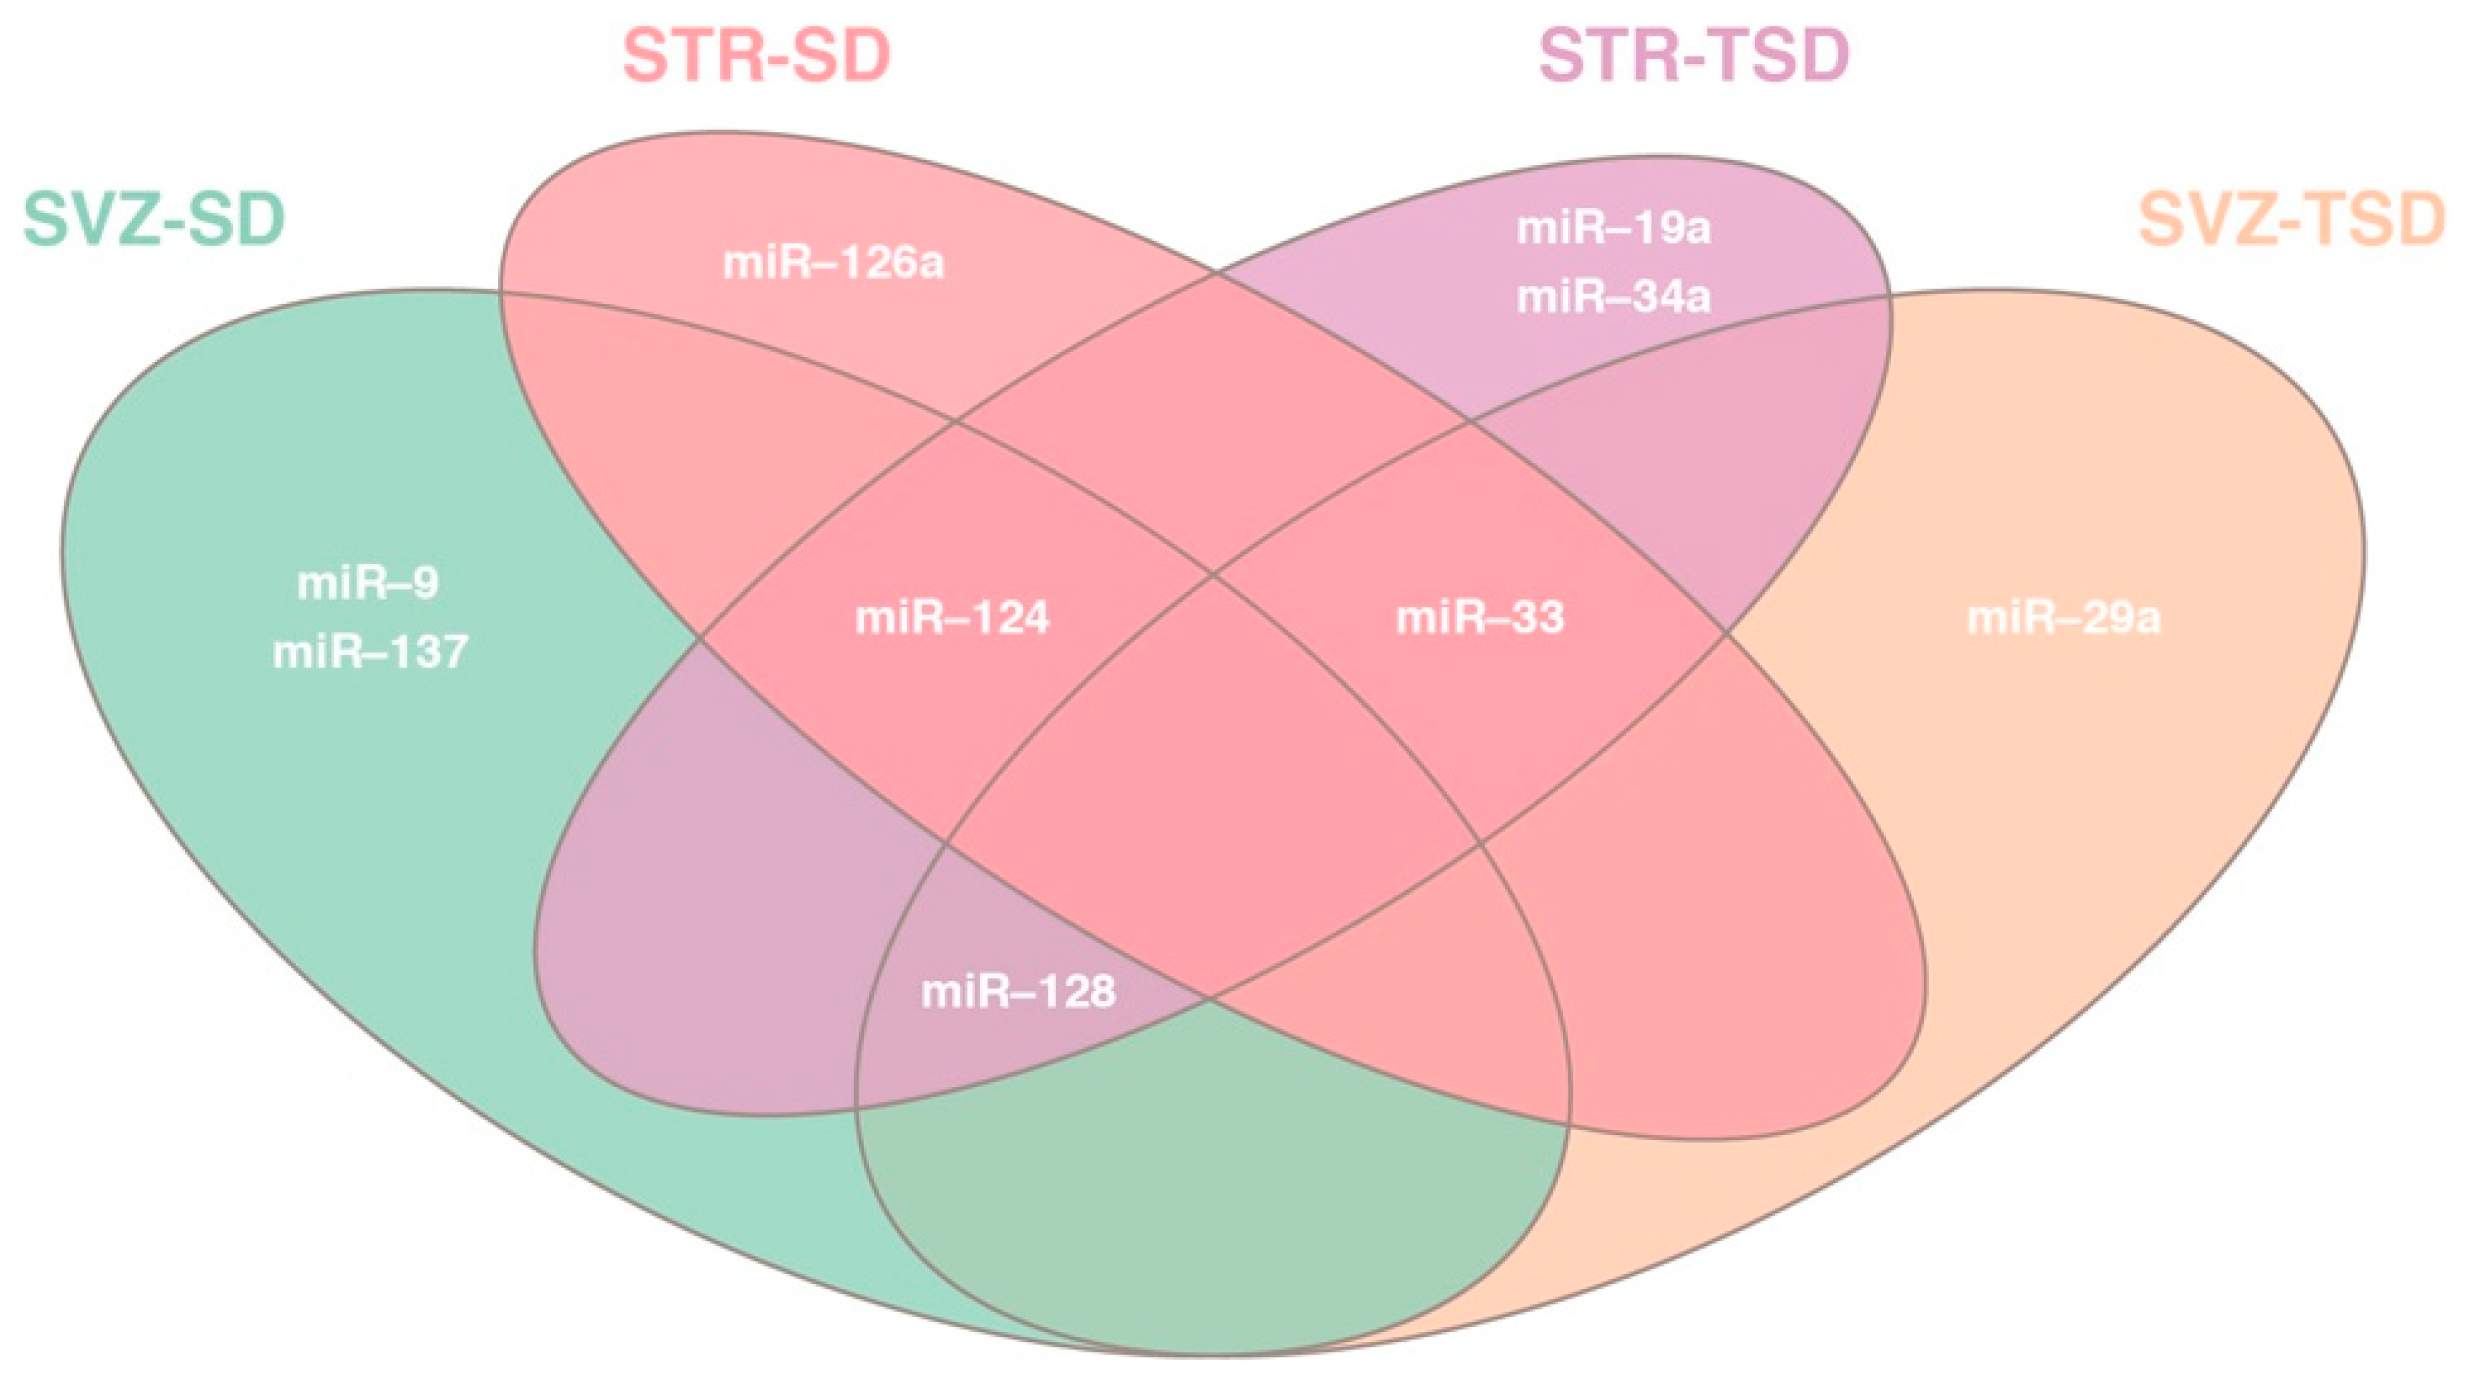
2.2. Differential miRNA expression analysis in SVZ and STR of SD and TSD mice
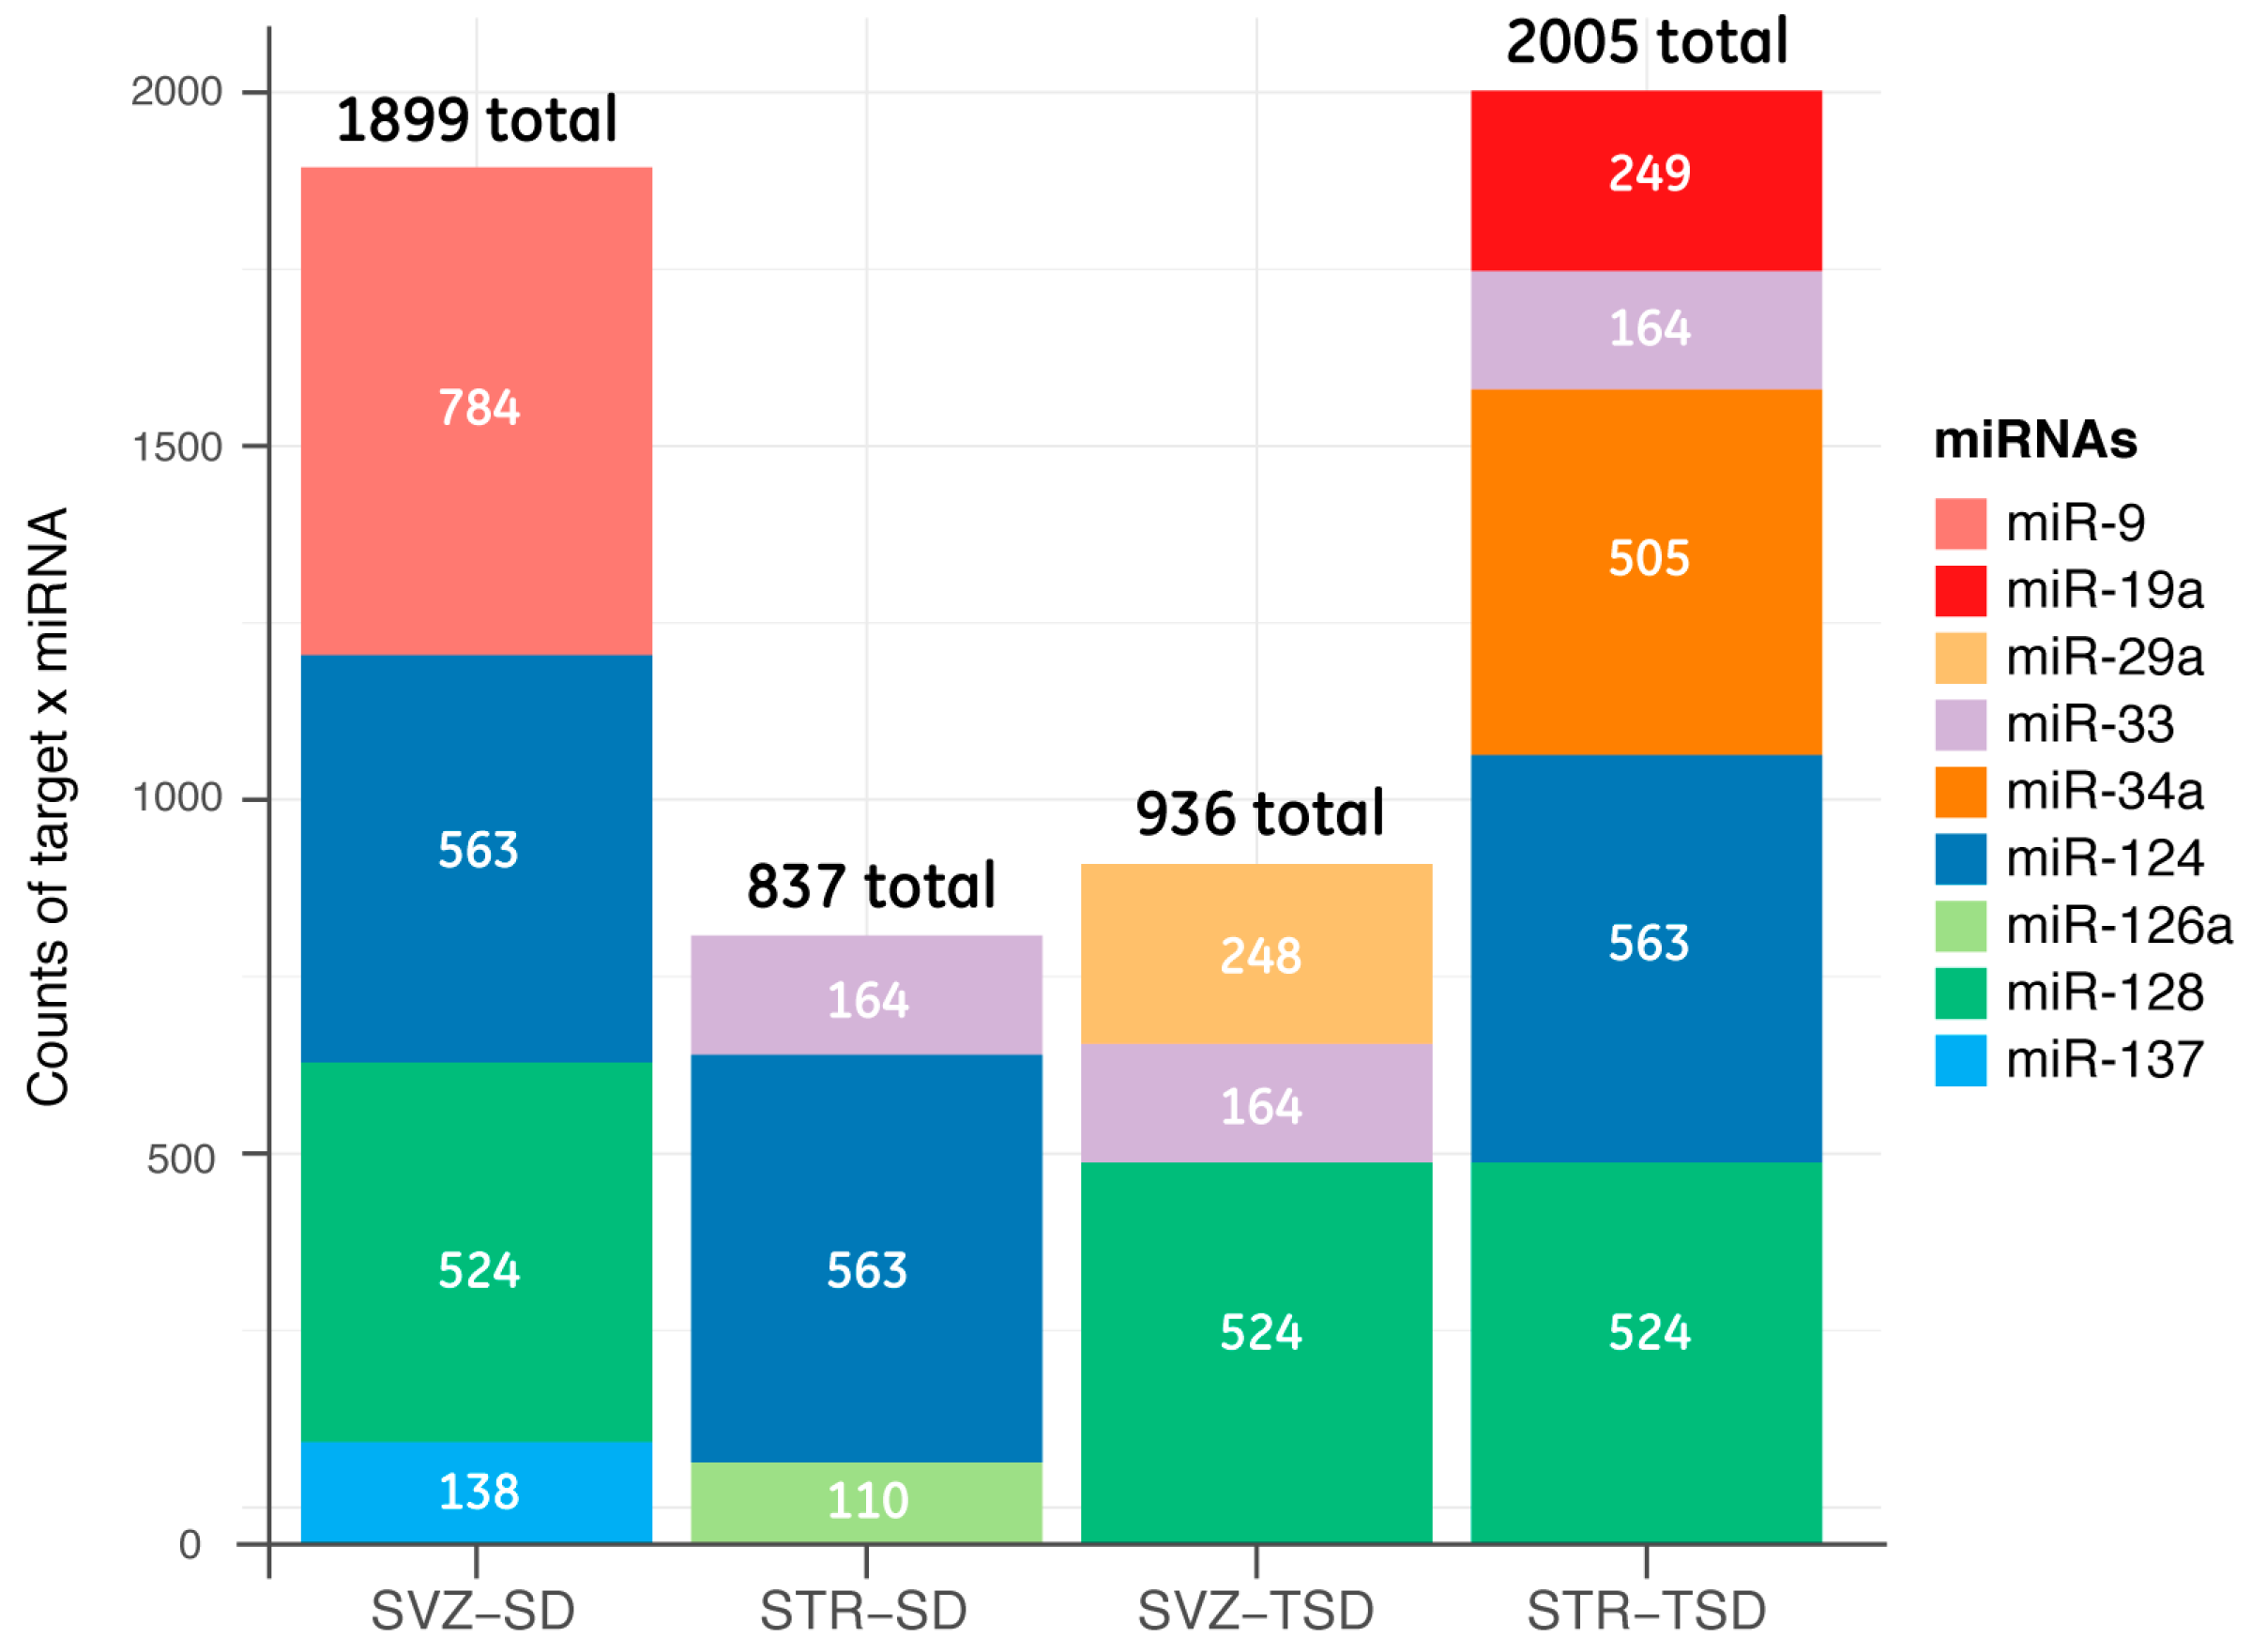
2.3. Target prediction and gene list analysis in SVZ and STR of SD and TSD mice
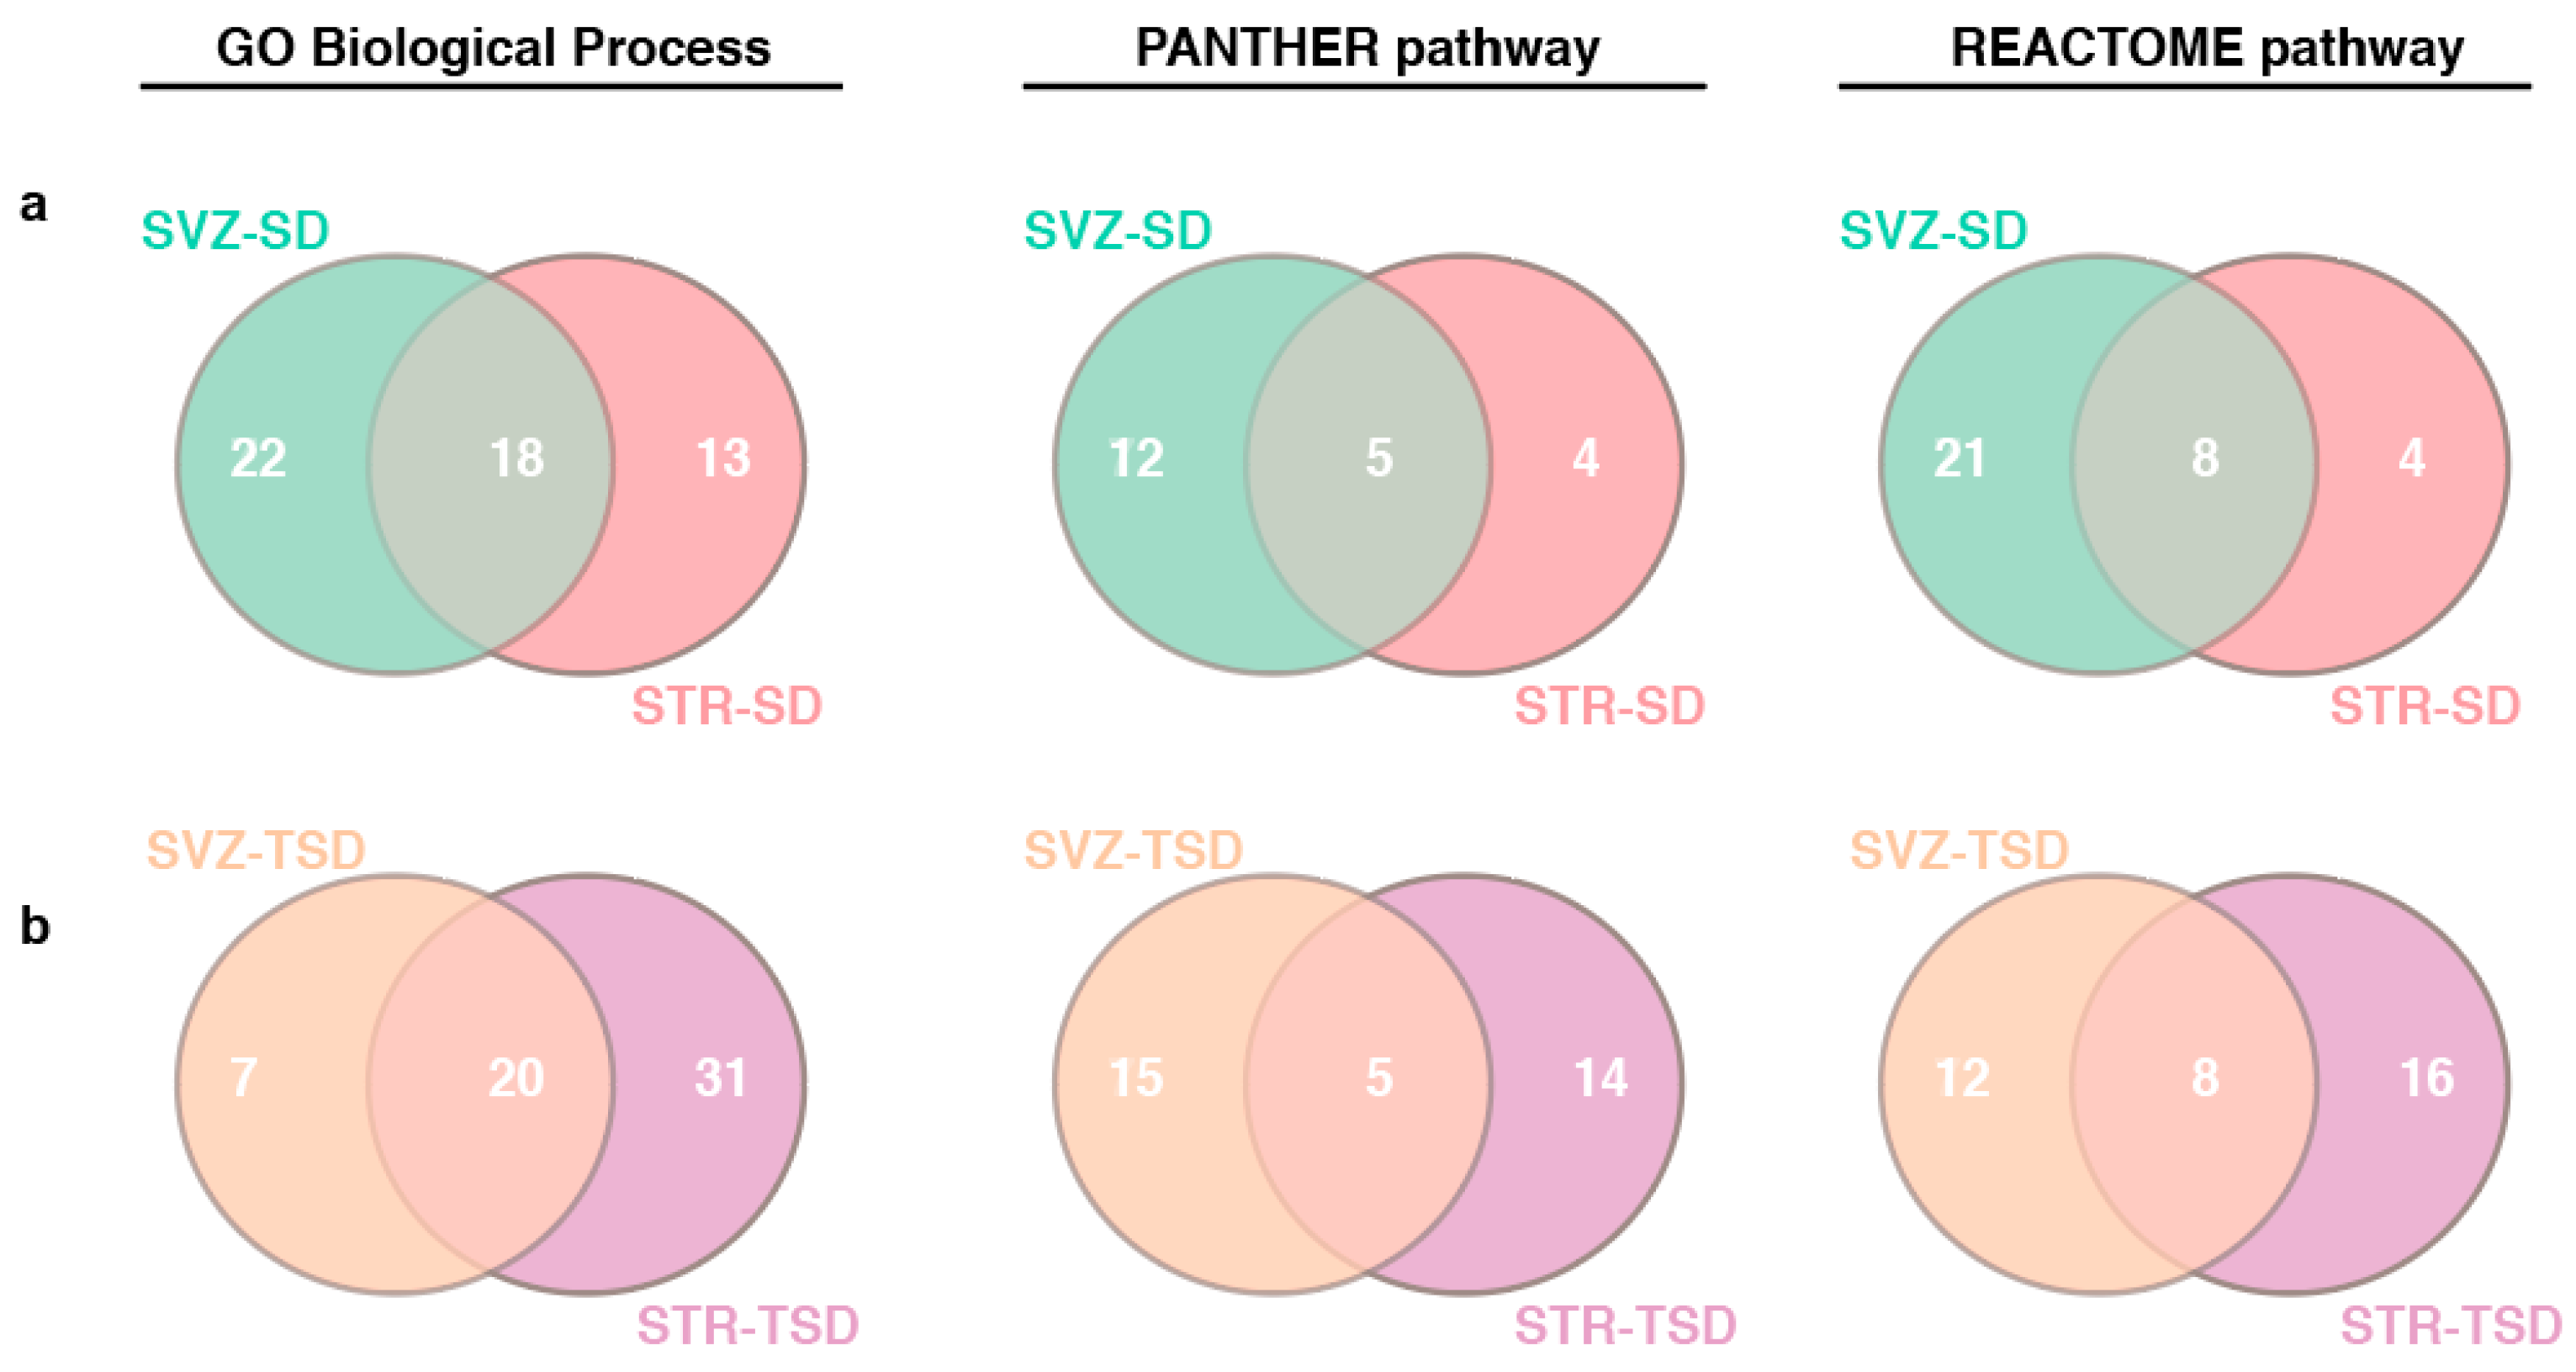
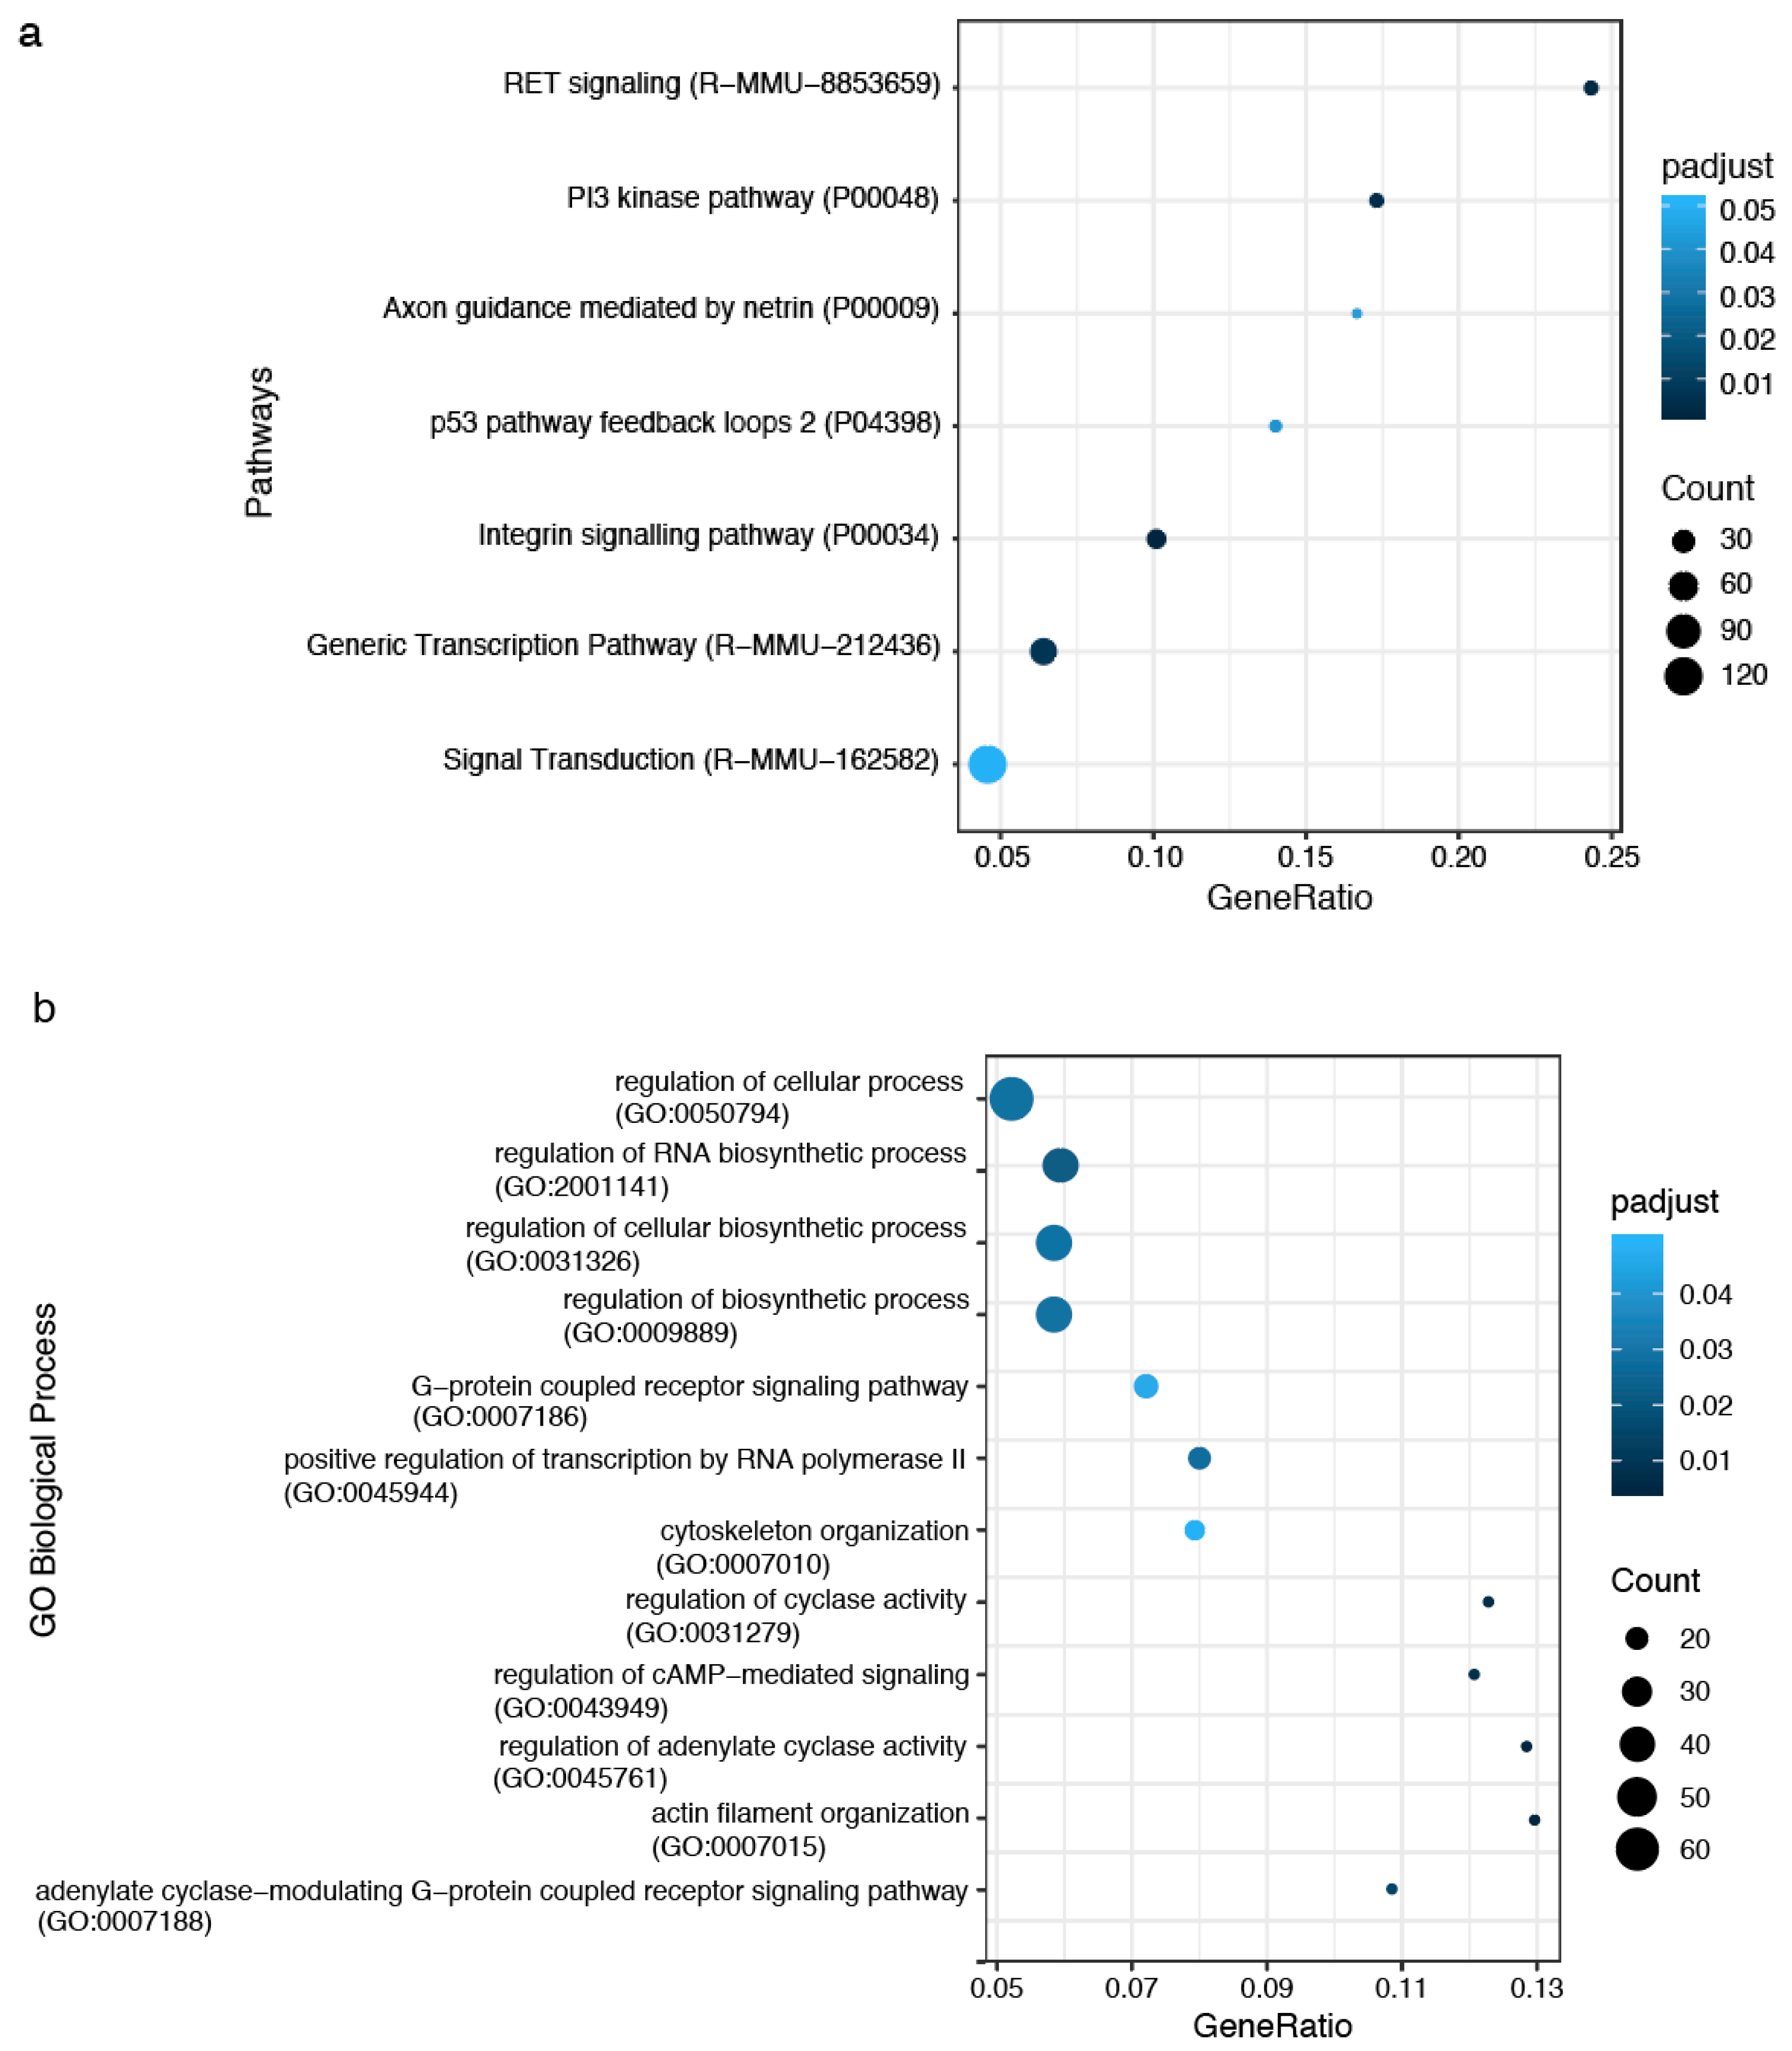
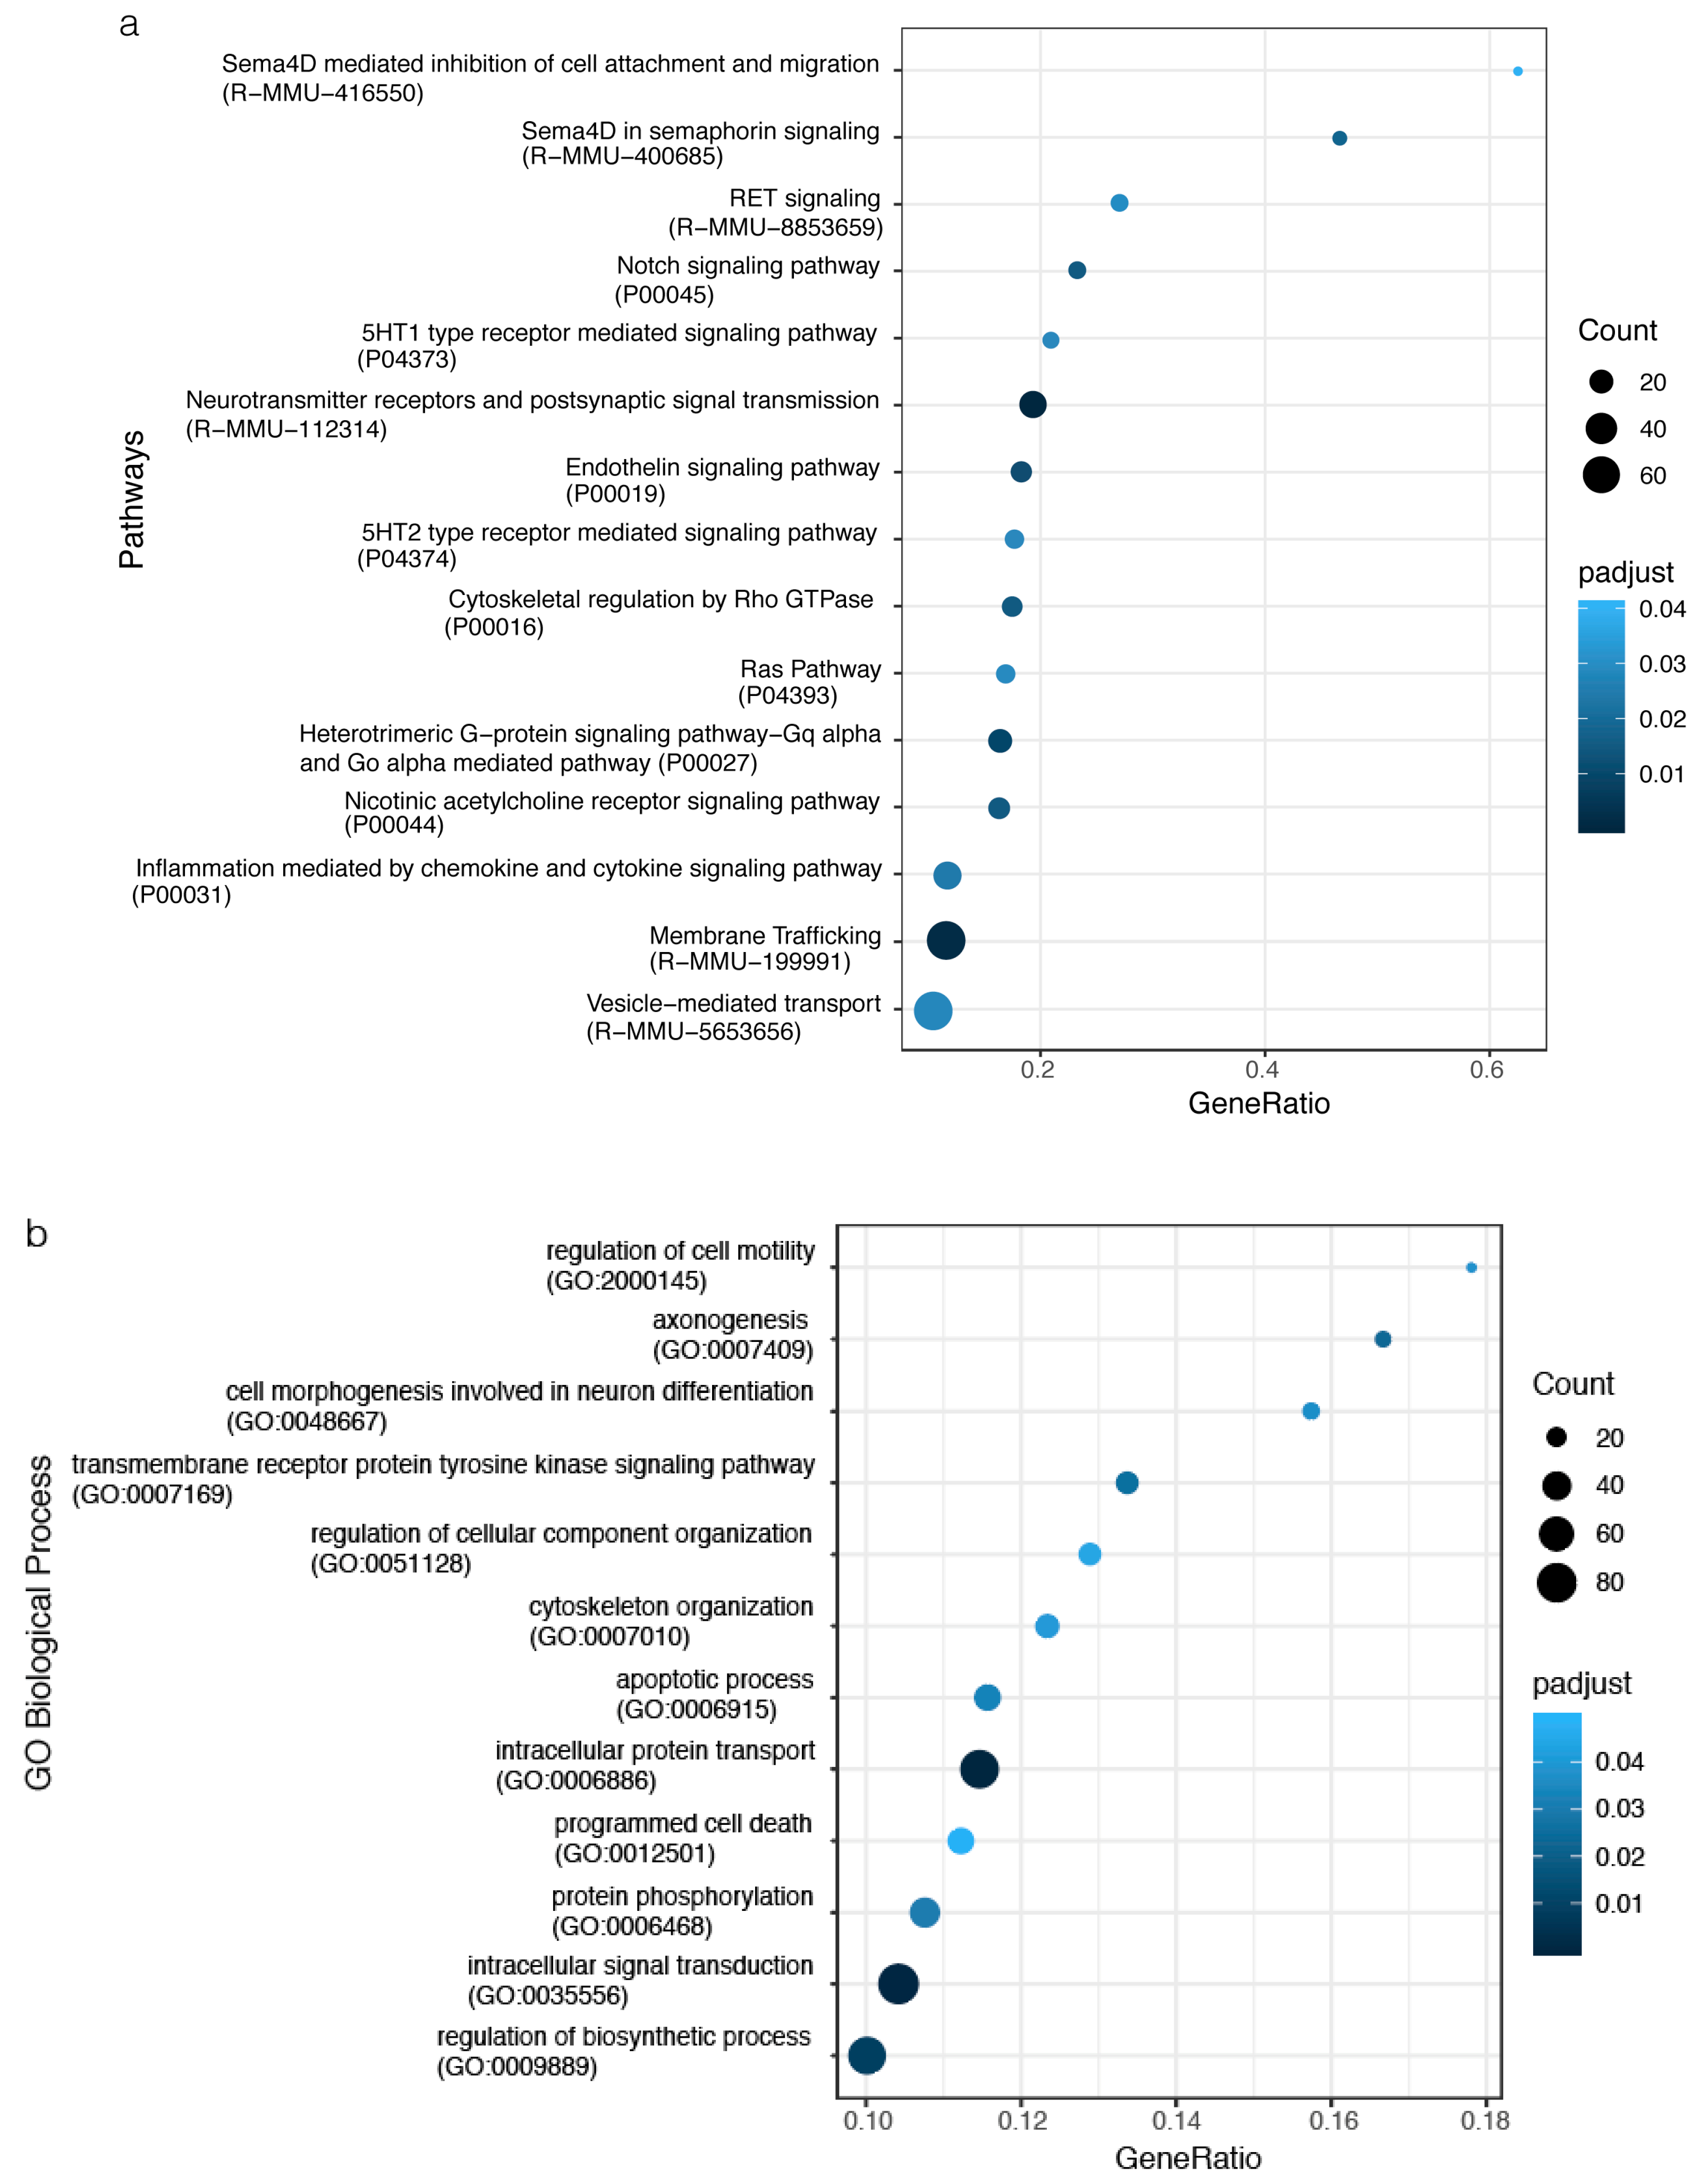
2.4. The impact of miRNA meta-signature on cellular pathways and biological processes in SVZ and STR of SD and TSD mice
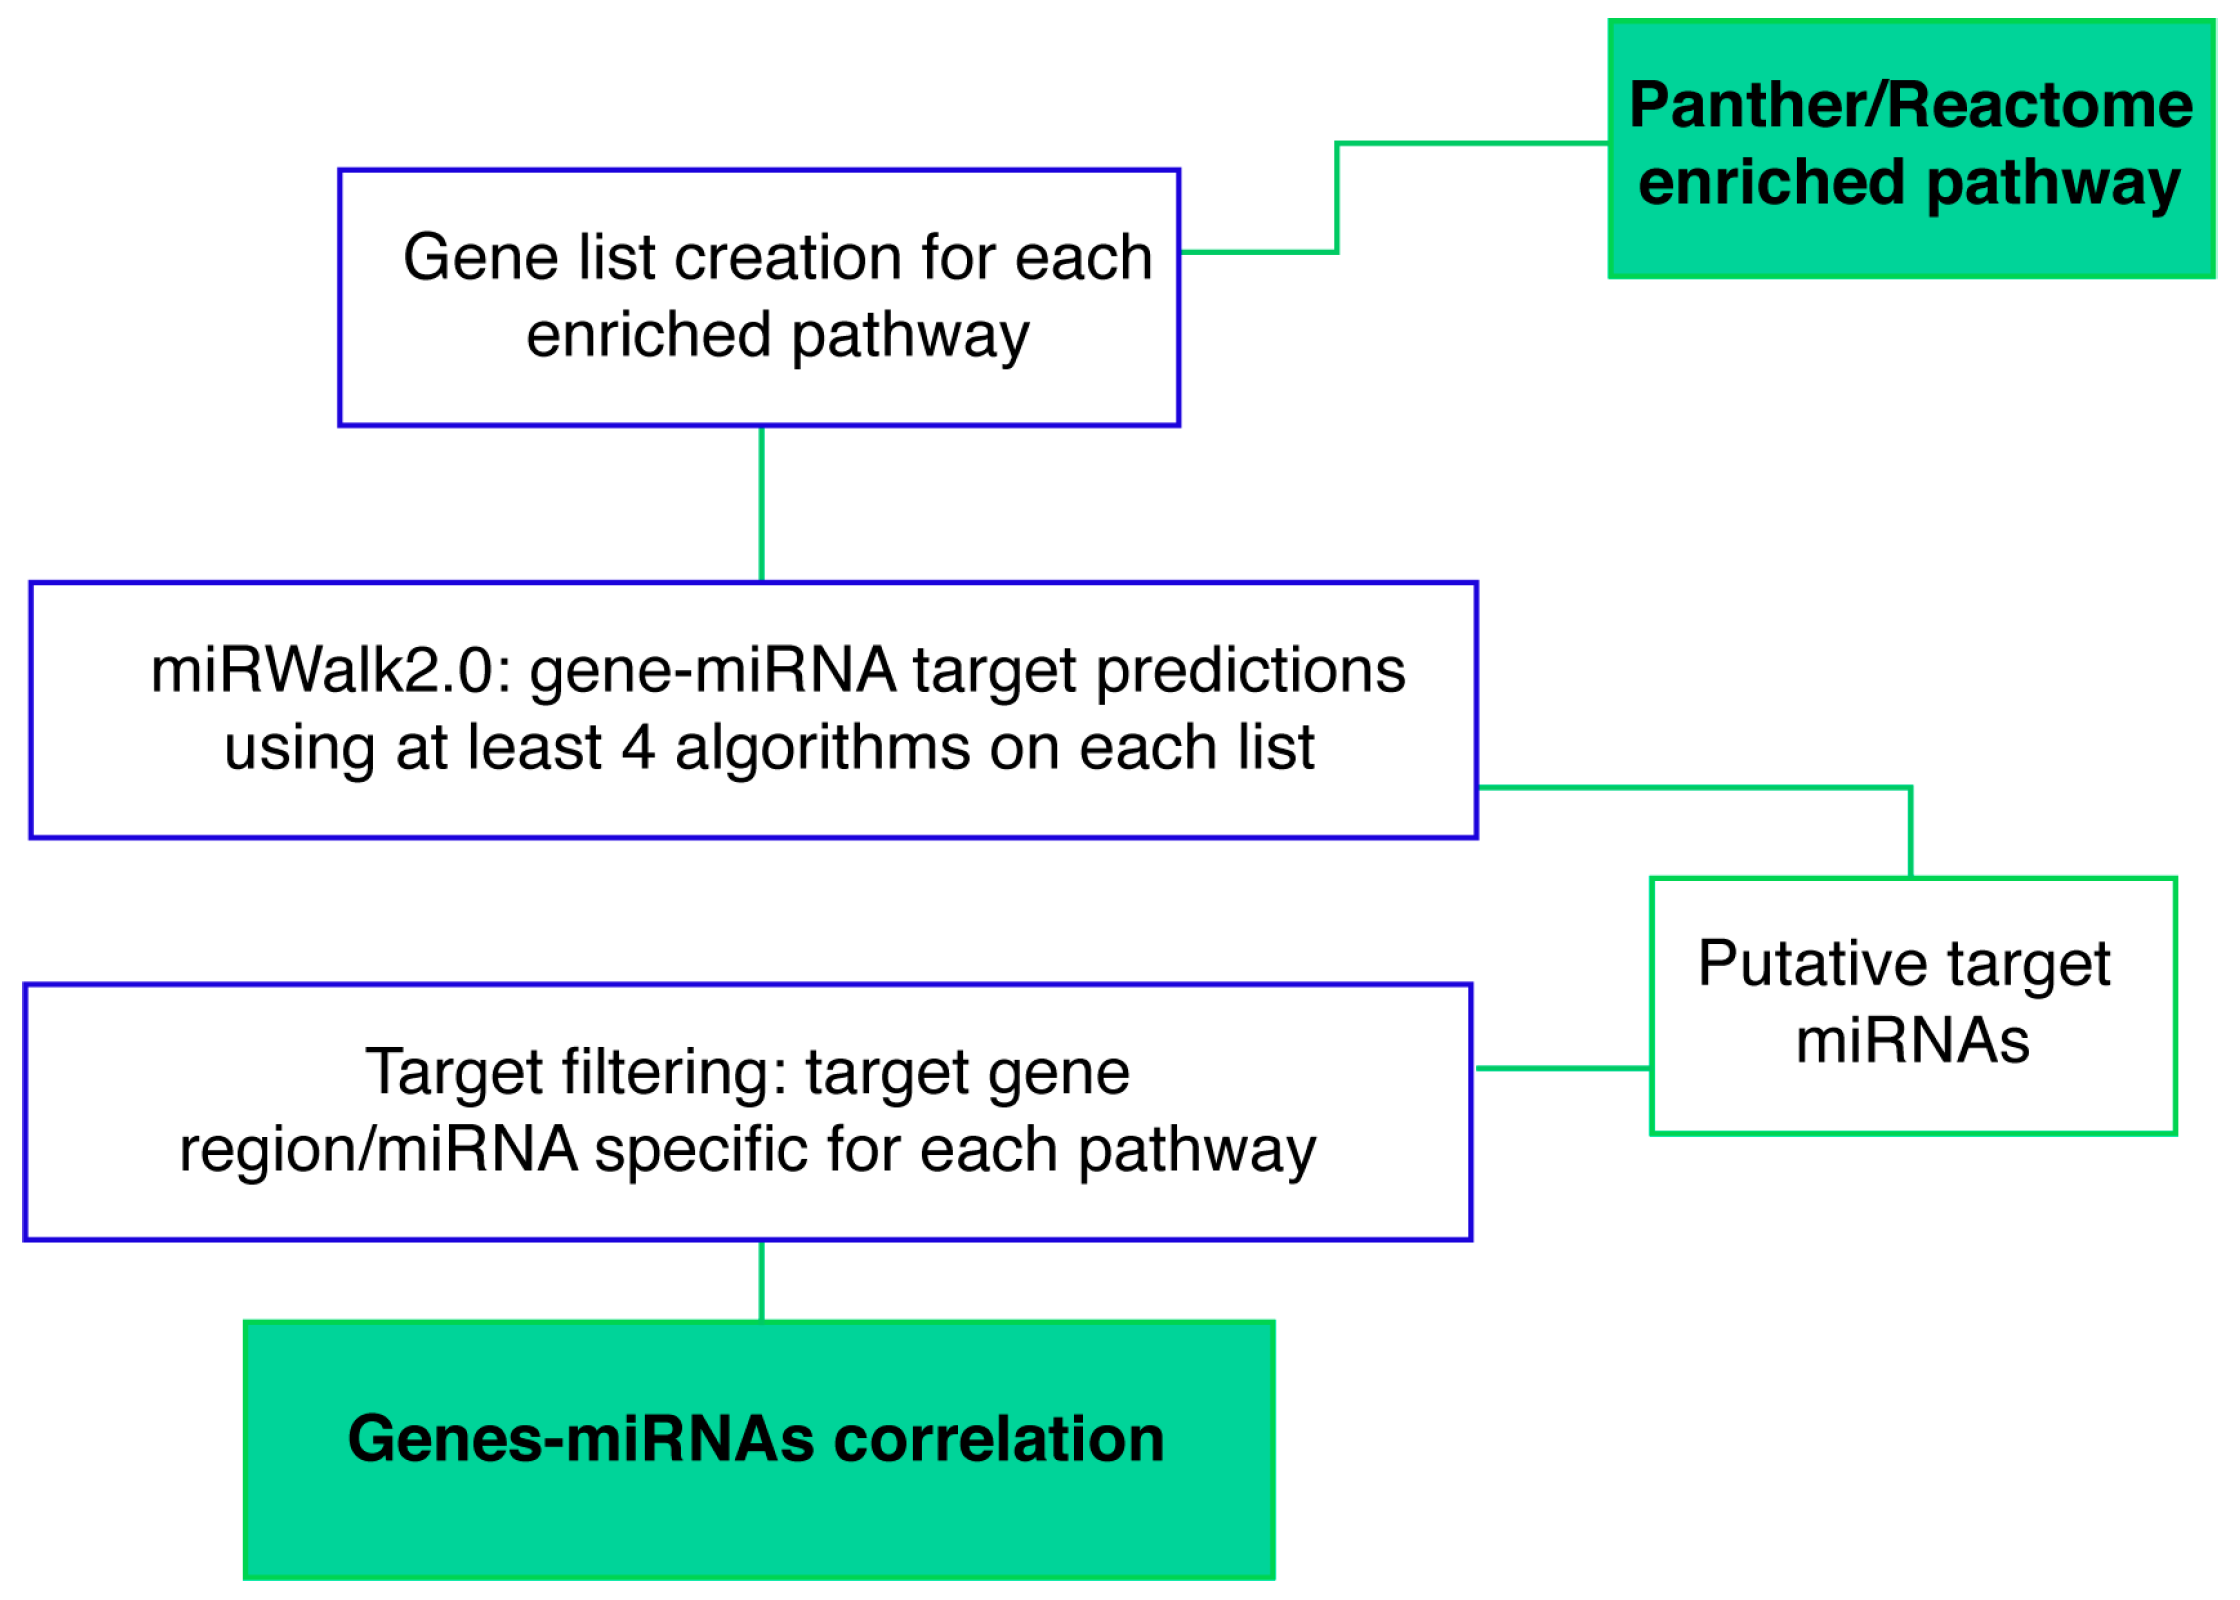
2.5. Identification of miRNA-mRNA target-relationship in enriched pathways
3. Discussion
4. Materials and Methods
4.1. Animal Models
4.2. Tissue Dissection
4.3. Periodic Acid Shiff (PAS) Staining
4.4. MicroRNA Real Time Quantitative RT-PCR
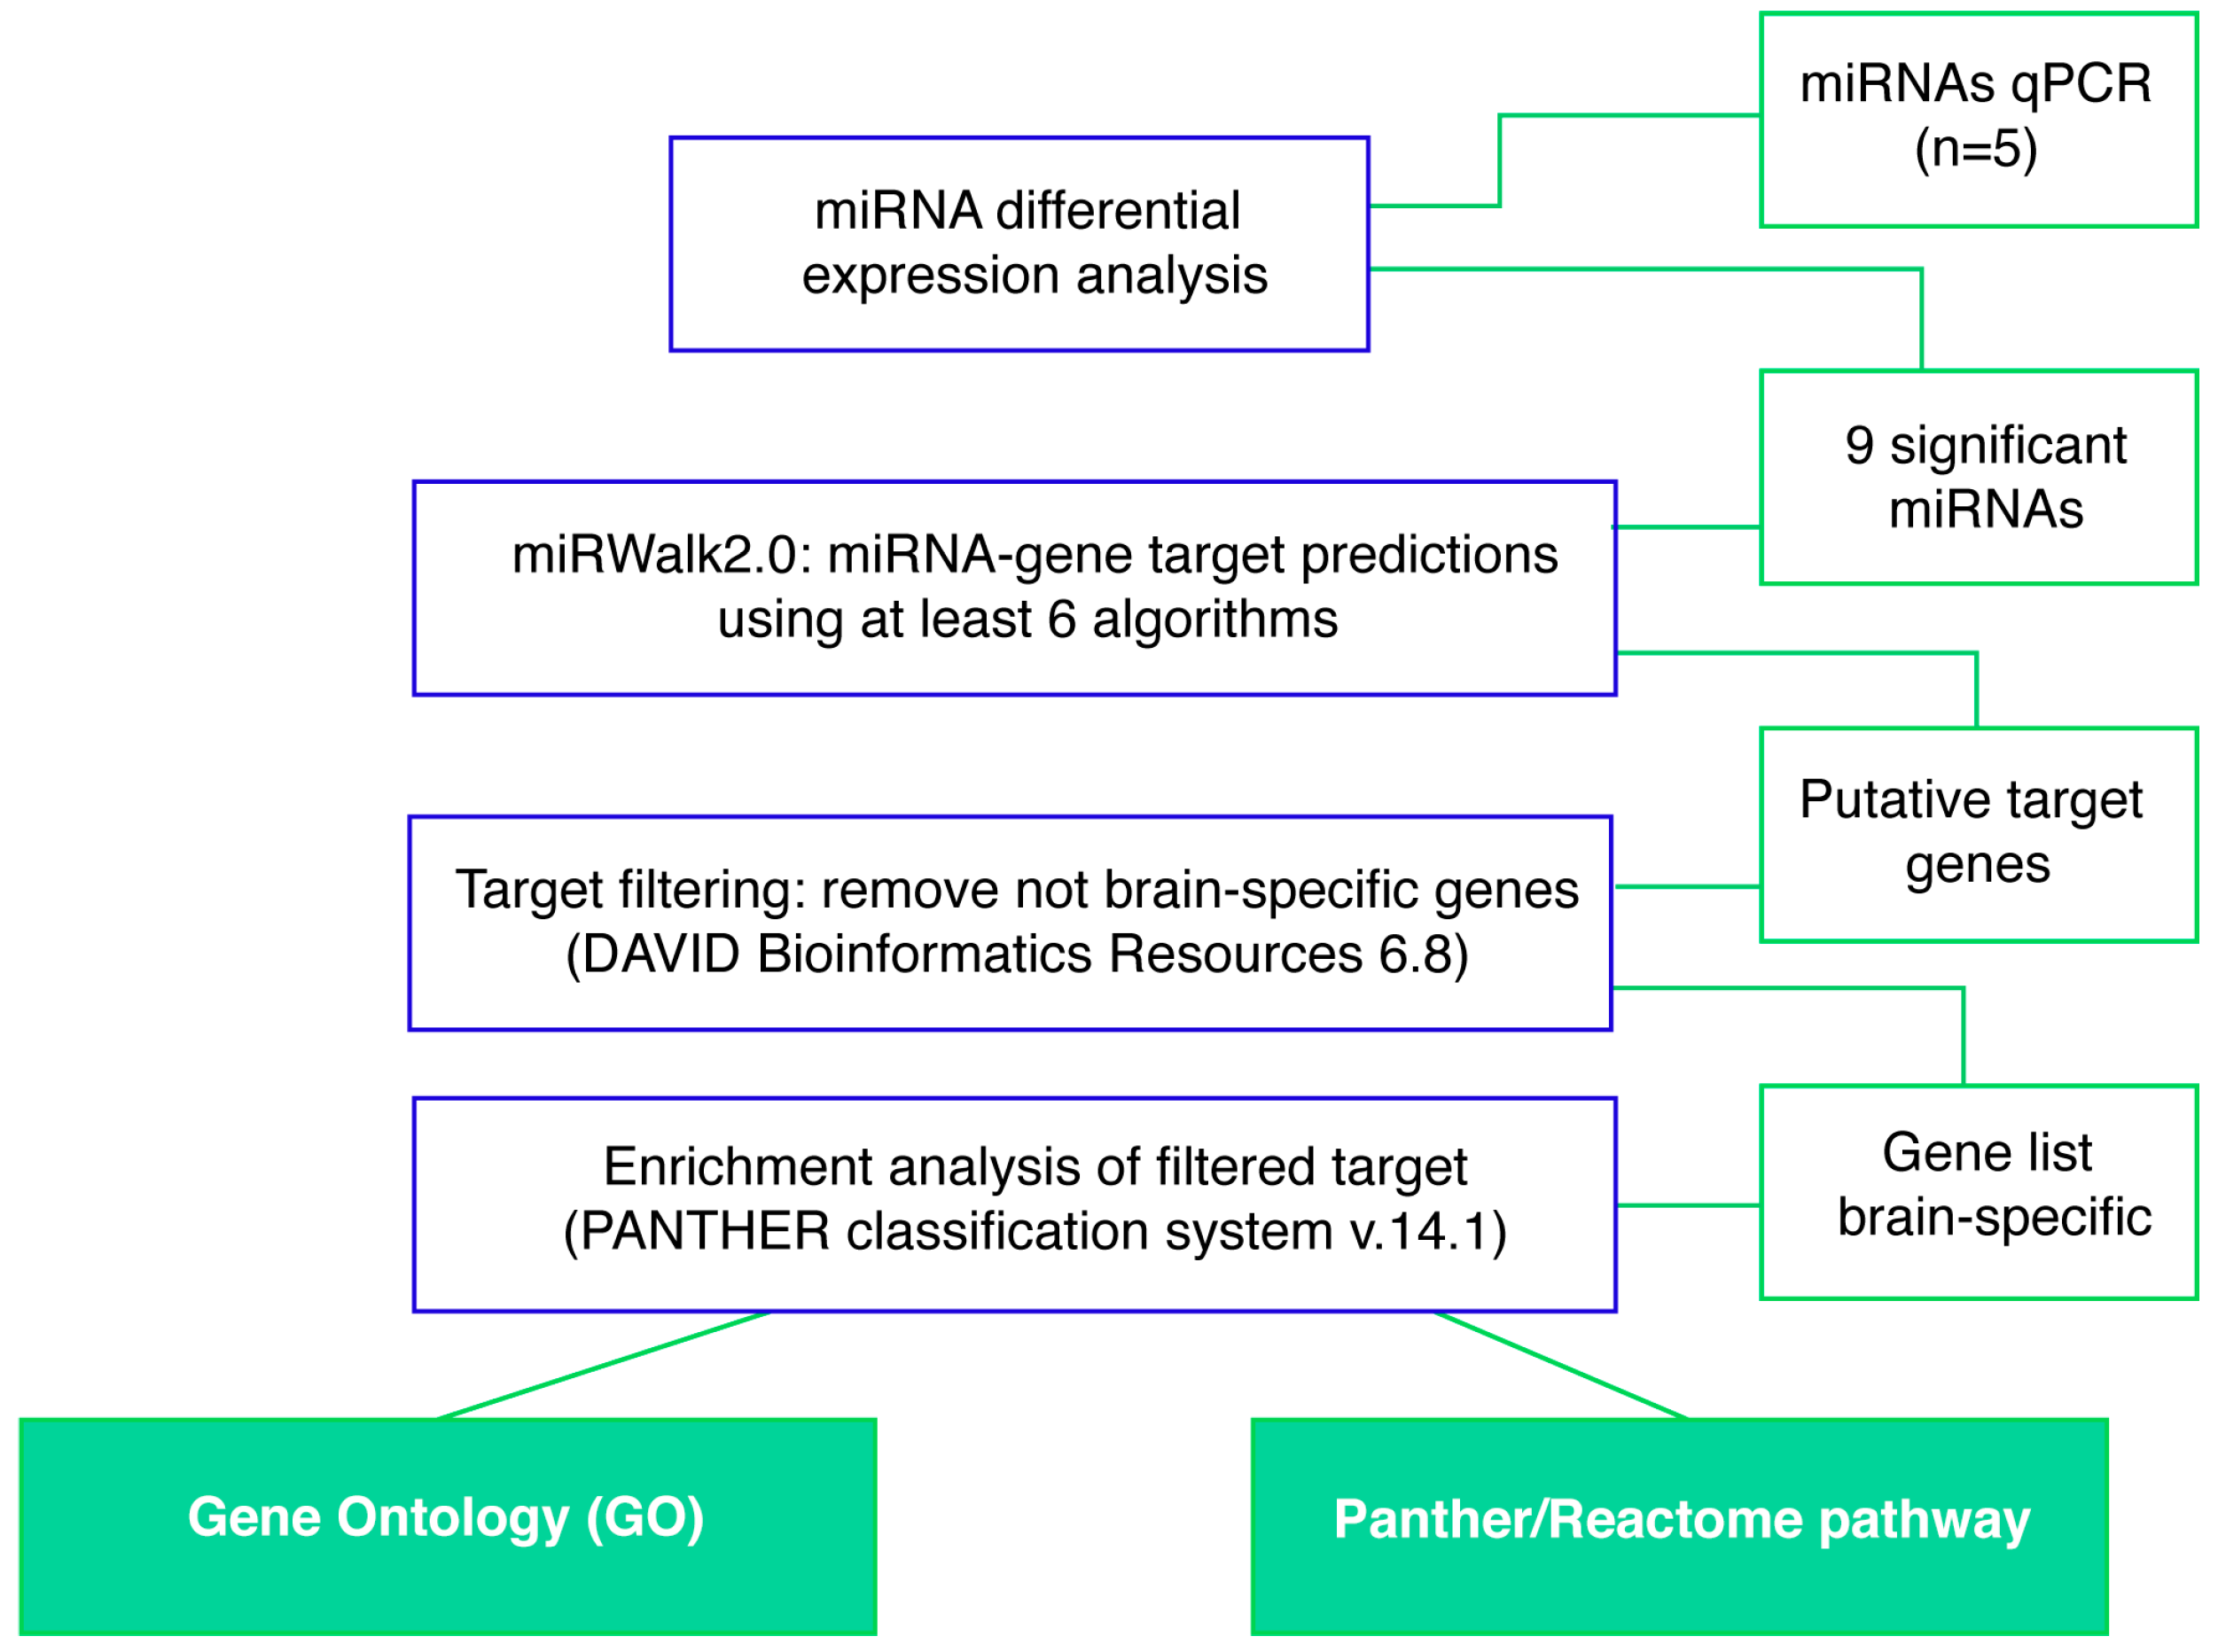
4.5. Computational Analysis
4.5.1. miRNA Differential Expression Analysis Profiling
4.5.2. miRNA-Gene Target Prediction
4.5.3. Gene List Targets Generation and Pathway Enrichment Analysis
4.5.4. Gene-miRNA Targets Prediction
Supplementary Materials
Author Contributions
Funding
Acknowledgments
Conflicts of Interest
References
- Bley, A.E.; Giannikopoulos, O.A.; Hayden, D.; Kubilus, K.; Tifft, C.J.; Eichler, F.S. Natural history of infantile G(M2) gangliosidosis. Pediatrics 2011, 128, e1233–e1241. [Google Scholar] [CrossRef]
- Sandhoff, K. The GM2-gangliosidoses and the elucidation of the beta-hexosaminidase system. Adv. Genet. 2001, 44, 67–91. [Google Scholar] [PubMed]
- Hepbildikler, S.T.; Sandhoff, R.; Kolzer, M.; Proia, R.L.; Sandhoff, K. Physiological substrates for human lysosomal beta -hexosaminidase S. J. Biol. Chem. 2002, 277, 2562–2572. [Google Scholar] [CrossRef] [PubMed]
- Ou, L.; Przybilla, M.J.; Whitley, C.B. Metabolomics profiling reveals profound metabolic impairments in mice and patients with Sandhoff disease. Mol. Genet. Metab. 2019, 126, 151–156. [Google Scholar] [CrossRef]
- Lemieux, M.J.; Mark, B.L.; Cherney, M.M.; Withers, S.G.; Mahuran, D.J.; James, M.N.G. Crystallographic structure of human beta-hexosaminidase A: Interpretation of Tay-Sachs mutations and loss of GM2 ganglioside hydrolysis. J. Mol. Biol. 2006, 359, 913–929. [Google Scholar] [CrossRef] [PubMed]
- Mark, B.L.; Mahuran, D.J.; Cherney, M.M.; Zhao, D.; Knapp, S.; James, M.N.G. Crystal structure of human beta-hexosaminidase B: Understanding the molecular basis of Sandhoff and Tay-Sachs disease. J. Mol. Biol. 2003, 327, 1093–1109. [Google Scholar] [CrossRef]
- Triggs-Raine, B.; Mahuran, D.J.; Gravel, R.A. Naturally occurring mutations in GM2 gangliosidosis: A compendium. Adv. Genet. 2001, 44, 199–224. [Google Scholar]
- Patterson, M.C. Gangliosidoses. Handb. Clin. Neurol. 2013, 113, 1707–1708. [Google Scholar]
- Cachon-Gonzalez, M.B.; Zaccariotto, E.; Cox, T.M. Genetics and Therapies for GM2 Gangliosidosis. Curr. Gene Ther. 2018, 18, 68–89. [Google Scholar] [CrossRef]
- Regier, D.S.; Proia, R.L.; D’Azzo, A.; Tifft, C.J. The GM1 and GM2 Gangliosidoses: Natural History and Progress toward Therapy. Pediatr. Endocrinol. Rev. 2016, 13 (Suppl. 1), 663–673. [Google Scholar]
- Martino, S.; di Girolamo, I.; Cavazzin, C.; Tiribuzi, R.; Galli, R.; Rivaroli, A.; Valsecchi, M.; Sandhoff, K.; Sonnino, S.; Vescovi, A.; et al. Neural precursor cell cultures from GM2 gangliosidosis animal models recapitulate the biochemical and molecular hallmarks of the brain pathology. J. Neurochem. 2009, 109, 135–147. [Google Scholar] [CrossRef] [PubMed]
- Martino, S.; Marconi, P.; Tancini, B.; Dolcetta, D.; De Angelis, M.G.C.; Montanucci, P.; Bregola, G.; Sandhoff, K.; Bordignon, C.; Emiliani, C.; et al. A direct gene transfer strategy via brain internal capsule reverses the biochemical defect in Tay-Sachs disease. Hum. Mol. Genet. 2005, 14, 2113–2123. [Google Scholar] [CrossRef] [PubMed]
- Martino, S.; Cavalieri, C.; Emiliani, C.; Dolcetta, D.; Cusella De Angelis, M.G.; Chigorno, V.; Severini, G.M.; Sandhoff, K.; Bordignon, C.; Sonnino, S.; et al. Restoration of the GM2 ganglioside metabolism in bone marrow-derived stromal cells from Tay-Sachs disease animal model. Neurochem. Res. 2002, 27, 793–800. [Google Scholar] [CrossRef] [PubMed]
- Allende, M.L.; Cook, E.K.; Larman, B.C.; Nugent, A.; Brady, J.M.; Golebiowski, D.; Sena-Esteves, M.; Tifft, C.J.; Proia, R.L. Cerebral organoids derived from Sandhoff disease-induced pluripotent stem cells exhibit impaired neurodifferentiation. J. Lipid Res. 2018, 59, 550–563. [Google Scholar] [CrossRef] [PubMed] [Green Version]
- Sango, K.; Yamanaka, S.; Hoffmann, A.; Okuda, Y.; Grinberg, A.; Westphal, H.; McDonald, M.P.; Crawley, J.N.; Sandhoff, K.; Suzuki, K.; et al. Mouse models of Tay-Sachs and Sandhoff diseases differ in neurologic phenotype and ganglioside metabolism. Nat. Genet. 1995, 11, 170–176. [Google Scholar] [CrossRef] [PubMed]
- Lawson, C.A.; Martin, D.R. Animal models of GM2 gangliosidosis: Utility and limitations. Appl. Clin. Genet. 2016, 9, 111–120. [Google Scholar] [CrossRef]
- Li, Y.; Kowdley, K.V. MicroRNAs in common human diseases. Genom. Proteom. Bioinform. 2012, 10, 246–253. [Google Scholar] [CrossRef]
- Paul, P.; Chakraborty, A.; Sarkar, D.; Langthasa, M.; Rahman, M.; Bari, M.; Singha, R.S.; Malakar, A.K.; Chakraborty, S. Interplay between miRNAs and human diseases. J. Cell. Physiol. 2018, 233, 2007–2018. [Google Scholar] [CrossRef]
- Jakovcevski, M.; Akbarian, S. Epigenetic mechanisms in neurological disease. Nat. Med. 2012, 18, 1194–1204. [Google Scholar] [CrossRef] [Green Version]
- Hassan, S.; Sidransky, E.; Tayebi, N. The role of epigenetics in lysosomal storage disorders: Uncharted territory. Mol. Genet. Metab. 2017, 122, 10–18. [Google Scholar] [CrossRef]
- Bartel, D.P. MicroRNAs: Genomics, biogenesis, mechanism, and function. Cell 2004, 116, 281–297. [Google Scholar] [CrossRef]
- Gebert, L.F.R.; MacRae, I.J. Regulation of microRNA function in animals. Nat. Rev. Mol. Cell Biol. 2019, 20, 21–37. [Google Scholar] [CrossRef] [PubMed]
- Pritchard, C.C.; Cheng, H.H.; Tewari, M. MicroRNA profiling: Approaches and considerations. Nat. Rev. Genet. 2012, 13, 358–369. [Google Scholar] [CrossRef]
- O’Brien, J.; Hayder, H.; Zayed, Y.; Peng, C. Overview of MicroRNA Biogenesis, Mechanisms of Actions, and Circulation. Front. Endocrinol. 2018, 9, 402. [Google Scholar] [CrossRef] [PubMed] [Green Version]
- Morena, F.; Argentati, C.; Bazzucchi, M.; Emiliani, C.; Martino, S. Above the Epitranscriptome: RNA Modifications and Stem Cell Identity. Genes 2018, 9, 329. [Google Scholar] [CrossRef] [PubMed]
- Ala, U.; Karreth, F.A.; Bosia, C.; Pagnani, A.; Taulli, R.; Léopold, V.; Tay, Y.; Provero, P.; Zecchina, R.; Pandolfi, P.P. Integrated transcriptional and competitive endogenous RNA networks are cross-regulated in permissive molecular environments. Proc. Natl. Acad. Sci. USA 2013, 110, 7154–7159. [Google Scholar] [CrossRef] [PubMed] [Green Version]
- Thomson, D.W.; Dinger, M.E. Endogenous microRNA sponges: Evidence and controversy. Nat. Rev. Genet. 2016, 17, 272–283. [Google Scholar] [CrossRef] [PubMed]
- Bueno, M.J.; Malumbres, M. MicroRNAs and the cell cycle. Biochim. Biophys. Acta 2011, 1812, 592–601. [Google Scholar] [CrossRef] [Green Version]
- Dumortier, O.; Hinault, C.; Van Obberghen, E. MicroRNAs and metabolism crosstalk in energy homeostasis. Cell Metab. 2013, 18, 312–324. [Google Scholar] [CrossRef]
- Gruber, A.J.; Zavolan, M. Modulation of epigenetic regulators and cell fate decisions by miRNAs. Epigenomics 2013, 5, 671–683. [Google Scholar] [CrossRef]
- Mehta, A.; Baltimore, D. MicroRNAs as regulatory elements in immune system logic. Nat. Rev. Immunol. 2016, 16, 279–294. [Google Scholar] [CrossRef] [PubMed]
- Ivey, K.N.; Srivastava, D. MicroRNAs as regulators of differentiation and cell fate decisions. Cell Stem Cell 2010, 7, 36–41. [Google Scholar] [CrossRef] [PubMed]
- Leonardo, T.R.; Schultheisz, H.L.; Loring, J.F.; Laurent, L.C. The functions of microRNAs in pluripotency and reprogramming. Nat. Cell Biol. 2012, 14, 1114–1121. [Google Scholar] [CrossRef] [PubMed]
- Lin, S.; Gregory, R.I. MicroRNA biogenesis pathways in cancer. Nat. Rev. Cancer 2015, 15, 321–333. [Google Scholar] [CrossRef] [PubMed]
- Iorio, M.V.; Croce, C.M. MicroRNA dysregulation in cancer: Diagnostics, monitoring and therapeutics. A comprehensive review. EMBO Mol. Med. 2017, 9, 852. [Google Scholar] [CrossRef]
- Rajman, M.; Schratt, G. MicroRNAs in neural development: From master regulators to fine-tuners. Development 2017, 144, 2310–2322. [Google Scholar] [CrossRef] [PubMed]
- Martino, S.; di Girolamo, I.; Orlacchio, A.; Datti, A.; Orlacchio, A. MicroRNA implications across neurodevelopment and neuropathology. J. Biomed. Biotechnol. 2009, 2009, 654346. [Google Scholar] [CrossRef]
- Quinlan, S.; Kenny, A.; Medina, M.; Engel, T.; Jimenez-Mateos, E.M. MicroRNAs in Neurodegenerative Diseases. Int. Rev. Cell Mol. Biol. 2017, 334, 309–343. [Google Scholar]
- Ramakrishna, S.; Muddashetty, R.S. Emerging Role of microRNAs in Dementia. J. Mol. Biol. 2019, 431, 1743–1762. [Google Scholar] [CrossRef]
- Wang, M.; Qin, L.; Tang, B. MicroRNAs in Alzheimer’s Disease. Front. Genet. 2019, 10, 153. [Google Scholar] [CrossRef]
- Bicchi, I.; Morena, F.; Montesano, S.; Polidoro, M.; Martino, S. MicroRNAs and Molecular Mechanisms of Neurodegeneration. Genes 2013, 4, 244–263. [Google Scholar] [CrossRef] [PubMed]
- Orlacchio, A.; Bernardi, G.; Orlacchio, A.; Martino, S. RNA interference as a tool for Alzheimer’s disease therapy. Mini. Rev. Med. Chem. 2007, 7, 1166–1176. [Google Scholar] [CrossRef] [PubMed]
- Ricci, C.; Marzocchi, C.; Battistini, S. MicroRNAs as Biomarkers in Amyotrophic Lateral Sclerosis. Cells 2018, 7, 219. [Google Scholar] [CrossRef] [PubMed]
- Ferrante, M.; Conti, G.O. Environment and Neurodegenerative Diseases: An Update on miRNA Role. Microrna 2017, 6, 157–165. [Google Scholar] [CrossRef] [PubMed]
- Pons-Espinal, M.; de Luca, E.; Marzi, M.J.; Beckervordersandforth, R.; Armirotti, A.; Nicassio, F.; Fabel, K.; Kempermann, G.; De Pietri Tonelli, D. Synergic Functions of miRNAs Determine Neuronal Fate of Adult Neural Stem Cells. Stem Cell Rep. 2017, 8, 1046–1061. [Google Scholar] [CrossRef] [PubMed] [Green Version]
- Gentner, B.; Visigalli, I.; Hiramatsu, H.; Lechman, E.; Ungari, S.; Giustacchini, A.; Schira, G.; Amendola, M.; Quattrini, A.; Martino, S.; et al. Identification of hematopoietic stem cell-specific miRNAs enables gene therapy of globoid cell leukodystrophy. Sci. Trans. Med. 2010, 2, 58ra84. [Google Scholar] [CrossRef] [PubMed]
- Siebert, M.; Westbroek, W.; Chen, Y.-C.; Moaven, N.; Li, Y.; Velayati, A.; Saraiva-Pereira, M.L.; Martin, S.E.; Sidransky, E. Identification of miRNAs that modulate glucocerebrosidase activity in Gaucher disease cells. RNA Biol. 2014, 11, 1291–1300. [Google Scholar] [CrossRef] [PubMed] [Green Version]
- Kozomara, A.; Birgaoanu, M.; Griffiths-Jones, S. miRBase: From microRNA sequences to function. Nucl. Acids Res. 2019, 47, D155–D162. [Google Scholar] [CrossRef] [PubMed]
- Wong, N.; Wang, X. miRDB: An online resource for microRNA target prediction and functional annotations. Nucl. Acids Res. 2015, 43, D146–D152. [Google Scholar] [CrossRef] [PubMed]
- Yamanaka, S.; Johnson, M.D.; Grinberg, A.; Westphal, H.; Crawley, J.N.; Taniike, M.; Suzuki, K.; Proia, R.L. Targeted disruption of the Hexa gene results in mice with biochemical and pathologic features of Tay-Sachs disease. Proc. Natl. Acad. Sci. USA 1994, 91, 9975–9979. [Google Scholar] [CrossRef]
- Rea, P. Essential Clinical Anatomy of the Nervous System; Elsevier: Amsterdam, The Netherlands, 2015; ISBN 978-0-12-802030-2. [Google Scholar]
- Ernst, A.; Alkass, K.; Bernard, S.; Salehpour, M.; Perl, S.; Tisdale, J.; Possnert, G.; Druid, H.; Frisén, J. Neurogenesis in the striatum of the adult human brain. Cell 2014, 156, 1072–1083. [Google Scholar] [CrossRef] [PubMed]
- Yamashita, T.; Ninomiya, M.; Hernández Acosta, P.; García-Verdugo, J.M.; Sunabori, T.; Sakaguchi, M.; Adachi, K.; Kojima, T.; Hirota, Y.; Kawase, T.; et al. Subventricular zone-derived neuroblasts migrate and differentiate into mature neurons in the post-stroke adult striatum. J. Neurosci. 2006, 26, 6627–6636. [Google Scholar] [CrossRef] [PubMed]
- Kojima, T.; Hirota, Y.; Ema, M.; Takahashi, S.; Miyoshi, I.; Okano, H.; Sawamoto, K. Subventricular zone-derived neural progenitor cells migrate along a blood vessel scaffold toward the post-stroke striatum. Stem Cells 2010, 28, 545–554. [Google Scholar] [CrossRef] [PubMed]
- Kaneko, N.; Herranz-Pérez, V.; Otsuka, T.; Sano, H.; Ohno, N.; Omata, T.; Nguyen, H.B.; Thai, T.Q.; Nambu, A.; Kawaguchi, Y.; et al. New neurons use Slit-Robo signaling to migrate through the glial meshwork and approach a lesion for functional regeneration. Sci. Adv. 2018, 4, eaav0618. [Google Scholar] [CrossRef] [PubMed] [Green Version]
- Alvarez-Buylla, A.; Garcia-Verdugo, J.M. Neurogenesis in adult subventricular zone. J. Neurosci. 2002, 22, 629–634. [Google Scholar] [CrossRef] [PubMed]
- Hagg, T. Molecular regulation of adult CNS neurogenesis: An integrated view. Trends Neurosci. 2005, 28, 589–595. [Google Scholar] [CrossRef] [PubMed]
- Obernier, K.; Alvarez-Buylla, A. Neural stem cells: Origin, heterogeneity and regulation in the adult mammalian brain. Development 2019, 146, dev156059. [Google Scholar] [CrossRef] [PubMed]
- Pan, W.X.; Mao, T.; Dudman, J.T. Inputs to the dorsal striatum of the mouse reflect the parallel circuit architecture of the forebrain. Front. Neuroanat. 2010, 4, 147. [Google Scholar] [CrossRef] [PubMed]
- Swanson, L.W. Brain maps 4.0-Structure of the rat brain: An open access atlas with global nervous system nomenclature ontology and flatmaps. J. Comp. Neurol. 2018, 526, 935–943. [Google Scholar] [CrossRef] [PubMed]
- Bano, S.; Prasad, A.; Yadav, S.N.; Chaudhary, V.; Garga, U.C. Neuroradiological findings in GM2 gangliosidosis variant B1. J. Pediatr. Neurosci. 2011, 6, 110–113. [Google Scholar] [PubMed]
- Taniike, M.; Yamanaka, S.; Proia, R.L.; Langaman, C.; Bone-Turrentine, T.; Suzuki, K. Neuropathology of mice with targeted disruption of Hexa gene, a model of Tay-Sachs disease. Acta Neuropathol. 1995, 89, 296–304. [Google Scholar] [CrossRef] [PubMed]
- Gritti, A.; Dal Molin, M.; Foroni, C.; Bonfanti, L. Effects of developmental age, brain region, and time in culture on long-term proliferation and multipotency of neural stem cell populations. J. Comp. Neurol. 2009, 517, 333–349. [Google Scholar] [CrossRef]
- Mengler, L.; Khmelinskii, A.; Diedenhofen, M.; Po, C.; Staring, M.; Lelieveldt, B.P.F.; Hoehn, M. Brain maturation of the adolescent rat cortex and striatum: Changes in volume and myelination. Neuroimage 2014, 84, 35–44. [Google Scholar] [CrossRef] [PubMed] [Green Version]
- Mi, H.; Muruganujan, A.; Huang, X.; Ebert, D.; Mills, C.; Guo, X.; Thomas, P.D. Protocol Update for large-scale genome and gene function analysis with the PANTHER classification system (v.14.0). Nat. Protoc. 2019, 14, 703–721. [Google Scholar] [CrossRef]
- Walkley, S.U.; Wurzelmann, S.; Rattazzi, M.C.; Baker, H.J. Distribution of ectopic neurite growth and other geometrical distortions of CNS neurons in feline GM2 gangliosidosis. Brain Res. 1990, 510, 63–73. [Google Scholar] [CrossRef]
- Virgolini, M.J.; Feliziani, C.; Cambiasso, M.J.; Lopez, P.H.; Bollo, M. Neurite atrophy and apoptosis mediated by PERK signaling after accumulation of GM2-ganglioside. Biochim. Biophys. Acta Mol. Cell Res. 2019, 1866, 225–239. [Google Scholar] [CrossRef] [PubMed]
- Sango, K.; Takano, M.; Ajiki, K.; Tokashiki, A.; Arai, N.; Kawano, H.; Horie, H.; Yamanaka, S. Impaired neurite outgrowth in the retina of a murine model of Sandhoff disease. Investig. Ophthalmol. Vis. Sci. 2005, 46, 3420–3425. [Google Scholar] [CrossRef] [PubMed]
- Kim, Y.C.; Park, H.W.; Sciarretta, S.; Mo, J.-S.; Jewell, J.L.; Russell, R.C.; Wu, X.; Sadoshima, J.; Guan, K.-L. Rag GTPases are cardioprotective by regulating lysosomal function. Nat. Commun. 2014, 5, 4241. [Google Scholar] [CrossRef] [PubMed]
- Pagano, R.E.; Puri, V.; Dominguez, M.; Marks, D.L. Membrane traffic in sphingolipid storage diseases. Traffic 2000, 1, 807–815. [Google Scholar] [CrossRef] [PubMed]
- Martino, S.; Emiliani, C.; Tancini, B.; Severini, G.M.; Chigorno, V.; Bordignon, C.; Sonnino, S.; Orlacchio, A. Absence of metabolic cross-correction in Tay-Sachs cells: Implications for gene therapy. J. Biol. Chem. 2002, 277, 20177–20184. [Google Scholar] [CrossRef] [PubMed]
- Kornfeld, S. Trafficking of lysosomal enzymes in normal and disease states. J. Clin. Invest. 1986, 77, 1–6. [Google Scholar] [CrossRef] [PubMed]
- Coutinho, M.F.; Prata, M.J.; Alves, S. Mannose-6-phosphate pathway: A review on its role in lysosomal function and dysfunction. Mol. Genet. Metab. 2012, 105, 542–550. [Google Scholar] [CrossRef] [PubMed]
- Zeng, J.; Racicott, J.; Morales, C.R. The inactivation of the sortilin gene leads to a partial disruption of prosaposin trafficking to the lysosomes. Exp. Cell Res. 2009, 315, 3112–3124. [Google Scholar] [CrossRef] [PubMed]
- Gazulla Abío, J.; Benavente Aguilar, I. Adult GM2 gangliosidosis: Improvement of ataxia with GABAergic drugs. Neurologia 2002, 17, 157–161. [Google Scholar] [PubMed]
- Marques, A.R.A.; Saftig, P. Lysosomal storage disordersߞchallenges, concepts and avenues for therapy: Beyond rare diseases. J. Cell Sci. 2019, 132, jcs221739. [Google Scholar] [CrossRef]
- Pelled, D.; Lloyd-Evans, E.; Riebeling, C.; Jeyakumar, M.; Platt, F.M.; Futerman, A.H. Inhibition of calcium uptake via the sarco/endoplasmic reticulum Ca2+-ATPase in a mouse model of Sandhoff disease and prevention by treatment with N-butyldeoxynojirimycin. J. Biol. Chem. 2003, 278, 29496–29501. [Google Scholar] [CrossRef]
- Yoon, S.-J.; Nakayama, K.; Hikita, T.; Handa, K.; Hakomori, S. Epidermal growth factor receptor tyrosine kinase is modulated by GM3 interaction with N-linked GlcNAc termini of the receptor. Proc. Natl. Acad. Sci. USA 2006, 103, 18987–18991. [Google Scholar] [CrossRef] [Green Version]
- De Pasquale, V.; Pezone, A.; Sarogni, P.; Tramontano, A.; Schiattarella, G.G.; Avvedimento, V.E.; Paladino, S.; Pavone, L.M. EGFR activation triggers cellular hypertrophy and lysosomal disease in NAGLU-depleted cardiomyoblasts, mimicking the hallmarks of mucopolysaccharidosis IIIB. Cell Death Dis. 2018, 9, 40. [Google Scholar] [CrossRef]
- Hawkes, C.; Kar, S. Insulin-like growth factor-II/mannose-6-phosphate receptor: Widespread distribution in neurons of the central nervous system including those expressing cholinergic phenotype. J. Comp. Neurol. 2003, 458, 113–127. [Google Scholar] [CrossRef]
- Wada, R.; Tifft, C.J.; Proia, R.L. Microglial activation precedes acute neurodegeneration in Sandhoff disease and is suppressed by bone marrow transplantation. Proc. Natl. Acad. Sci. USA 2000, 97, 10954–10959. [Google Scholar] [CrossRef] [Green Version]
- Schnaar, R.L.; Gerardy-Schahn, R.; Hildebrandt, H. Sialic acids in the brain: Gangliosides and polysialic acid in nervous system development, stability, disease, and regeneration. Physiol. Rev. 2014, 94, 461–518. [Google Scholar] [CrossRef] [PubMed]
- Flanagan-Steet, H.; Christian, C.; Lu, P.-N.; Aarnio-Peterson, M.; Sanman, L.; Archer-Hartmann, S.; Azadi, P.; Bogyo, M.; Steet, R.A. TGF-ß Regulates Cathepsin Activation during Normal and Pathogenic Development. Cell Rep. 2018, 22, 2964–2977. [Google Scholar] [CrossRef] [PubMed]
- Sango, K.; Yamanaka, S.; Ajiki, K.; Tokashiki, A.; Watabe, K. Lysosomal storage results in impaired survival but normal neurite outgrowth in dorsal root ganglion neurones from a mouse model of Sandhoff disease. Neuropathol. Appl. Neurobiol. 2002, 28, 23–34. [Google Scholar] [CrossRef] [PubMed]
- Morena, F.; Armentano, I.; Montanucci, P.; Argentati, C.; Fortunati, E.; Montesano, S.; Bicchi, I.; Pescara, T.; Pennoni, I.; Mattioli, S.; et al. Design of a nanocomposite substrate inducing adult stem cell assembly and progression toward an Epiblast-like or Primitive Endoderm-like phenotype via mechanotransduction. Biomaterials 2017, 144, 211–229. [Google Scholar] [CrossRef] [PubMed]
- Morena, F.; di Girolamo, I.; Emiliani, C.; Gritti, A.; Biffi, A.; Martino, S. A new analytical bench assay for the determination of arylsulfatase a activity toward galactosyl-3-sulfate ceramide: Implication for metachromatic leukodystrophy diagnosis. Anal. Chem. 2014, 86, 473–481. [Google Scholar] [CrossRef]
- Martino, S.; Tiribuzi, R.; Ciraci, E.; Makrypidi, G.; D’Angelo, F.; di Girolamo, I.; Gritti, A.; de Angelis, G.M.C.; Papaccio, G.; Sampaolesi, M.; et al. Coordinated involvement of cathepsins S, D and cystatin C in the commitment of hematopoietic stem cells to dendritic cells. Int. J. Biochem. Cell Biol. 2011, 43, 775–783. [Google Scholar] [CrossRef]
- Dweep, H.; Gretz, N. miRWalk2.0: A comprehensive atlas of microRNA-target interactions. Nat. Methods 2015, 12, 697. [Google Scholar] [CrossRef]
- Ru, Y.; Kechris, K.J.; Tabakoff, B.; Hoffman, P.; Radcliffe, R.A.; Bowler, R.; Mahaffey, S.; Rossi, S.; Calin, G.A.; Bemis, L.; et al. The multiMiR R package and database: Integration of microRNA–target interactions along with their disease and drug associations. Nucl. Acids Res. 2014, 42, e133. [Google Scholar] [CrossRef]
- Huang, D.W.; Sherman, B.T.; Lempicki, R.A. Systematic and integrative analysis of large gene lists using DAVID bioinformatics resources. Nat. Protoc. 2009, 4, 44–57. [Google Scholar] [CrossRef]


| Brain Area | miRNA | Log2 FC | p-Value |
|---|---|---|---|
| SVZ-SD | miR-9 | −1.06 | 0.027 |
| SVZ-SD | miR-124 | 1.39 | 0.005 |
| SVZ-SD | miR-128 | 1.12 | 0.044 |
| SVZ-SD | miR-137 | −1.69 | 0.032 |
| STR-SD | miR-33 | −1.25 | 0.043 |
| STR-SD | miR-124 | 1.03 | 0.013 |
| STR-SD | miR-126a | −1.12 | 0.046 |
| SVZ-TSD | miR-29a | 1.21 | 0.038 |
| SVZ-TSD | miR-33 | −1.32 | 0.004 |
| SVZ-TSD | miR-128 | −1.16 | 0.016 |
| STR-TSD | miR-19a | −2.67 | 0.020 |
| STR-TSD | miR-33 | −1.94 | 0.027 |
| STR-TSD | miR-34a | −2.12 | 0.030 |
| STR-TSD | miR-124 | −2.03 | 0.005 |
| STR-TSD | miR-128 | −1.73 | 0.017 |
| miRNA | Validated Genes | Brain-specific Validated Genes | Predicted Genes | Brain-Specific Predicted Genes | Total Counts/Total Brain Genes |
|---|---|---|---|---|---|
| miR-9 | 531 | 304 | 810 | 370 | 1341/674 |
| miR-19a | 27 | 17 | 453 | 232 | 480/249 |
| miR-29a | 44 | 6 | 528 | 242 | 572/248 |
| miR-33 | 16 | 0 | 362 | 164 | 378/164 |
| miR-34a | 56 | 28 | 996 | 477 | 1052/505 |
| miR-124 | 461 | 203 | 810 | 360 | 1271/563 |
| miR-126a | 9 | 0 | 207 | 110 | 216/110 |
| miR-128 | 56 | 6 | 1136 | 518 | 1192/524 |
| miR-137 | 33 | 19 | 247 | 119 | 280/138 |
| Targets Mature miRNA | Catalogue No. | miRBASE Accession Number | Abbreviation in the Text |
|---|---|---|---|
| mmu-miR-9-5p | MS00012873 | MIMAT0000142 | miR-9 |
| mmu-miR-9* | MS00005887 | MIMAT0000143 | miR-9* |
| mmu-miR-19a-3p | MS00001302 | MIMAT0000651 | miR-19a |
| mmu-miR-29a-3p | MS00001372 | MIMAT0000535 | miR-29a |
| mmu-miR-33-5p | MS00032697 | MIMAT0000667 | miR-33 |
| mmu-miR-34a-5p | MS00001428 | MIMAT0000542 | miR-34a |
| mmu-miR-124-3p | MS00029211 | MIMAT0000134 | miR-124 |
| mmu-miR-126a-3p | MS00005999 | MIMAT0000138 | miR-126a |
| mmu-miR-128-3p | MS00011116 | MIMAT0000140 | miR-128 |
| mmu-miR-133a-3p | MS00032305 | MIMAT0000145 | miR-133a |
| mmu-miR-137-3p | MS00001589 | MIMAT0000149 | miR-137 |
| mmu-miR-181c-5p | MS00032382 | MIMAT0000674 | miR-181c |
© 2019 by the authors. Licensee MDPI, Basel, Switzerland. This article is an open access article distributed under the terms and conditions of the Creative Commons Attribution (CC BY) license (http://creativecommons.org/licenses/by/4.0/).
Share and Cite
Morena, F.; Oikonomou, V.; Argentati, C.; Bazzucchi, M.; Emiliani, C.; Gritti, A.; Martino, S. Integrated Computational Analysis Highlights unique miRNA Signatures in the Subventricular Zone and Striatum of GM2 Gangliosidosis Animal Models. Int. J. Mol. Sci. 2019, 20, 3179. https://doi.org/10.3390/ijms20133179
Morena F, Oikonomou V, Argentati C, Bazzucchi M, Emiliani C, Gritti A, Martino S. Integrated Computational Analysis Highlights unique miRNA Signatures in the Subventricular Zone and Striatum of GM2 Gangliosidosis Animal Models. International Journal of Molecular Sciences. 2019; 20(13):3179. https://doi.org/10.3390/ijms20133179
Chicago/Turabian StyleMorena, Francesco, Vasileios Oikonomou, Chiara Argentati, Martina Bazzucchi, Carla Emiliani, Angela Gritti, and Sabata Martino. 2019. "Integrated Computational Analysis Highlights unique miRNA Signatures in the Subventricular Zone and Striatum of GM2 Gangliosidosis Animal Models" International Journal of Molecular Sciences 20, no. 13: 3179. https://doi.org/10.3390/ijms20133179