Article

KSIMC: Predicting Kinase–Substrate Interactions Based on Matrix Completion

1
School of Computer Science and Engineering, Yulin Normal University, Yulin 537000, China
2
School of Computer, Electronics and Information, Guangxi University, Nanning 530004, China
3
State Key Laboratory for Conservation and Utilization of Subtropical Agro-Bioresources, Guangxi University, Nanning 530004, China
4
Center for Genomic and Personalized Medicine, Guangxi Medical University, Nanning 530021, China
*
Authors to whom correspondence should be addressed.
Int. J. Mol. Sci. 2019, 20(2), 302; https://doi.org/10.3390/ijms20020302
Submission received: 4 December 2018 / Revised: 31 December 2018 / Accepted: 7 January 2019 / Published: 14 January 2019
(This article belongs to the Special Issue Protein Phosphorylation in Health and Disease)

Abstract

:
Protein phosphorylation is an important chemical modification catalyzed by kinases. It plays important roles in many cellular processes. Predicting kinase–substrate interactions is vital to understanding the mechanism of many diseases. Many computational methods have been proposed to identify kinase–substrate interactions. However, the prediction accuracy still needs to be improved. Therefore, it is necessary to develop an efficient computational method to predict kinase–substrate interactions. In this paper, we propose a novel computational approach, KSIMC, to identify kinase–substrate interactions based on matrix completion. Firstly, the kinase similarity and substrate similarity are calculated by aligning sequence of kinase–kinase and substrate–substrate, respectively. Then, the original association network is adjusted based on the similarities. Finally, the matrix completion is used to predict potential kinase–substrate interactions. The experiment results show that our method outperforms other state-of-the-art algorithms in performance. Furthermore, the relevant databases and scientific literature verify the effectiveness of our algorithm for new kinase–substrate interaction identification.

1. Introduction

Protein phosphorylation is one of the most important post-translational modifications (PSMs) in an organism [1]. It is catalyzed by protein kinases, which promote the transfer of a phosphate group to corresponding substrates. Additionally, protein phosphatases remove the phosphates from substrates. Therefore, protein phosphorylation is a reversible post-translational modification based on the equilibrium of kinases and phosphatases. It plays critical roles in many cellular processes, such as cell metabolism, cell proliferation, cell differentiation, cell apoptosis, and cellular signal transduction [2,3]. Abnormal action of kinases and substrates may lead to a series of diseases, such as rheumatoid arthritis [4] and diabetes [5]. Thus, identifying interactions between substrates and its specific kinases may facilitate the study of diseases and drug targets [6,7,8].
In recent years, several biological methods have been proposed to identify phosphorylation sites and corresponding kinases including a low-throughput [9] and high-throughput [10] technique. Large amounts of phosphorylation sites have been identified by using high-throughput technology. However, most of the corresponding kinases are still unknown. For example, there are more than 30,000 phosphorylation sites stored in the popular knowledgebase Phospho.ELM [11]. However, 90% of these phosphorylation sites do not have records of corresponding annotated kinases. Moreover, a similar problem also exists in the PhosphoSitePlus [12], more than 95% phosphorylation sites do not have the records of the corresponding annotated kinases. Therefore, many computational methods have been developed for identifying kinase–substrate interactions [13,14]. Linding et al. [15] proposed a computational framework to identify a site-specific kinase–substrate based on the network context of kinases and phosphoproteins. Dang et al. [16] developed a new method for identifying kinase–substrate interactions by using conditional random fields. Zhou et al. [17] proposed a web server tool (GPS) to predict kinase–substrate interactions based on the BLOSUM matrix and Markov Cluster Algorithm. Zou et al. [18] presented a computational method, PKIS, to identify kinase–substrate interaction by applying the composition of a monomer spectrum encoding strategy(CMS) [19] to encode the protein sequence feature. Patrick et al. [20] proposed a Bayesian network model to identify kinase–substrate interactions by integrating the cellular context. Fan et al. [21] developed a random forest model for predicting kinase–substrate interactions based on functional information. Li et al. [22] proposed a kernel-based method to identify kinase–substrate interactions by using Supervised Laplacian Regularized Least Squares. Song et al. [23] presented a computational method to infer the relationships between kinases and substrates by integrating protein sequence and functional features. Gnad et al. [24] utilized support vector machines to predict phosphorylation and acetylation sites based on the primary sequence and developed an online database (PHOSIDA) to store phosphorylation data. Moreover, several computational methods employ the biological network information to improve the prediction accuracy. For instance, Song et al. [25] proposed a computational method named iGPS, to predict kinase–substrate interactions based on the PPI network. Damle et al. [26] presented an algorithm, PhosNetConstruct, to infer kinase-substrate interactions based on the domain-specific phosphorylation network. Li et al. [27] proposed a network-based method to identify kinase–substrate interactions by integrating sequence similarity. Qin et al. [28] developed a computational framework for predicting kinase–substrate interactions based on the protein domains network. However, due to the complexity of protein phosphorylation, the accuracy of kinase–substrate prediction of most of the exiting computational methods still needs to be improved.
In this paper, we propose a new computational approach, KSIMC, to predict kinase–substrate interactions based on matrix completion. Firstly, the kinase–kinase similarity and the substrate-substrate similarity are calculated by using a sequence local alignment method, respectively. Then, the kinase–substrate association network is adjusted based on pairwise similarities. Finally, the matrix completion is used to predict potential kinase–substrate interactions. The experiment results show that our method outperforms other state-of-the-art algorithms in performance. Furthermore, the relevant databases and scientific literatures verify the effectiveness of this algorithm for potential kinase–substrate interactions prediction.

2. Experiments and Results

2.1. Evaluation Metrics

In this paper, ten-fold cross-validation and de novo tests are conducted to evaluate the performance of KSIMC in predicting kinase–substrate interactions. In the ten-fold cross validation, all known kinase–substrate associations are randomly divided into 10 subsets of equal size. Each subset takes a turn as a test set, while the remaining nine subsets are treated as the training set. After performing the algorithm on the dataset, the predicted scoring matrix of all kinase–substrate interactions is generated. Then we calculate the true positive (TP), true negative (TN), false positive (FP) and false negative (FN) by ranking the prediction results. Correspondingly, TP represents the number of the positive samples that are correctly predicted, TN represents the number of the negative samples that are correctly predicted, FP represents the number of the positive samples that are incorrectly predicted, and FN represents the number of the negative samples that are incorrectly predicted. By changing various thresholds, true positive rate (TPR) and false positive rate (FPR) are calculated as follows:
T P R = T P T P + F N
F P R = F P F P + T N
Finally, the Receiver Operating Characteristic (ROC) is drawn based on the TPR and FPR and the Area Under Curve (AUC) is calculated for the performance evaluation.

2.2. Comparison with Network-Based Method

To evaluate the performance of KSIMC, we compare it with another network-based method Hetesim-SEQ [27] for all kinases and substrates by using ten-fold cross-validation. Hetesim-SEQ is a network-based method for kinase–substrate interactions prediction based on Hetesim [29] similarity. The ROC curve of KSIMC and Hetesim-SEQ is shown in Figure 1. KSIMC achieves the AUC value of 0.862, which is 0.06 higher than Hetesim-SEQ. It shows that KSIMC performs better than Hetesim-SEQ.

2.3. Comparison with Different Predictors by De Novo Test

In order to evaluate the ability of KSIMC in predicting potential kinase–substrate interactions, we perform de novo kinase–substrate interaction prediction test experiments. In the de novo test, for each queried kinase i, all known kinase–substrate interactions of kinase i are deleted. The remaining kinase–substrate interactions are treated as training sets. Four popular methods of kinase–substrate interactions including GPS [17], iGPS [25], NetworKIN [15] and PhosphoPICK [20] are also applied to predict potential substrates for new kinases. Since these predictors only provide a web server, we submit the dataset to the corresponding web server for testing. Four kinase groups including CAMK, CMGC, STE, and TK are used to illustrate the overall performance of different methods. The ROC curves for different methods in different kinase groups are illustrated in Figure 2. It can be observed that KSIMC performs better than the other four algorithms on different kinase groups. For instance, for the CAMK kinase group, the AUC value of KSIMC is 0.813, which is 0.242, 0.076, 0.175 and 0.186 higher than GPS, iGPS, NetworKIN and PhosphoPICK, respectively. Similarly, for the CMGC kinase group, the AUC value of KSIMC is 0.199, 0.149, 0.237, and 0.25 higher than GPS, iGPS, NetworKIN and PhosphoPICK, respectively.

2.4. Case Studies

To further demonstrate the ability of KSIMC to predict new kinase–substrate interactions, the case study is performed in here. All known kinase–substrate interactions are treated as the training set and the unknown kinase–substrate interactions are treated as the test set. We apply KSIMC to predict potential kinase–substrate interactions and obtain the prediction scores for all candidate kinase–substrate interactions (Table S1). We take the substrate IRS1 as an example to illustrate the capability of KSIMC to identify unknown kinase–substrate interactions. The top 10 predicted results of IRS1 are selected to validate based on the database and literatures (Table S2). The detailed information is shown in Table 1. We find that four predicted kinases have been confirmed in the PhosphoNET database and one predicted kinase has been validated in recent literature. For example, the serine site at the 312 position of the IRS1 sequence is catalyzed by two kinases (MAPK1 ranked at top 2 and MAPK8 ranked at top 6). The serine sites at the position 24 and 233 of IRS1 are catalyzed by PRKCA (ranked at top 3) and PRKCE (ranked at top 7), respectively. In addition, it has been proved that IRS1 can be regulated by CDK1 [30].
In addition, some interesting kinases such as ABL1, CSNK2A1, GSK3B, PRKG1 and RPS6KA3 are also discovered from the experimental results. The molecular mechanism of these kinases is still unknown; it deserves a biologist to validate its functions by using a biological experiment.

3. Materials and Methods

3.1. Data Resources

In this work, the human kinase–substrate interactions are obtained from the Phospho.ELM 9.0 database [11]. The interactions labeled with kinase group or family are not considered in the experiment. After removing the redundant data, 216 kinases, 724 substrates and 1256 kinase-substrate interactions are collected in final. Many kinases (substrates) are only related with individual substrate(kinases). There are 78 kinases with only one related substrate and 454 substrates with only one related kinase. The corresponding protein sequence data of 216 kinase and 724 substrates are downloaded from the UniProt (http://www.uniprot.org/) (10/02/2018) database.

3.2. Kinase-Kinase and Substrate-Substrate Similarity Measure

Based on the protein sequence information of the kinase and the substrate, the sequence local alignment method is used to calculate the kinase–kinase similarity and the substrate–substrate similarity. The sequence alignment tool Emboss [31] is utilized to calculate the sequence similarity, which has been widely used in sequence alignment [32,33]. The parameters of Emboss are set with the default value (Matrix = BLOSUM62, Gap open = 10, Gap extend = 0.5).

3.3. Adjust the Kinase-Substrate Interaction Network

The adjacency matrix of the kinase–substrate interaction network is described as MKS matrix. If there is a known relationship between the kinase i and the substrate j, then MKS(i,j) is 1, otherwise MKS(i,j) is 0. However, there may still be potential positives for unknown kinase-substrate relationships. In order to further enhance the reliability of the kinase–substrate association network, the kinase–substrate association network is adjusted based on sequence similarity. It is based on the assumption that similar substrates tend to be related with similar kinases. For instance, assume that kinase k1 is associated with the substrate s1 and there is no known association between k1 and the substrate s2. If the similarity between s1 and s2 is greater than a certain threshold t, the kinase k1 and substrate s2 are considered to be associated and the corresponding element in the kinase–substrate interaction matrix is set to 1. The parameter t is set as 0.9 here. Based on the above process, the kinases–substrate associations are readjusted to obtain a new kinase–substrate interaction matrix. The process is shown in Figure 3.

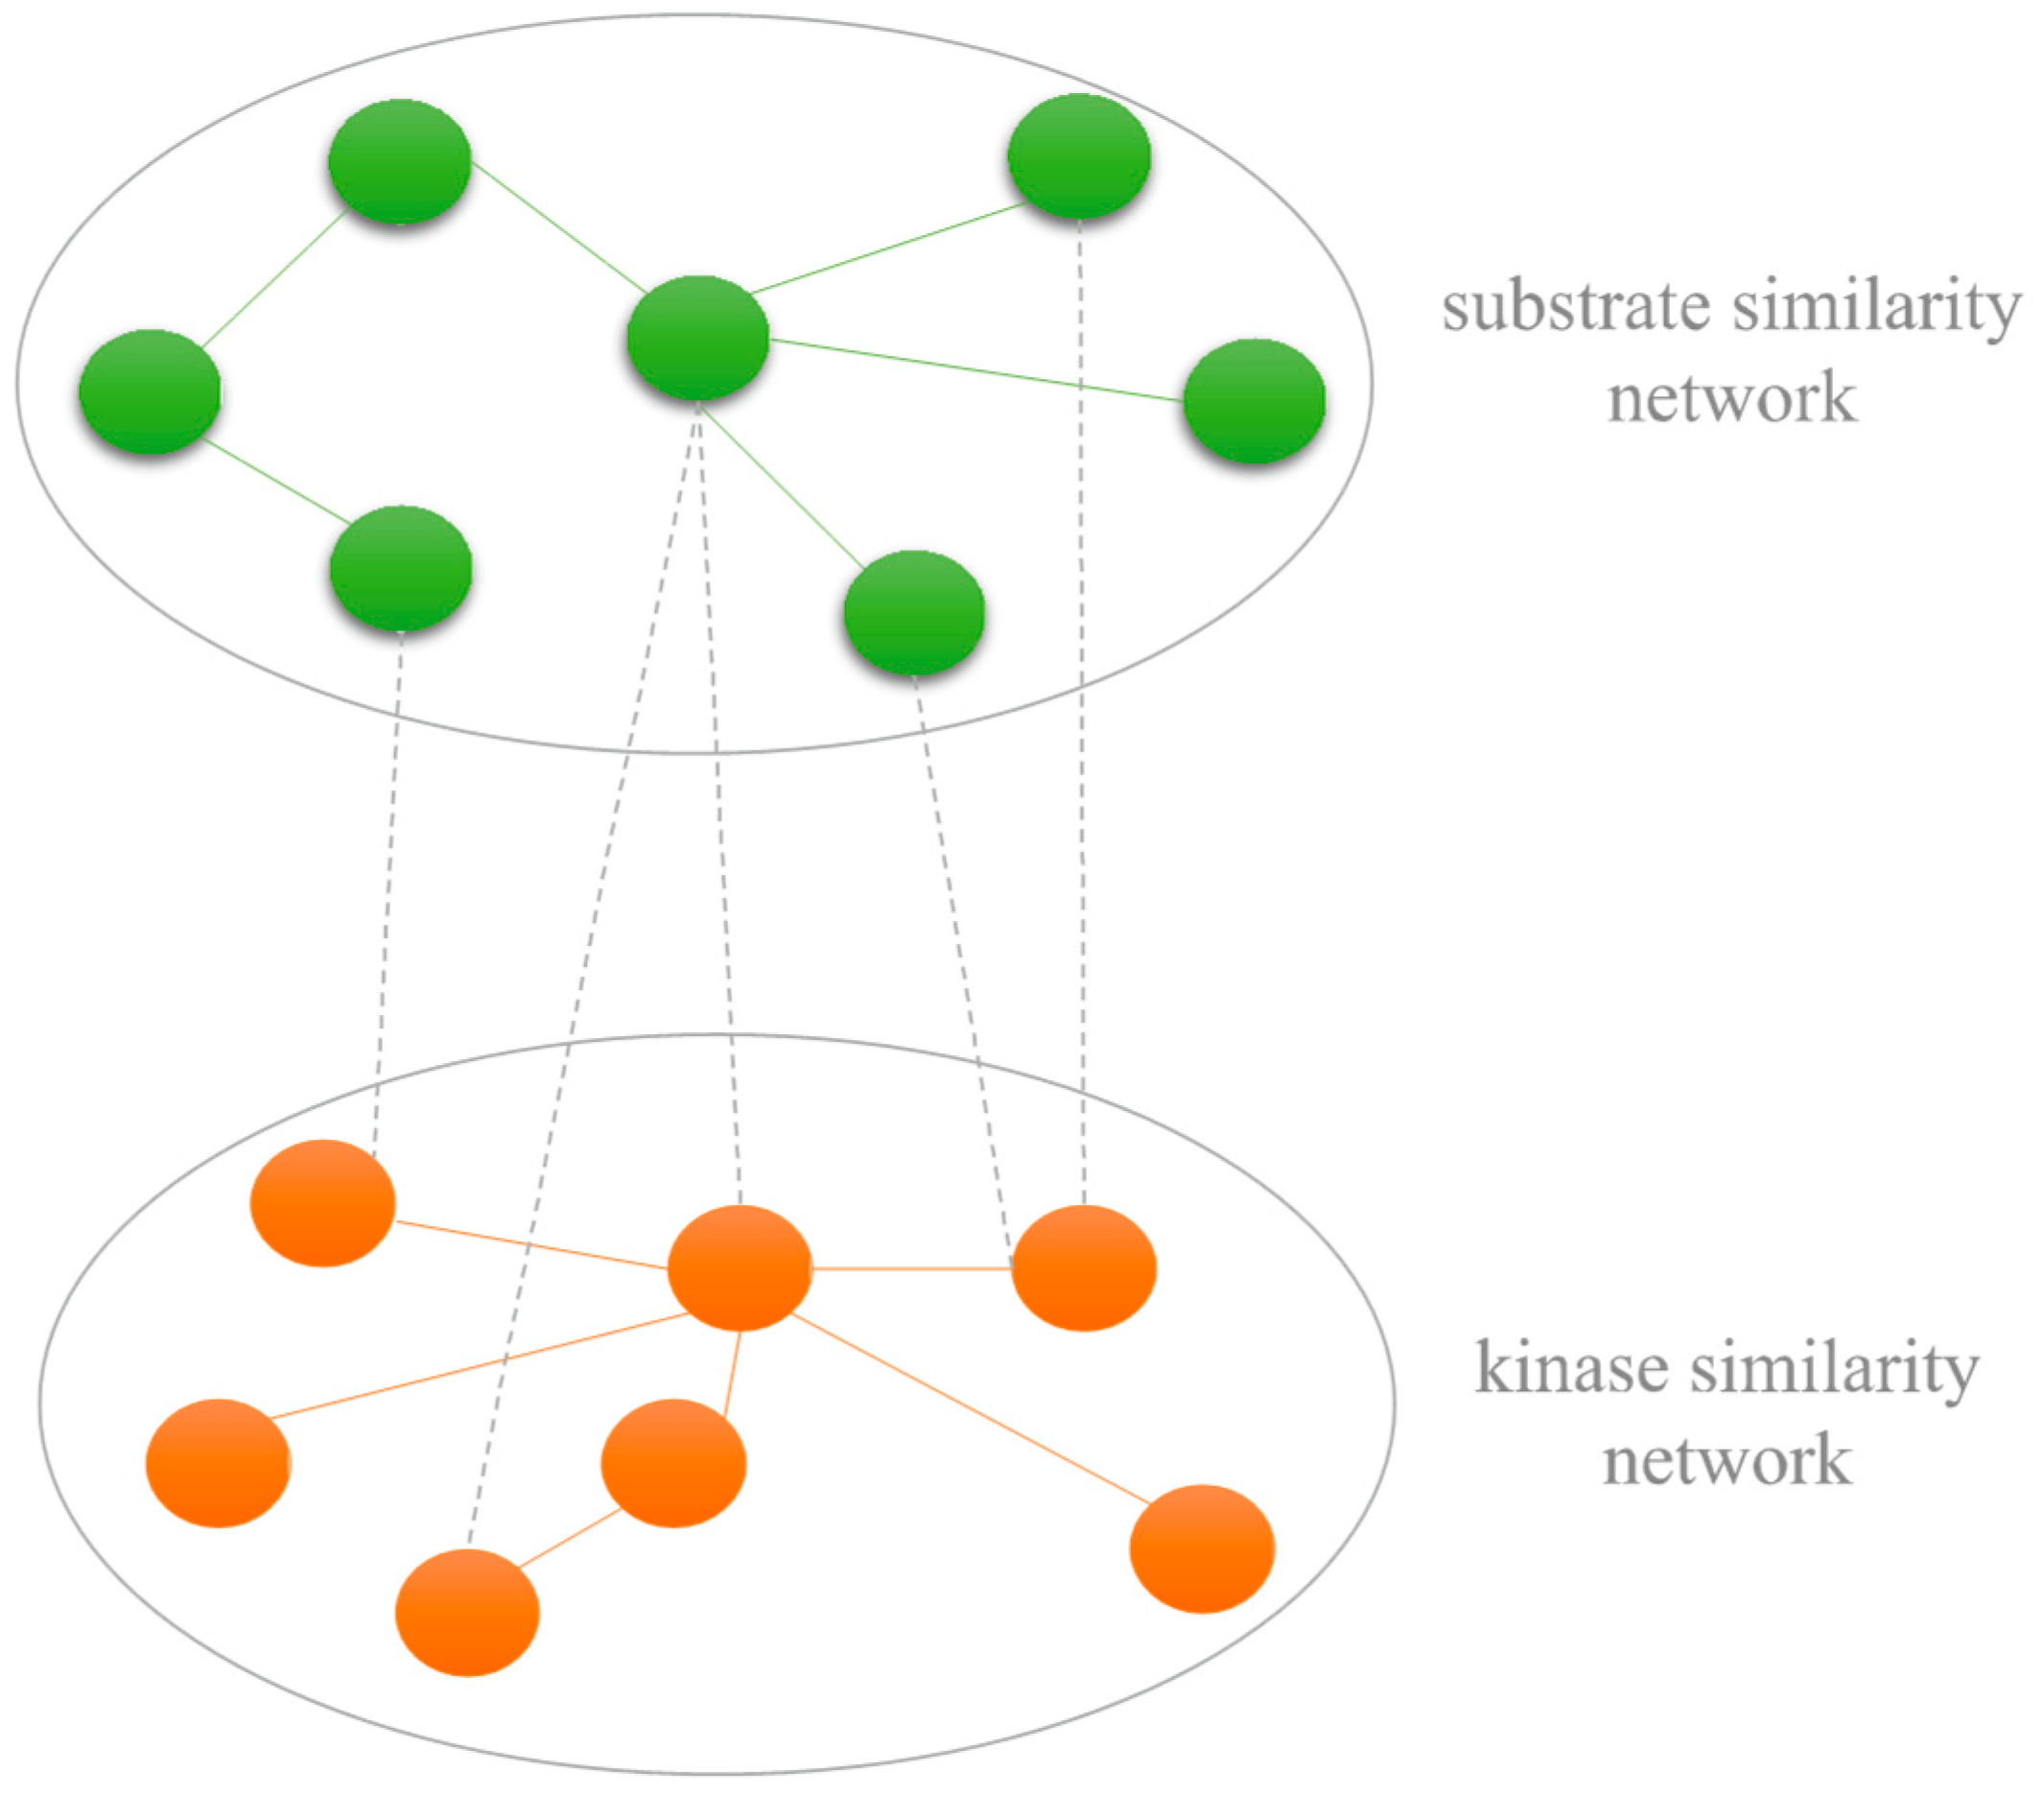
3.4. Construction of Kinase-Substrate Heterogenous Network

The heterogeneous network is constructed based on three sub-networks including the kinase similarity network, substrate similarity network and kinase–substrate association network. Let K = { K 1 , K 2 , , K m } represent the set of m different kinases. Mkk denotes the kinase similarity matrix. Similarly, for the substrate similarity network, let S = { S 1 , S 2 , , S n } represent the set of n different substrates. Mss denotes the substrate similarity matrix. The value of element Mss denotes the similarity of two substrates. The example of the kinase–substrate heterogenous network is shown in Figure 4.
The matrix M of the kinase–substrate heterogenous network can be defined as follows:
M = [ M K K M K S M K S T M S S ]
The main diagonal elements of matrix M are composed of sub-matrices M K K and M S S . The sub-diagonal elements are composed of sub-matrices M K S and M K S T . M K S T is the transpose of M K S .

3.5. Predicting Kinase-Substrate Interactions by Using Matrix Completion

The goal of the kinase–substrate interactions prediction is to complement the heterogeneous network adjacency matrix M by constructing a matrix M*. The adjacency matrix M can be recovered by minimizing the rank of the matrix based on the assumption that the matrix is of low rank. The optimization problem can be defined as:
min ( r a n k ( M ) ) s . t . P Ω ( M ) = P Ω ( M )
where M* is a candidate solution matrix with scores of all the unknown kinase–substrate interactions. Ω denotes a set of index of known elements in the matrix M. P Ω denotes an orthogonal projection matrix. It is defined as follows:
P Ω ( X ) = { X , ( i , j ) Ω 0 , ( i , j ) Ω
However, the rank minimization problem is known to be NP-Hard [34]. It is impractical for the problem of predicting kinase–substrate interactions with a large number of kinases and substrates. In order to facilitate the solution, the relaxation form [35] is used to minimize the nuclear norm with a soft threshold instead of minimizing the rank:
min ( τ M + 1 2 M F 2 ) s . t . P Ω ( M ) = P Ω ( M )
where M denotes the nuclear norm of the matrix M*. M F denotes the Frobernius form of M* and τ is a singular value threshold parameter.
This optimization problem can be solved by the singular value thresholding (SVT) algorithm [35]. For a matrix X with rank r, singular value decomposition of X R n 1 × n 2 is as follows:
X = U V , = diag ( { σ i } 1 i r )
where U and V are n 1 × r and r × n 2 , respectively. σ i is a nonnegative singular value. For each τ > 0 , the soft thresholding operator D τ is defined as follows:
D τ ( X ) = UD τ ( ) V , D τ ( ) = diag ( ( σ i τ ) + )
where ( σ i τ ) + denotes the positive part of ( σ i τ ) , namely ( σ i τ ) + = max ( 0 , ( S i t ) ) . This soft thresholding operation thus shrinks the singular values of X toward zero. The shrinkage iterations starts from Y0, and the matrix XK and YK are reconstructed continuously via:
{ X K = D τ ( Y K 1 ) Y K = Y K 1 + δ P Ω ( M X K )
where δ is the positive step size. The value of δ is set to ( m + n ) / | Ω | , and Y0 is set to τ / ( δ P Ω ( M ) ) δ P Ω ( M ) as suggested by previous research [36]. Since the algorithm needs to iteratively decompose and reconstruct the matrix, a fast implementation of the SVT algorithm [37] is used to improve the computational efficiency. The flow chart of predicting kinase–substrate interactions by using matrix completion is shown in Figure 5.

4. Conclusions

Protein phosphorylation is one of the most post-translational modifications, which plays critical roles in many cellular processes, such as cell metabolism, gene expression and cellular signal transduction. Abnormal action of kinases and substrates may lead to a series of diseases. Thus, identification of the interactions between substrates and its specific kinases can increase our understanding in the pathogenesis of diseases [38,39,40]. In this paper, we propose a computational method to predict kinase-substrate interactions by using matrix completion. Firstly, the kinase similarity matrix and the substrate similarity matrix are calculated by aligning the sequence of kinase–kinase and substrate–substrate, respectively. Then the original association network is adjusted and the adjacency matrix of the kinase–substrate heterogeneous network is constructed based on the similarities. Finally, the matrix completion is used to fill in the missing information in the adjacency matrix and to predict the potential kinase–substrate interactions. The experiment results show that our method outperforms other state-of-the-art algorithms in performance. In addition, as KSIMC only utilizes the sequence information, it also can be used to predict the kinase–substrate of other species such as prokaryotes.

Supplementary Materials

Supplementary materials can be found at https://www.mdpi.com/1422-0067/20/2/302/s1.

Author Contributions

Conceptualization, J.G. and W.L.; methodology, J.G. and W.L.; software, J.Q. and C.D.; validation, J.G., J.Q. and Y.H.; writing—original draft preparation, J.G. and W.L.; writing—review and editing, W.L. and Q.C.

Funding

This work is supported in part by the National Natural Science Foundation of China under Grant No. 61702122, 61762087, 61751314 and 31560317; Natural Science Foundation of Guangxi 2017GXNSFDA198033 and AB17195055; Scientific Research Fund of Guangxi Education Department 2015JGA325; Doctor foundation of Guangxi university XBZ180479 and foundation of Yulin normal university 2012YJQN29.

Conflicts of Interest

The authors declare no conflict of interest.

Abbreviations

KSIMC Predicting kinase-substrate interactions based on matrix completion
AUCArea Under roc Curve
ROCReceiver Operating Characteristic Curve
TPTrue Positive
FPFalse Positive
TNTrue Negative
FNFalse Negative
TPRTrue Positive Rate
FPRFalse Positive Rate

References

  1. Cohen, P. The origins of protein phosphorylation. Nat. Cell Biol. 2002, 4, E127–E130. [Google Scholar] [CrossRef] [PubMed]
  2. Olsen, J.V.; Blagoev, B.; Gnad, F.; Macek, B.; Kumar, C.; Mortensen, P.; Mann, M. Global, in vivo, and site-specific phosphorylation dynamics in signaling networks. Cell 2006, 127, 635–648. [Google Scholar] [CrossRef]
  3. Zheng, R.; Li, M.; Chen, X.; Wu, F.; Pan, Y.; Wang, J. BiXGBoost: A scalable, flexible boosting based method for reconstructing gene regulatory networks. Bioinformatics 2018, bty908. [Google Scholar] [CrossRef] [PubMed]
  4. Grabiec, A.M.; Korchynskyi, O.; Tak, P.P.; Reedquist, K.A. Histone deacetylase inhibitors suppress rheumatoid arthritis fibroblast-like synoviocyte and macrophage IL-6 production by accelerating mRNA decay. Ann. Rheum. Dis. 2012, 71, 424–431. [Google Scholar] [CrossRef] [PubMed]
  5. Cohen, P. The role of protein phosphorylation in human health and disease. Eur. J. Biochem. 2001, 268, 5001–5010. [Google Scholar] [CrossRef] [PubMed]
  6. Lan, W.; Wang, J.; Li, M.; Peng, W.; Wu, F. Computational approaches for prioritizing candidate disease genes based on PPI networks. Tsinghua Sci. Technol. 2015, 20, 500–512. [Google Scholar] [CrossRef]
  7. Zheng, R.; Li, M.; Li, Y.; Wu, F.; Wang, J. MGT-SM: A Method for Constructing Cellular Signal Transduction Networks. IEEE/ACM Trans. Comput. Biol. Bioinform. 2017. [Google Scholar] [CrossRef]
  8. Lan, W.; Wang, J.; Li, M.; Liu, J.; Li, Y.; Wu, F.; Pan, Y. Predicting drug–target interaction using positive-unlabeled learning. Neurocomputing 2016, 206, 50–57. [Google Scholar] [CrossRef]
  9. Salinas, M.; Wang, J.; de Sagarra, M.R.; Martín, D.; Rojo, A.I.; Martin-Perez, J.; de Montellano, P.R.O.; Cuadrado, A. Protein kinase Akt/PKB phosphorylates heme oxygenase-1 in vitro and in vivo. FEBS Lett. 2004, 578, 90–94. [Google Scholar] [CrossRef] [Green Version]
  10. Lin, J.; Xie, Z.; Zhu, H.; Qian, J. Understanding protein phosphorylation on a systems level. Brief. Funct. Genom. 2010, 9, 32–42. [Google Scholar] [CrossRef] [Green Version]
  11. Dinkel, H.; Chica, C.; Via, A.; Gould, C.M.; Jensen, L.J.; Gibson, T.J.; Diella, F. Phospho. ELM: A database of phosphorylation sites—Update 2011. Nucleic Acids Res. 2010, 39, D261–D267. [Google Scholar] [CrossRef] [PubMed]
  12. Hornbeck, P.V.; Kornhauser, J.M.; Tkachev, S.; Zhang, B.; Skrzypek, E.; Murray, B.; Latham, V.; Sullivan, M. PhosphoSitePlus: A comprehensive resource for investigating the structure and function of experimentally determined post-translational modifications in man and mouse. Nucleic Acids Res. 2011, 40, D261–D270. [Google Scholar] [CrossRef] [PubMed]
  13. Deng, C.; Chen, Q.; Liu, Z.; Zheng, R.; Liu, J.; Wang, J.; Lan, W. KSIBW: Predicting Kinase-Substrate Interactions Based on Bi-random Walk. In Bioinformatics Research and Applications: 14th International Symposium, ISBRA 2018, Beijing, China, 8–11 June 2018; Springer International Publishing: Cham, Switzerland, 2018; pp. 151–162. [Google Scholar]
  14. Chen, Q.; Wang, Y.; Chen, B.; Zhang, C.; Wang, L.; Li, J. Using Propensity Scores to Predict the Kinases of Unannotated Phosphopeptides. Knowl.-Based Syst. 2017, 135, 60–76. [Google Scholar] [CrossRef]
  15. Linding, R.; Jensen, L.J.; Ostheimer, G.J.; van Vugt, M.A.; Jørgensen, C.; Miron, I.M.; Diella, F.; Colwill, K.; Taylor, L.; Elder, K. Systematic discovery of in vivo phosphorylation networks. Cell 2007, 129, 1415–1426. [Google Scholar] [CrossRef] [PubMed]
  16. Dang, T.H.; Van Leemput, K.; Verschoren, A.; Laukens, K. Prediction of kinase-specific phosphorylation sites using conditional random fields. Bioinformatics 2008, 24, 2857–2864. [Google Scholar] [CrossRef] [PubMed] [Green Version]
  17. Zhou, F.-F.; Xue, Y.; Chen, G.-L.; Yao, X. GPS: A novel group-based phosphorylation predicting and scoring method. Biochem. Biophys. Res. Commun. 2004, 325, 1443–1448. [Google Scholar] [CrossRef]
  18. Zou, L.; Wang, M.; Shen, Y.; Liao, J.; Li, A.; Wang, M. PKIS: Computational identification of protein kinases for experimentally discovered protein phosphorylation sites. BMC Bioinform. 2013, 14, 247. [Google Scholar] [CrossRef]
  19. Torii, M.; Liu, H.; Hu, Z.-Z. Support vector machine-based mucin-type o-linked glycosylation site prediction using enhanced sequence feature encoding. AMIA Annu. Symp. Proc. 2009, 2009, 640–644. [Google Scholar]
  20. Patrick, R.; Lê Cao, K.-A.; Kobe, B.; Bodén, M. PhosphoPICK: Modelling cellular context to map kinase-substrate phosphorylation events. Bioinformatics 2014, 31, 382–389. [Google Scholar] [CrossRef]
  21. Fan, W.; Xu, X.; Shen, Y.; Feng, H.; Li, A.; Wang, M. Prediction of protein kinase-specific phosphorylation sites in hierarchical structure using functional information and random forest. Amino Acids 2014, 46, 1069–1078. [Google Scholar] [CrossRef]
  22. Li, A.; Xu, X.; Zhang, H.; Wang, M. Kinase identification with supervised laplacian regularized least squares. PLoS ONE 2015, 10, e0139676. [Google Scholar] [CrossRef] [PubMed]
  23. Song, J.; Wang, H.; Wang, J.; Leier, A.; Marquez-Lago, T.; Yang, B.; Zhang, Z.; Akutsu, T.; Webb, G.I.; Daly, R.J. PhosphoPredict: A bioinformatics tool for prediction of human kinase-specific phosphorylation substrates and sites by integrating heterogeneous feature selection. Sci Rep. 2017, 7, 6862. [Google Scholar] [CrossRef] [PubMed]
  24. Gnad, F.; Gunawardena, J.; Mann, M. PHOSIDA 2011: The posttranslational modification database. Nucleic Acids Res. 2011, 39, 253–260. [Google Scholar] [CrossRef] [PubMed]
  25. Song, C.; Ye, M.; Liu, Z.; Cheng, H.; Jiang, X.; Han, G.; Songyang, Z.; Tan, Y.; Wang, H.; Ren, J. Systematic analysis of protein phosphorylation networks from phosphoproteomic data. Mol. Cell. Proteom. 2012, 11, 1070–1083. [Google Scholar] [CrossRef] [PubMed]
  26. Damle, N.P.; Mohanty, D. Deciphering kinase–substrate relationships by analysis of domain-specific phosphorylation network. Bioinformatics 2014, 30, 1730–1738. [Google Scholar] [CrossRef] [PubMed]
  27. Li, H.; Wang, M.; Xu, X. Prediction of kinase–substrate relations based on heterogeneous networks. J. Bioinform. Comput. Biol. 2015, 13, 1542003. [Google Scholar] [CrossRef] [PubMed]
  28. Qin, G.-M.; Li, R.-Y.; Zhao, X.-M. PhosD: Inferring kinase–substrate interactions based on protein domains. Bioinformatics 2016, 33, 1197–1204. [Google Scholar] [CrossRef]
  29. Shi, C.; Kong, X.; Huang, Y.; Philip, S.Y.; Wu, B. HeteSim: A General Framework for Relevance Measure in Heterogeneous Networks. IEEE Trans. Knowl. Data Eng. 2014, 26. [Google Scholar] [CrossRef]
  30. Walker, M.P.; DiAugustine, R.P.; Zeringue, E.; Bunger, M.K.; Schmitt, M.; Archer, T.K.; Richards, R.G. An Insulin-Like Growth Factor-1 (IGF-1)/Insulin Receptor Substrate-1 (IRS-1) Pathway Stimulates a Mitotic Kinase (cdk1) in the Uterine Epithelium During the Proliferative Response to Estradiol. J. Endocrinol. 2010, 207, 225–235. [Google Scholar] [CrossRef]
  31. Rice, P.; Longden, I.; Bleasby, A. EMBOSS: The European molecular biology open software suite. Trends Genet. 2000, 16, 276–277. [Google Scholar] [CrossRef]
  32. Chen, Q.F.; Lan, W.; Wang, J.X. Mining featured patterns of MiRNA interaction based on sequence and structure similarity. IEEE/ACM Trans. Comput. Biol. Bioinform. 2013, 10, 415–422. [Google Scholar] [CrossRef] [PubMed]
  33. Lan, W.; Chen, Q.F.; Li, T.S.; Yuan, C.G.; Mann, S.; Chen, B.S. Identification of important positions within miRNAs by integrating sequential and structural features. Curr. Protein Pept. Sci. 2014, 15, 591–597. [Google Scholar] [CrossRef] [PubMed]
  34. Natarajan, B.K. Sparse approximate solutions to linear systems. SIAM J. Comput. 1995, 24, 227–234. [Google Scholar] [CrossRef]
  35. Cai, J.-F.; Candès, E.J.; Shen, Z. A singular value thresholding algorithm for matrix completion. SIAM J. Optim. 2010, 20, 1956–1982. [Google Scholar] [CrossRef]
  36. Luo, H.; Li, M.; Wang, S.; Liu, Q.; Li, Y.; Wang, J. Computational drug repositioning using low-rank matrix approximation and randomized algorithms. Bioinformatics 2018, 34, 1904–1912. [Google Scholar] [CrossRef] [PubMed]
  37. Li, Y.; Yu, W. A Fast Implementation of Singular Value Thresholding Algorithm using Recycling Rank Revealing Randomized Singular Value Decomposition. arXiv, 2017; arXiv:1704.05528. [Google Scholar]
  38. Lan, W.; Wang, J.; Li, M.; Liu, J.; Wu, F.; Pan, Y. Predicting microRNA-disease associations based on improved microRNA and disease similarities. IEEE/ACM Trans. Comput. Biol. Bioinform. 2018, 15, 1774–1782. [Google Scholar] [CrossRef]
  39. Liu, J.; Li, M.; Lan, W.; Wu, F.; Pan, Y.; Wang, J. Classification of alzheimer’s disease using whole brain hierarchical network. IEEE/ACM Trans. Comput. Biol. Bioinform. 2018, 15, 624–632. [Google Scholar] [CrossRef]
  40. Lan, W.; Li, M.; Zhao, K.; Liu, J.; Wu, F.; Pan, Y.; Wang, J. LDAP: A web server for lncRNA-disease association prediction. Bioinformatics 2017, 33, 458–460. [Google Scholar] [CrossRef]
Figure 1. The ROC curves for predicting kinase–substrate interactions with different methods.
Ijms 20 00302 g001
Figure 2. The ROC curves for kinase group CAMK, CMGC, STE and TK with different algorithms.
Ijms 20 00302 g002
Figure 3. Adjust the kinase–substrate association network.
Ijms 20 00302 g003
Figure 4. An example of the kinase–substrate heterogenous network.
Ijms 20 00302 g004
Figure 5. The flow chart of potential kinase–substrate interactions identification by using matrix completion.
Ijms 20 00302 g005
Table 1. The top 10 potential kinases of IRS1 predicted by KSIMC.
TopSubstratePredicted KinaseEvidence
1IRS1CDK1PMID: 20798132
2IRS1MAPK1PhosphoNET
3IRS1PRKCAPhosphoNET
4IRS1ABL1Unknown
5IRS1CSNK2A1Unknown
6IRS1MAPK8PhosphoNET
7IRS1PRKCEPhosphoNET
8IRS1GSK3BUnknown
9IRS1PRKG1Unknown
10IRS1RPS6KA3Unknown

