Article

Organ-Specific Analysis of Morus alba Using a Gel-Free/Label-Free Proteomic Technique

1
College of Biomedical Engineering and Instrument Science, Zhejiang University, Hangzhou 310027, China
2
Faculty of Environmental and Information Sciences, Fukui University of Technology, Fukui 910-8505, Japan
3
Analysis Center of Agrobiology and Environmental Sciences, Zhejiang University, Hangzhou 310027, China
4
Key Laboratory for Biomedical Engineering of Ministry of Education, Zhejiang-Malaysia Joint Research Center for Traditional Medicine, Zhejiang University, Hangzhou 310027, China
*
Author to whom correspondence should be addressed.
These authors contributed equally to this work.
Int. J. Mol. Sci. 2019, 20(2), 365; https://doi.org/10.3390/ijms20020365
Submission received: 15 December 2018 / Revised: 14 January 2019 / Accepted: 15 January 2019 / Published: 16 January 2019
(This article belongs to the Special Issue Plant Proteomic Research 2.0)

Abstract

:
Morus alba is an important medicinal plant that is used to treat human diseases. The leaf, branch, and root of Morus can be applied as antidiabetic, antioxidant, and anti-inflammatory medicines, respectively. To explore the molecular mechanisms underlying the various pharmacological functions within different parts of Morus, organ-specific proteomics were performed. Protein profiles of the Morus leaf, branch, and root were determined using a gel-free/label-free proteomic technique. In the Morus leaf, branch, and root, a total of 492, 414, and 355 proteins were identified, respectively, including 84 common proteins. In leaf, the main function was related to protein degradation, photosynthesis, and redox ascorbate/glutathione metabolism. In branch, the main function was related to protein synthesis/degradation, stress, and redox ascorbate/glutathione metabolism. In root, the main function was related to protein synthesis/degradation, stress, and cell wall. Additionally, organ-specific metabolites and antioxidant activities were analyzed. These results revealed that flavonoids were highly accumulated in Morus root compared with the branch and leaf. Accordingly, two root-specific proteins named chalcone flavanone isomerase and flavonoid 3,5-hydroxylase were accumulated in the flavonoid pathway. Consistent with this finding, the content of the total flavonoids was higher in root compared to those detected in branch and leaf. These results suggest that the flavonoids in Morus root might be responsible for its biological activity and the root is the main part for flavonoid biosynthesis in Morus.

1. Introduction

Mulberry tree (Morus alba L.) is a deciduous woody shrub in the family Moraceae and widely cultivated in China, Korea, India, and Japan [1]. In addition to its use in sericulture, Morus can be used in fruit production, tolerating saline soils, and soil retention in loess soils [2,3]. In China, different parts of the mulberry tree have a long history of being used in traditional Chinese medicine to treat human diseases such as diabetes, arthritis, and rheumatism [4]. Therefore, Morus has attracted attention for its pharmaceutical value. For example, the mulberry leaf has been proven to modulate the cardiovascular system through endothelial nitric oxide synthase signaling [5] and mulberry-leaf polysaccharides, which are one of the main active components in mulberry leaf, have been purified from an ethanol extraction and showed potential antioxidative activities [6]. The mulberry-branch bark had a powerful antidiabetic effect that could rescue gluconeogenesis and glycogen synthesis by protecting genes in the phosphatidylinositol-3 kinase and protein kinase B signaling pathways [7]. Furthermore, the ethanol extraction of mulberry root bark could effectively ameliorate hyperlipidemia and four major active compounds, including mulberrofuran C, sanggenon G, moracin O, and moracin P, were isolated [8]. However, the mechanisms for the different biological activity in different parts of Morus remain unclear.
For most medicinal plants, their pharmaceutical value varies in different parts of the plant. For example, the Scutellaria baicalensis root rather than its aerial parts can be used as a traditional Chinese medicine for its anticancer, anti-HIV, and antibacterial effects [9]. The flower from Coreopsis tinctorial has been reported to possess antioxidative and antidiabetic activities and is used as a health food, while its stems and leaves are commonly discarded [10]. Organ- and tissue-specific studies are an effective way to discover the reason for these phenomena and aid in the quality control and pharmacological evaluation of medicinal plants, especially for medicinal plants such as Morus whose vegetative organs (root, branch, and leaf) can all be used as medicines. A comparative study on the antioxidant activity and phenolic contents of methanol extractions from mulberry leaf, stem bark, fruit, and root bark indicated that the mulberry stem bark had the highest antioxidant activity [11]. In contrast, the ethanol extraction from mulberry leaf had a higher antioxidant activity than the fruit and stem extractions [12]. Furthermore, the antioxidant activity of the ethanolic extraction from mulberry twigs was better than that from mulberry root bark [13]. However, there have been no systemic studies comparing the antioxidant activities among mulberry root, branch, and leaf, and the mechanisms of their different antioxidant activities are still unknown.
Omics technologies allow for the analysis of the complete set of genomes and are the most popular approaches for performing systemic studies [14]. The majority of functional genomics is based on transcriptomics, proteomics and metabolomics [15]. Proteomic technologies provide one of the best choices for the functional analysis of translated parts of the genome and have been applied in organ-/tissue-specific studies in plants. Zhu et al. [16] performed organ-specific proteomic analysis on the medicinal plant Mahonia and successfully identified the root-specific expressed proteins S-adenosylmethionine synthetase and (S)-tetrahydroprotoberberine. As the roots accumulated the most alkaloids, such as columbamine, jatrorrhizine, palmatine, tetrandrine, and berberine, these proteins are assumed to be involved in alkaloid biosynthesis. Ji et al. [17] conducted a comparative proteomics analysis using healthy and infected leaves from Morus to study the dwarf response mechanism. Therefore, proteomic approaches can provide significantly more detailed protein information in different organs, which may be beneficial for revealing important mechanisms.
Although the leaf, branch, and root of Morus can all be used as traditional Chinese medicine, additional studies are needed to identify the organ-specific factors with medicinal value. In this study, to uncover the molecular mechanisms of the different pharmacological functions in Morus leaf, branch, and root, gel-free/label-free proteomic approach was used. Bioinformatic, phytochemical, and qRT-PCR techniques were used for confirmation of results from proteomics.

2. Results

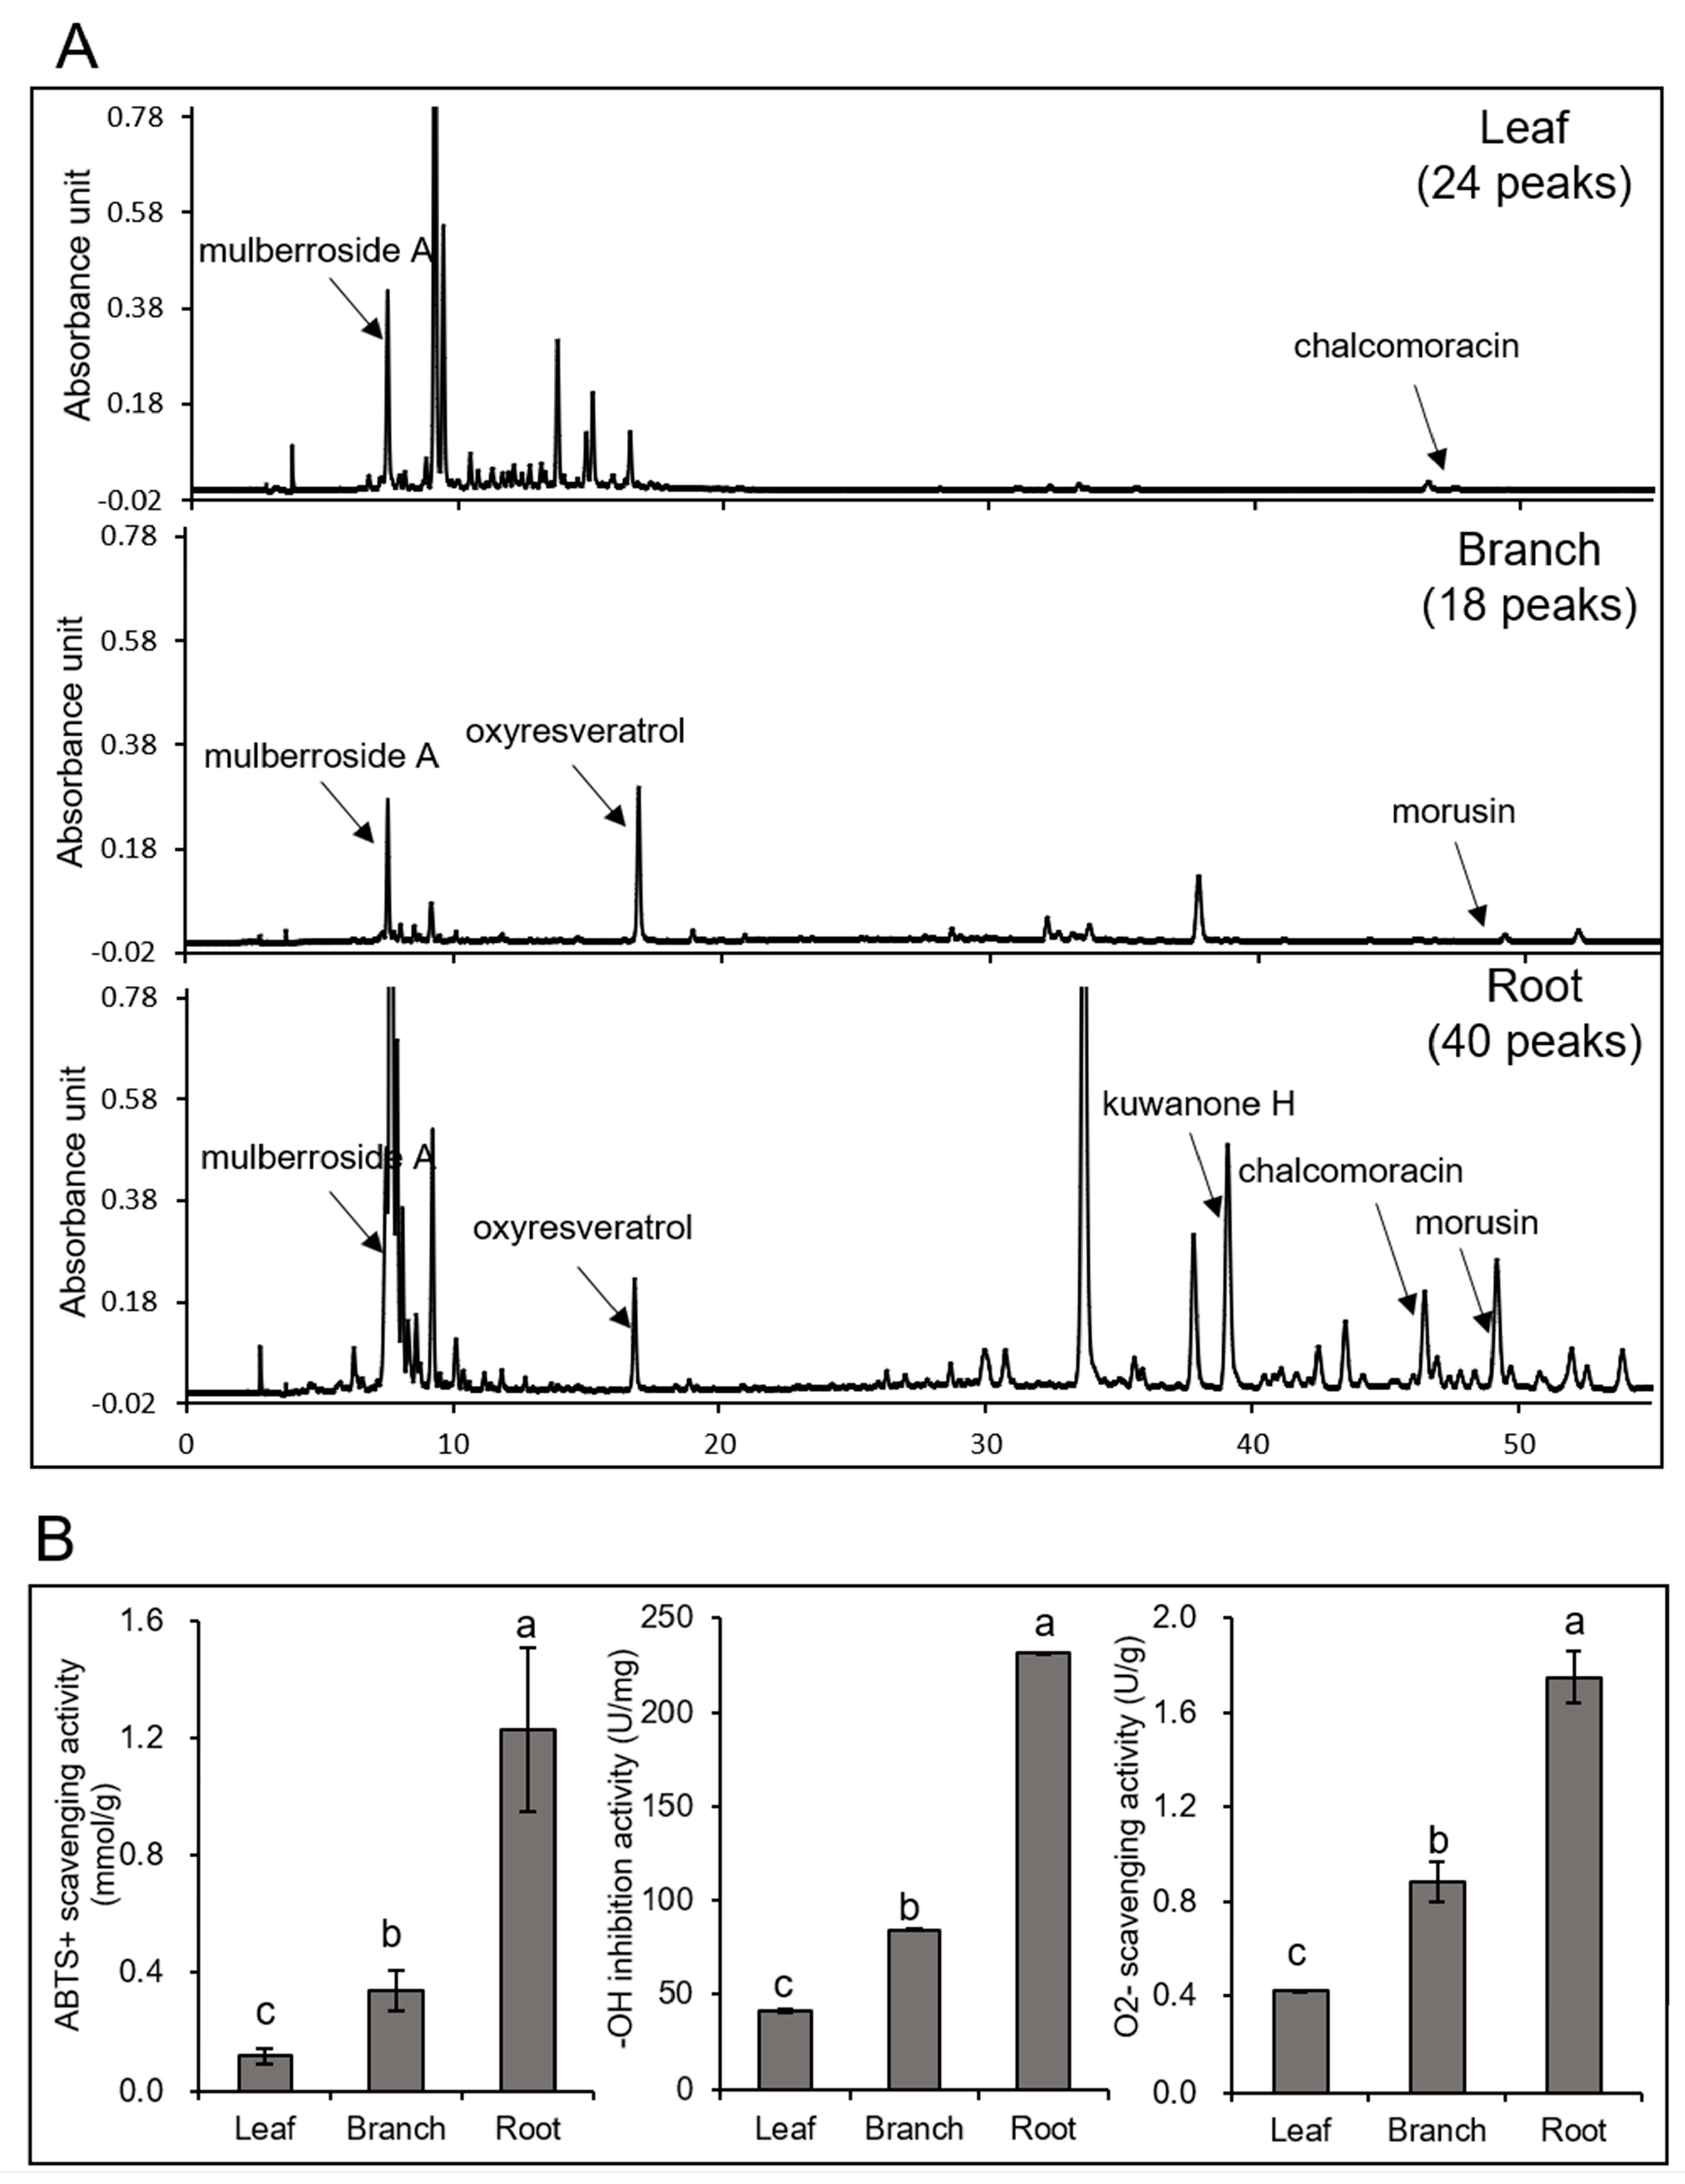
2.1. The Metabolite Contents and Antioxidant Activity in Morus Root were Higher than in Branch and Leaf

To reveal differences among the leaf, branch, and root in Morus, five secondary metabolites were identified in the three organs. The leaf, branch and root were collected from mulberry trees and methanol extracts from the three organs were examined by HPLC analysis. From the HPLC chromatograms detected at 320 nm, 24, 18, and 40 peaks were observed in the extracts from the leaf, branch, and root, respectively (Figure 1A). Five major secondary metabolites including mulberroside A, oxyresveratrol, kuwanone H, chalcomoracin, and morusin were identified in the root, while only three of the five metabolites (mulberroside A, oxyresveratrol, and morusin) were detected in the branch and two of the five metabolites (mulberroside A, and chalcomoracin) were detected in the leaf. Except for oxyresveratrol, the contents of the other four metabolites in the root are more than 10 times higher than those in the leaf and branch (Table 1). To understand the biological differences among the three organs in Morus, the antioxidant activities were evaluated by using an ABTS+ scavenging activity, hydroxyl free radical, and O2 scavenging activity assays. As a result, the root had the strongest ABTS+ scavenging activity, O2 scavenging activity, and hydroxyl free radical inhibition activity, while the leaf had the worst antioxidant activity (Figure 1B).

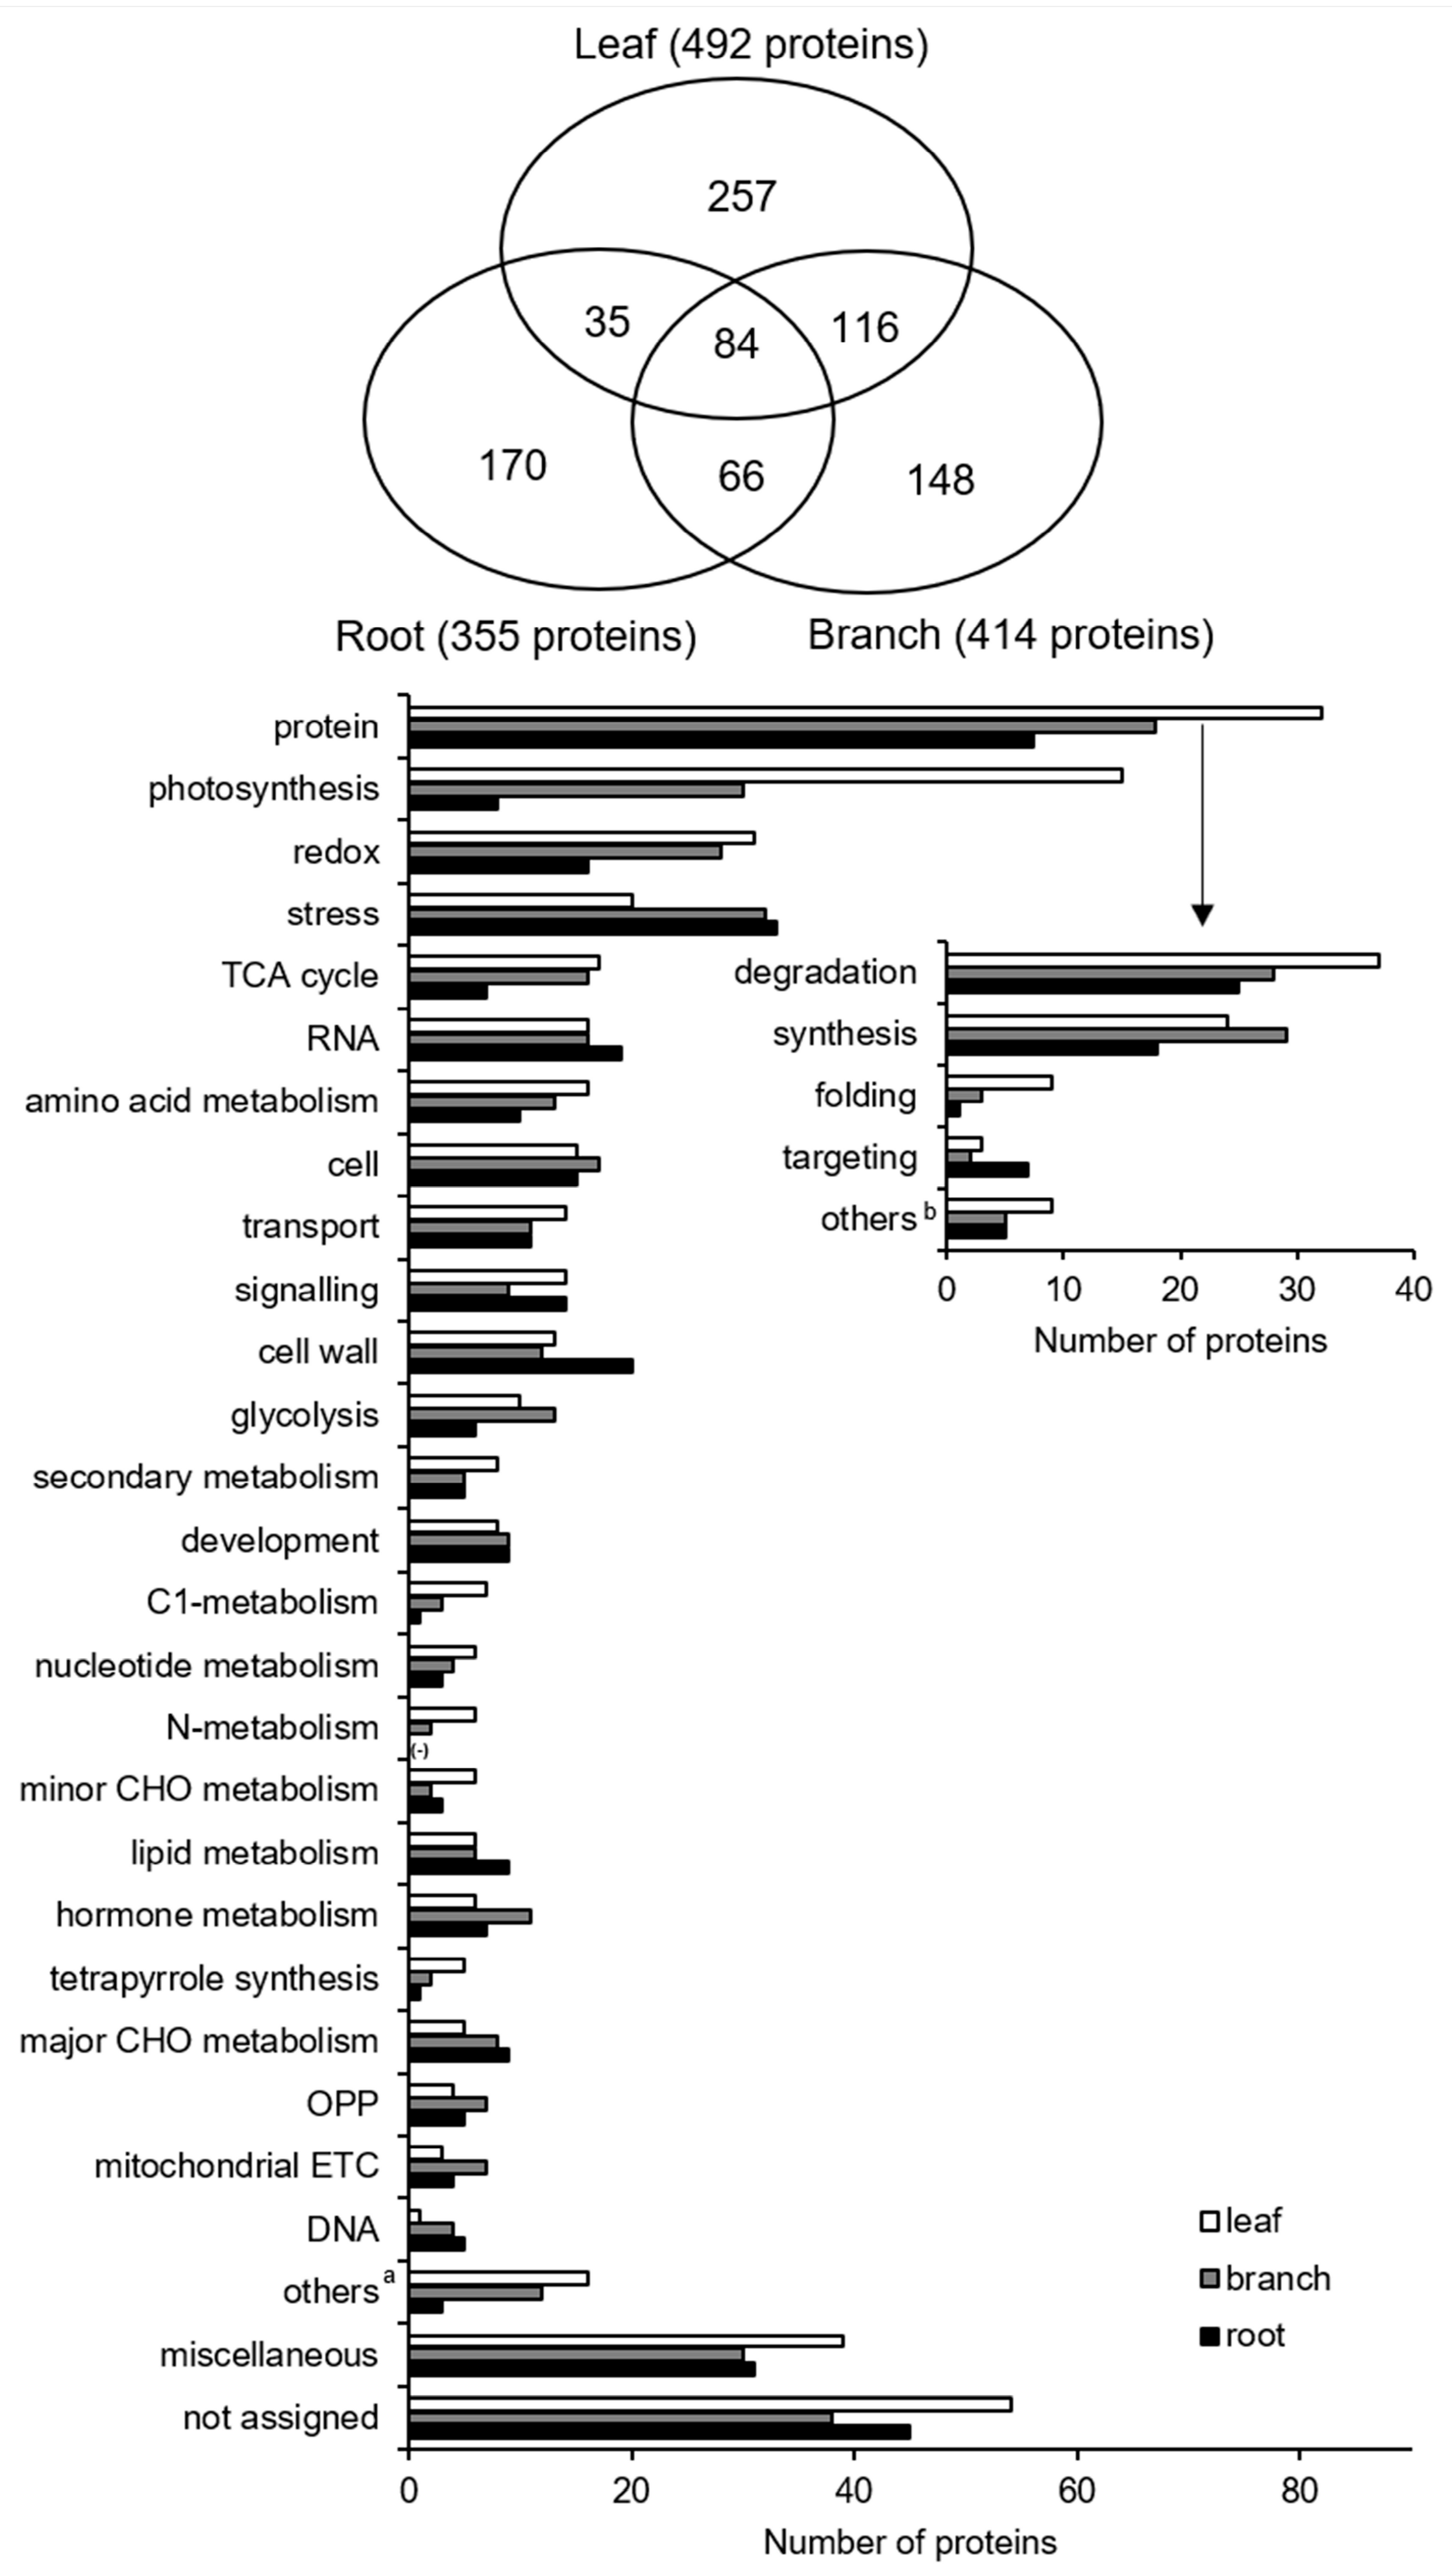
2.2. A Total of 257, 148, and 170 Proteins were Specific to Leaf, Branch, and Root in Morus, Respectively

To analyze the mechanisms functioning within the three organs, a gel-free proteomics approach was used to identify and determine the abundance of proteins in mulberry leaf, branch, and root with the help of nano LC-MS/MS. A total of 492, 414, and 355 proteins with more than two matched peptides were identified in the leaf (Supplemental Table S1), branch (Supplemental Table S2) and root (Supplemental Table S3), respectively. Among these proteins, 257 (257/492, 52%), 148 (148/414, 36%), and 170 (170/355, 48%) were specific to the leaf, branch, and root, respectively (Figure 2).
To determine the biological processes involved in the three organs, the identified proteins were functionally classified using MapMan bin codes (Figure 2, Supplemental Tables S1–S3, Supplemental Figure S4. In leaf, the main functional categories were related to protein metabolism (82/492, 17%), photosynthesis (64/492, 13%), redox ascorbate/glutathione metabolism (31/492, 6%), stress (20/492, 4%), and tricarboxylic acid cycle (TCA, 17/492, 3%). In branch, the main functional categories were related to protein metabolism (67/414, 16%), stress (32/414, 8%), photosynthesis (30/414, 7%), redox ascorbate/glutathione metabolism (28/414, 7%), and cell cycle/cell organization and division (17/414, 4%). In root, the main functional categories were related to protein metabolism (56/355, 16%), stress (33/355, 9%), cell wall (20/355, 6%), RNA metabolism (19/355, 5%), and redox ascorbate/glutathione metabolism (16/355, 5%). Based on these results, proteins related to protein synthesis/degradation comprised the main functional category in all three organs. The abundance of proteins related to redox, TCA cycle, and glycolysis largely differed in the root samples compared to the leaf and branch samples (Figure 2).

2.3. Functional Characterization of Organ-Specific Proteins Identified from Morus

To determine the organ-specific protein expression patterns within each organ, leaf-, branch-, and root-specific proteins were functionally categorized and visualized using the MapMan software (version 3.6.0RC1, Aachen, Germany) (Figure 3). In the root, the number of cell wall-related proteins (10 proteins) was larger than in the leaf (four proteins) and branch (two proteins). Moreover, the proteins related to lipid metabolism identified in the root (four proteins) are more than the other organs (one protein for branch and two proteins for leaf). Additionally, five root-specific proteins related to major carbohydrate metabolism are functionally categorized as the degradation of sucrose and starch, while two leaf-specific proteins are involved in the synthesis of sucrose. In amino acid synthesis/metabolism, four root-specific proteins were found to be involved with amino acids; these belonged to the glutamate and aspartate families. There were also four leaf-specific proteins related to amino acid degradation/metabolism.
There were several specifically identified proteins mapped to secondary metabolism that exhibited organ-specific expression patterns. Therefore, the organ-specific proteins involved in secondary metabolism were visualized using the MapMan software (version 3.6.0RC1, Aachen, Germany) (Supplemental Figure S1). There were eight, five, and four specifically identified proteins from the leaf, branch, and root samples, respectively. Leaf-specific proteins related to secondary metabolism mainly accumulated in the non-MVA and phenlypropanoid pathways. Branch-specific proteins related to secondary metabolism mainly accumulated in the phenlypropanoid and lignin/lignan pathways. Notably, the root-specific proteins related to secondary metabolism, such as chalcone flavanone isomerase and flavonoid 3,5-hydroxylase, were accumulated in the flavonoid pathway, especially for the biosynthesis of chalcones and dihydroflavonols (Figure 4).

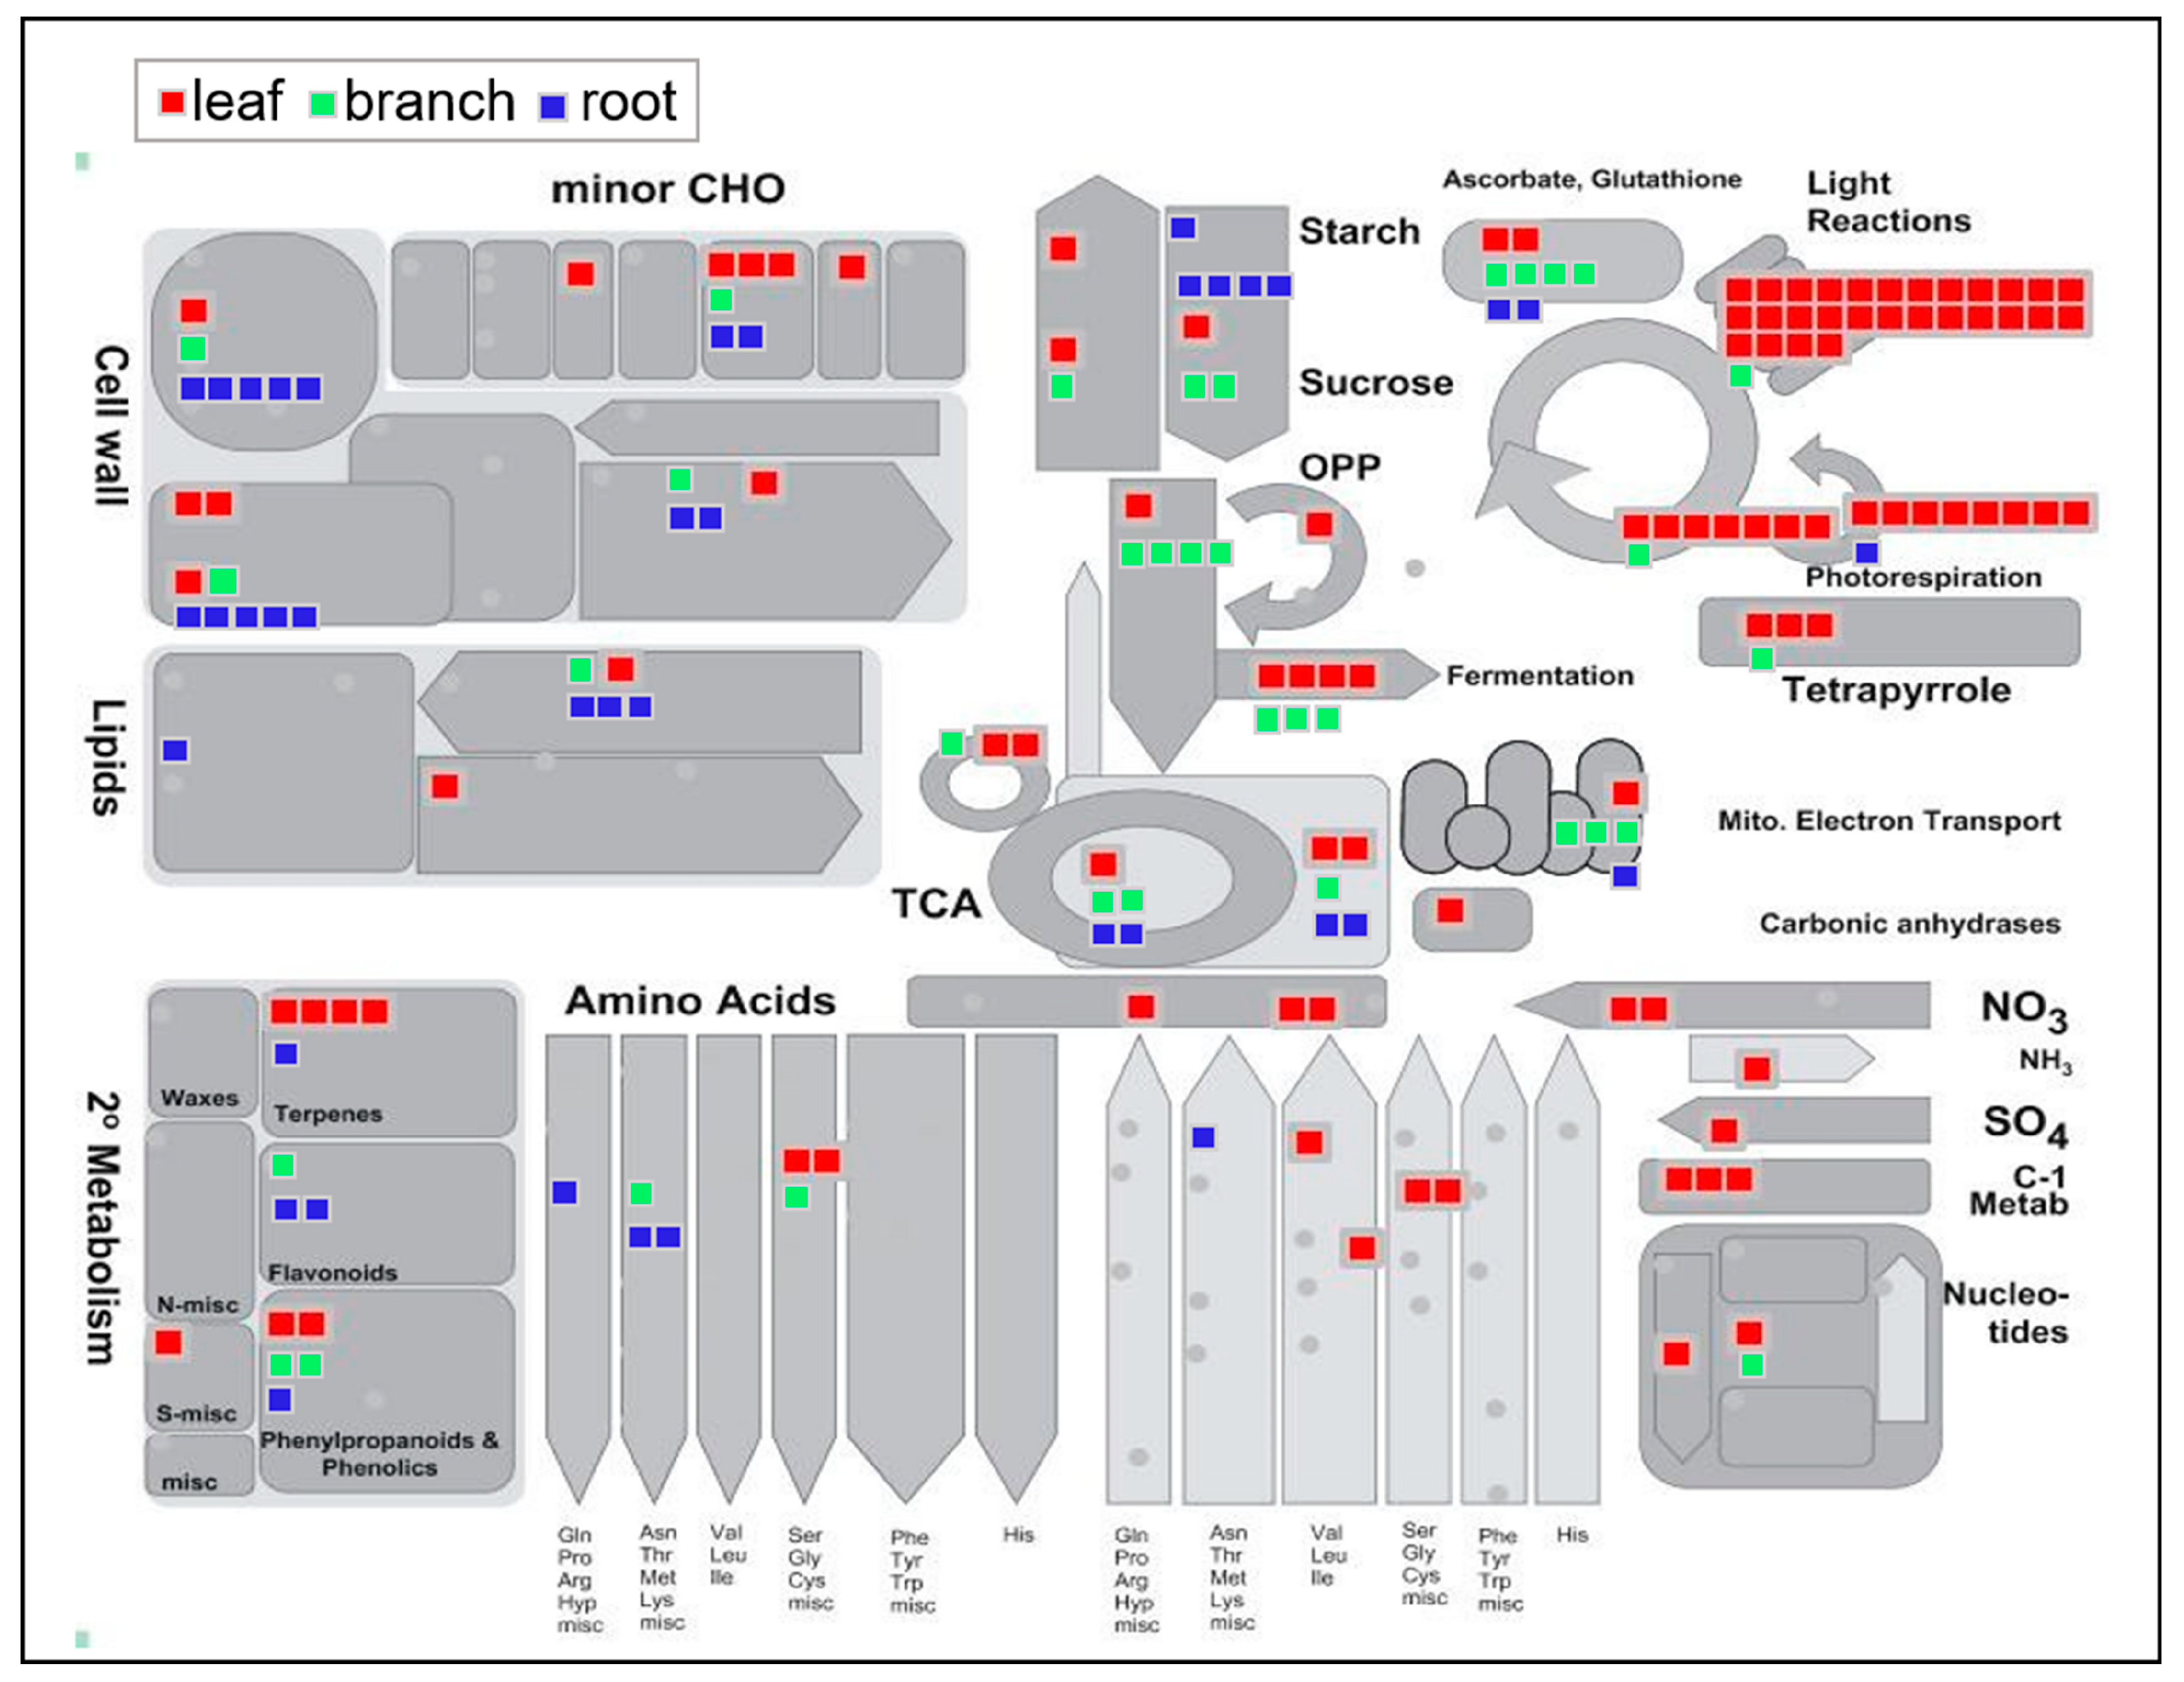
2.4. Largely Differential Common Proteins Were Identified among Three Organs in Morus

To further analyze the differences in the proteins among the three organs, Venn diagram analysis was performed on the proteins identified in the three organs (Figure 2). A total of 84 proteins was commonly identified from the three organs, and the abundance of peroxidase (protein number 2) in the root was significantly higher than in the branch and leaf (Table 2). The abundance of proteasome (protein number 9) in the root was approximately six times higher than that found in the leaf. However, isoflavone reductase homolog P3 (protein number 48), which is the only protein involved in secondary metabolism from the commonly identified protein group, was the most abundant in the branch samples (1.17 mol%) compared to the leaf (0.33 mol%) and root (0.37 mol%) samples. Furthermore, the abundance of triosephosphate isomerase in the leaf is approximately ten times higher than in the root.

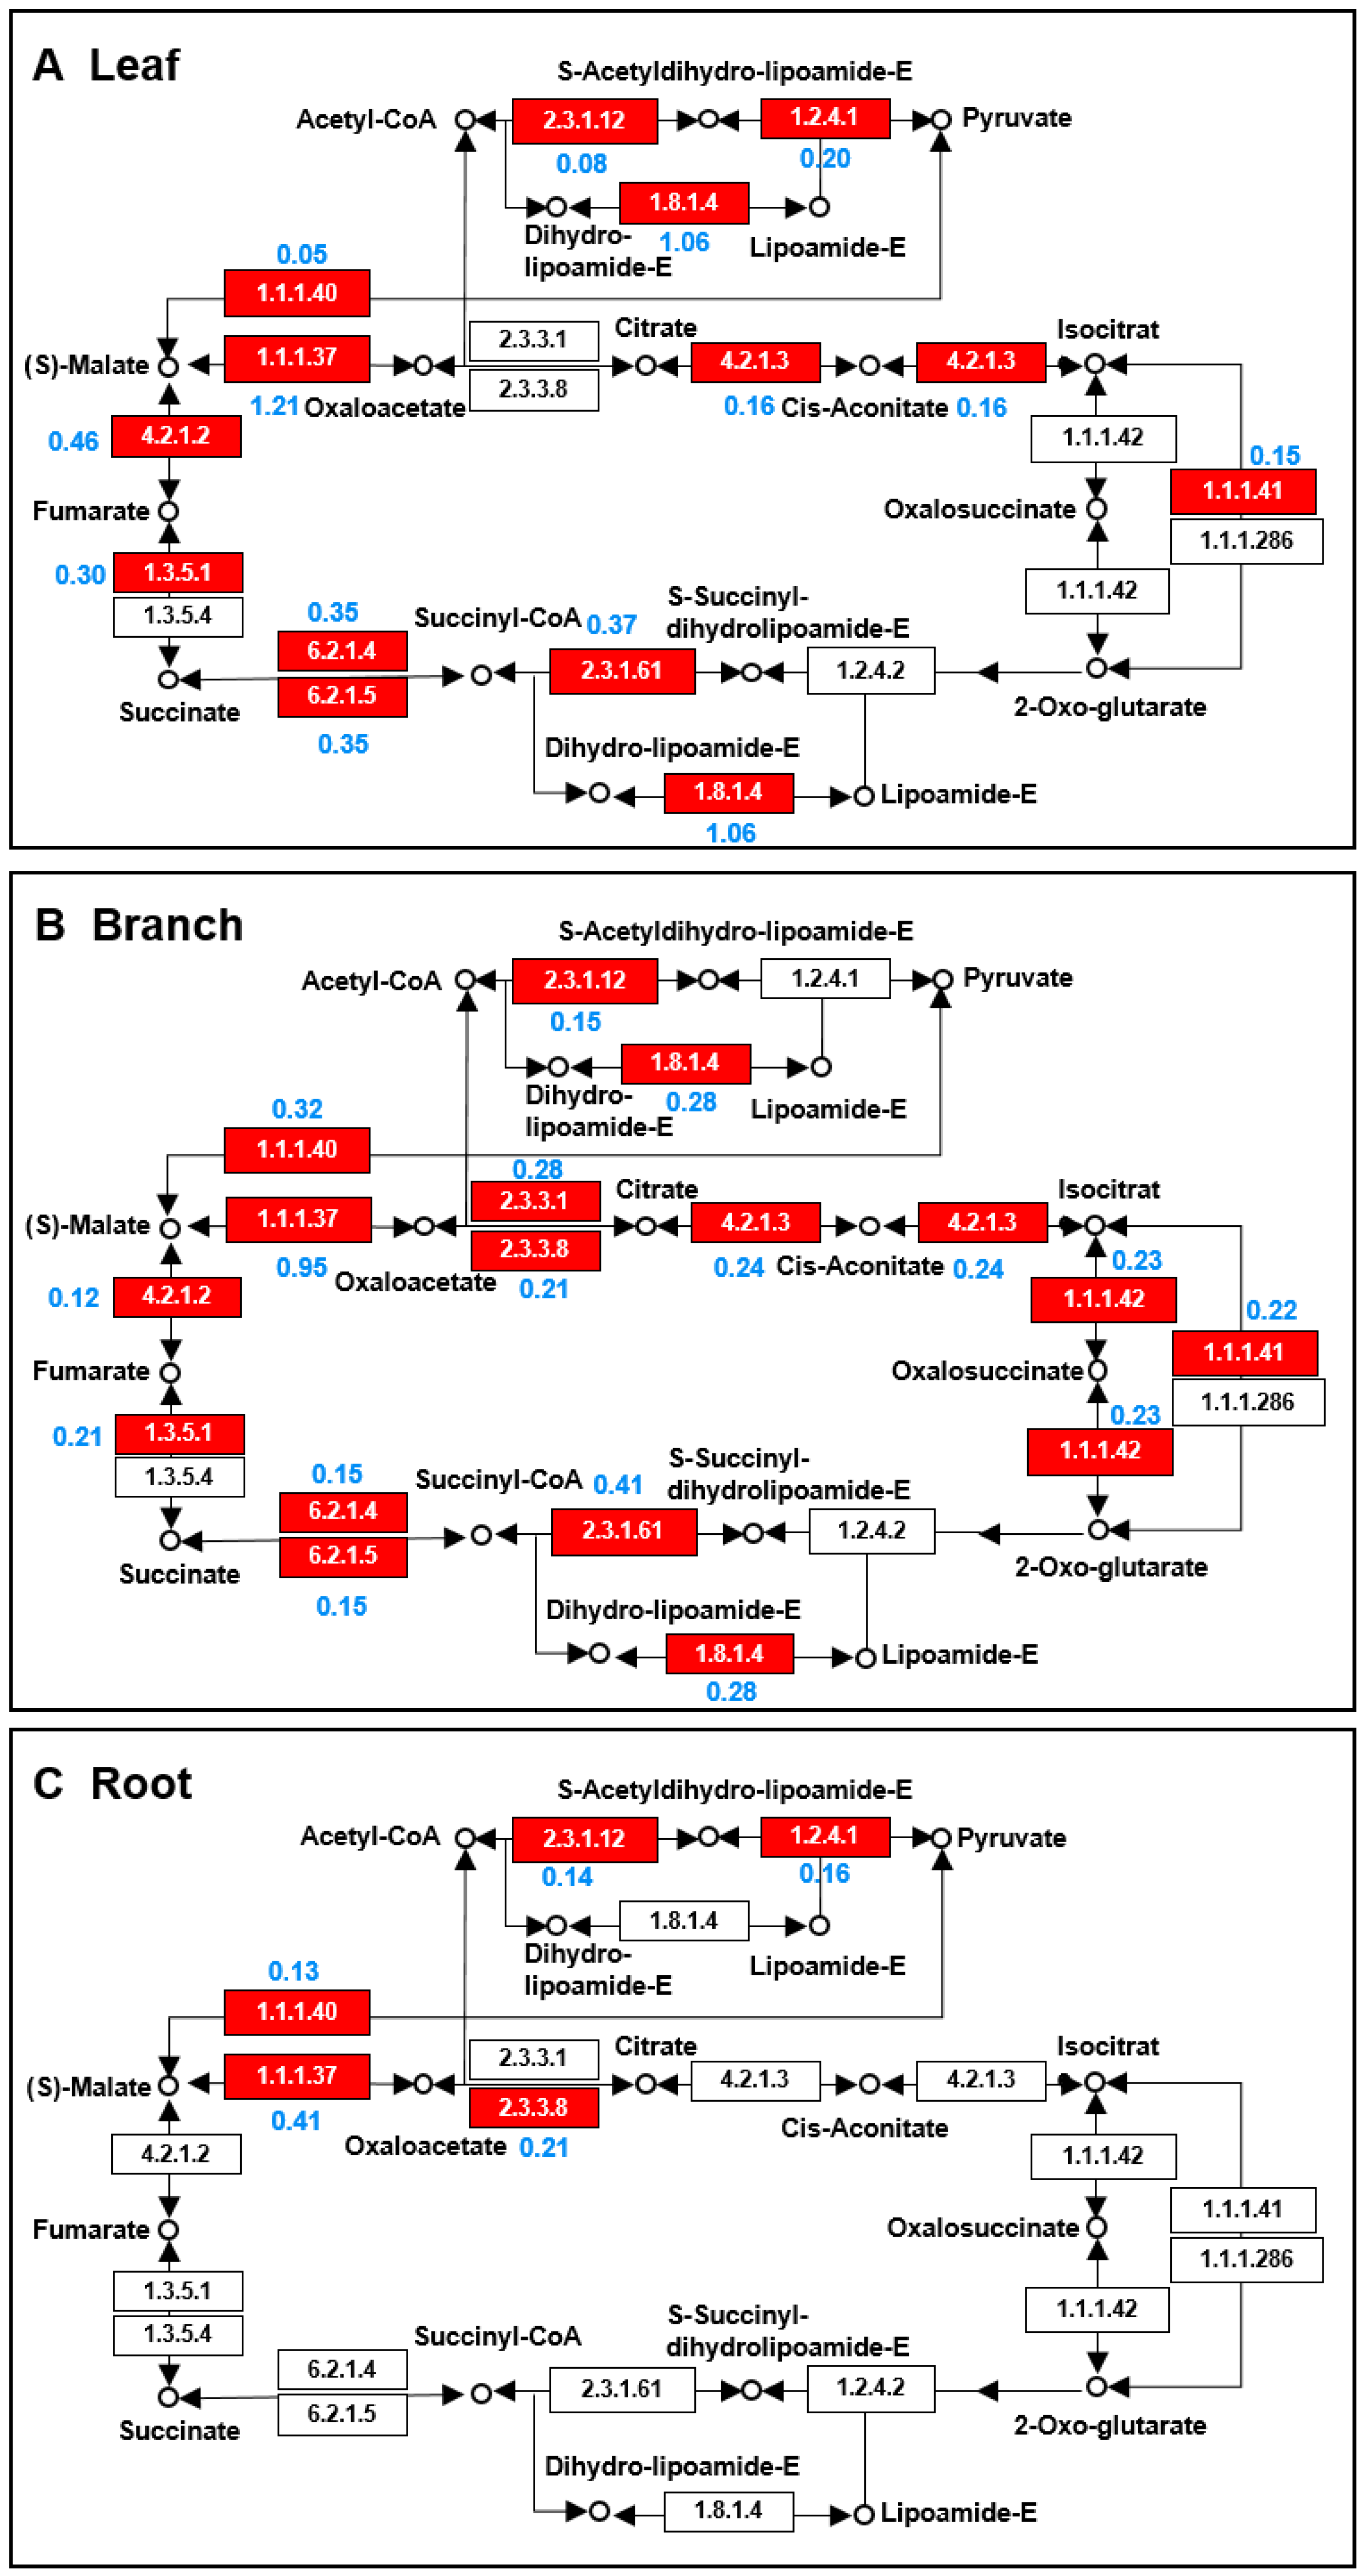
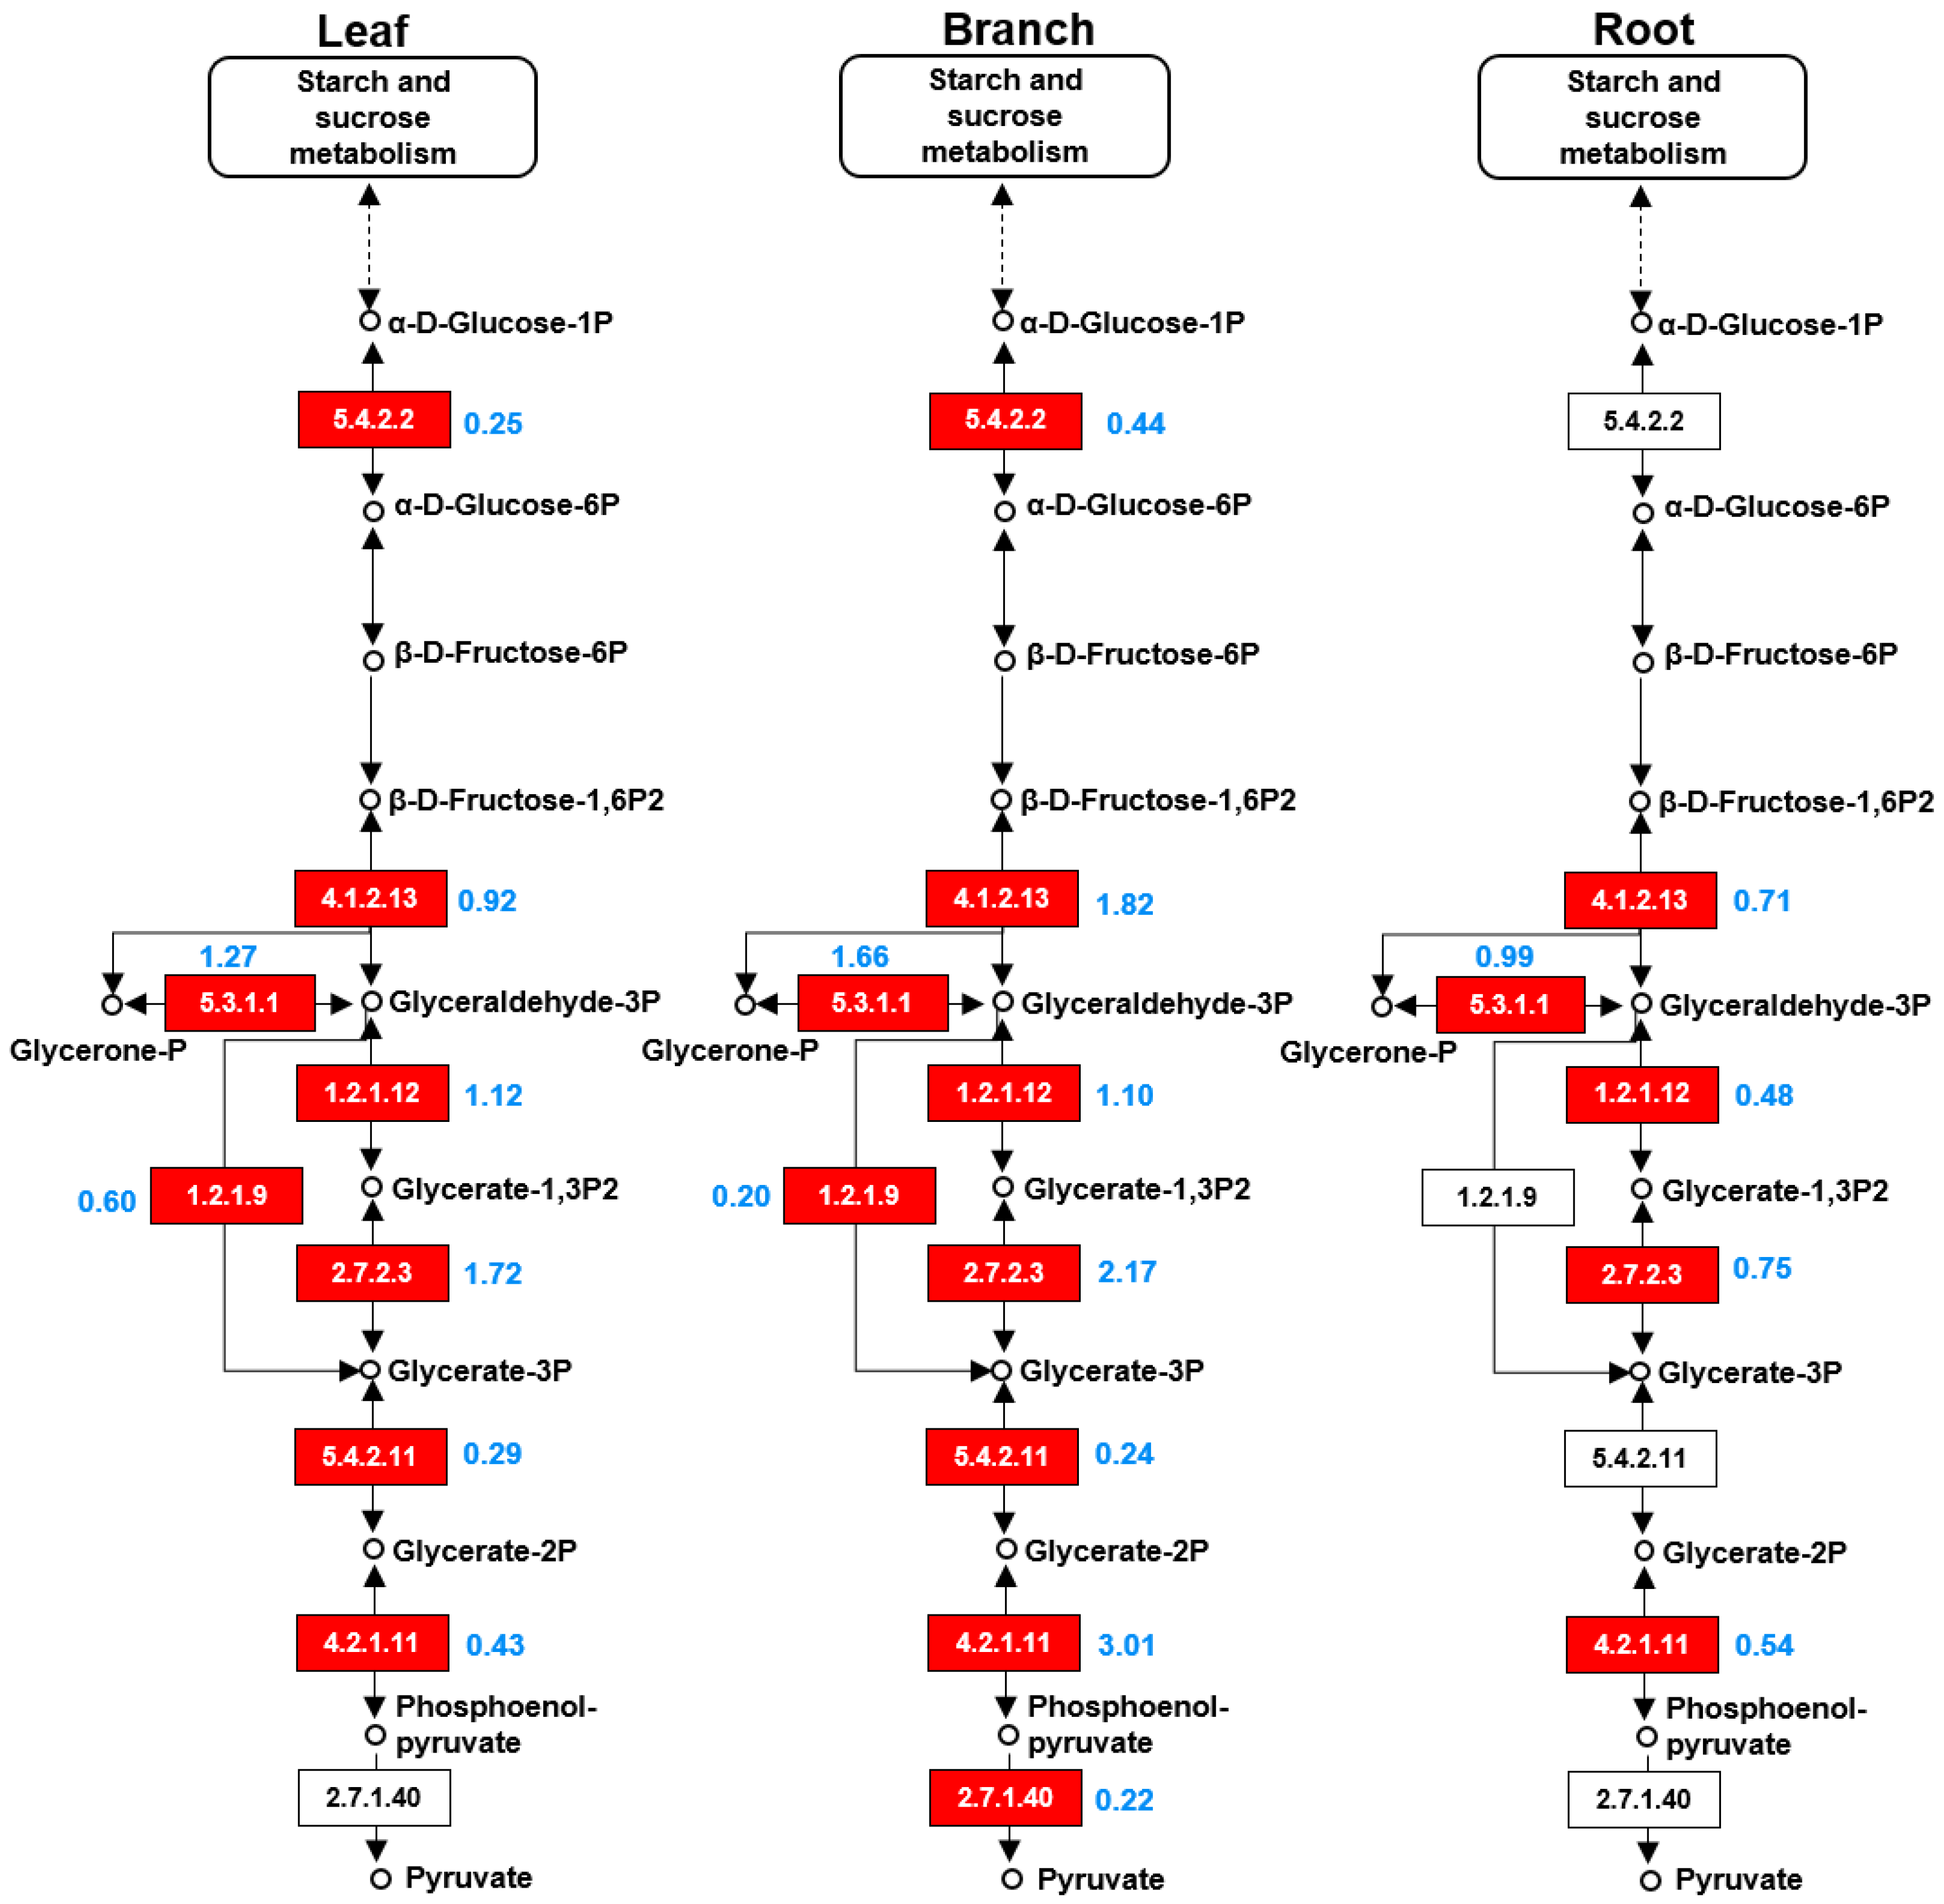
2.5. TCA Cycle and Glycolysis Pathways Largely Differed among the Three Organs

To better understand the different metabolic pathways that are active in the leaf, branch, and root of Morus, the identified proteins from each organ were mapped to the TCA cycle and glycolysis pathways using the KEGG database (Figure 5 and Figure 6). In the TCA cycle, the abundance of dihydrolipoyl dehydrogenase (EC1.8.1.4) in the leaves was higher than that in the branches, and no dihydrolipoyl dehydrogenase was detected in the roots. The abundance of NADP-dependent malic enzyme (EC1.1.1.40) in the branches was higher than in the leaves and roots. The abundance of malate dehydrogenase (EC1.1.1.37) in the leaves was nearly three times greater than that in the roots. The abundance fumarate hydratase (EC4.2.1.2) in the leaves was more than three times higher than that in the branches. Furthermore, isocitrate dehydrogenase (EC1.1.1.42) was only identified in the branches (Figure 5). In the glycolysis pathway, the abundance of fructose bisphosphate aldolase (EC4.1.2.13), phosphoglycerate kinase (EC2.7.2.3), and enolase (EC4.2.1.11) in the roots were higher than in the branches and roots. Additionally, pyruvate kinase (EC2.7.1.40) was only identified in the branches (Figure 6).

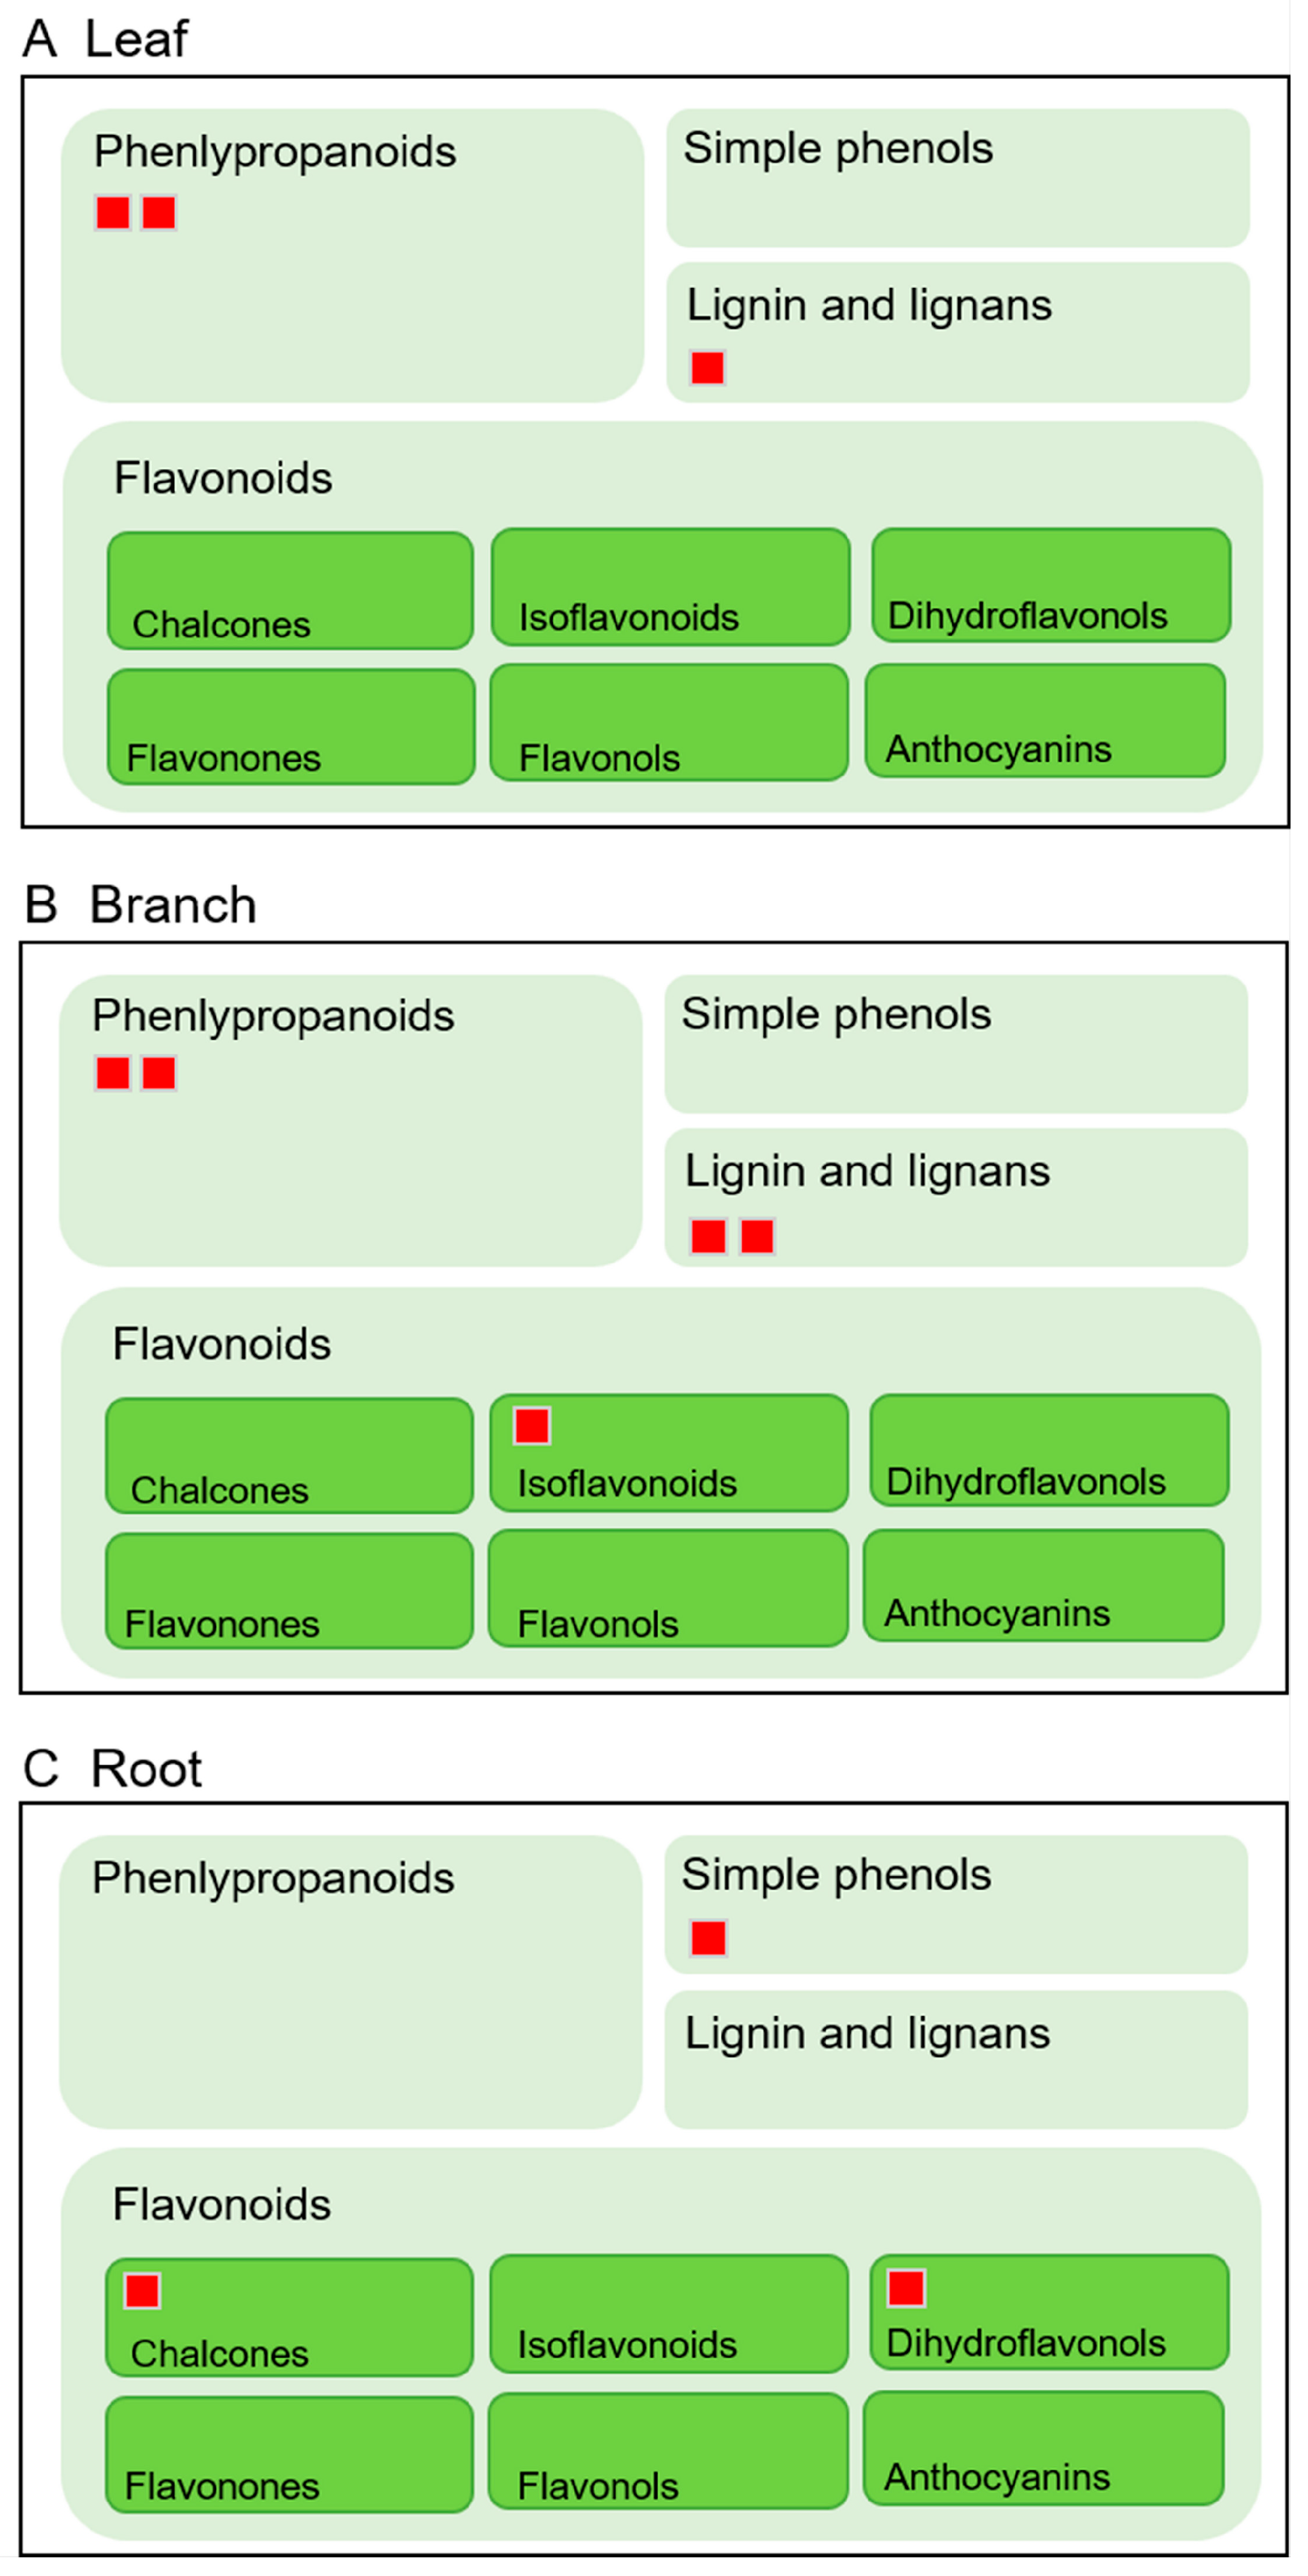
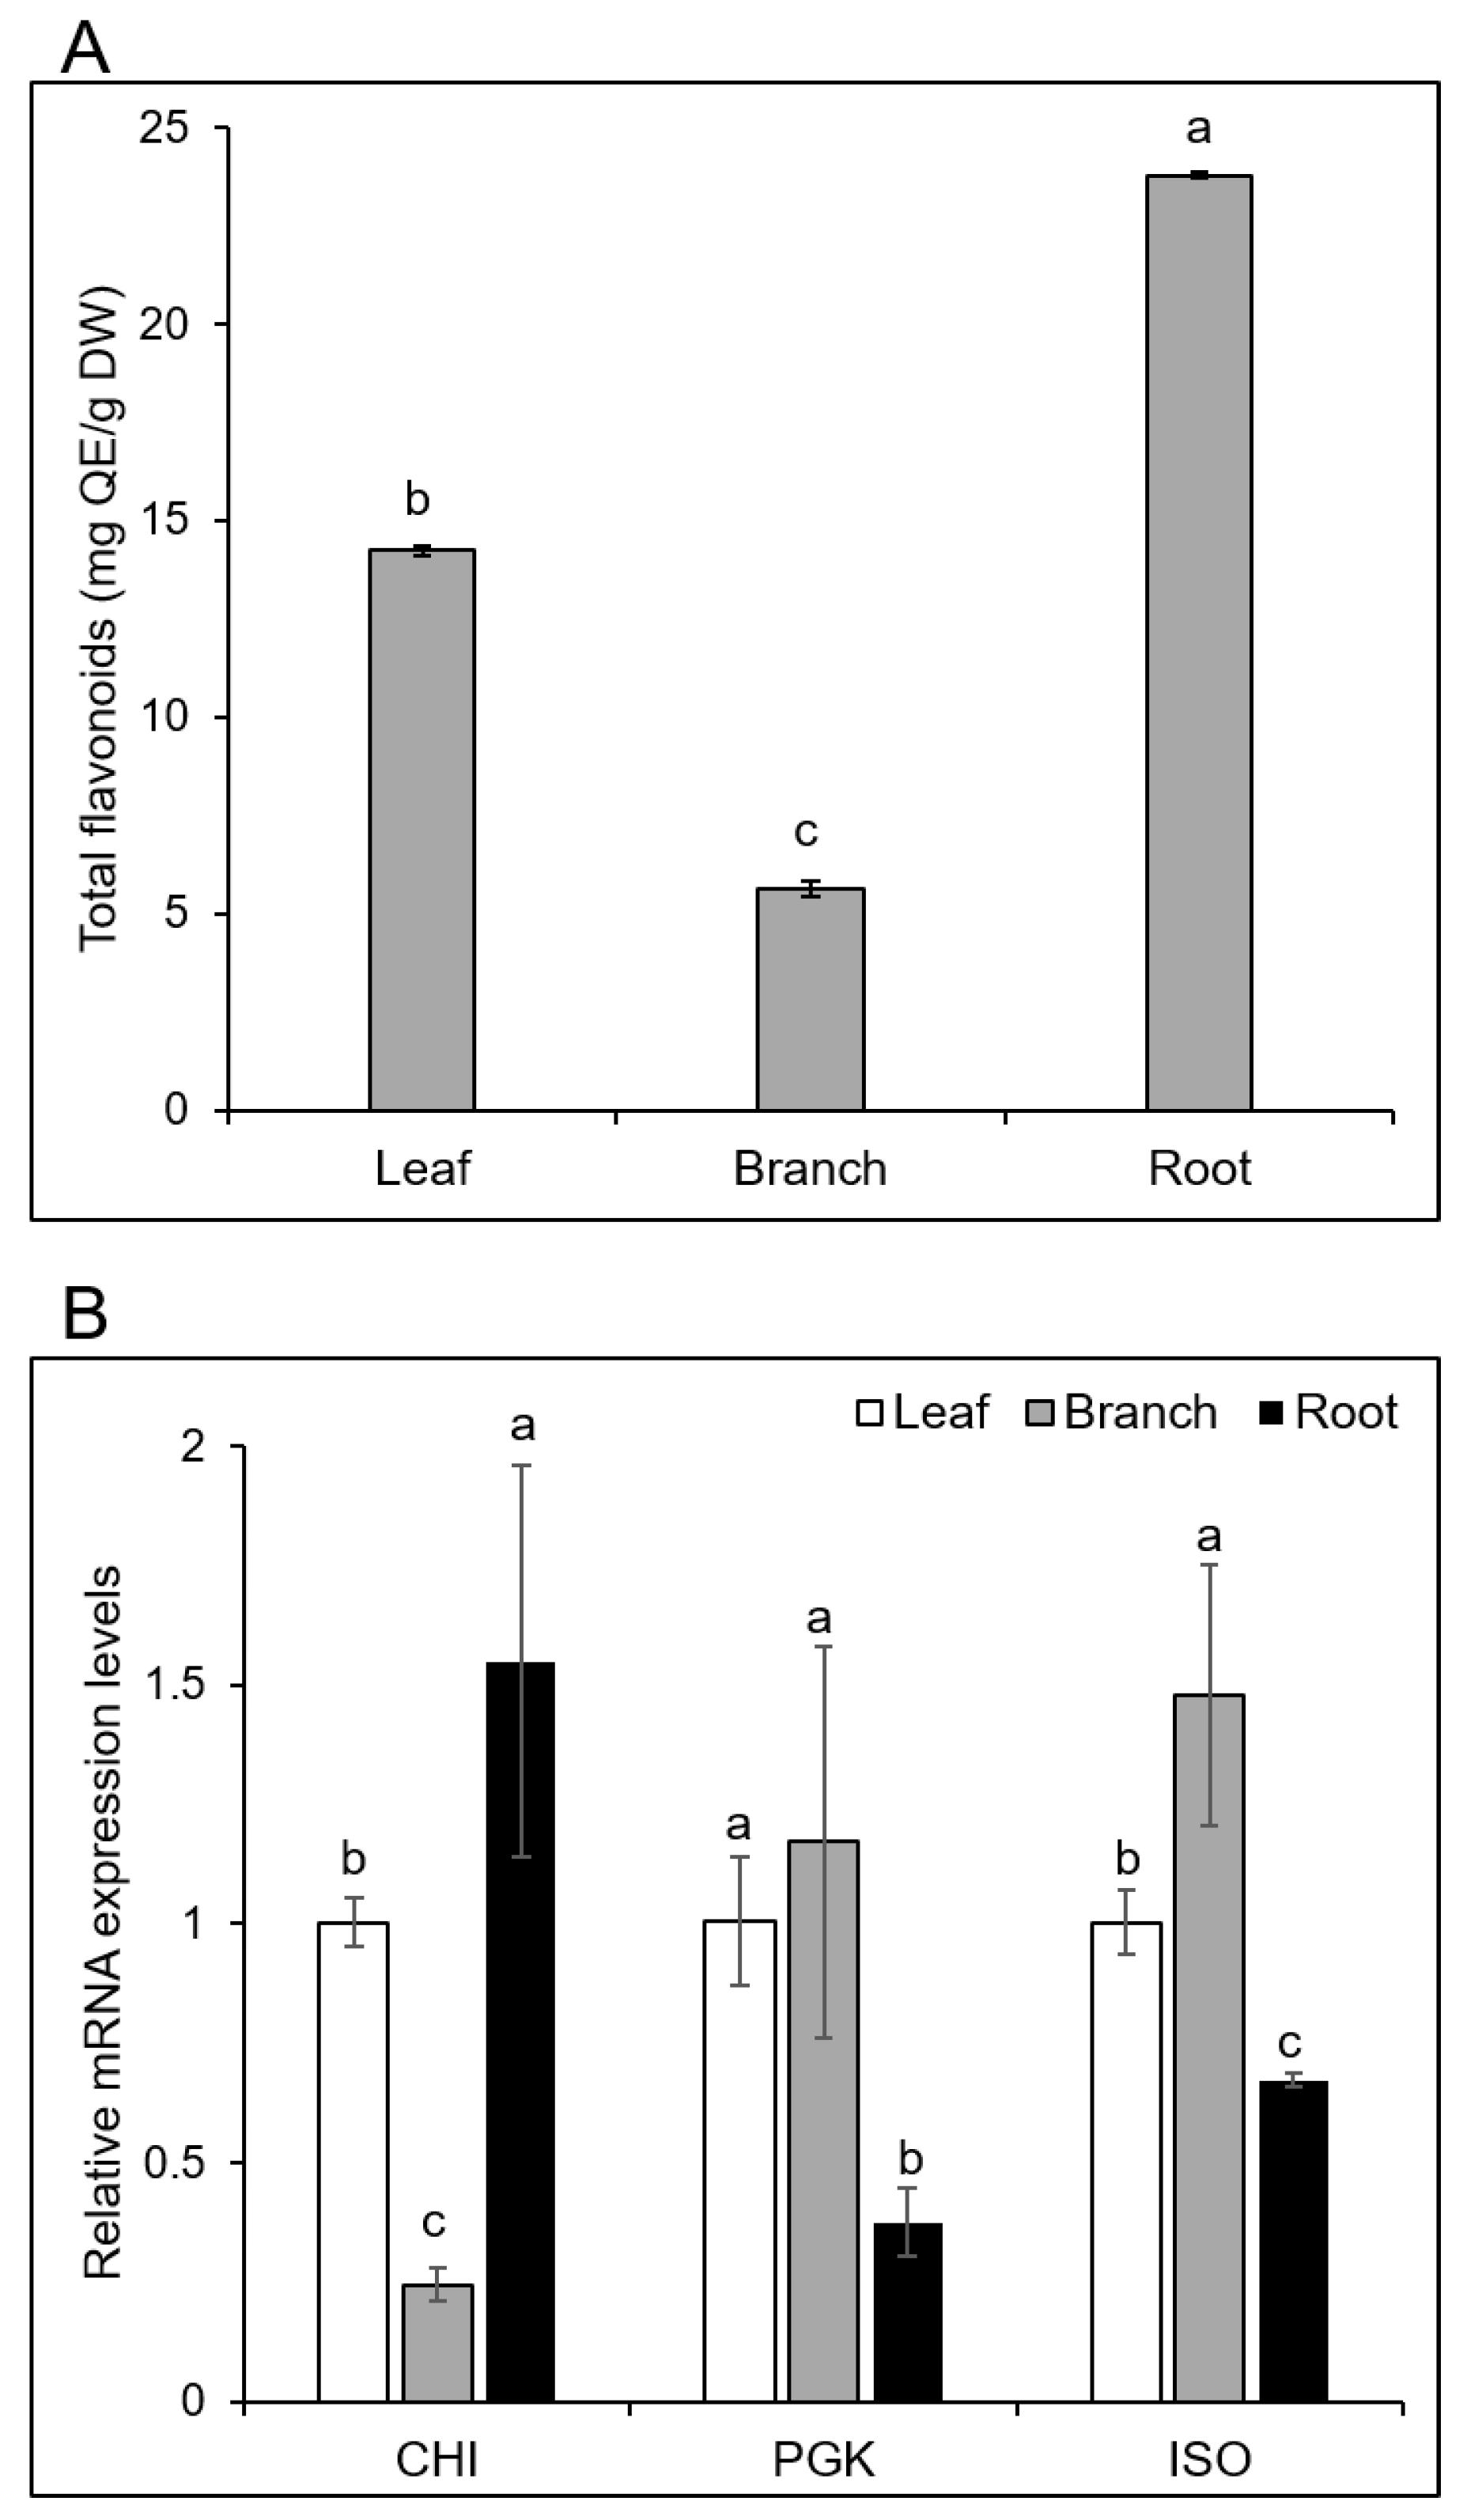
2.6. Total Flavonoid Contents were the Highest in the Roots

The proteomics analysis of Morus revealed that two proteins involved in the flavonoid biosynthetic pathway were only identified in the roots (Figure 4). Based on this finding, the total flavonoid contents of the three organs in Morus were analyzed to confirm whether the flavonoids accumulated in the roots. The total flavonoids extracted from the leaves, branches, and roots of Morus were analyzed using a colorimetric method. The results confirmed that the total flavonoid contents in the roots were significantly higher than in the leaves and branches (Figure 7A); the levels were approximately 1.5 times higher than in the leaves and four times higher than in the branches (Supplemental Table S4).

2.7. Expression of Genes Related to Root- and Branch-Specific Proteins

Functional characterization of the root-specific proteins showed that chalcone flavanone isomerase, which is involved in secondary metabolism, was accumulated through the flavonoid pathway (Figure 4). The abundance of isoflavone reductase in the branch was higher than in the leaf and root (Table 2). Moreover, the abundance of phosphoglycerate kinase in the branch, which is involved in the glycolysis pathway, was higher than in the other organs (Figure 6). Based on this finding, these three genes, chalcone flavanone isomerase (CHI), isoflavone reductase (ISO), and phosphoglycerate kinase (PGK), were selected for further analysis of their mRNA expression levels (Figure 7B). Among the examined genes, the mRNA expression of CHI in the root is significantly higher than in the leaf and branch. Additionally, the expression of PGK and ISO in the branch is significantly higher than in the root (Figure 7B).

3. Discussion

3.1. The Secondary Metabolites and Total Flavonoid Contents are Different in Morus Leaf, Branch, and Root

Morus is a widely distributed medicinal plant in China, and various parts of Morus are commonly used in traditional Chinese medicinal treatments [4]. To date, it has been reported that the leaf, branch, and root of Morus have various pharmacological activities, such as antidiabetic, anti-inflammatory, and anticancer [18,19,20]. In this study, the antioxidant activity of the root was the best among the three Morus organs examined (Figure 1B). It is known that the antioxidant-enzyme system is an important part of plant responses to oxidative stress [21]. Among the antioxidant enzymes, superoxide dismutase (SOD) and peroxidase (POD) play a key role in the antioxidant defense mechanism [22]. SOD is the first line of defense in the enzymatic pathway against free oxygen radicals [23]. POD is an enzymatic protectant that scavenges both radical and non-radical oxygen species [24]. In the present study, the abundance of peroxidase and superoxide dismutase were higher in the root than in the other organs (Table 2), which might contribute to high antioxidant activity of the Morus root.
In contrast, many secondary metabolites with various biological activities, such as alkaloids, flavonoids, polysaccharides, terpenoids, phenolic acids, stilbenoids, and coumarins, were identified in Morus [25]. Chen et al. [26] compared the chemical composition among the bark, leaf, twig, and fruit of Morus, and further analysis showed that the bark contained the highest amount of prenylated flavonoids (kuwanon G, sanggenon C, morusin, and mulberroside A) compared to the twig, leaf, and fruit. The total flavonoid contents showed a significant contribution to α-glucosidase inhibition. In the present study, the differences among the leaf, branch, and root from Morus were uncovered at the protein level using a gel-free proteomics technique. Two proteins (chalcone flavanone isomerase and flavonoid 3,5-hydroxylase) involved in the flavonoid biosynthetic pathway were only identified in the root (Figure 4), which might mean that synthesized flavonoids accumulate in the root.
Chalcone flavanone isomerase (CHI) is a key branch-point enzyme between the phenylpropanoid and flavonoid pathways that can catalyze the synthesis of flavanones and the backbone for many downstream metabolites including flavonoids and isoflavonoids [27]. Flavonoid 3,5-hydroxylase (F3’,5’Hs), which belongs to the cytochrome P450 (CYP) enzyme family [28], can catalyze the hydroxylation of the flavonoid B-ring at the 3’ and 5’ positions [29]. The results also indicated that dihydroxy B-ring-substituted flavonoids have a great potential to inhibit the generation of ROS and show antioxidant activity [30]. In the present study, the total flavonoid and five secondary metabolites contents were highly accumulated in the roots of Morus (Figure 1). This evidence strengthens the idea that both antioxidant enzymes and secondary metabolites in the root of Morus are responsible for the antioxidant activity.

3.2. Anaylses of Enzymes Involved in the Glycolysis and Isoflavonoid Biosynthetic Pathway in Morus

Glycolysis is a sequence of ten enzyme-catalyzed reactions that converts glucose into pyruvate. Proteomic analyses of leaf, branch, and root showed that proteins related to glycolysis were mostly abundant in the branch compared with the leaf and root (Figure 6). The abundance of fructose-bisphosphate aldolase (EC:4.1.2.13), phosphoglycerate kinase (EC:2.7.2.3), and enolase (EC4.2.1.11) in the branch was higher than in the leaf and root samples (Table 2). These enzymes play important roles in glycolysis. Fructose-bisphosphate aldolase catalyzes the split of fructose 1,6-bisphosphate into dihydroxyacetone phosphate and glyceraldehyde 3-phosphate [31]. Phosphoglycerate kinase catalyzes the transfer of a phosphate group from 1,3-bisphosphoglycerate to ADP via phosphoglycerate kinase, forming ATP and 3-phosphoglycerate [32]. Enolase converts 2-phosphoglycerate to phosphoenolpyruvate [33]. Cramer et al. [34] reported that the early-responding proteins to water deficit included proteins related to photosynthesis, glycolysis, translation, antioxidants, and growth, which could funnel carbon and energy into antioxidant defenses during the very early stages of plant responses to water deficit before any significant injury. The enhanced glycolysis in the mulberry branch might be engaged in a similar regulatory pathway, which enables the branch to exhibit antioxidant activity in vitro.
Furthermore, mulberry root bark is usually used in traditional Chinese medicine as a diuretic and expectorant agent, while the leaf was consumed as food by silkworms [35] and the fruit was taken as a health food [36]. However, the branch was largely neglected and ended up as fire wood material or agro-waste. Few studies have examined and confirmed the pharmacological activities of the branch bark from mulberry [37,38]. When comparing the abundance of commonly identified proteins from different parts of Morus, we discovered that isoflavone reductase homolog (IFRh) was most abundant in branches, approximately three times higher than in the leaf and root. Isoflavone reductase (IFR) is located in the cytoplasm and has been identified as one of the key enzymes involved in the synthesis of isoflavonoid phytoalexin [39,40,41]. IFR is unique to the plant kingdom and considered to have crucial roles in plant responses to various biotic and abiotic stresses. Cheng et al [42] discovered that overexpression of soybean isoflavone reductase enhanced resistance to Phytophthora sojae in soybean, though its specific biological function remains to be elucidated. The abundantly expressed isoflavone reductase homolog protein in mulberry branch inspired us to propose that intense isoflavonoid biosynthesis is present in the mulberry branch. However, the reason for this phenomenon is unknown and the function of IFRh in Morus is worth further investigation.

4. Materials and Methods

4.1. Plant Materials and Growth Conditions

Mulberry trees (Morus alba L.) were provided by the College of Agriculture and Biotechnology, Zhejiang University (Hangzhou, China). They were grown in a greenhouse under white fluorescent light (160 μmol m−2 s−1, 16 h light period/day) at 25 °C and 70% humidity. The soil conditions were controlled to ensure normal plant growth without exposure to extreme drought or plant diseases. Leaf, branch and root were then collected, frozen in liquid nitrogen and stored at −80 °C. For each organ, three independent experiments were performed as biological replicates. Each biological replicate means leaves, branches, and roots from three individuals were collected and analyzed by mass spectrometry separately. A total of nine plants were used in this study (Supplemental Figures S2 and S3).

4.2. Protein Extraction

A portion (0.5 g) of each organ sample was ground into powder in liquid nitrogen using a mortar and pestle and then transferred into a polypropylene tube containing a solution of 10% trichloroacetic acid and 0.07% 2-mercaptoethanol in acetone. The resulting mixture was vortexed and sonicated for 10 min at 4 °C. The suspension was incubated for 1 h at −20 °C with vortexing every 15 min. It was then centrifuged at 9000× g for 10 min at 4 °C. The supernatant was discarded and the pellet was washed twice with 0.07% 2-mercaptoethanol in acetone. The final pellet was dried and resuspended in lysis buffer consisting of 7 M urea, 2 M thiourea, 5% CHAPS, and 2 mM tributylphosphine by vortexing for 1 h at 25 °C. The suspension was then centrifuged at 20,000× g for 20 min at room temperature until a clean supernatant was obtained. Protein concentrations were determined using the Bradford assay [43] with bovine serum albumin as the standard.

4.3. Purification and Digestion of Proteins for Mass Spectrometry Analysis

Proteins (100 μg) were purified with methanol and chloroform to remove any detergent from the sample solutions [44]. Briefly, 400 μL of methanol was added to each sample, and the resulting solution was mixed. Subsequently, 100 μL of chloroform and 300 μL of water were added to each sample, which were mixed and centrifuged at 20,000× g for 10 min to achieve phase separation. The upper aqueous phase was discarded and the pellets were dried. The dried pellets were resuspended in 50 mM NH4HCO3. The proteins were reduced with 50 mM dithiothreitol for 30 min at 56 °C and alkylated with 50 mM iodoacetamide for 30 min at 37 °C in the dark. Alkylated proteins were digested with trypsin and lysyl endopeptidase (Wako, Osaka, Japan) at 1:100 enzyme/protein concentrations at 37 °C for 16 h. The resulting tryptic peptides were acidified by mixing with formic acid (pH < 3), and the resulting solution was centrifuged at 20,000× g for 10 min. The obtained supernatant was collected and analyzed by nanoliquid chromatography (LC)- mass spectrometry (MS).

4.4. Nanoliquid Chromatography-Tandem Mass Spectrometry Analysis

Peptides were analyzed using a nanospray LTQ Orbitrap mass spectrometer (Thermo Fisher Scientific, San Jose, CA, USA) with the Xcalibur software (version 2.1, Thermo Fisher Scientific, Bremen, Germany) in data-dependent acquisition mode. Using an Ultimate 3000 nanoLC system (Dionex, Germering, Germany), peptides in 0.1% formic acid were loaded onto a C18 PepMap trap column (300 μm ID × 5 mm, Dionex, Sunnyvale, CA, USA) and were then eluted with a linear acetonitrile gradient (8–30% over 150 min) in 0.1% formic acid at a flow rate of 200 nL/min. The eluted peptides were separated and sprayed on a C18 capillary tip column (75 μm ID × 120 mm, Nikkyo Technos, Tokyo, Japan) with a spray voltage of 1.5 kV.
Full-scan mass spectra were acquired on the LTQ Orbitrap mass spectrometer (Thermo Fisher Scientific, San Jose, CA, USA) over 400–1500 m/z with a resolution of 30,000. A lock mass function was used for high mass accuracy [45]. The ten most intense precursor ions were selected for collision-induced fragmentation in the linear ion trap at a normalized collision energy of 35%. Dynamic exclusion was employed within 90 s to prevent the repetitive selection of peptides [46].

4.5. Protein Identification from the Mass Spectrometry Data

Proteins were identified using the Mascot search engine (version 2.5.1; Matrix Science, London, UK) with the Morus Genome database (MorusDB) (version 2.0, https://morus.swu.edu.cn/morusdb/datasets). The acquired raw data files were processed using Proteome Discoverer (version 1.4.0.288, Thermo Fisher Scientific, Bremen, Germany). The parameters used in Mascot searches were as follows: carbamidomethylation of cysteine was set as a fixed modification and oxidation of methionine was set as a variable modification. Trypsin was specified as the proteolytic enzyme, and one missed cleavage was allowed. The peptide mass tolerance was set at 10 ppm, the fragment mass tolerance was set at 0.8 Da, and the peptide charge was set at +2, +3, and +4. An automatic decoy database search was performed as part of the search. Mascot results were filtered with Mascot Percolator to improve the accuracy and sensitivity of peptide identification [47]. The false discovery rates for peptide identification in all searches were less than 1.0%. Peptides with a percolator ion score of more than 13 (p < 0.05) were used for protein identification. Protein abundance was analyzed based on the exponentially modified protein abundance index (emPAI) value [48]. Mascot-derived emPAI values were converted to molar percentages by normalizing against the sum of all emPAI values for the acquisition. Briefly, the mean of three emPAI values was divided by the sum of the emPAI values for all identified proteins and multiplied by 100. The protein content was estimated by the molar fraction percentage (mol%).

4.6. Functional Analysis of Identified Proteins

Protein functions were categorized using MapMan bin codes as previously described [49]. The small-scale prediction of the identified proteins from Mahonia was performed by transferring annotations from the Arabidopsis thaliana genome and considering orthologous genes. Pathway mapping of identified proteins was performed using the Kyoto Encyclopedia of Genes and Genomes (KEGG) database (https://www.kegg.jp/) [50].

4.7. Quantitative Analysis of Metabolites from Morus

A portion (0.2 g dry weight) of collected organ sample was sonicated in 150 mL of methanol for 2 h, centrifuged at 10,000× g for 10 min, and the supernatant was collected. The methanol extracts were dried in a rotary evaporator at 50 °C. For root samples, the obtained residue was dissolved in 10 mL of methanol. For branch and leaf samples, the obtained residue was dissolved in 2 mL of methanol. The dissolved samples were then filtered through a 0.45-μm filter (Millipore, Bullerica, MA, USA) for HPLC analysis. Several standard compounds, which consisted of mulberroside A, oxyresveratrol, kuwanone H, chalcomoracin, and morusin, were provided by Zhejiang Institute for Food and Drug Control (Hangzhou, China). For quantification, a calibration curve was constructed using the standard solutions diluted in methanol at six different concentrations: mulberroside A (0.05, 0.1, 0.25, 0.375, 0.5, and 0.75 mg mL−1), oxyresveratrol (0.001, 0.005, 0.01, 0.025, 0.05, and 0.1 mg mL−1), kuwanone H (0.01, 0.05, 0.1, 0.2, 0.3, and 0.5 mg mL−1), chalcomoracin (2.36, 4.72, 9.44, 14.16, 18.88, and 23.6 mg mL−1), and morusin (0.01, 0.05, 0.1, 0.25, 0.5, and 1 mg mL−1). For HPLC analysis, 10 μL of the standard solutions and samples were used.
HPLC analysis was performed on a Waters 2695 Alliance HPLC system (Waters, Milford, MA, USA) equipped with a photodiode array detector, an online degasser and an auto-sampler for solvent delivery. Compounds in samples were separated using reverse-phase HPLC. A C18 column (4.6 mm ID × 250 mm, Agilent, Santa Clara, CA, USA) was used with a flow rate of 1 mL min−1 at 40 °C. The solvent system consisted of a linear gradient from 10% to 95% (v/v) acetonitrile in water with 0.1% phosphoric acid over a period of 70 min followed by an isocratic elution with 95% for 5 min. The spectra were measured at 320 nm and the retention time and ultraviolet spectra of the samples’ peaks were compared with that of the standards’ peaks.

4.8. In Vitro Antioxidant Activity Analysis of Mulberry Leaf, Branch, and Root

For the determination of the antioxidant activities of mulberry leaf, branch and root, ABTS+ scavenging activity, hydroxyl free radical and O2 scavenging activity were analyses. The ABTS+ scavenging activities within different organs were determined using a total antioxidant capacity assay kit (A015-2, Nanjing Jiancheng Bioengineering Institute, Nanjing, China) following the manufacturer’s protocol. Briefly, 10 μL of each sample were mixed with diluted ABTS+ solution and then shaken vigorously for 6 min at room temperature in the dark. The absorbance of the samples was measured at 405 nm immediately after incubation. A calibration curve was constructed using absorbance values measured when ABTS+ solution was mixed with a standard antioxidant—Trolox at 0.1 mM, 0.2 mM, 0.4 mM, 0.8 mM and 1.0 mM. The antioxidant activity of each group was measured as a Trolox-Equivalent Antioxidant Capacity (TEAC).
The hydroxyl free radical assay was performed using kit A018 purchased from the Nanjing Jiancheng Bioengineering Institute following the manufacturer’s protocol based on the principle of the Fenton reaction [51]. Samples were mixed with reaction buffer and reacted at 37 °C for 1 min and terminated with the addition of developer. The absorbance of the samples was measured at 550 nm after developing for 20 min; the standard sample contained 0.03% H2O2 as a control.
The O2 scavenging activities were determined using the inhibition and produce superoxide anion assay kit (A052, Nanjing Jiancheng Bioengineering Institute, Nanjing, China) according to manufacturer’s protocol. Samples were mixed with reaction buffer, incubated at 37 °C for 40 min and terminated by the addition of developer. The absorbance of the samples was measured at 550 nm after developing for 10 min developing; a vitamin C standard solution at 0.15 mg mL−1 was used as the control.

4.9. RNA Extraction and Quantitative Reverse Transcription-Polymerase Chain Reaction Analysis

Samples (0.1 g fresh weight) were ground to powder in liquid nitrogen using a sterilized mortar and pestle. Total RNA was extracted using a Quick RNA Isolation Kit (Huayueyang Biotechnology, Beijing, China) and reverse-transcribed using a 5X All-In-One RT MasterMix with AccuRT Genomic DNA Removal Kit (Applied Biological Materials Ins, CA) according to manufacturers’ protocols. The primers were designed using Primer Premier 6.0. qRT-PCR was performed in a 10 μL reaction volume using an Evagreen 2 × qPCR MasterMix (Applied Biological Materials Ins, CA) in an IQ5 multicolor real-time PCR detection System (Bio-Rad, Hercules, CA, USA). The relative quantification method (2-ΔΔCT) was used to evaluate the quantitative variation between treatments. β-actin (GeneBank ID: HQ 163776) served as an internal control to normalize target gene quantities [52]. The gene-specific primers are listed in Supplemental Table S5. The qRT-PCR results were analyzed using the Statistical Product and Service Solutions software (version 20.0, IBM, Armonk, NY, USA).

4.10. Quantitative Analysis of the Total Flavonoids in Three Morus Organs

The total flavonoid contents of the three organs in Morus was determined by a colorimetric method as described previously with minor modifications [53]. Briefly, a portion (2.0 g) of each freeze-dried organ sample was sonicated in 100 mL of methanol for 30 min, centrifuged at 8000× g for 10 min, and the supernatant was collected. The pellet was resuspended in 100 mL of methanol and the resulting suspension was sonicated for 30 min. The methanol extracts were dried in a rotary evaporator at 50 °C. The obtained residue was dissolved in methanol using 10 mL in a volumetric flask and brought to volume by methanol. One milliliter of the final extract was placed in a 10 mL volumetric flask. Then, 0.5 mL of 5% NaNO2 was added and the mixture was maintained for 5 min at room temperature. After incubation, 0.5 mL of 10% Al (NO3)3 was added to the reaction mixture and incubated for 5 min. Next, 1.5 mL of 2 M NaOH was added and methanol was added up to volume. After incubating for 15 min, the absorbance was measured at 510 nm. The data are expressed as mg quercetin-3-O-rutinoside (rutin) equivalents (QE)/g dry weight (DW), as quercetin-3-O-rutinoside was used as a reference standard for the quantification of the total flavonoids.

4.11. Statistical Analysis

The SPSS statistical software (version 22.0, IBM, Armonk, NY, USA) was used for the statistical evaluation of the results. Statistical significance was evaluated by Student’s t-test when only two groups were compared and with one-way ANOVA test when multiple groups were compared. All results are presented as the mean ± SD from three independent biological replicates. A p-value less than 0.05 was considered statistically significant.

5. Conclusions

Morus is a medicinal plant with various biological activities. In this study, it is indicated that the five secondary metabolites, including mulberroside A, oxyresveratrol, kuwanone H, chalcomoracin, and morusin, and total flavonoids contents in Morus roots are higher than in other organs, which might be responsible for its highest antioxidant activity. Proteomic analysis of the leaf, branch, and root from Morus revealed that proteins related to the flavonoid pathway such as chalcone flavanone isomerase and flavonoid 3,5-hydroxylase were accumulated in the root, resulting in the highest total flavonoid contents among the three examined organs. Additionally, the protein expression profiling of the leaf, branch, and root in Morus will enrich the proteome database of Morus. Additionally, the present findings suggest that flavonoid biosynthesis is an important function in Morus root.

Supplementary Materials

Supplementary Materials can be found at https://www.mdpi.com/1422-0067/20/2/365/s1. Supplemental Figure S1. Comparison of organ-specific proteins related to secondary metabolism. Supplemental Figure S2. Experimental design of the proteomic study. Supplemental Figure S3. Workflow of the gel-free/label-free proteomic methods in the present study. Supplemental Figure S4. Pie chart of functional categorization of leaf, branch, and root in Morus. Supplemental Table S1. Proteins Identified in the leaf of Morus by gel-free/label-free proteomic analysis. Supplemental Table S2. Proteins Identified in the branch of Morus by gel-free/label-free proteomic analysis. Supplemental Table S3. Proteins Identified in the root of Morus by gel-free/label-free proteomic analysis. Supplemental Table S4. Contents of total flavonoids in different organs of Morus. Supplemental Table S5. Primers of three genes used in this study.

Author Contributions

Conceptualization: J.T.; methodology: W.Z. and S.K.; software: S.L. and B.Y.; validation: Z.Z.; formal analysis: W.Z.; investigation: W.Z.; resources: B.Y.; data curation: Z.G.; writing—original draft preparation: W.Z. and Z.Z.; writing—review and editing: W.Z., Z.Z., J.T., and S.K.; visualization: S.L.; supervision: J.T.; project administration: W.Z.; funding acquisition: W.Z. and J.T.

Funding

This research was funded by the National Natural Science Foundation of China, grant numbers 81872973 and 81603078, and the Zhejiang Provincial Science and Technology Planning Project, grant number 2016C04005.

Acknowledgments

We thank Xiaojian Yin at the National Institute of Crop Science (Japan) for experimental support during this research.

Conflicts of Interest

The authors declare no conflict of interest.

Abbreviations

ABTS2,2’-Azino-bis (3-ethylbenzothiazoline-6-sulfonic acid)
CHAPS3-[(3-Cholamidopropyl) dimethylammonio] propanesulfonate
CHIChalcone flavanone isomerase
emPAIExponentially-modified protein abundance index
HPLCHigh-performance liquid chromatography
ISOIsoflavone reductase
IFRhIsoflavonoid reductase homolog
MSMass spectrometry
MVAMevalonate
PGKPhosphoglycerate kinase
PODPeroxidase
qRT-PCRQuantitative reverse transcription-polymerase chain reaction
SODSuperoxide dismutase
TCATricarboxylic acid
TEACTrolox-equivalent antioxidant capacity

References

  1. Umate, P. Mulberry improvements via plastid transformation and tissue culture engineering. Plant Signal. Behav. 2010, 5, 785–787. [Google Scholar] [CrossRef] [PubMed] [Green Version]
  2. Qin, J.; He, N.J.; Huang, X.Z.; Xiang, Z.H. Development of mulberry ecological industry and sericulture. Sci. Seric. 2010, 36, 984–989. (In Chinese) [Google Scholar]
  3. Liu, Y.; Willison, J.H.M. Prospects for cultivating white mulberry (Morus alba) in the drawdown zone of the Three Gorges Reservoir, China. Environ. Sci. Pollut. Res. 2013, 20, 7142–7151. [Google Scholar] [CrossRef] [PubMed]
  4. Sun, S.G.; Chen, R.Y.; Yu, D.Q. Structures of two new benzofuran derivatives from the bark of mulberry tree (Morus macroura Miq.). J. Asian Nat. Prod. Res. 2001, 3, 253–259. [Google Scholar] [CrossRef] [PubMed]
  5. Carrizzo, A.; Ambrosio, M.; Damato, A.; Madonna, M.; Storto, M.; Capocci, L.; Campiglia, P.; Sommella, E.; Trimarco, V.; Rozza, F.; et al. Morus alba extract modulates blood pressure homeostasis through eNOS signaling. Mol. Nutr. Food Res. 2016, 60, 1–8. [Google Scholar] [CrossRef] [PubMed]
  6. Yuan, Q.; Xie, Y.; Wang, W.; Yan, Y.; Ye, H.; Jabbar, S.; Zeng, X. Extraction iptimization, characterization and antioxidant activity in vitro of polysaccharides from mulberry (Morus alba L.) leaves. Carbohyd. Polym. 2015, 128, 52–62. [Google Scholar] [CrossRef] [PubMed]
  7. Liu, H.Y.; Wang, J.; Ma, J.; Zhang, Y.Q. Interference effect of oral administration of mulberry branch bark powder on the incidence of type II diabetes in mice induced by streptozotocin. Food Nutr. Res. 2016, 60, 31606. [Google Scholar] [CrossRef] [PubMed] [Green Version]
  8. Qi, S.Z.; Tuo, Z.D.; Li, J.L.; Xing, S.S.; Li, B.B.; Zhang, L.; Lee, H.S.; Chen, J.G.; Cui, L. Effects of Morus root bark extract and active constituents on blood lipids in hyperlipidemia rats. J. Ethnopharmacol. 2016, 180, 54–59. [Google Scholar] [CrossRef]
  9. Shang, X.F.; He, X.R.; He, X.Y.; Li, M.X.; Zhang, R.X.; Fan, P.C.; Zhang, Q.L.; Jia, Z.P. The genus Scutellaria an ethnopharmacological and phytochemical review. J. Ethnopharmacol. 2010, 128, 279–313. [Google Scholar] [CrossRef] [PubMed]
  10. Lam, S.C.; Liu, X.; Chen, X.Q.; Hu, D.J.; Zhao, J.; Long, Z.R.; Fan, B.; Li, S.P. Chemical characteristics of different parts of Coreopsis tinctorial in China using microwave-assisted extraction and high-performance liquid chromatography followed by chemometric analysis. J. Sep. Sci. 2016, 39, 2919–2927. [Google Scholar] [CrossRef] [PubMed]
  11. Khan, M.A.; Rahman, A.A.; Islam, S.; Khandokhar, P.; Parvin, S.; Islam, M.B.; Hossain, M.; Rashid, M.; Sadik, G.; Nasrin, S.; Mollah, M.N.H.; Alam, A.H.M.K. A comparative study on the antioxidant activity of methanolic extracts from different parts of Morus alba L. (Moraceae). BMC Research Notes 2013, 6, 24. [Google Scholar] [CrossRef] [PubMed]
  12. Wang, W.; Zu, Y.; Fu, Y.; Efferth, T. In vitro antioxidant and antimicrobial activity of extracts from Morus alba L. leaves, stems and fruits. Am. J. Chin. Med. 2012, 40, 349–356. [Google Scholar] [CrossRef]
  13. Chang, L.W.; Juang, L.J.; Wang, B.S.; Wang, M.Y.; Tai, H.M.; Hung, W.J.; Chen, Y.J.; Huang, M.H. Antioxidant and antityrosinase activity of mulberry (Morus alba L.) twigs and root bark. Food Chem. Toxicol. 2011, 49, 785–790. [Google Scholar] [CrossRef] [PubMed]
  14. Zhang, S.; Zhang, L.; Tai, Y.; Wang, X.; Ho, C.T.; Wan, X. Gene discovery of characteristic metabolic pathways in the tea plant (Camellia sinensis) using ‘Omics’-based network approaches: A future perspective. Front. Plant Sci. 2018, 9, 480. [Google Scholar] [CrossRef] [PubMed]
  15. García-Sevillano, M.A.; García-Barrera, T.; Abril, N.; Pueyo, C.; Lopez-Barea, J.; Gomez-Ariza, J.L. Omics technologies and their applications to evaluate metal toxicity in mice M. spretus as a bioindicator. J. Proteom. 2014, 104, 4–23. [Google Scholar] [CrossRef]
  16. Zhu, W.; Hu, J.; Wang, X.; Tian, J.K.; Komatsu, S. Organ-specific analysis of Mahonia using gel-free/label-free proteomic technique. J. Proteome Res. 2015, 14, 2669–2685. [Google Scholar] [CrossRef] [PubMed]
  17. Ji, X.L.; Gai, Y.P.; Zheng, C.C.; Mu, Z.M. Comparative proteomic analysis provides new insights into mulberry dwarf responses in mulberry (Morus alba L.). Proteomics 2009, 9, 5328–5339. [Google Scholar] [CrossRef]
  18. Ma, X.; Iwanaka, N.; Masuda, S.; Karaike, K.; Egawa, T.; Hamada, T.; Toyoda, T.; Myamoto, L.; Nakao, K.; Hayashi, T. Morus alba leaf extract stimulates 5’-AMP-activated protein kinase in isolated rat skeletal muscle. J. Ethnopharmacol. 2009, 122, 54–59. [Google Scholar] [CrossRef] [PubMed]
  19. Jung, J.W.; Ko, W.M.; Park, J.H.; Seo, K.H.; Oh, E.J.; Lee, D.Y.; Lee, D.S.; Kim, Y.C.; Lim, D.W.; Han, D.; Baek, N.I. Isoprenylated flavonoids from the root bark of Morus alba and their hepatoprptective and neuroprotective activities. Arch. Pharm. Res. 2015, 38, 2066–2075. [Google Scholar] [CrossRef]
  20. Eo, H.J.; Park, G.H.; Jeong, J.B. The involvement of cyclin D1 degradation through GSK3β-mediated threonine-286 phosphorylation-dependent nuclear export in anti-cancer activity of mulberry root bark extracts. Phytomedicine 2016, 23, 105–113. [Google Scholar] [CrossRef]
  21. Chahid, K.; Laglaoui, A.; Zantar, S.; Ennabili, A. Antioxidant-enzyme reaction to the oxidative stress due to alpha-cypermethrin, chlorpyriphos, and pirimicarb in tomato (Lycopersicon esculentum Mill.). Environ. Sci. Pollut. Res. Int. 2015, 22, 18115–18126. [Google Scholar] [CrossRef] [PubMed]
  22. Qin, R.; Jiao, Y.; Zhang, S.; Jiang, W.; Liu, D. Effects of aluminum on nucleoli in root tip cells and selected physiological and biochemical characters in Allium cepa var. agrogarum L. BMC Plant Biol. 2010, 10, 225. [Google Scholar]
  23. Prashanth, S.R.; Sadhasivam, V.; Parida, A. Over expression of cytosolic copper/zine superoxide dismutase from a mangrove plant Avicennia marina in indica rice var: Pusa basmati-1 confers abiotic stress tolerance. Transgenic Res. 2008, 17, 281–291. [Google Scholar] [CrossRef] [PubMed]
  24. Gill, S.S.; Tuteja, N. Reactive oxygen species and antioxidant machinery in abiotic stress tolerance in crop plants. Plant Physiol. Biochem. 2010, 48, 909–930. [Google Scholar] [CrossRef] [PubMed]
  25. Chan, E.W.C.; Lye, P.Y.; Wang, S.K. Phytochemistry, pharmacology, and clinical trials of Morus alba. Chin. J. Nat. Med. 2016, 14, 17–30. [Google Scholar] [PubMed]
  26. Chen, Z.Y.; Du, X.; Yang, Y.Y.; Cui, X.M.; Zhang, Z.J.; Li, Y. Comparative study of chemical composition and active components against α-glucosidase of various medicinal parts of Morus alba L. Biomed. Chromatogr. 2018, 32, e4328. [Google Scholar] [CrossRef] [PubMed]
  27. Dastmalchi, M.; Dhaubhadel, S. Soybean chalcone isomerase: Evolution of the fold, and the differential expression and localization of the gene family. Planta 2015, 241, 507–523. [Google Scholar] [CrossRef]
  28. Bogs, J.; Ebadi, A.; McDavid, D.; Robinson, S.P. Identification of the flavonoid hydroxylases from grapevine and their regulation during fruit development. Plant Physiol. 2006, 140, 279–291. [Google Scholar] [CrossRef]
  29. Liu, S.H.; Ju, J.F.; Xia, G.M. Identification of the flavonoid 3’-hydroxylase and flavonoid 3’,5’-hydroxylase genes from Antarctic moss and their regulation during abiotic stress. Gene 2014, 543, 145–152. [Google Scholar] [CrossRef]
  30. Fini, A.; Brunetti, C.; Ferdinando, M.D.; Ferrini, F.; Tattini, M. Stress-induced flavonoid biosynthesis and the antioxidant machinery of plants. Plant Signal. Behav. 2011, 5, 709–711. [Google Scholar] [CrossRef]
  31. Zgiby, S.M.; Thomson, G.J.; Qamar, S.; Berry, A. Exploring substrate binding and discrimination in fructose 1,6-bisphosphate and tagatose 1,6-bisphosphate aldolases. Eur. J. Biochem. 2000, 267, 1858–1868. [Google Scholar] [CrossRef] [PubMed]
  32. Watson, H.C.; Walker, N.P.; Shaw, P.J.; Bryant, T.N.; Wendell, P.L.; Fothergill, L.A.; Perkins, R.E.; Conroy, S.C.; Dobson, M.J.; Tuite, M.F. Sequence and structure of yeast phosphoglycerate kinase. EMBO J. 1982, 1, 1635–1640. [Google Scholar] [CrossRef] [PubMed]
  33. Hoom, R.K.; Flickweert, J.P.; Staal, G.E. Purification and properties of enolase of human erythroctyes. Int. J. Biochem. 1974, 5, 845–852. [Google Scholar]
  34. Cramer, G.R.; Sluyter, S.C.V.; Hopper, D.W.; Pascovici, D.; Keighley, T.; Haynes, P.A. Proteomic analysis indicates massive changes in metabolism prior to the inhibition of growth and photosynthesis of grapevine (Vitis vinifera L.) in response to water deficit. BMC Plant Biol. 2013, 13, 49. [Google Scholar] [CrossRef] [PubMed]
  35. Wang, D.; Dong, Z.; Zhang, Y.; Guo, K.; Guo, P.; Zhao, P.; Xia, Q. Proteomics provides insight into the interaction between mulberry and silkworm. J. Proteome Res. 2017, 16, 2477–2480. [Google Scholar] [CrossRef] [PubMed]
  36. Zhang, H.; Ma, Z.F.; Luo, X.; Li, X. Effects of mulberry fruit (Morus alba L.) consumption on health outcomes: A mini-review. Antioxidants 2018, 7, 69. [Google Scholar] [CrossRef]
  37. Qiu, F.; He, T.Z.; Zhang, Y.Q. The isolation and the characterization of two polysaccharides from the branch bark of mulberry (Morus alba L.). Arch. Pharm. Res. 2016, 39, 887–896. [Google Scholar] [CrossRef]
  38. Wang, S.; Fang, M.; Ma, Y.L.; Zhang, Y.Q. Preparation of the branch bark ethanol extract in mulberry Morus alba, its antioxidation, and antihyperglycemic activity in vivo. Evid-Based Complement. Altern. 2014, 2014, 569652. [Google Scholar]
  39. Graham, T.L.; Kim, J.E.; Graham, M.Y. Role of constitutive isoflavone conjugates in the accumulation of glyceollin in soybean infected with Phytophthora megasperma. Mol. Plant Microbe Interact. 1990, 3, 157–166. [Google Scholar] [CrossRef]
  40. Guo, L.; Dixon, R.A.; Paiva, N.L. Conversion of vestitone to medicarpin in Alfalfa (Medicago sativa L.) is catalyzed by two independent enzymes. J. Biol. Chem. 1994, 269, 22372–22378. [Google Scholar]
  41. Cooper, J.D.; Qiu, F.; Paiva, N.L. Biotransformation of an exogenously supplied isoflavonoid by transgenic tobacco cells expressing alfalfa isoflavone reductase. Plant Cell Rep. 2002, 20, 876–884. [Google Scholar]
  42. Cheng, Q.; Li, N.; Dong, L.; Zhang, D.; Fang, S.; Jiang, L.; Wang, X.; Xu, P.; Zhang, S. Overexpression of soybean isoflavone reductase (GmIFR) enhances resistance to Phytophthora sojae in soybean. Front. Plant. Sci. 2015, 6, 1024. [Google Scholar] [CrossRef] [PubMed]
  43. Bradford, M.M. A rapid and sensitive method for the quantitation of microgram quantities of protein utilizing the principle of proteindye binding. Anal. Biochem. 1976, 72, 248–254. [Google Scholar] [CrossRef]
  44. Nanjo, Y.; Skultety, L.; Uvackova, L.; Klubicova, K.; Hajduch, M.; Komatsu, S. Mass spectrometry-based analysis of proteomic changes in the root tips of flooded soybean seedlings. J. Proteome Res. 2012, 11, 372–385. [Google Scholar] [CrossRef] [PubMed]
  45. Olsen, J.V.; de Godoy, L.M.F.; Li, G.Q.; Macek, B.; Mortensen, P.; Pesch, R.; Makarov, A.; Lange, O.; Horning, S.; Mann, M. Parts per million mass accuracy on an Orbitrap mass spectrometer via lock mass injection into a C-trap. Mol. Cell. Proteom. 2005, 4, 2010–2021. [Google Scholar] [CrossRef] [PubMed]
  46. Zhang, Y.; Wen, Z.H.; Washburn, M.P.; Florens, L. Effect of dynamic exclusion duration on spectral count based quantitative proteomics. Anal. Chem. 2009, 81, 6317–6326. [Google Scholar] [CrossRef] [PubMed]
  47. Brosch, M.; Yu, L.; Hubbard, T.; Choudhary, J. Accurate and sensitive peptide identification with MASCOT percolator. J. Proteome Res. 2009, 8, 3176–3181. [Google Scholar] [CrossRef] [PubMed]
  48. Shinoda, K.; Tomita, M.; Ishihama, Y. emPAI Calc-for the estimation of protein abundance from large-scale identification data by liquid chromatography-tandem mass spectrometry. Bioinfomatics 2010, 26, 576–577. [Google Scholar] [CrossRef] [PubMed]
  49. Usadel, B.; Nagel, A.; Thimm, O.; Redestig, H.; Blaesing, O.E.; Natalia, P.R.; Selbig, J.; Hannemann, J.; Piques, M.C.; Steinhauser, D.; et al. Extension of the visualization tool MapMan to allow statistical analysis of arrays, display of corresponding genes, and comparison with known responses. Plant Physiol. 2005, 138, 1195–1204. [Google Scholar] [CrossRef]
  50. Kanehisa, M.; Goto, S. KEGG: Kyoto encyclopedia of genes and genomes. Nucleic Acids Res. 2000, 28, 27–30. [Google Scholar] [CrossRef]
  51. Fenton, H.J.H. Oxidation of tartaric acid in presence of iron. J. Chem. Soc. Trans. 1894, 65, 899–910. [Google Scholar] [CrossRef]
  52. Guan, Q.J.; Yu, J.J.; Zhu, W.; Yang, B.X.; Li, Y.H.; Zhang, L.; Tian, J.K. RNA-Seq transcriptome analysis of the Morus alba L. leaves exposed to high-level UV-B with and without dark treatment. Gene 2018, 645, 60–68. [Google Scholar] [CrossRef] [PubMed]
  53. Chen, W.; Li, Y.; Bao, T.; Gowd, V. Mulberry fruit extract affords protection against ethyl carbamate-induced cytotoxicity and oxidative stress. Oxid. Med. Cell. Longev. 2017, 2017, 1594963. [Google Scholar] [CrossRef] [PubMed]
Figure 1. Analysis of the metabolites in Morus leaf, branch, and root and their antioxidant activities. The methanol extracts from Morus leaf, branch, and root were analyzed by HPLC (A). A C18 column was used with a flow rate of 1 mL min−1. The peaks were determined at a wavelength of 320 nm. For the determination of the antioxidant activities of Morus leaf, branch, and root, ABTS+ scavenging, hydroxyl free radical, and O2 scavenging activities were analyzed (B). The data are shown as the mean ± SD from three independent biological replicates. Means with the same letter are not significantly different according to the one-way ANOVA test (p < 0.05).
Ijms 20 00365 g001
Figure 2. Functional categorization of proteins in leaf, branch, and root from Morus. Leaf (white), branch (gray), and root (black) samples were collected and proteins were extracted, digested, and analyzed by nanoLC-MS/MS. Protein functions were predicted and categorized using MapMan bin codes. Abbreviations: redox, redox ascorbate/glutathione metabolism; TCA, tricarboxylic acid; RNA, RNA processing and regulation of transcription; cell, cell organization, and vesicle transport; CHO, carbohydrates; OPP, oxidative pentose phosphate; ETC, electron transport chains; and DNA, DNA synthesis, and repair. a Others, containing biodegradation of xenobiotics, co-factor and vitamin metabolism, S-assimilation, gluconeogenesis, fermentation, and metal handling. b Others, containing amino acid activation, posttranslational modification, and assembly/cofactor ligation.
Ijms 20 00365 g002
Figure 3. Organ-specific proteins were functionally categorized and visualized using the MapMan software. Leaf- (red), branch- (green), and root-(blue) specific proteins were submitted to the MapMan software (version 3.6.0RC1) using the metabolism overview pathway map. Each square indicates one mapped protein.
Ijms 20 00365 g003
Figure 4. Comparison of the organ-specific proteins related to the flavonoid, phenlypropanoid, simple phenol, and lignin. Leaf- (A), branch- (B), and root- (C) specific proteins related to secondary metabolism were submitted to the MapMan software (version 3.6.0RC1). Each red square indicates one mapped protein.
Ijms 20 00365 g004
Figure 5. Mapping of proteins related to the TCA cycle in three organs from Morus. The TCA cycle pathways were identified by the mapping of the identified proteins from the leaf (A), branch (B), and root (C) using the KEGG database. Enzymes in red represent identified proteins, and the blue number represents the protein abundance. The EC number for the following proteins are 1.1.1.37, malate dehydrogenase; 1.1.1.40, malate dehydrogenase (oxaloacetate-decarboxylating)(NADP+); 1.1.1.41, isocitrate dehydrogenase (NAD+); 1.1.1.42, isocitrate dehydrogenase; 1.1.1.286, homoisocitrate dehydrogenase; 1.2.4.1, pyruvate dehydrogenase E1; 1.2.4.2, 2-oxoglutarate dehydrogenase; 1.3.5.1, succinate dehydrogenase; 1.3.5.4, fumarate reductase; 1.8.1.4, dihydrolipoamide dehydrogenase; 2.3.3.1, citrate synthase; 2.3.3.8, ATP-citrate synthase; 2.3.1.12, pyruvate dehydrogenase; 2.3.1.61, dihydrolipoamide succinyltransferase; 4.2.1.2, fumarate hydratase; 4.2.1.3, aconitate hydratase; 6.2.1.4, succinyl-CoA synthetase; and 6.2.1.5, ATP-citrate synthase.
Ijms 20 00365 g005
Figure 6. Mapping of proteins related to glycolysis in the three organs from Morus. The glycolysis pathways were identified by the mapping of the identified proteins from the leaf (A), branch (B), and root (C) using the KEGG database. Enzymes in red represent identified proteins, and the blue number represents the protein abundance. The EC number for the following proteins are 5.4.2.2, phosphoglucomutase; 4.1.2.13, fructose-bisphosphate aldolase; 5.3.1.1, triosephosphate isomerase; 1.2.1.12, glyceraldehyde 3-phosphate dehydrogenase; 1.2.1.9, glyceraldehyde-3-phosphate dehydrogenase (NADP); 2.7.2.3, phosphoglycerate kinase; 5.4.2.11, phosphoglycerate mutase; 4.2.1.11, enolase; and 2.7.1.40, pyruvate kinase.
Ijms 20 00365 g006
Figure 7. Total flavonoid contents and the expression of three genes in the three organs from Morus. The total flavonoids extracted from Morus leaf, branch, and root were analyzed using a colorimetric method (A). The transcript abundance of the selected genes was analyzed by qRT-PCR. Total RNA was extracted from the collected leaf, branch, and root (B). Data are shown as the means ± SD from three independent biological replicates. Means with the same letter are not significantly different according to one-way ANOVA test (p < 0.05). The abbreviations are follows: QE, quercetin-3-O-rutinoside. The genes CHI, PGK, and ISO represent chalcone flavanone isomerase, phosphoglycerate kinase, and isoflavone reductase, respectively. The β-actin gene was used as a reference control gene.
Ijms 20 00365 g007
Table 1. Contents of five secondary metabolites in different organs of Morus.
Mulberroside A
(mg/g DW)
Oxyresveratrol
(mg/g DW)
Kuwanone H
(mg/g DW)
Chalcomoracin
(mg/g DW)
Morusin
(mg/g DW)
Leaf0.917 ± 0.015n.d. *n.d.0.045 ± 0.005n.d.
Branch0.451 ± 0.0120.453 ± 0.008n.d.n.d.0.043 ± 0.008
Root24.206 ± 0.6880.345 ± 0.0225.551 ± 0.2260.610 ± 0.0512.874 ± 0.158
* n.d. means the metabolites is not determined in this organ; DW, means dry weight.
Table 2. Common proteins identified in the leaf, branch, and root of Morus by gel-free/label-free proteomic analysis.
No.Protein ID aDescriptionM.P. bScoreMass (Da)Function cMol (%) d
leafstemroot
1Morus009492.p1Macrophage migration inhibitory factor homolog82038961not assigned3.102.433.69
2Morus001961.p1Peroxidase 121624438,426misc0.571.293.62
3Morus018316.p1Superoxide dismutase 1 copper chaperone933911,171metal handling2.111.692.48
4Morus009000.p160S acidic ribosomal protein P2B1211011,673protein1.622.322.32
5Morus023628.p1Tubulin beta-1 chain2257851,015cell1.111.831.99
6Morus017847.p1Ribonuclease UK1141626619,960RNA1.080.271.80
7Morus017207.p1Proteasome subunit alpha type-4617327,440protein0.240.341.58
8Morus003952.p1Lipoxygenase homology domain-containing protein 1615421,171not assigned0.500.951.44
9Morus022430.p1Proteasome subunit beta type-11131324,861protein0.680.561.44
10Morus022592.p1Thaumatin-like protein 1a1836226,984stress1.020.441.41
11Morus022525.p1Calmodulin925016,894signaling1.031.121.31
12Morus015082.p1Auxin-repressed 12.5 kDa protein38913,355development0.491.991.30
13Morus003616.p1Fructokinase-21013735,370major CHO metabolism0.420.791.25
14Morus017382.p1Calcium-binding protein CML27411618,705signaling0.260.291.05
15Morus008669.p1Allene oxide cyclase 2, chloroplastic616827,569hormone metabolism0.601.240.99
16Morus010743.p1Triosephosphate isomerase, cytosolic1926327,548glycolysis1.271.660.99
17Morus004210.p1Glucan endo-1,3-beta-glucosidase, basic vacuolar isoform2017839,002misc0.630.340.94
18Morus011779.p1Superoxide dismutase [Cu-Zn], chloroplastic2257929,603redox0.740.310.90
19Morus001936.p1Peroxiredoxin-2B1735017,391redox1.221.480.90
20Morus004201.p1Universal stress protein A-like protein922318,591stress0.580.580.82
21Morus001634.p1Nucleoside diphosphate kinase 11121516,322nucleotide metabolism1.350.780.78
22Morus003013.p1Phosphoglycerate kinase, cytosolic59114342,729glycolysis1.722.170.75
23Morus028068.p1Polygalacturonase inhibitor 11030637,677cell wall0.860.730.73
24Morus013807.p1Fructose-bisphosphate aldolase, cytoplasmic isozyme2358438,459glycolysis0.921.820.71
25Morus020532.p1Glutaredoxin524415,307redox0.750.690.69
26Morus023908.p1Uncharacterized protein1527157,888protein0.501.550.69
27Morus018475.p1Peroxidase 54512836,921misc0.130.470.67
28Morus025517.p1Tubulin alpha chain1842649,920cell0.680.720.66
29Morus002489.p1Nascent polypeptide-associated complex subunit alpha-like protein 11128522,279protein1.010.340.65
30Morus014304.p1Plastocyanin, chloroplastic2366116,620photosynthesis1.160.620.62
31Morus024265.p1Aquaporin PIP1-356730,856transport0.220.370.59
32Morus008884.p1Cysteine proteinase RD21a1035052,217protein0.350.320.58
33Morus025862.p1ATP synthase subunit beta, mitochondrial33101759,400mitochondrial electron transport1.061.430.54
34Morus026982.p1Allene oxide synthase, chloroplastic1116456,861hormone metabolism0.300.910.54
35Morus007342.p1Peroxiredoxin-2F, mitochondrial1217822,580redox0.771.030.52
36Morus009738.p1ATP-dependent Clp protease proteolytic subunit 5, chloroplastic414634,203protein0.130.210.52
37Morus009210.p160S acidic ribosomal protein P3-227112,022protein0.420.480.48
38Morus007901.p1Actin-73071741,897cell1.021.200.47
39Morus007352.p1Stem-specific protein TSJT179625,521metal handling0.180.450.45
40Morus026327.p1Heat shock cognate 70 kDa protein 14179171,553stress0.910.670.44
41Morus021433.p1Malate dehydrogenase, cytoplasmic2046335,912TCA0.570.950.43
42Morus006184.p1Cysteine synthase3357234,400amino acid metabolism1.770.590.39
43Morus018842.p12-Cys peroxiredoxin BAS1-like, chloroplastic2332129,121redox0.810.650.39
44Morus022454.p1Fasciclin-like arabinogalactan protein 8612043,455cell wall0.220.160.39
45Morus008883.p1Uncharacterized protein610449,487signaling0.170.340.38
46Morus000210.p1Calvin cycle protein CP12828814,542photosynthesis0.340.380.38
47Morus002920.p1Thioredoxin M-type 4, chloroplastic616420,233redox0.420.260.37
48Morus018564.p1Isoflavone reductase homolog P31210245,171secondary metabolism0.331.170.37
49Morus013051.p1Adenosine kinase 2721637,797nucleotide metabolism0.650.410.35
50Morus000836.p1Ribulose bisphosphate carboxylase large chain (Fragment)290480561,599photosynthesis1.180.630.33
51Morus015202.p1Uncharacterized protein1123433,994not assigned0.460.390.32
52Morus014140.p1Plastid-lipid-associated protein, chloroplastic1028135,137cell0.520.310.31
53Morus025784.p1Phospholipase D alpha 144792,059lipid metabolism0.050.370.30
54Morus018550.p1Glycine-rich RNA-binding protein GRP1A516518,416RNA0.390.290.29
55Morus014011.p1Glycerophosphoryl diester phosphodiesterase 2629581,816lipid metabolism0.160.120.29
56Morus019087.p1Putative mitochondrial 2-oxoglutarate/malate carrier protein1219432,224transport0.980.290.28
57Morus002874.p1Leucine aminopeptidase 3, chloroplastic3998160,563protein0.961.090.27
58Morus010230.p1Superoxide dismutase [Cu-Zn]26320,420redox0.340.370.26
59Morus019413.p1Cysteine proteinase 15A925941,574protein0.230.120.26
60Morus015818.p1Probable glucan endo-1,3-beta-glucosidase A6311152,145misc0.150.170.24
61Morus020384.p1Cysteine synthase, chloroplastic/chromoplastic2125843,997amino acid metabolism0.520.110.24
62Morus013361.p1Protein disulfide-isomerase1543256,492redox0.660.920.22
63Morus007114.p1Glycine-rich RNA-binding protein 2317027,802RNA0.170.190.19
64Morus011198.p1L-ascorbate peroxidase, cytosolic2639227,414redox1.051.130.19
65Morus008123.p1IAA-amino acid hydrolase ILR1-like 558947,707hormone metabolism0.150.500.18
66Morus024851.p1Catalase isozyme 11913757,208redox0.620.320.18
67Morus017351.p1Serine carboxypeptidase-like 5055549,604protein0.150.140.17
68Morus014667.p1Alpha-xylosidase15257103,539misc0.170.450.15
69Morus017174.p1Predicted protein819333,060signaling0.200.270.15
70Morus024951.p1Triosephosphate isomerase, chloroplastic4265534,813photosynthesis1.660.990.15
71Morus008661.p114-3-3-like protein A1528381,889cell0.260.370.14
72Morus016271.p1Elongation factor 21410699,403protein0.110.440.14
73Morus001657.p16-phosphogluconolactonase 4, chloroplastic610835,151OPP0.180.970.14
74Morus009365.p15-methyltetrahydropteroyltriglutamate--homocysteine methyltransferase1318884,904amino acid metabolism0.170.460.14
75Morus007784.p1UTP--glucose-1-phosphate uridylyltransferase2637276,133glycolysis0.480.800.13
76Morus017695.p131 kDa ribonucleoprotein, chloroplastic1023038,128RNA0.170.130.13
77Morus007494.p1RuBisCO large subunit-binding protein subunit alpha, chloroplastic3096462,000photosynthesis1.290.330.11
78Morus011664.p1L-ascorbate oxidase homolog45360,522not assigned0.130.370.11
79Morus006060.p1V-type proton ATPase subunit B21040063,333transport0.410.160.11
80Morus004111.p1Calreticulin726650,196signaling0.320.560.10
81Morus013778.p1Monodehydroascorbate reductase1314249,982redox0.300.330.10
82Morus024141.p1Beta-D-xylosidase 4618784,604cell wall0.140.100.10
83Morus007961.p1Hypothetical protein76295,561not assigned0.050.070.09
84Morus025925.p1Alpha-glucosidase620793,365misc0.120.250.07
a Protein ID, according to the Morus database; b M.P., number of matched peptides; c Function, function categorized using MapMan bin codes; d Mol (%), protein abundance; misc, miscellaneous; protein, protein synthesis/degradation/folding/targeting; cell, cell organization/vesicle transport; RNA, RNA processing/regulation of transcription; redox, redox ascorbate/glutathione metabolism; TCA, tricarboxylic acid cycle; and OPP, oxidative pentose phosphate.

