Assessment of Mitochondrial Dysfunction in Experimental Autoimmune Encephalomyelitis (EAE) Models of Multiple Sclerosis


Abstract
:1. Introduction
2. Results
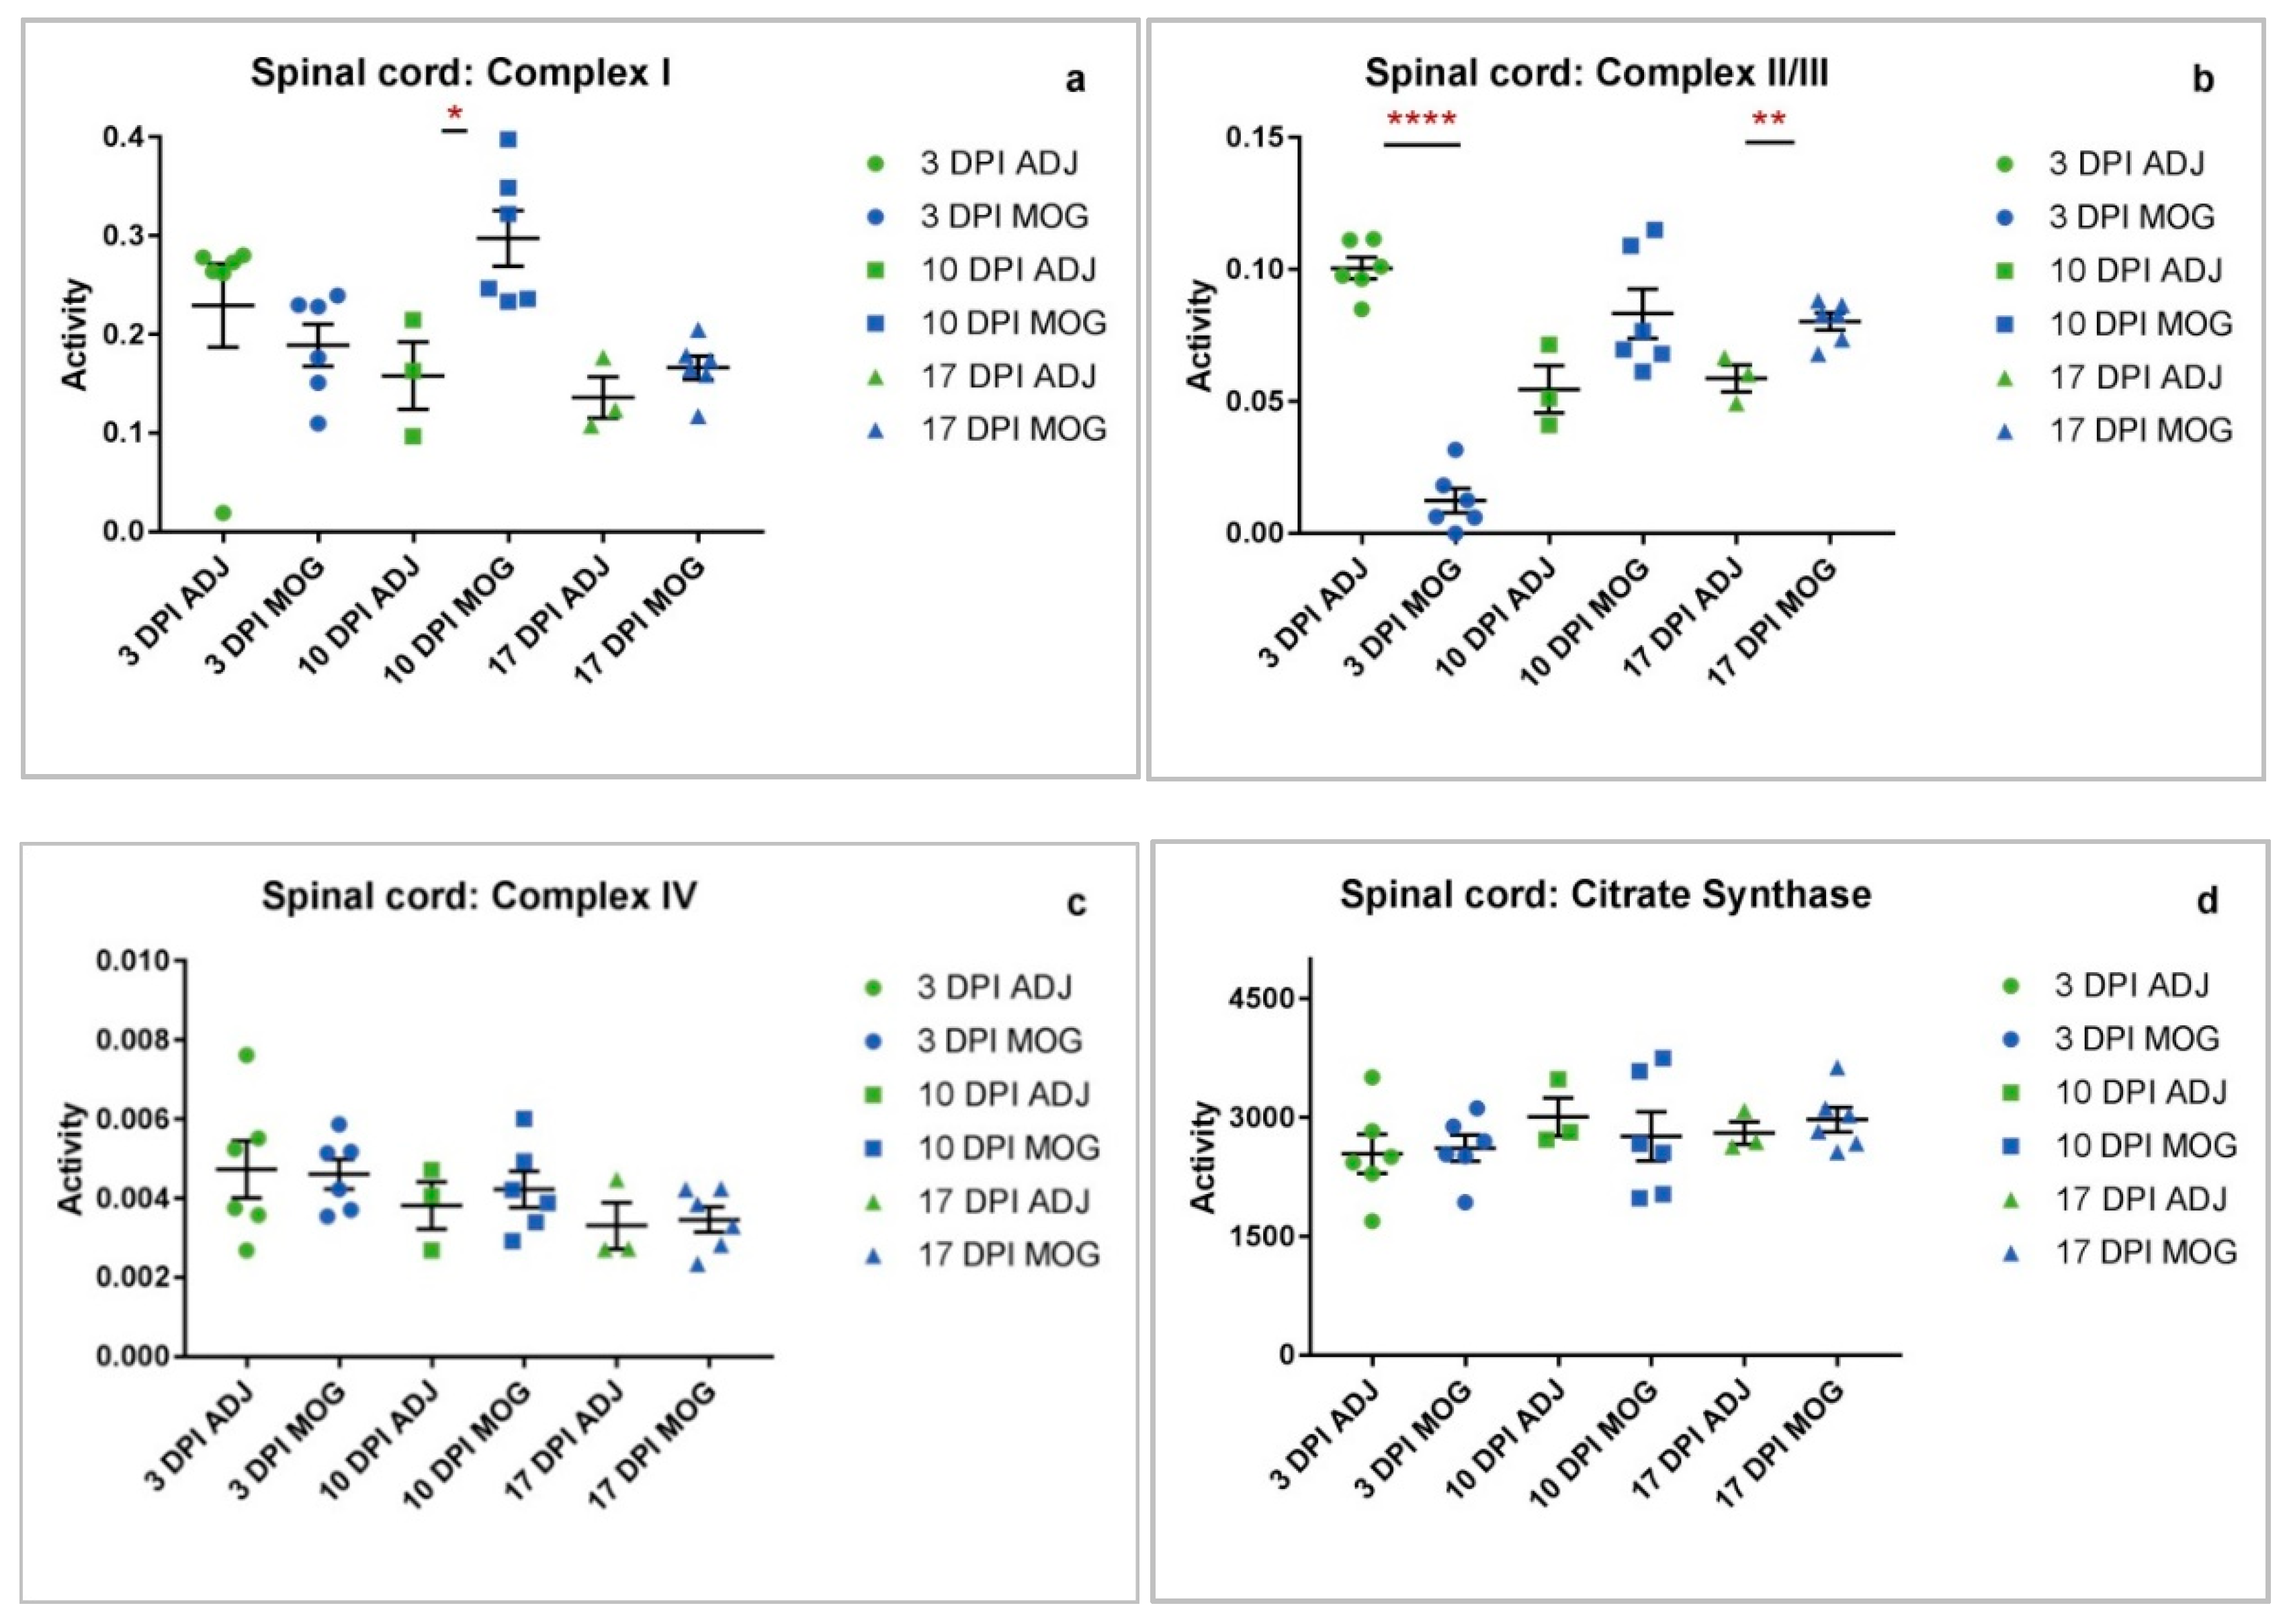
2.1. Spinal Cord
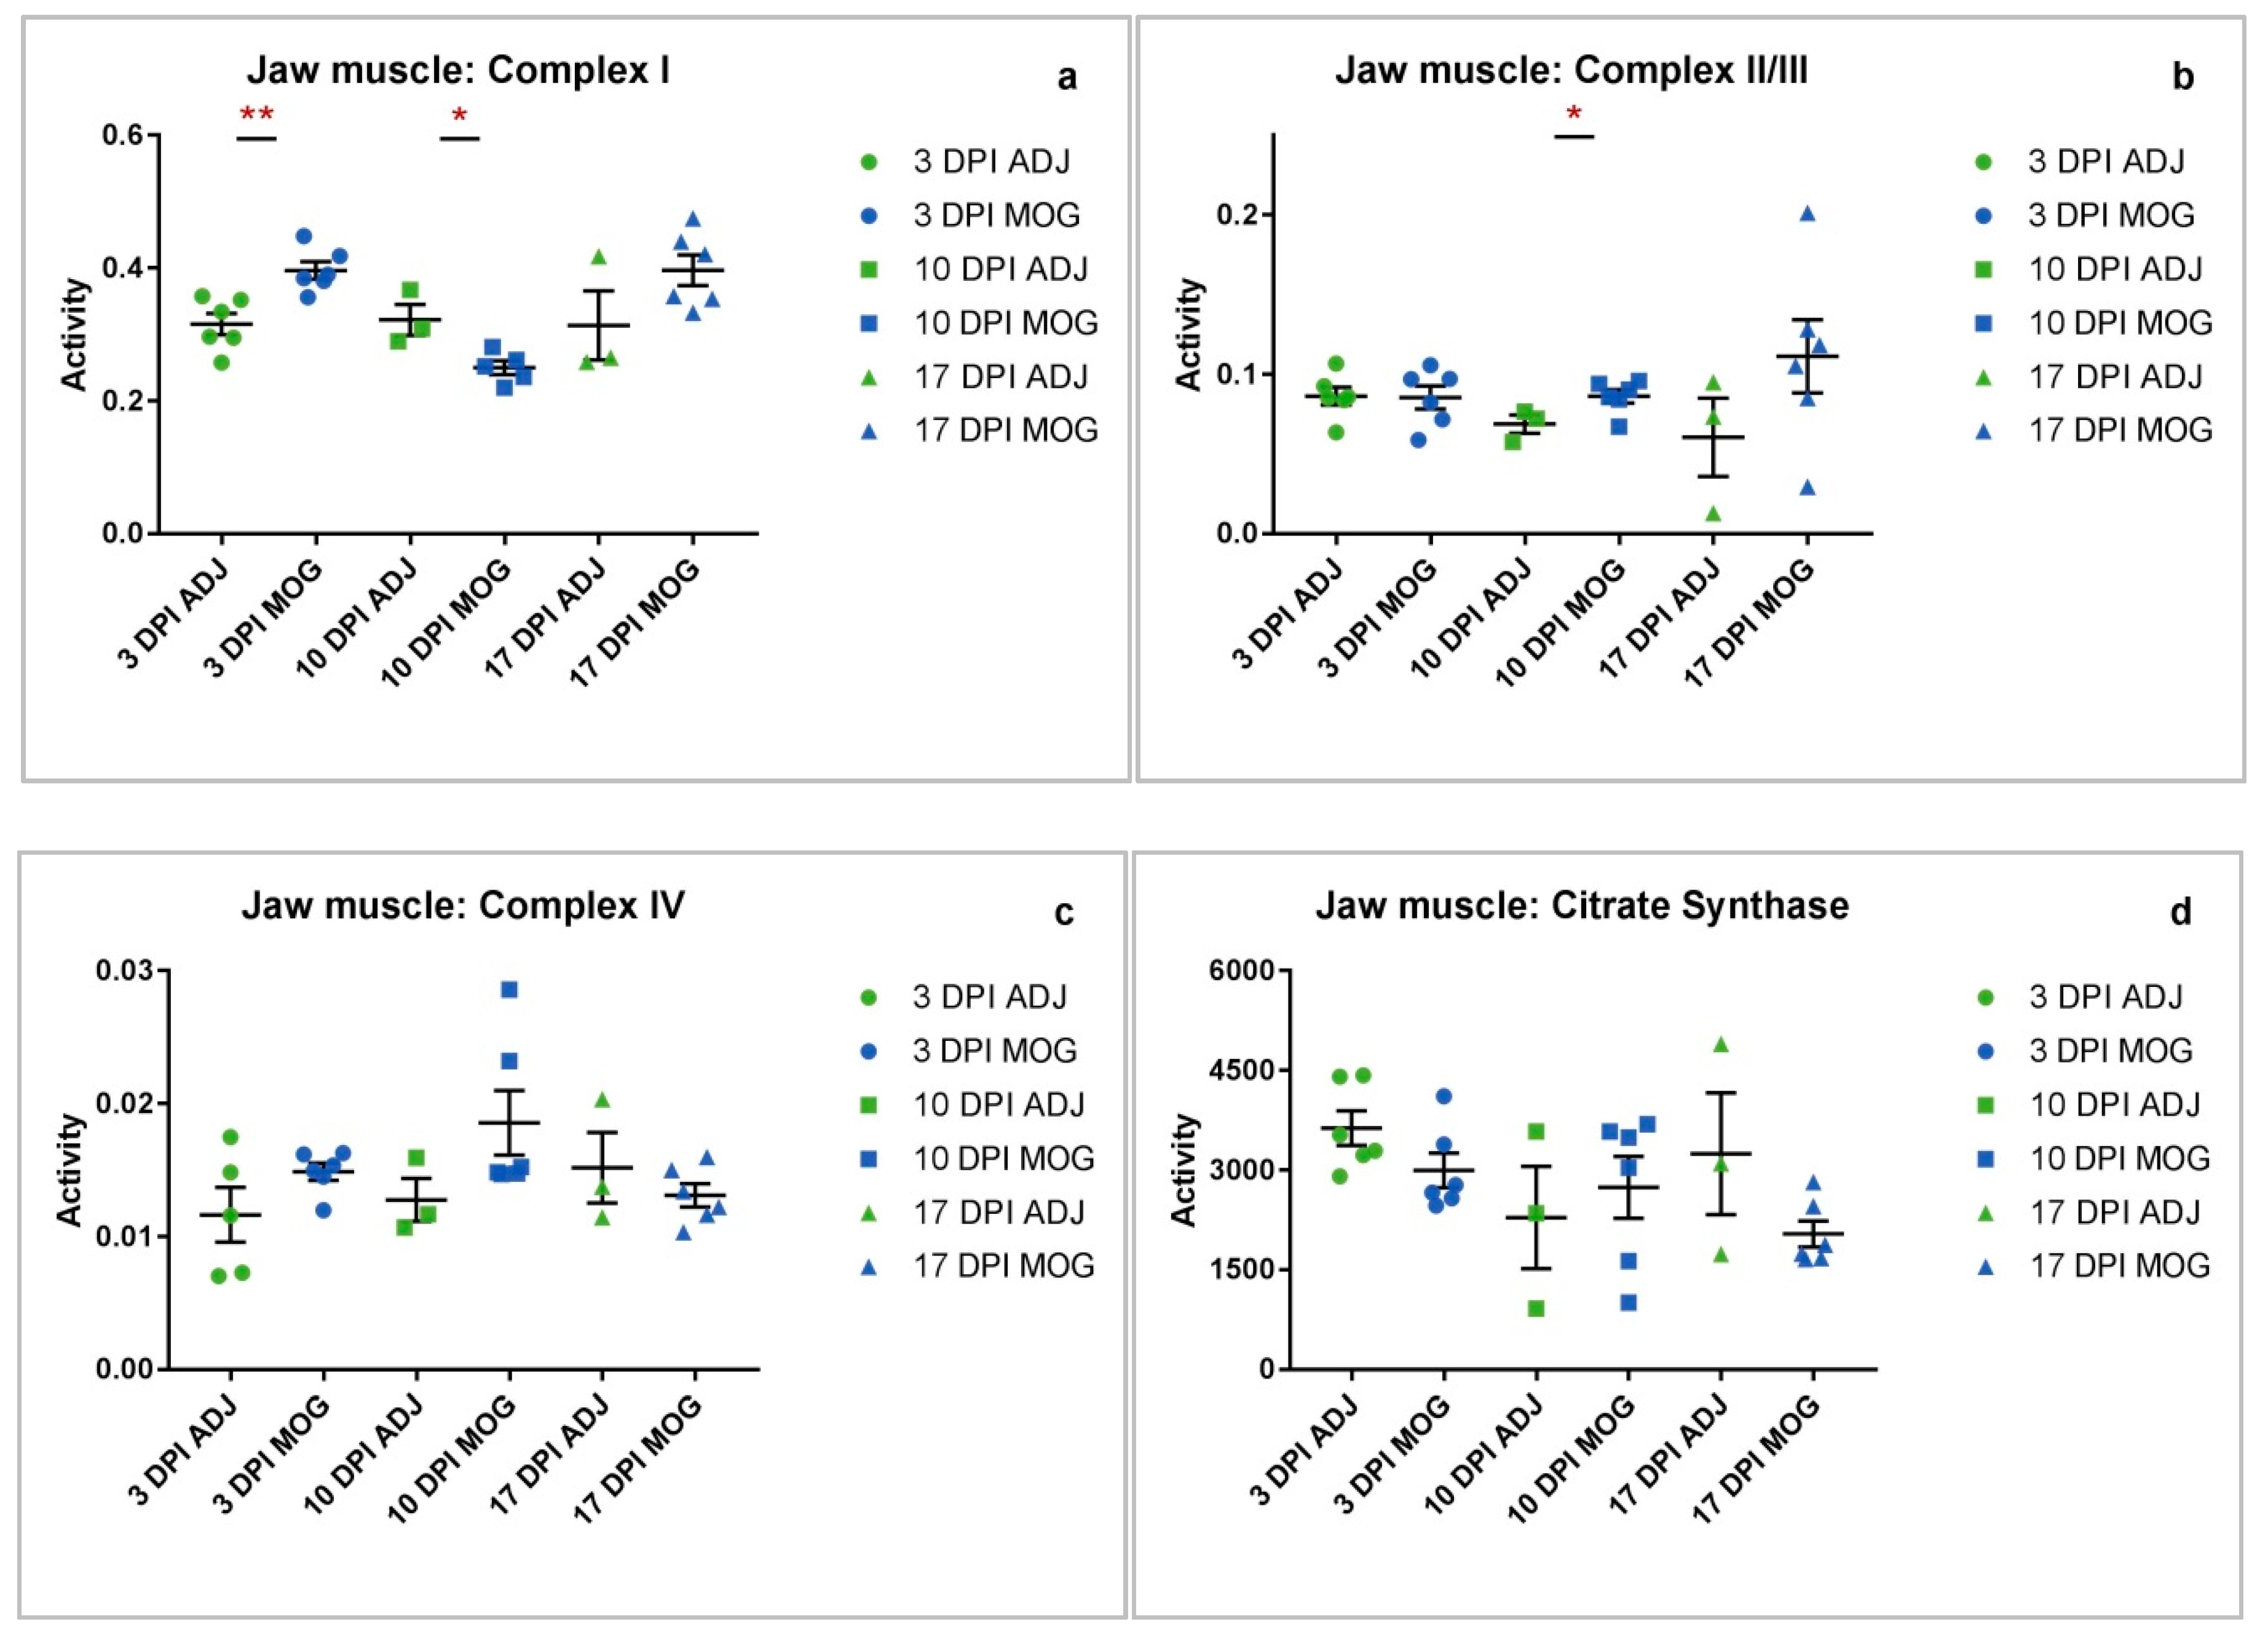
2.2. Jaw Muscle
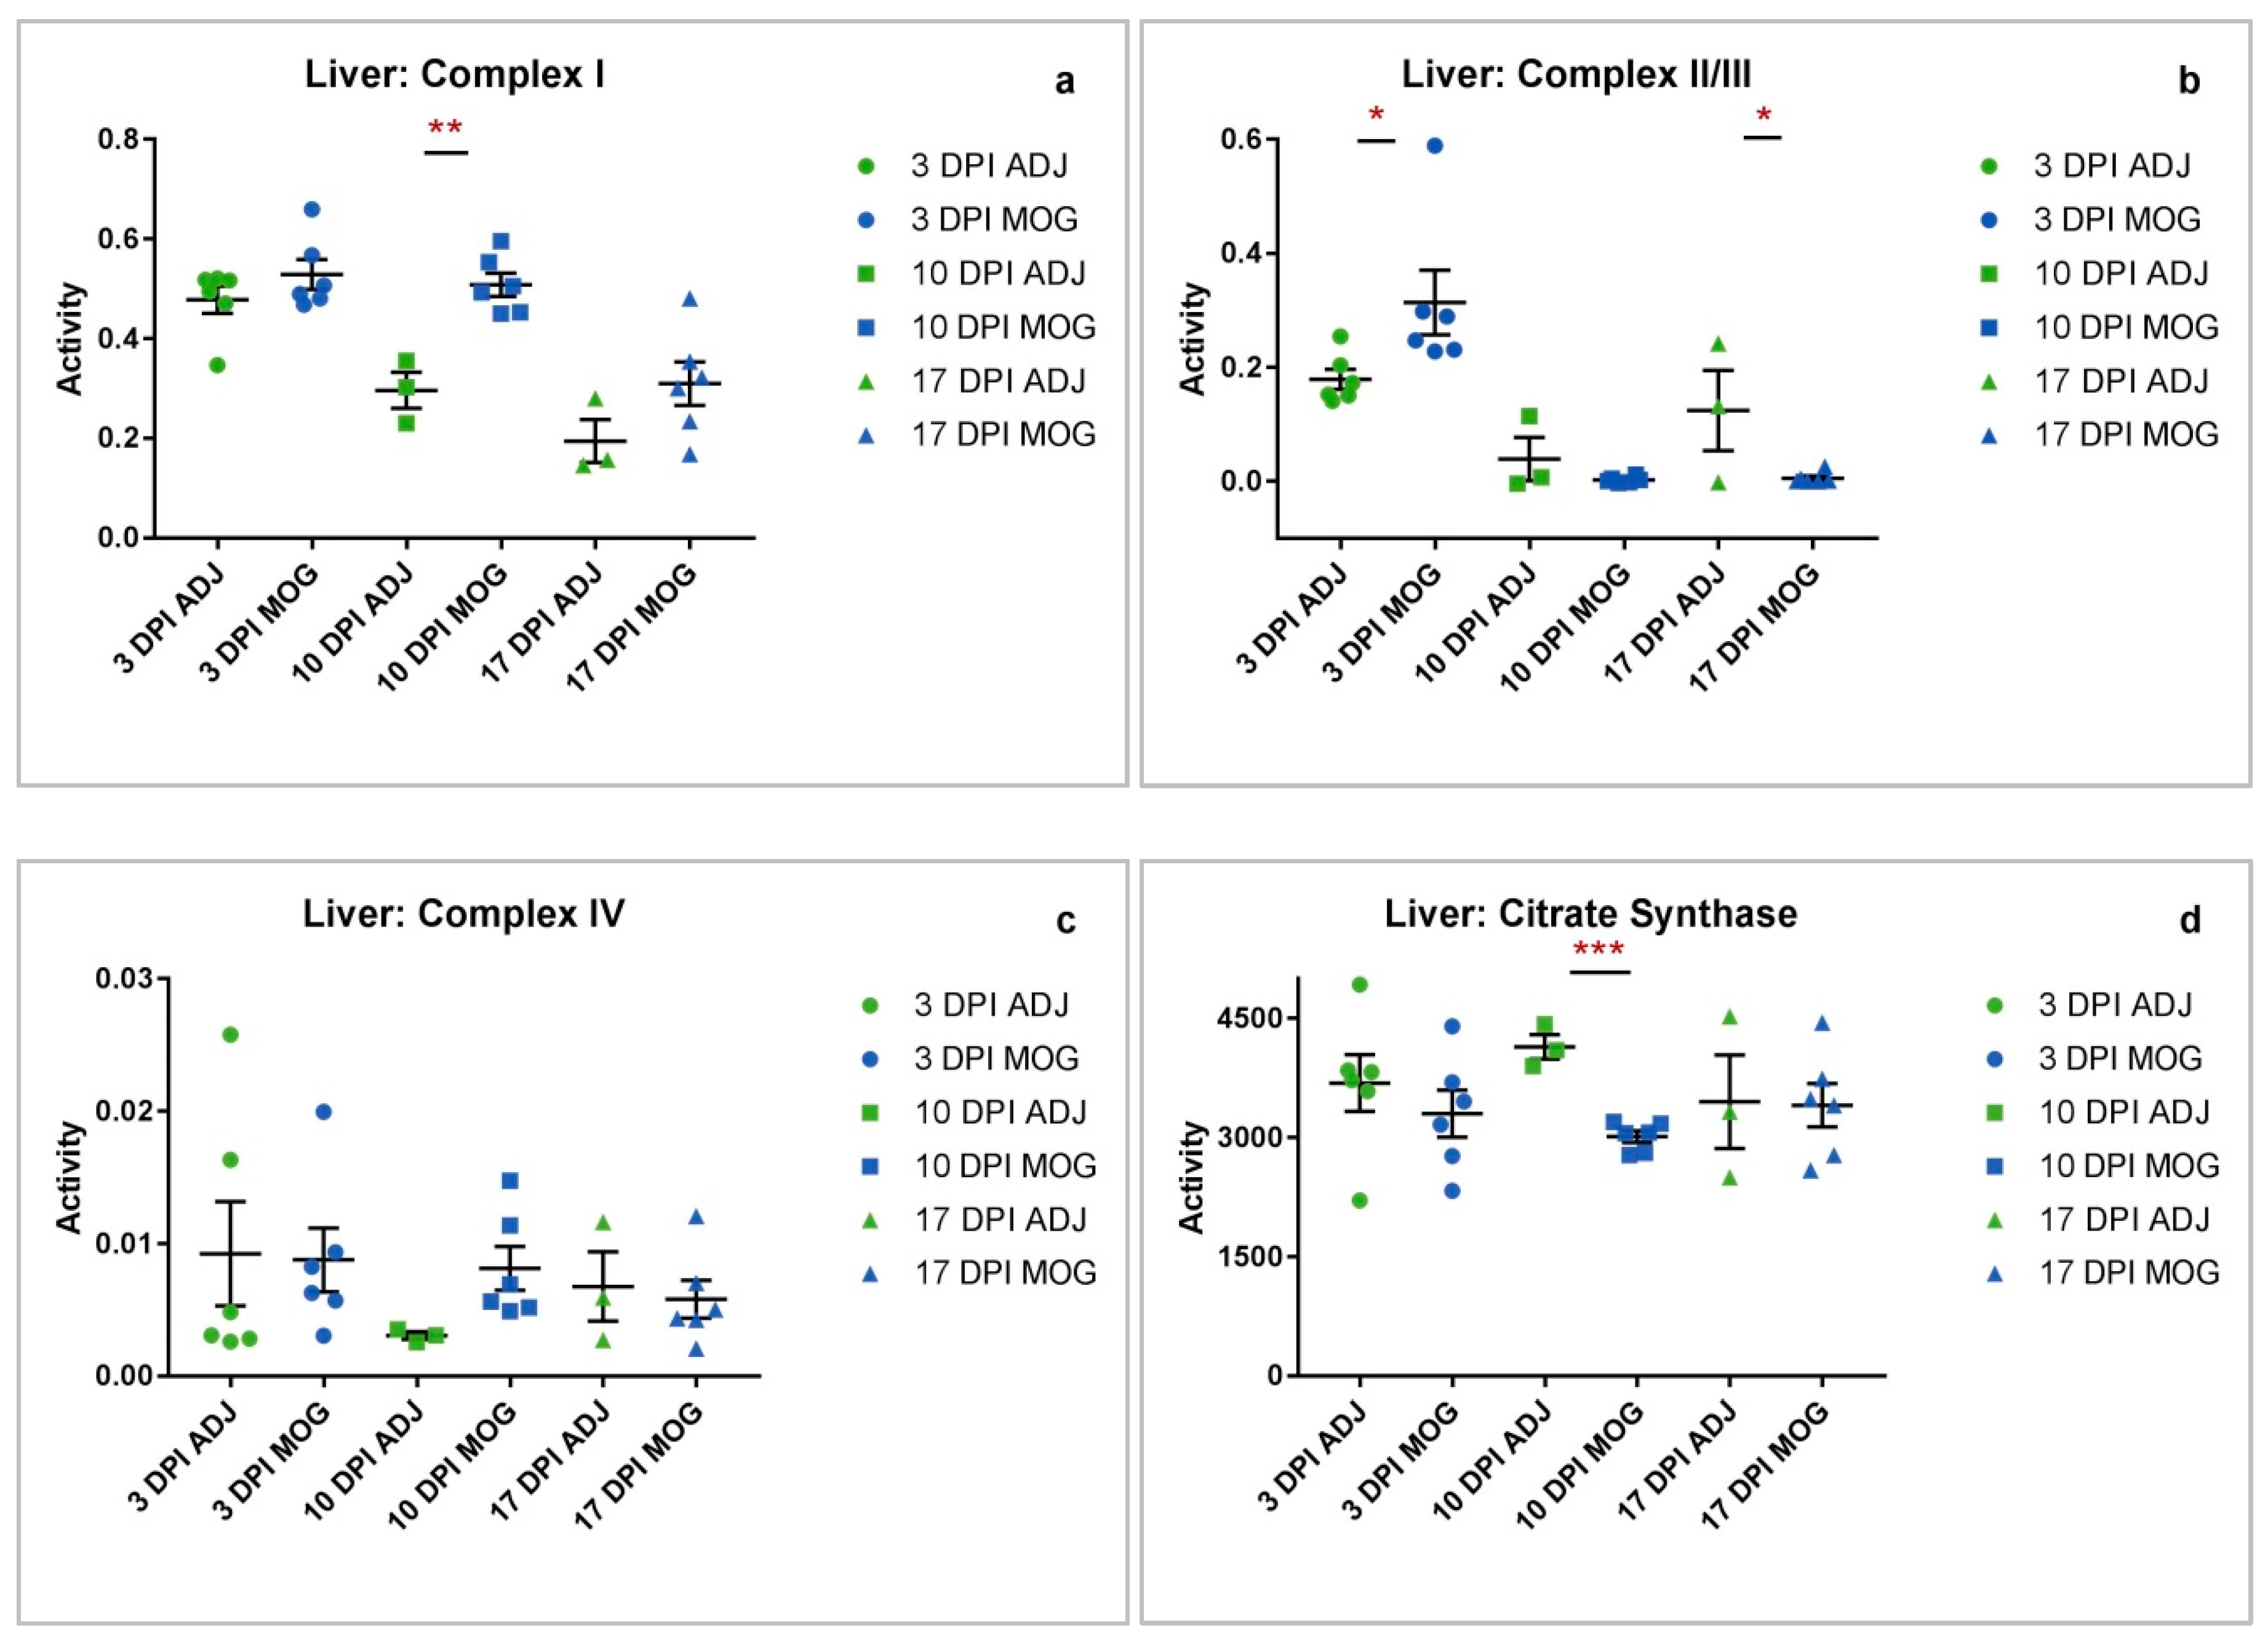
2.3. Liver
3. Discussion
4. Materials and Methods
4.1. Animals
4.2. EAE Induction
4.3. Sample Collection
4.4. Storage and Transport
4.5. Tissue Homogenization
4.6. Enzymatic Determinations
4.7. Lowry Total Protein Assay
4.8. Stastical Analysis
Supplementary Materials
Author Contributions
Funding
Conflicts of Interest
Abbreviations
| ADJ | Adjuvant |
| ATP | Adenosine Triphosphate |
| BBB | Blood–Brain Barrier |
| CD | Cluster of Differentiation |
| CFA | Complete Freund’s Adjuvant |
| CNS | Central Nervous System |
| CS | Citrate Synthase |
| DPI | Days Post First Immunisation |
| EAE | Experimental Autoimmune Encephalomyelitis |
| GM-CSF | Granulocyte-Macrophage Colony-Stimulating Factor |
| IFA | Incomplete Freund’s Adjuvant |
| IFN | Interferon |
| IL | Interlukin |
| KCN | Potassium Cyanide |
| MOG | Myelin Oligodendrocyte Glycoprotein |
| MRC | Mitochondrial Respiratory Chain |
| MS | Multiple Sclerosis |
| MTB | Mycobacterium Tuberculosis |
| mtDNA | Mitochondrial DNA |
| NADH | (Reduced) Nicotinamide Adenine Dinucleotide |
| NADPH | (Reduced) Nicotinamide Adenine Dinucleotide Phosphate |
| nDNA | Nuclear DNA |
| RNS | Reactive Nitrogen Species |
| RNSROS | Reactive Oxygen Species |
| TCA | Tricarboxylic acid cycle |
| TH | T-helper |
| TNF-α | Tumour Necrosis Factor-alpha |
References
- Mao, P.; Reddy, P.H. Is multiple sclerosis a mitochondrial disease? Biochim. Biophys. Acta 2010, 1802, 66–79. [Google Scholar] [CrossRef] [PubMed]
- Lu, F.; Selak, M.; O’Connor, J.; Croul, S.; Lorenzana, C.; Butunoi, C.; Kalman, B. Oxidative damage to mitochondrial DNA and activity of mitochondrial enzymes in chronic active lesions of multiple sclerosis. J. Neurol. Sci. 2000, 177, 95–103. [Google Scholar] [CrossRef]
- Sadeghian, M.; Mastrolia, V.; Haddad, A.R.; Mosley, A.; Mullali, G.; Schiza, D.; Sajic, M.; Hargreaves, I.; Heales, S.; Duchen, M.R.; et al. Mitochondrial dysfunction is an important cause of neurological deficits in an inflammatory model of multiple sclerosis. Sci. Rep. 2016, 6, 33249. [Google Scholar] [CrossRef] [PubMed]
- Hargreaves, I.; Mody, N.; Land, J.; Heales, S. Blood Mononuclear Cell Mitochondrial Respiratory Chain Complex IV Activity is decreased in Multiple Sclerosis Patients: Effects of β-Interferon Treatment. J. Clin. Med. 2018, 7, 36. [Google Scholar] [CrossRef] [PubMed]
- Comabella, M.; Khoury, S.J. Immunopathogenesis of multiple sclerosis. Clin. Immunol. 2012, 142, 2–8. [Google Scholar] [CrossRef] [PubMed]
- Filler, K.; Lyon, D.; Bennett, J.; McCain, N.; Elswick, R.; Lukkahatai, N.; Saligan, L.N. Association of Mitochondrial Dysfunction and Fatigue: A Review of the Literature. BBA Clin. 2014, 1, 12–23. [Google Scholar] [CrossRef] [PubMed]
- Pieczenik, S.R.; Neustadt, J. Mitochondrial dysfunction and molecular pathways of disease. Exp. Mol. Pathol. 2007, 83, 84–92. [Google Scholar] [CrossRef] [PubMed]
- Lee, J.Y.; Taghian, K.; Petratos, S. Axonal degeneration in multiple sclerosis: Can we predict and prevent permanent disability? Acta Neuropathol. Commun. 2014, 2, 97. [Google Scholar] [CrossRef]
- Chalah, M.A.; Riachi, N.; Ahdab, R.; Créange, A.; Lefaucheur, J.-P.; Ayache, S.S. Fatigue in Multiple Sclerosis: Neural Correlates and the Role of Non-Invasive Brain Stimulation. Front. Cell. Neurosci. 2015, 9, 155. [Google Scholar] [CrossRef]
- Van Horssen, J.; Witte, M.E.; Schreibelt, G.; De Vries, H.E. Radical changes in multiple sclerosis pathogenesis. Biochim. Biophys. Acta (BBA) Mol. Basis Dis. 2011, 1812, 141–150. [Google Scholar] [CrossRef] [Green Version]
- Kalman, B.; Leist, T.P. A Mitochondrial Component of Neurodegeneration in Multiple Sclerosis. NeuroMol. Med. 2003, 3, 147–158. [Google Scholar] [CrossRef]
- Liu, Y.; Hao, W.; Letiembre, M.; Walter, S.; Kulanga, M.; Neumann, H.; Fassbender, K. Suppression of Microglial Inflammatory Activity by Myelin Phagocytosis: Role of p47-PHOX-Mediated Generation of Reactive Oxygen Species. J. Neurosci. 2006, 26, 12904–12913. [Google Scholar] [CrossRef] [PubMed]
- Holman, D.W.; Klein, R.S.; Ransohoff, R.M. The Blood-Brain Barrier, Chemokines and Multiple Sclerosis. Biochim. Biophys. Acta 2011, 1812, 220–230. [Google Scholar] [CrossRef] [PubMed]
- Lassmann, H.; Van Horssen, J.; Mahad, D. Progressive multiple sclerosis: Pathology and pathogenesis. Nat. Rev. Neurol. 2012, 8, 647–656. [Google Scholar] [CrossRef] [PubMed]
- Hérnandez-Pedro, N.Y.; Espinosa-Ramirez, G.; De La Cruz, V.P.; Pineda, B.; Sotelo, J. Initial Immunopathogenesis of Multiple Sclerosis: Innate Immune Response. Clin. Dev. Immunol. 2013, 2013, 1–15. [Google Scholar] [CrossRef] [PubMed] [Green Version]
- Ferretti, G.; Bacchetti, T.; DiLudovico, F.; Viti, B.; Angeleri, V.; Danni, M.; Provinciali, L. Intracellular oxidative activity and respiratory burst of leukocytes isolated from multiple sclerosis patients. Neurochem. Int. 2006, 48, 87–92. [Google Scholar] [CrossRef] [PubMed]
- Giovannoni, G.; Heales, S.J.; Land, J.M.; Thompson, E.J. The potential role of nitric oxide in multiple sclerosis. Mult. Scler. J. 1998, 4, 212–216. [Google Scholar] [CrossRef]
- Bö, L.; Dawson, T.M.; Wesselingh, S.; Möurk, S.; Choi, S.; Kong, P.A.; Hanley, D.; Trapp, B.D. Induction of nitric oxide synthase in demyelinating regions of multiple sclerosis brains. Ann. Neurol. 1994, 36, 778–786. [Google Scholar] [CrossRef] [PubMed]
- Brand, M.D.; Nicholls, D.G. Assessing mitochondrial dysfunction in cells. Biochem. J. 2011, 435, 297–312. [Google Scholar] [CrossRef] [PubMed] [Green Version]
- Jurkowitz-Alexander, M.S.; Altschuld, R.A.; Hohl, C.M.; Johnson, J.D.; McDonald, J.S.; Simmons, T.D.; Horrocks, L.A. Cell Swelling, Blebbing, and Death Are Dependent on ATP Depletion and Independent of Calcium during Chemical Hypoxia in a Glial Cell Line (ROC-1). J. Neurochem. 1992, 59, 344–352. [Google Scholar] [CrossRef] [PubMed]
- Lieberman, M.; Marks, A.D.; Smith, C. Mark’s Essentials of Medical Biochemistry: A Clinical Approach, 2nd ed.; Lippincott Williams & Wilkins: Philadelphia, PA, USA, 2014. [Google Scholar]
- Constantinescu, C.S.; Asher, A.; Fryze, W.; Kozubski, W.; Wagner, F.; Aram, J.; Tanasescu, R.; Korolkiewicz, R.P.; Dirnberger-Hertweck, M.; Steidl, S.; et al. Randomized phase 1b trial of MOR103, a human antibody to GM-CSF, in multiple sclerosis. Neurol. Neuroimmunol. Neuroinflamm. 2015, 2, e117. [Google Scholar] [CrossRef] [PubMed] [Green Version]
- Limmroth, V.; Putzki, N.; Kachuck, N.J. The interferon beta therapies for treatment of relapsing–remitting multiple sclerosis: are they equally efficacious? A comparative review of open-label studies evaluating the efficacy, safety, or dosing of different interferon beta formulations alone or in combination. Ther. Adv. Neurol. Disord. 2011, 4, 281–296. [Google Scholar] [PubMed]
- Dumitrescu, L.; Constantinescu, C.S.; Tanasescu, R. Recent developments in interferon-based therapies for multiple sclerosis. Expert Opin. Boil. Ther. 2018, 18, 665–680. [Google Scholar] [CrossRef] [PubMed]
- Havrdova, E.K.; Belova, A.; Goloborodko, A.; Tisserant, A.; Wright, A.; Wallstroem, E.; Garren, H.; Maguire, R.P.; Johns, D.R. Activity of secukinumab, an anti-IL-17A antibody, on brain lesions in RRMS: Results from a randomized, proof-of-concept study. J. Neurol. 2016, 263, 1287–1295. [Google Scholar] [CrossRef] [PubMed]
- Ferber, I.A.; Brocke, S.; Taylor-Edwards, C.; Ridgway, W.; DiNisco, C.; Steinman, L.; Dalton, D.; Fathman, C.G. Mice with a disrupted IFN-gamma gene are susceptible to the induction of experimental autoimmune encephalomyelitis (EAE). J. Immunol. 1996, 156, 5–7. [Google Scholar] [PubMed]
- Sutton, C.; Brereton, C.; Keogh, B.; Mills, K.H.; Lavelle, E.C. A crucial role for interleukin (IL)-1 in the induction of IL-17–producing T cells that mediate autoimmune encephalomyelitis. J. Exp. Med. 2006, 203, 1685–1691. [Google Scholar] [CrossRef] [PubMed]
- Bettelli, E.; Das, M.P.; Howard, E.D.; Weiner, H.L.; A Sobel, R.; Kuchroo, V.K. IL-10 is critical in the regulation of autoimmune encephalomyelitis as demonstrated by studies of IL-10- and IL-4-deficient and transgenic mice. J. Immunol. 1998, 161, 3299–3306. [Google Scholar] [PubMed]
- Becher, B.; Durell, B.G.; Noelle, R.J. Experimental autoimmune encephalitis and inflammation in the absence of interleukin-12. J. Clin. Investig. 2002, 110, 493–497. [Google Scholar] [CrossRef] [PubMed]
- Cua, D.J.; Sherlock, J.; Chen, Y.; Murphy, C.A.; Joyce, B.; Seymour, B.; Lucian, L.; To, W.; Kwan, S.; Churakova, T.; et al. Interleukin-23 rather than interleukin-12 is the critical cytokine for autoimmune inflammation of the brain. Nature 2003, 421, 744–748. [Google Scholar] [CrossRef] [PubMed]
- Wheeler, R.D.; Zehntner, S.P.; Kelly, L.M.; Bourbonnière, L.; Owens, T. Elevated interferon gamma expression in the central nervous system of tumour necrosis factor receptor 1-deficient mice with experimental autoimmune encephalomyelitis. Immunology 2006, 118, 527–538. [Google Scholar] [CrossRef]
- Palle, P.; Monaghan, K.L.; Milne, S.M.; Wan, E.C. Cytokine Signaling in Multiple Sclerosis and Its Therapeutic Applications. Med Sci. 2017, 5, 23. [Google Scholar] [CrossRef]
- Dendrou, C.A.; Fugger, L.; Friese, M.A. Immunopathology of multiple sclerosis. Nat. Rev. Immunol. 2015, 15, 545–558. [Google Scholar] [CrossRef]
- Miller, S.D.; Karpus, W.J. Experimental Autoimmune Encephalomyelitis in the Mouse. Curr. Protoc. Immunol. 2007. [Google Scholar] [CrossRef]
- Osellame, L.D.; Rahim, A.A.; Hargreaves, I.P.; Gegg, M.E.; Richard-Londt, A.; Brandner, S.; Waddington, S.N.; Schapira, A.H.V.; Duchen, M.R. Mitochondria and Quality Control Defects in a Mouse Model of Gaucher Disease—Links to Parkinson’s disease. Cell Metab. 2013, 17, 941–953. [Google Scholar] [CrossRef]
- Hughes, S.D.; Kanabus, M.; Anderson, G.; Hargreaves, I.P.; Rutherford, T.; Donnell, M.O.; Cross, J.H.; Rahman, S.; Eaton, S.; Heales, S.J.R. The ketogenic diet component decanoic acid increases mitochondrial citrate synthase and complex I activity in neuronal cells. J. Neurochem. 2014, 129, 426–433. [Google Scholar] [CrossRef]
- Lassmann, H. Pathogenic Mechanisms Associated With Different Clinical Courses of Multiple Sclerosis. Front. Immunol. 2018, 9, 3116. [Google Scholar] [CrossRef]
- Ott, M.; Gogvadze, V.; Orrenius, S.; Zhivotovsky, B. Mitochondria, Oxidative Stress and Cell Death. Apoptosis 2007, 12, 913–922. [Google Scholar] [CrossRef]
- Kausar, S.; Wang, F.; Cui, H. The Role of Mitochondria in Reactive Oxygen Species Generation and Its Implications for Neurodegenerative Diseases. Cells 2018, 7, 274. [Google Scholar] [CrossRef]
- Davey, G.P.; Peuchen, S.; Clark, J.B. Energy Thresholds in Brain Mitochondria. J. Boil. Chem. 1998, 273, 12753–12757. [Google Scholar] [CrossRef] [Green Version]
- Claus, C.; Schönefeld, K.; Hübner, D.; Chey, S.; Reibetanz, U.; Liebert, U.G. Activity Increase in Respiratory Chain Complexes by Rubella Viruswith Marginal Induction of Oxidative Stress. J. Virol. 2013, 87, 8481–8492. [Google Scholar] [CrossRef]
- Foti, S.C.; Hargreaves, I.; Carrington, S.; Kiely, A.P.; Houlden, H.; Holton, J.L. Cerebral mitochondrial electron transport chain dysfunction in multiple system atrophy and Parkinson’s disease. Sci. Rep. 2019, 9, 6559. [Google Scholar] [CrossRef]
- Sanoober, M.; Dehghan, P.; Khalili, M.; Azimi, A.; Seifar, F. Coenzyme Q10 as a treatment for fatigue and depression in multiple sclerosis patients: A double blind randomized clinical trial. Nutr. Neurosci. 2016, 19, 138–143. [Google Scholar] [CrossRef]
- King, T.S. Methods in Enzymology; Academic Press: Cambridge, MA, USA, 1967; Volume 10, pp. 217–235. [Google Scholar]
- Heales, S.J.R.; Hargreaves, I.P.; Olpin, S.E.; Olpin, S.E. Diagnosis of Mitochondrial Electron Transport Chain Defects in Small Muscle Biopsies. J. Inher. Metab. Dis. 1996, 19 (Suppl. 1), 151. [Google Scholar]
- Hargreaves, I.P.; Sheena, Y.; Land, J.M.; Heales, S.J.R. Glutathione deficiency in patients with mitochondrial disease: Implications for pathogenesis and treatment. J. Inherit. Metab. Dis. 2005, 28, 81–88. [Google Scholar] [CrossRef]
- Qi, X.; Lewin, A.S.; Sun, L.; Hauswirth, W.W.; Guy, J. Mitochondrial Protein Nitration Primes Neurodegeneration in Experimental Autoimmune Encephalomyelitis. J. Biol. Chem. 2006, 281, 31950–31962. [Google Scholar] [CrossRef] [Green Version]
- Detmer, S.A.; Chan, D.C. Functions and dysfunctions of mitochondrial dynamics. Nat. Rev. Mol. Cell Boil. 2007, 8, 870–879. [Google Scholar] [CrossRef]
- Telford, J.E.; Kilbride, S.M.; Davey, G.P. Complex I Is Rate-limiting for Oxygen Consumption in the Nerve Terminal*. J. Boil. Chem. 2009, 284, 9109–9114. [Google Scholar] [CrossRef]
- Mahad, D.J.; Ziabreva, I.; Campbell, G.; Lax, N.; White, K.; Hanson, P.S.; Lassmann, H.; Turnbull, D.M. Mitochondrial changes within axons in multiple sclerosis. Brain 2009, 132, 1161–1174. [Google Scholar] [CrossRef] [Green Version]
- Barksdale, K.A.; Perez-Costas, E.; Gandy, J.C.; Melendez-Ferro, M.; Roberts, R.C.; Bijur, G.N. Mitochondrial viability in mouse and human postmortem brain. FASEB J. 2010, 24, 3590–3599. [Google Scholar] [CrossRef]
- Ghaffarinia, A.; Jalili, C.; Mostafaie, A.; Parvaneh, S.; Pakravan, N. Liver Damage and Mortality in a Male Lewis Rat of Experimental Autoimmune Encephalomyelitis. Iran. J. Pathol. 2015, 10, 9–16. [Google Scholar]
- Bolaños, J.P.; Peuchen, S.; Heales, S.J.; Land, J.M.; Clark, J.B. Nitric oxide-mediated inhibition of the mitochondrial respiratory chain in cultured astrocytes. J. Neurochem. 1994, 63, 910–916. [Google Scholar] [CrossRef]
- Ragan, C.I.; Wilson, M.T.; Darley-Usmar, V.M.; Lowe, P.N. Mitochondria, A Practical Approach; IRL Press at Oxford University Press: Oxford, UK, 1987. [Google Scholar]
- Wharton, D.C.; Tzagoloff, A. Cytochrome oxidase from beef heart mitochondria. In Methods in Enzymology; Elsevier BV: Amsterdam, The Netherlands, 1967; Volume 10, pp. 245–250. [Google Scholar]
- Shephard, J.A.; Garland, P.B. Methods in Enzymology; Academic Press: Cambridge, MA, USA, 1969; Volume 13, pp. 11–19. [Google Scholar]
- Selak, M.A.; De Chadarevian, J.P.; Melvin, J.J.; Grover, W.D.; Salganicoff, L.; Kaye, E.M. Mitochondrial activity in pompe’s disease. Pediatr. Neurol. 2000, 23, 54–57. [Google Scholar] [CrossRef]
- Lowry, O.H.; Rosebrough, N.J.; Farr, A.L.; Randall, R.J. Protein measurement with the Folin phenol reagent. J. Boil. Chem. 1951, 193, 265–275. [Google Scholar]


© 2019 by the authors. Licensee MDPI, Basel, Switzerland. This article is an open access article distributed under the terms and conditions of the Creative Commons Attribution (CC BY) license (http://creativecommons.org/licenses/by/4.0/).
Share and Cite
Ng, X.; Sadeghian, M.; Heales, S.; Hargreaves, I.P. Assessment of Mitochondrial Dysfunction in Experimental Autoimmune Encephalomyelitis (EAE) Models of Multiple Sclerosis. Int. J. Mol. Sci. 2019, 20, 4975. https://doi.org/10.3390/ijms20204975
Ng X, Sadeghian M, Heales S, Hargreaves IP. Assessment of Mitochondrial Dysfunction in Experimental Autoimmune Encephalomyelitis (EAE) Models of Multiple Sclerosis. International Journal of Molecular Sciences. 2019; 20(20):4975. https://doi.org/10.3390/ijms20204975
Chicago/Turabian StyleNg, Xiulin, Mona Sadeghian, Simon Heales, and Iain P. Hargreaves. 2019. "Assessment of Mitochondrial Dysfunction in Experimental Autoimmune Encephalomyelitis (EAE) Models of Multiple Sclerosis" International Journal of Molecular Sciences 20, no. 20: 4975. https://doi.org/10.3390/ijms20204975