Article

iTRAQ-Based Protein Profiling and Biochemical Analysis of Two Contrasting Rice Genotypes Revealed Their Differential Responses to Salt Stress

1
State Key Laboratory of Rice Biology, China National Rice Research Institute, Hangzhou 310006, Zhejiang, China
2
Department of Agronomy, University of Agriculture Faisalabad, Punjab 38000, Pakistan
*
Authors to whom correspondence should be addressed.
Equal Contribution.
Int. J. Mol. Sci. 2019, 20(3), 547; https://doi.org/10.3390/ijms20030547
Submission received: 29 December 2018 / Revised: 20 January 2019 / Accepted: 24 January 2019 / Published: 28 January 2019
(This article belongs to the Special Issue Salinity Tolerance in Plants)

Abstract

:
Salt stress is one of the key abiotic stresses causing huge productivity losses in rice. In addition, the differential sensitivity to salinity of different rice genotypes during different growth stages is a major issue in mitigating salt stress in rice. Further, information on quantitative proteomics in rice addressing such an issue is scarce. In the present study, an isobaric tags for relative and absolute quantitation (iTRAQ)-based comparative protein quantification was carried out to investigate the salinity-responsive proteins and related biochemical features of two contrasting rice genotypes—Nipponbare (NPBA, japonica) and Liangyoupeijiu (LYP9, indica), at the maximum tillering stage. The rice genotypes were exposed to four levels of salinity: 0 (control; CK), 1.5 (low salt stress; LS), 4.5 (moderate salt stress; MS), and 7.5 g of NaCl/kg dry soil (high salt stress, HS). The iTRAQ protein profiling under different salinity conditions identified a total of 5340 proteins with 1% FDR in both rice genotypes. In LYP9, comparisons of LS, MS, and HS compared with CK revealed the up-regulation of 28, 368, and 491 proteins, respectively. On the other hand, in NPBA, 239 and 337 proteins were differentially upregulated in LS and MS compared with CK, respectively. Functional characterization by KEGG and COG, along with the GO enrichment results, suggests that the differentially expressed proteins are mainly involved in regulation of salt stress responses, oxidation-reduction responses, photosynthesis, and carbohydrate metabolism. Biochemical analysis of the rice genotypes revealed that the Na+ and Cl uptake from soil to the leaves via the roots was increased with increasing salt stress levels in both rice genotypes. Further, increasing the salinity levels resulted in increased cell membrane injury in both rice cultivars, however more severely in NPBA. Moreover, the rice root activity was found to be higher in LYP9 roots compared with NPBA under salt stress conditions, suggesting the positive role of rice root activity in mitigating salinity. Overall, the results from the study add further insights into the differential proteome dynamics in two contrasting rice genotypes with respect to salt tolerance, and imply the candidature of LYP9 to be a greater salt tolerant genotype over NPBA.

1. Introduction

To satisfy the food demands of a population of more than nine billion people by 2050, the world’s food productivity needs to be increased by 50% above current production [1,2]. The current growth trends of the major food crops, including wheat, rice, maize, and soybean, suggest that crop production will not be sufficient to meet these ever-rising food demands [3]. Further, the occurrence of abiotic stresses owing to climate change is one of the major reasons for the productivity gap [4]. Soil salinity is considered to be a major problem in the productivity of rice (Oryza sativa L.) worldwide [4]. Rice is highly sensitive to salt stress; however, the range of sensitivity varies with rice ecotypes, genotypes, and growth stages [5,6]. Salt tolerance in rice is correlated with variations in the translocation of sodium (Na+) and chloride (Cl) ions in the aboveground plant organs, including the shoot and panicles [7,8,9,10,11,12]. Salinity affects rice physiology and growth by causing osmotic stress, nutrient imbalance, ionic toxicity, oxidative damage, alteration of metabolic processes, reduced cell division, genotoxicity, decline of growth and yield, and even the death of the plant [8,9,13,14,15,16,17]. In rice, salinity tolerance is usually achieved as a result of a cocktail of physiological and genetic reprogramming, including selective ion uptake and exclusion, preferential compartmentation of Na+, alternation in stomatal closure, reactive oxygen species (ROS) signaling, and expression of salt-stress responsive genes and transcription factors [18,19,20,21,22].
Alterations in physiological and biochemical processes lead to changes in the protein pool in plants. In recent times, proteomic analysis has emerged as a significant molecular technique for the profiling and identification of proteins expressed in response to various abiotic stresses [23]. Isobaric tags for relative and absolute quantitation (iTRAQ)-based protein profiling and analysis has been performed in several crops, including rice [24], maize [25], wheat [26], tomatoes [27], and cotton [23], in response to abiotic stresses. Differential protein expressions in the areal tissues of rice subjected to salt stress have been reported by a few studies [28,29,30]. However, most of these studies have employed the 2D gel electrophoresis method to quantify the protein dynamics in rice. The 2D gel electrophoresis technique lacks efficiency in identifying the low abundant proteins, including extreme-acidic or basic proteins, proteins with molecular weights <15 kDa or >150 kDa, and hydrophobic proteins [23]. Furthermore, most of these works have been performed using the japonica rice genotype “Nipponbare” as the plant material. Therefore, in this study, we explored the proteomic dynamics of rice under salt stress in both japonica (Nipponbare, NPBA) and indica (Liangyoupeijiu, LYP9) rice genotypes by employing an iTRAQ-based proteomic study.
In the current study, the iTRAQ-based proteomic technique was used to identify the differentially expressed proteins in two rice genotypes of contrasting salt tolerance levels. The indica rice LYP9 has a higher salt tolerance level than the japonica rice NPBA [13]. Therefore, the proteomic analysis was performed with the aim of elucidating and comparing the effects of salt stress in these rice genotypes. Further, the physiological responses, such as cell membrane injury (CMI) and rice root activity of the NPBA and LYP9 genotypes, were assessed in response to various salt stress levels at the maximum tillering stage. Additionally, the Na+ and Cl uptake from soil to leaf via root under the subjected salt stress levels were determined in both rice genotypes. The results from this study will help us to achieve better insights into the salt stress resistance mechanisms in rice.

2. Results

2.1. Na+ and Cl in the Soil

The soil Na+ concentrations for LYP9 rice were recorded to be 0.17, 0.95, 1.7, and 2.0 mg·g−1 for the control (no salt stress, CK), low salt stress (LS), moderate salt stress (MS), and high salt stress (HS) treatments, respectively. In NPBA, the soil Na+ was recorded to be 0.18, 1.0, 1.6, and 2.15 mg·g−1 for the CK, LS, MS, and HS treatments, respectively. The Na+ concentration was found to be the highest in the HS treatment for NPBA rice, as most of the rice seedlings died under the HS condition before attaining the maximum tillering stage. Furthermore, the soil Na+ concentration was lower for the LYP9 rice than the NPBA rice (Table 1). On the other hand, the soil Cl concentrations were recorded to be 0.04, 0.59, 2.17, and 2.43 mg·g−1 for the CK, LS, MS, and HS treatments in LYP9 rice, respectively. In NPBA, the soil Cl was found to be 0.01, 0.66, 1.64, and 3.03 mg·g−1 for the CK, LS, MS, and HS treatments, respectively.

2.2. Na+ and Cl in the Rice Plants

The concentration of Na+ was found to increase in rice in proportion to rice growth. At the time of rice transplanting, the Na+ concentration in the LYP9 and NPBA roots was 0.44 and 0.37 mg·g−1, respectively. However, at the maximum tillering stage, Na+ concentrations in rice roots was increased in both rice genotypes, with the increase in subjected salt stress levels. In LYP9 rice, LS, MS, and HS levels of salt stress resulted in the increase of Na+ concentrations in rice roots amounting to 67.2%, 126.9%, and 138.8%, respectively, as compared with the CK treatment. Similarly, in NPBA rice, Na+ concentration in the roots was increased by 42.9% for LS and 128.6% for MS as compared with the CK treatment. However, the NPBA rice could not survive under HS salinity conditions. These results indicated that the uptake of Na+ is higher in rice in the maximum tillering stage as compared to the seedling stage (Table 1). Similar proportions were observed for Na+ concentration in rice leaves, where the Na+ concentrations were found to be increased by 163.2%, 305.3%, and 357.9% under LS, MS, and HS conditions, respectively, as compared with the CK condition in LYP9 rice, and by 86.7% and 480% under LS and MS conditions, respectively, as compared with the CK condition in NPBA rice (Table 1). The Na+ uptake from root to shoot was found to be higher in LYP9 than NPBA. These results suggest that LYP9 has an enhanced ability to uptake Na+ in the plant parts than compared to NPBA, which might aid in improved salt tolerance in LYP9 compared with NPBA. Likewise, at the maximum tillering stage, the Cl uptake by the rice roots and leaves was increased with the increase in the salt stress levels (Table 1). Moreover, these increases in the Cl ion uptakes were found to be higher in LYP9 leaves and roots than those of NPBA.

2.3. Cell Membrane Injury (CMI) in Rice Flag Leaves

Evaluations of cell membrane injury (CMI) in both LYP9 and NPBA rice revealed that salt concentrations and CMI are directly proportional, where higher salt concentrations cause severe cell membrane damage. The CMI was found to be higher in the HS condition as compared with MS, LS, and CK conditions in both rice cultivars (Figure 1). CMI was recorded as 5% for CK, 6.7% for LS, 7% for MS, and 15.2% for HS in LYP9. However, CMI in NPBA was recorded as 9.8% for CK, 10.6% for LS, and 11.9% for MS. Compared with the control (CK), the CMI in the LYP9 rice cultivar was increased by 34%, 40%, and 204% under LS, MS, and HS, respectively. On the other hand, CMI was increased by 8.1% (LS), and 21.4% (MS) in the NPBA rice, whilst rice seedlings died under HS conditions before reaching the maximum tillering stage in this genotype of rice (Figure 2). These results strongly suggest that salt stress negatively affects the cell membrane stability, and cell membrane integrity was found to be higher in LYP9 as compared with NPBA. Collectively, these results indicated that LYP9 is more tolerant to salt stress than NPBA.

2.4. Rice Root Activity

High root activity is an indicator of resistance against stress [31]. Rice root activity was increased by 2.1% for LS, 50.2% for MS, and 173.7% for HS as compared with CK in LYP9. In the case of NPBA, the rice root activity was decreased by 3.3% for LS, while it increased by 111.4% for MS, as compared to CK. In this study, the rice root activity was higher in LYP9 compared with NPBA under various salt stress levels, inferring the role of root activity in salt tolerance (Figure 3).

2.5. iTRAQ-Based Protein Identification at the Rice Maximum Tillering Stage

Quantitative proteomic analysis of three leaf samples (CK, LS, and MS) from NPBA rice and four leaf samples (CK, LS, MS, and HS) from LYP9 rice were performed using the iTRAQ method. In total, 5340 proteins were identified with 1% FDR (Table 2). In LYP9, 28, 368, and 491 proteins were found to be up-regulated under LS, MS, and HS treatments, respectively, as compared with the CK treatment. On the other hand, in NPBA, 239 and 337 up-regulated proteins were detected under the LS and MS treatments as compared with the CK treatment (Table 3). The longest length of enriched peptides was 7 to 18, with the mass error below 0.025 to 1.00 and with a high performing Pearson correlation coefficient with repeated samples, showing a high quality of the mass spectroscopy data and sample preparation. Proteins with a 1.2 fold change and Q-value of >0.05 were considered as differentially expressed proteins.

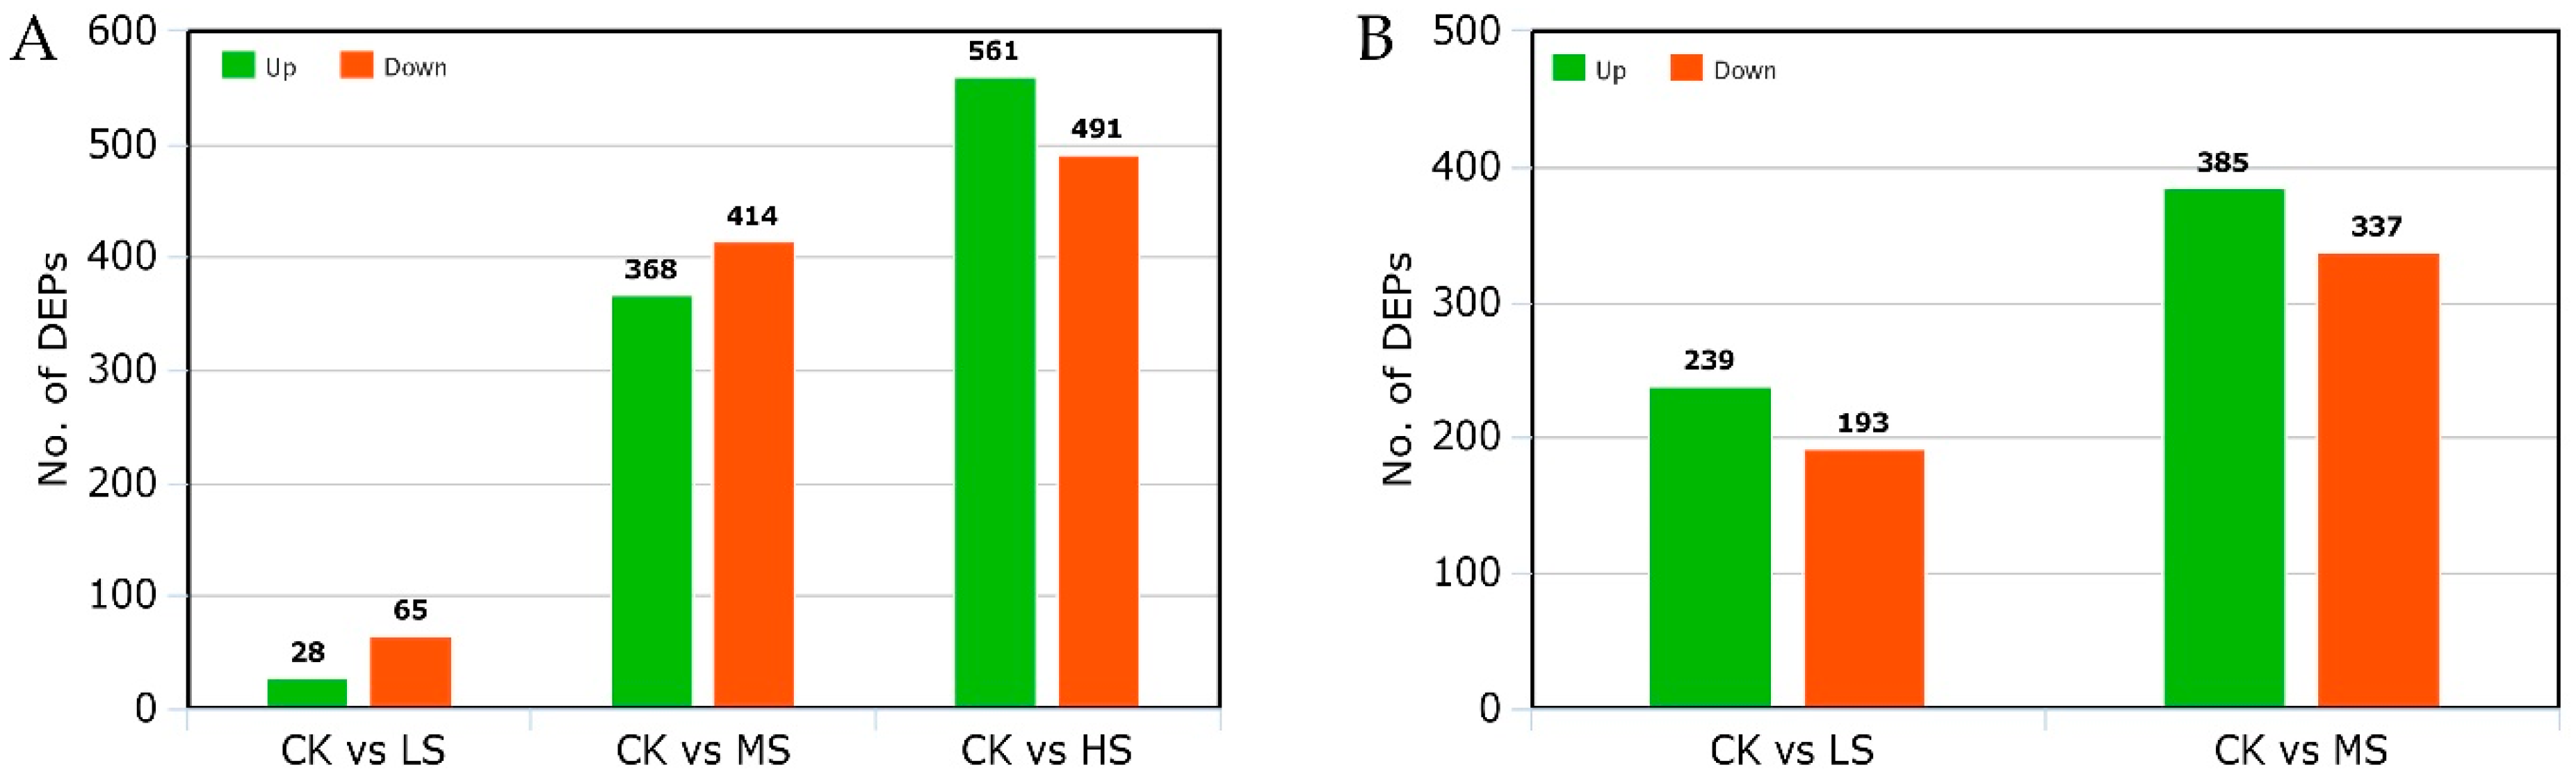
2.6. Identification of Differential Expressive Proteins in LYP9 and NPBA Subjected to Different Salt Stress Levels

From the iTRAQ-based identified proteins in both rice genotypes, the proteins that showed a relative abundance of >1.2 fold or <0.8 fold in the salt stressed plants, as compared to the control, were considered to be differential expressive proteins (DEPs). In LYP9 rice, 1927 DEPs were identified under various salt levels. For instance, 93 (28 up-regulated, 65 down-regulated) DEPs were identified in the LS condition, 782 (368 up-regulated, 414 down-regulated) DEPs were identified in the MS condition, and 1052 (561 up-regulated, 491 down-regulated) DEPs were identified in the HS plants, as compared to the control (Figure 4A). On the other hand, 1154 DEPs were identified in the NPBA rice under the applied salt stress levels. Briefly, 432 (239 up-regulated, 193 down-regulated) DEPs were identified in the LS condition and 722 (385 up-regulated, 337 down-regulated) DEPs were identified in the MS plants, as compared with the control (Figure 4B). Identification of the DEPs in both rice genotypes indicated that, with an increase in the salt levels, the number of DEPs was also increased in both rice types. Further, under LS stress levels, the number of DEPs was significantly less in the salt tolerant LYP9 genotype than in the salt sensitive NBPA rice.

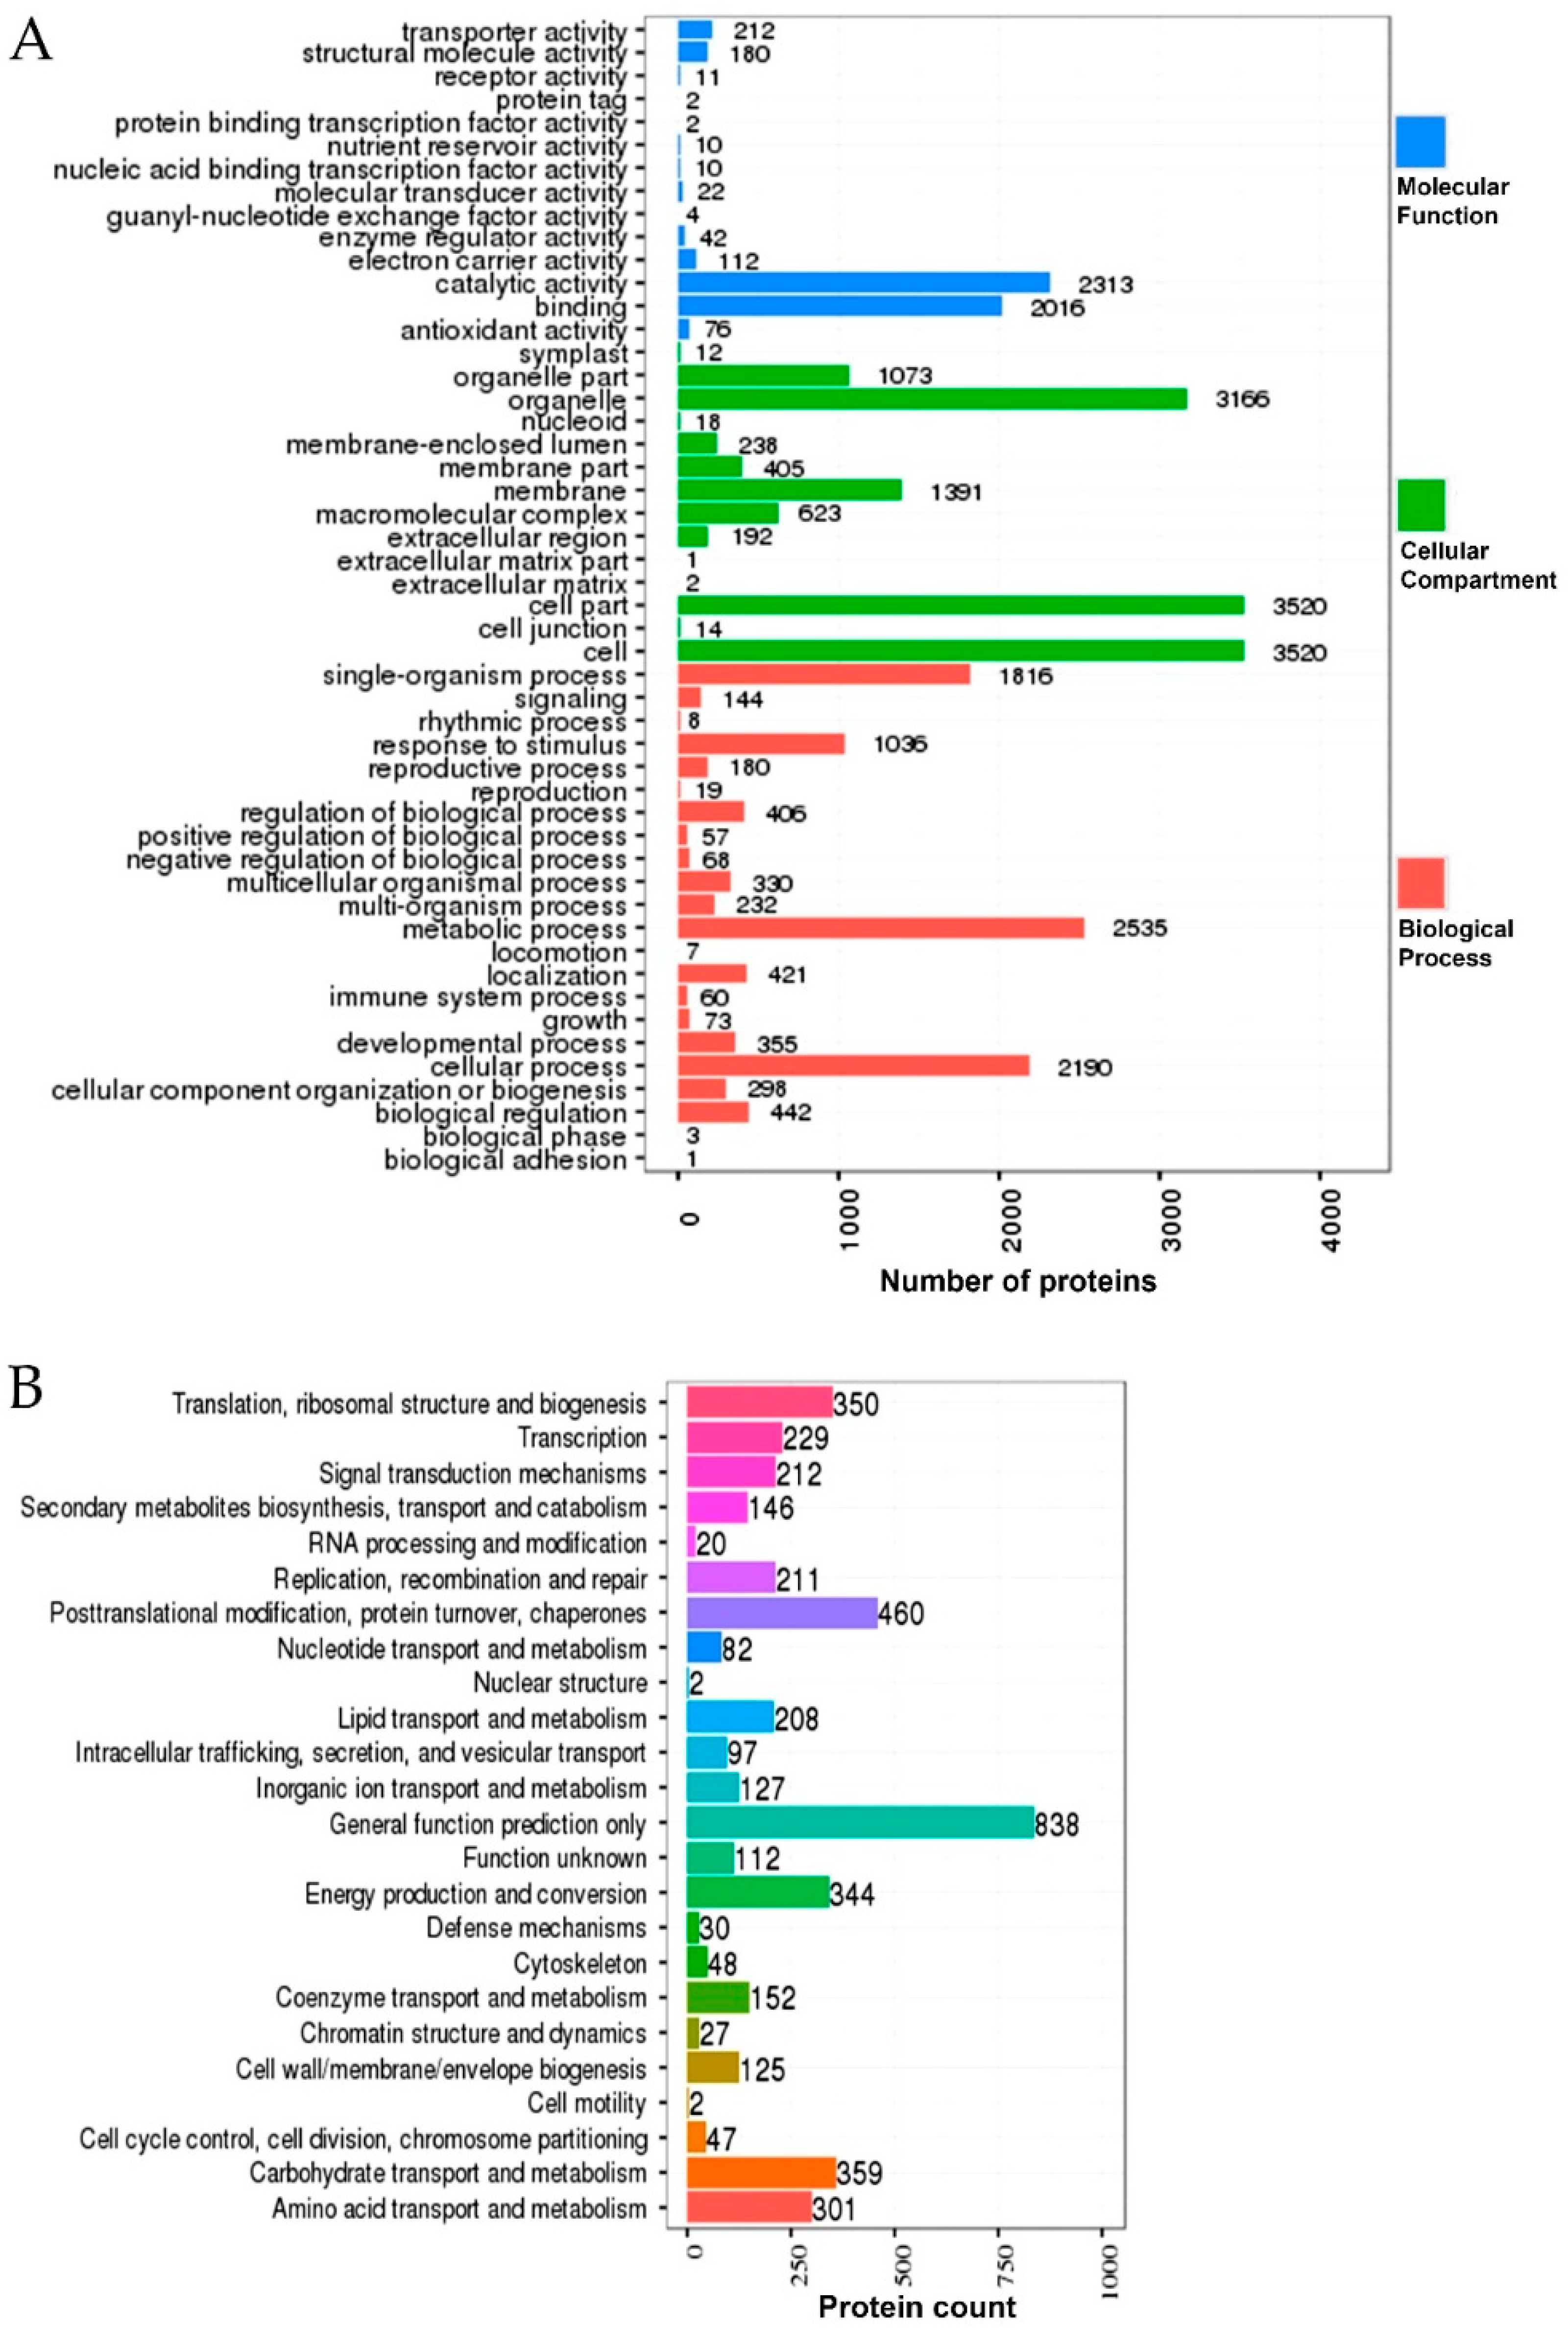
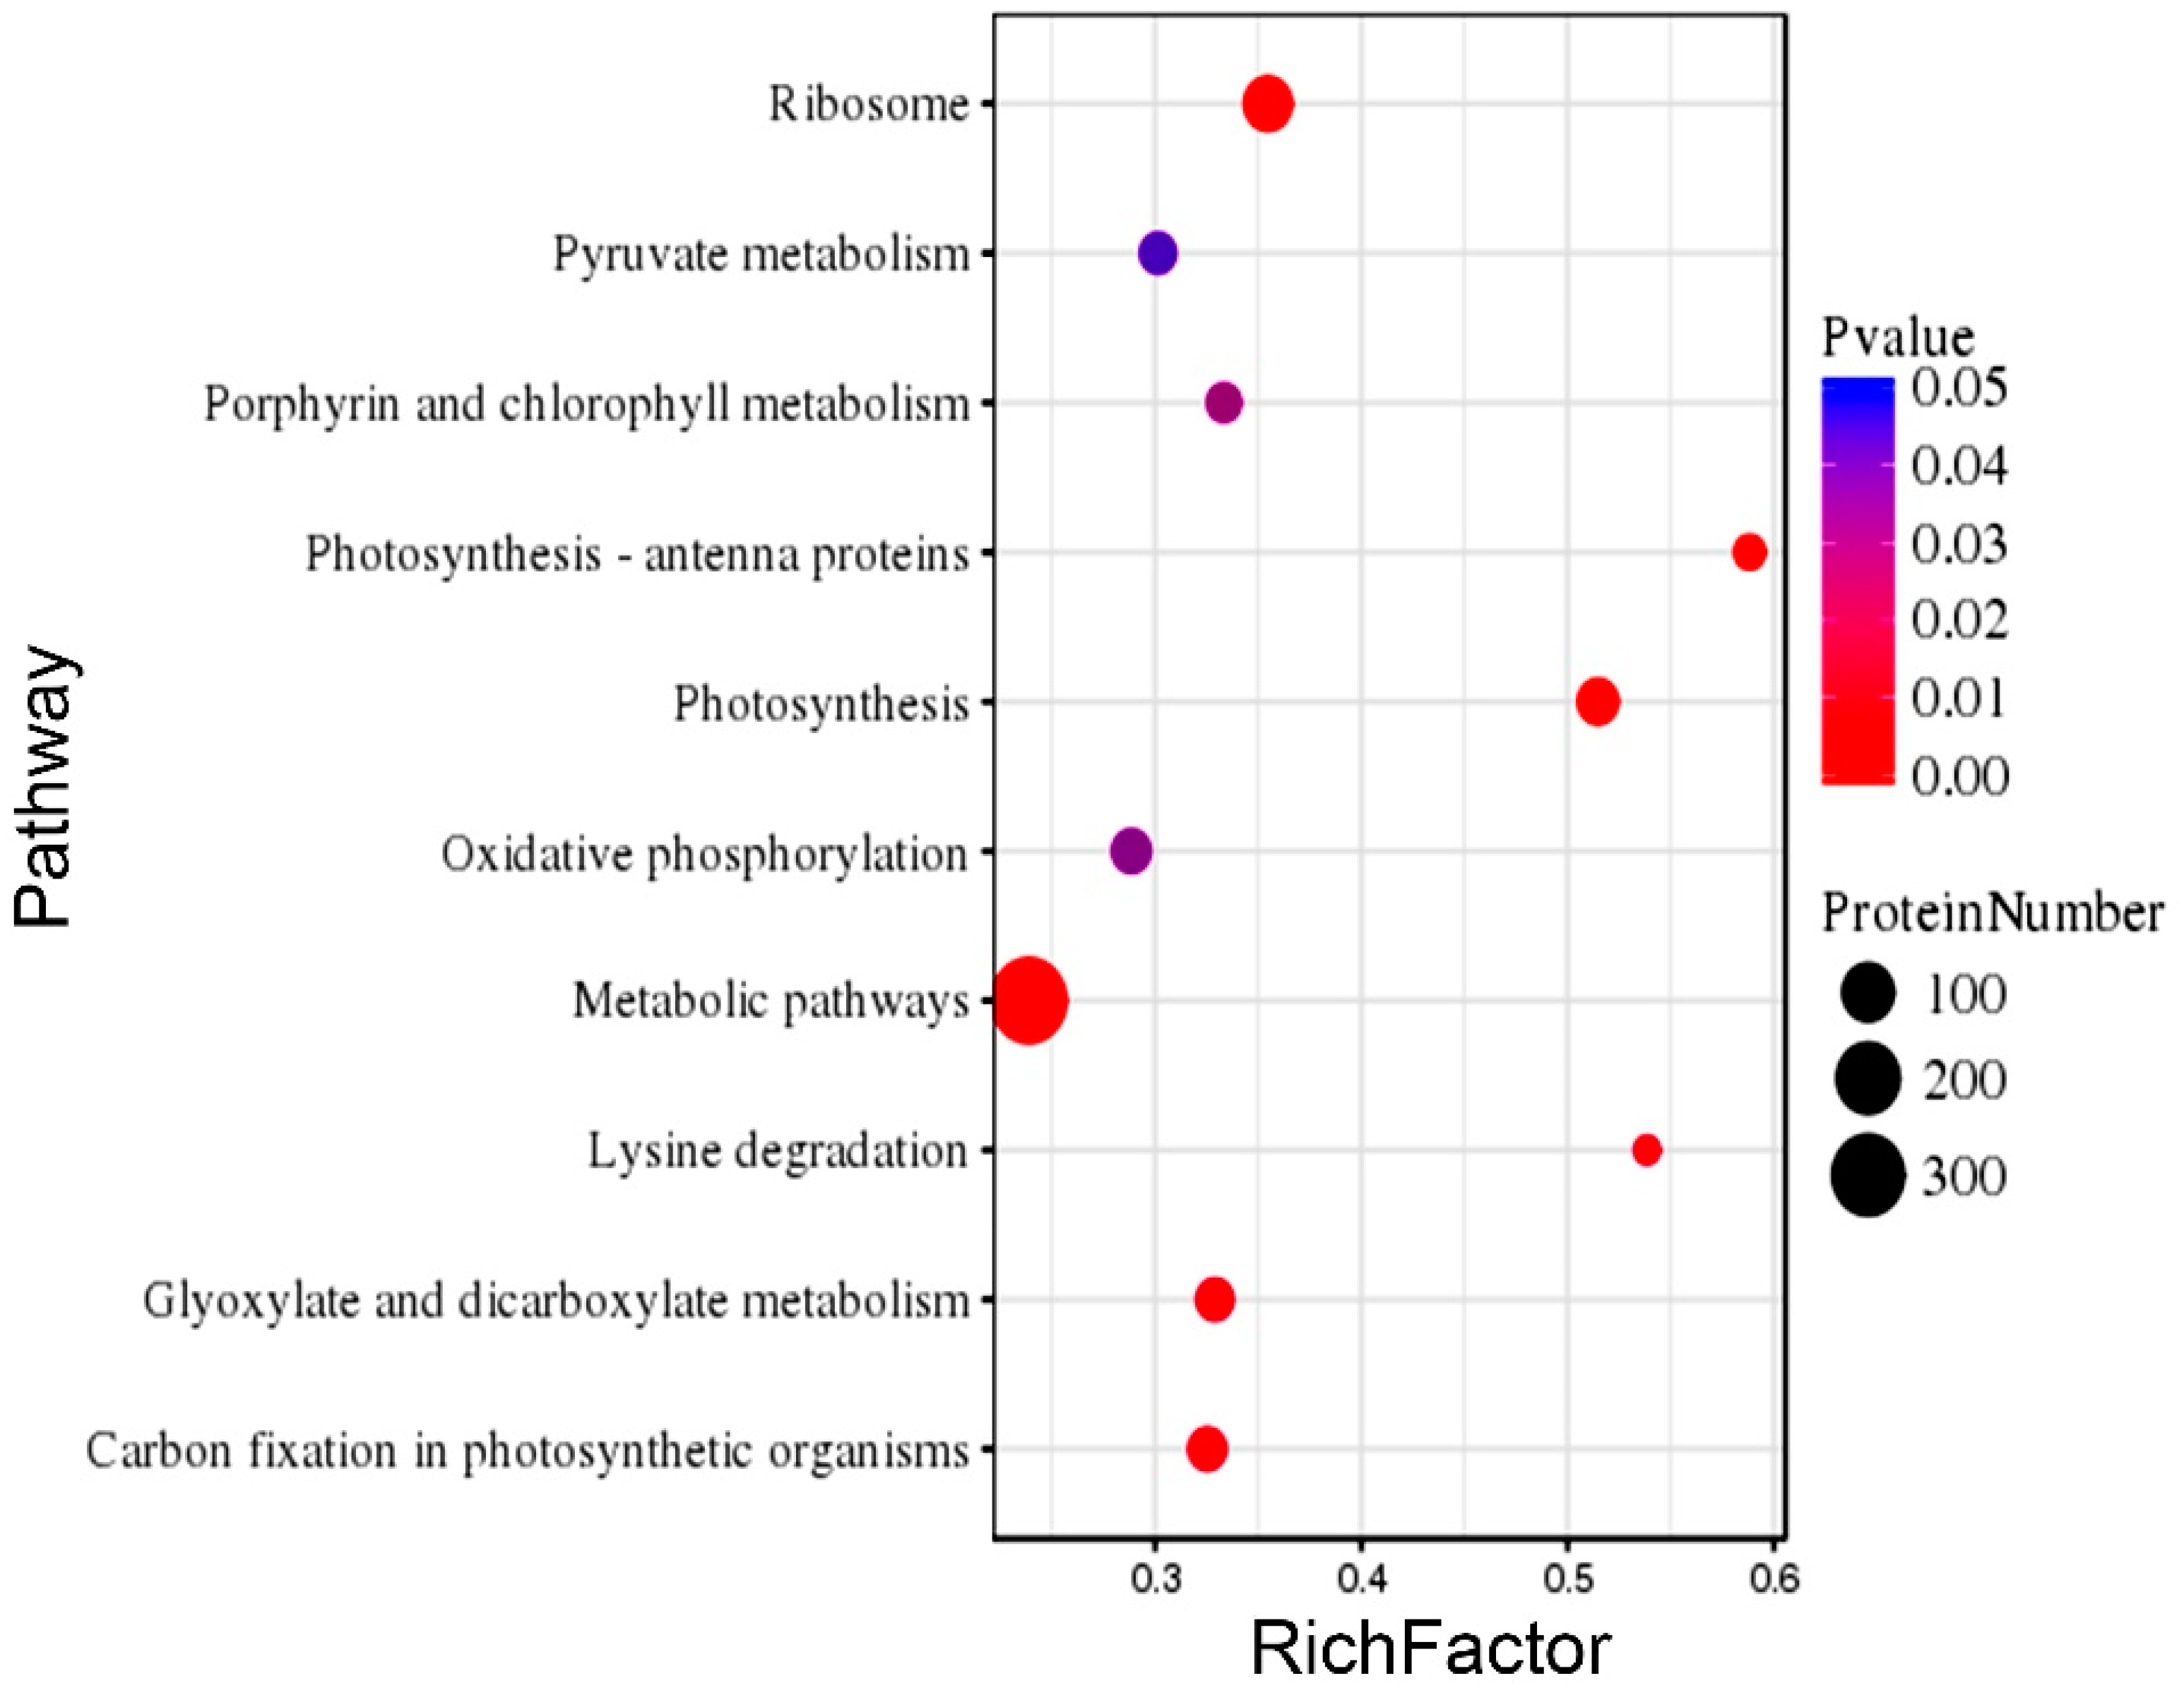
2.7. Gene Ontology (GO) and Kyoto Encyclopedia of Genes and Genomes (KEGG) Enrichment of the DEPs

To deduce the functionality and biological processes associated with the identified DEPs in the rice genotypes, GO analysis, Clusters of Orthologous Group (COG) annotations, and Kyoto Encyclopedia of Genes and Genomes (KEGG) enrichments were performed. The GO analysis revealed that the identified DEPs were associated with different molecular and biological processes (Figure 5A). Most of the identified DEPs in both rice genotypes were involved in cellular and metabolic processes (biological process). At the molecular level, most of the identified DEPs were involved in catalytic activity, binding, transporter and carrier activity, and structural molecule activity. Similarly, at the cellular component level, the identified DEPs were linked to the cell (membrane and cytoplasm) and organelles. In addition to that, COG analysis of the DEPs grouped them into 24 specific categories on the basis of their functional annotations (Figure 5B). Most of the DEPs were clustered in the “general functional prediction only” category, whereas the post-translational modifications, translation, energy production, carbohydrate metabolism, and amino acid metabolism clusters were found to be the other abundant ones. Altogether, these results suggest that, under salt stress in the rice, salt-responsive proteins might be involved in different metabolic and cellular processes and localize in different cell parts and organelles.
In addition, the KEGG enrichment of the identified DEPs in both rice genotypes revealed their functionality as per the associated pathways. The KEGG pathways, including the metabolic pathway, oxidative phospohorylation, photosynthesis, lysine degradation, glyoxylate metabolism, carbon fixation, photosynthesis-antenna proteins, chlorophyll metabolism, pyruvate metabolism, and ribosomes were found to be the top 10 annotated pathways for the DEPs (Figure 6). From these, the metabolic pathways were found to be the primary enriched pathways in both the rice genotypes. Moreover, analysis of the detail of the KEGG enrichments and associated GO terms revealed that DEPs involved in the salt stress response, redox reactions, photosynthesis, and osmotic stress response were the most abundant in the rice genotypes (Figure 7). For instance, in LYP9, 41 salt-responsive proteins were found to be upregulated under various salt levels, whereas 26 upregulated DEPs were found in the NPBA rice. Similarly, 24 DEPs associated with carbohydrate metabolism were found to be upregulated in LYP9 rice, while 16 DEPs involved with carbohydrate metabolism were found to be upregulated in NPBA. The DEPs from both rice genotypes, with their corresponding fold changes as compared to the controls and their associated physiological pathways, are listed in Table 3. In addition, prediction of the subcellular localizations of the identified DEPs in both the rice genotypes revealed that most of the DEPs localize in the cytoplasm and chloroplasts (Figure 8).

3. Discussion

3.1. Biochemical Responses of Rice Plants to Salt Stress

Salt stress is a major concern in agriculture, affecting crop productivity across the world. Nutrient imbalance, due to the competition of Na+ and Cl with other nutrients, including potassium (K+), calcium (Ca2+), and nitrate (NO3−) ions, is a result of salt stress that compromises normal plant growth and development [8,9,10,11,12,32]. In addition, salt stress induces early leave-senescence and a decrease in photosynthesis area [33]. Moreover, osmotic imbalance, poor leaf growth, high CMI, and decreased root activity are associated with the typical salt stress responses in plants [31]. In the current study, the subjection of salt stress negatively affected rice growth in the early stages. All four levels of applied salt stress to both rice cultivars resulted in compromised growth parameters along with CMI. The degree of CMI was found to be higher in NPBA as compared with LYP9, suggesting LYP9 has a higher salt tolerance capacity than NPBA (Figure 1). Further, high rice root activity is usually associated with the interaction of the root with rhizosphere soil and the microbial environment [34], changes in physico-chemical status [35], and plant growth [36]. Further, by enhancing the root activity, plants cope better under an unfavorable environment [34] (Figure 3). In this study, the salt tolerance levels of LYP9 were found to be much higher than those of NPBA at high salt conditions (HS). LYP9 plants could survive by significantly increasing their root activities, whereas none of NPBA plants could survive at the same salt concentrations (Figure 2).

3.2. Proteomic Analysis in the Rice Genotypes Under Salt Stress

Both transcriptomic and proteomic dynamics occurring when subjected to salt stress have already been reported in several plants [37]. Further, the availability of substantial sequential information on rice has paved the way for the use of analytical proteomic studies, including iTRAQ analysis. In this study, iTRAQ-based protein identifications in LYP9 and NPBA cultivars revealed their proteome dynamics in response to salt stress. The comparative analysis of the total of identified proteins (5340) revealed that 93, 782, and 1052 proteins were differentially regulated in LYP9 as compared to the control (CK) under LS, MS, and HS salt stress conditions, respectively. On the other hand, in NPBA, 432 and 722 differentially expressed proteins were found as compared to CK under LS and MS salt stress conditions, respectively (Table 3). These results suggest that the numbers of identified proteins are in direct proportion to the increasing salt stress levels. In addition, the finding of increased numbers of differentially expressed proteins in between LS and MS in both cultivars, and in between LS and MS, and MS and HS in LYP9, further strengthens the proposed proportional relationship between differential protein expression and salt stress levels. Moreover, using the iTRAQ identified protein information, we compared the proteins expressed in LYP9 and NPBA, and thereby the biochemical pathways were identified, including salt stress-responsive protein synthesis, redox responses, photosynthesis, and other metabolic processes. Some of these pathways in response to salt stress have been confirmed in some of the previous studies [38,39]; therefore, the functions of the identified DEPs in this study are discussed further below.
The proteome dynamics and the DEPs in NPBA and LYP9 rice genotypes under different salt stress levels were determined by using iTRAQ analysis. Further, to detect and quantify the proteins in the rice genotypes, the high-resolution LC–MS/MS technique was employed. The identified proteins were quantified on automated software called IQuant [40]. Sequences of the identified DEPs were retrieved from the rice protein database based on the GI numbers, and a blastp algorithm was performed against the GO and KEGG databases. GO annotations of the DEPs were performed over three domains—cellular component, molecular function, and biological process—by using R software packages. Likewise, the COGs were delineated by using a PERL scripted pipeline. The pipeline of the iTRAQ-based protein identification and the subsequent bioinformatic characterizations are represented in Figure 9.

3.2.1. Proteins Related to Salt Stress

The comparative proteomics study of both rice genotypes (LYP9 and NPBA) under salt stress revealed new insights into the salt resistance or sensitive mechanisms in rice. In both the rice genotypes, some of the major salt stress-responsive proteins exhibited differential up regulations as compared to the control, including malate dehydrogenase (gi|115482534), glucanase (gi|13249140), nascent polypeptide-associated complex (NAC) subunit (gi|115450217), methyltransferase (gi|115477769), and chloroplast inorganic pyrophosphatase (gi|46805452) (Table 3). Plant malate dehydrogenase (MDH) (EC 1.1.1.37) is a member of the oxidoreductase group that catalyzes the inter-conversion of malate and oxaloacetate in a redox reaction [24]. Further, MDH has been shown to play a vital role in regulating the salt stress response in plants [41,42]. Likewise, glucanase and inorganic pyrophosphatases have been associated with salt resistance properties in plants [43,44]. NAC has been reported to be involved in the translocation of newly synthesized proteins from the ribosomes to the endoplasmic reticulum during various physiological conditions, by directly interacting with the signal recognition particles. Further, overexpression of SaβNAC from Spartina alterniflora has been reported to enhance the salt tolerance in Arabidopsis [45]. In addition, methylation is often utilized by plants under unfavorable conditions as a strategy for gene regulation, protein sorting, and repairs [46]. IbSIMT1, a methyltransferase gene, has been observed to be activated by salt stress, and confers salinity resistance in sweet potato [47]. On the contrary, DEPs associated with salt stress responses, including glutathione peroxidase (GP) (gi|125540587), fructose-bisphosphate aldolase (FBA) (gi|218196772), pyruvate dehydrogenase (gi|125564321), and triosephosphate isomerase (TPI) (gi|125528336) were found to be significantly upregulated in LYP9, but down regulated in NPBA. Recently, the rice GP gene (OsGPX3) has been reported to play a vital role in regulating the salt stress response [48]. Rice plants with silenced OsGPX3 were found to be highly salt sensitive, confirming the positive role of GP in salinity tolerance. FBA is involved in plant glucose pathways, including glycolysis and gluconeogenesis, and also plays a role in the Calvin cycle [49]. However, the FBA gene has been reported to exhibit induced expressions under salt stress in plants, indicating its role in salt stress. The FBA genes in Arabidopsis and Camellia oleifera were found to be strongly upregulated under salt stress, conferring salinity tolerance [48,50]. Likewise, the transcription of TPI genes has been reported to become active in rice in response to salt stress [51,52]. The upregulated expression of these salt related proteins in the salt-tolerant genotype LYP9, and their down regulation in the salt-sensitive NPBA, suggests that these genotypes possess a different protein pool in response to salinity. Moreover, the difference in salt tolerance between these two rice genotypes might have resulted due to the differential expression of these key proteins. A functional validation study, such as the Western blot or protein interactions, will add further insights to this hypothesis.

3.2.2. Proteins Related to Redox Reactions

Salt stress in plants induces osmotic imbalances, disrupts ion-homeostasis, and triggers oxidative damage, including the generation of reactive oxygen species (ROS) [53,54]. A fitting response to these adversities caused by salinity stress includes physiological and developmental changes, reprograming of salt-induced gene or proteins, and activation of ROS scavenging pathways [55]. In the current study, the proteomic analysis of LYP9 and NBPA revealed that redox reactions and ROS signaling are involved in the salt stress response in rice. Major enzymes involved in ROS signaling and redox reactions, including peroxidases (POD) (gi|125525683), superoxide dismutase (SOD) (gi|125604340), and glutathione s-transferase (GST) (gi|115459582), were found to be highly expressive in LYP9 and NPBA genotypes under the multiple salt stress levels we investigated (Table 3). Under salt stress, the cell membrane-bound peroxidases like NADPH oxidase and the diamine oxidases present in apoplast are activated, leading to generation of ROS [56,57]. In addition, SOD act as the first line of antioxidant defense in plants under multiple stress responses, and confer enhanced tolerance levels to oxidative stress [54]. Similarly, increased levels of GSTs in response to multiple stimuli have been reported in plants to mitigate oxidative stress [58]. Induced expressions and differential regulation of antioxidant enzymes, including PODs, SODs, and GSTs, have been reported by several studies in rice in response to salt stress [59,60]. Furthermore, comparative proteome analysis has confirmed the involvement of ROS and redox related protein in salt stress in plants, including alfalfa [61], searocket [62], maize [63], barley [64], and wheat [65]. Moreover, as many as 56 DEPs annotated with redox reaction functions were identified in both the rice genotypes under the various salt stress levels, suggesting oxidation and reduction reactions might be the key biochemical changes taking place in rice under salinity.

3.2.3. Proteins Related to Photosynthesis

Photosynthesis is a major physiological process accounting for sustainability and energy production in plants. However, salt stress has adverse effects on the plant photosynthesis process by causing a decrease in the leaf cellular CO2 levels [7,66]. Additionally, salinity affects the Rubisco activity, retards chlorophyll synthesis, and destabilizes photosynthetic electron transport [66]. The findings from our study revealed that salt stress in rice affects the expression of the proteins involved in the photosynthesis process. These proteins, including the thylakoid lumenal protein (gi|115477166), psbP domain-containing protein 6 (gi|115440559), psbP-like protein 1 (gi|38636895), ferredoxin-thioredoxin reductase (gi|115447507), photosystem I 9K protein (gi|218186547), photosystem II oxygen-evolving complex protein 2 (gi|164375543), and protochlorophyllide reductase B (gi|75248671), were found to be highly expressed under salt stress conditions (Table 3). Thylakoid luminal protein is required for the functioning of photosystem II (PspB), whereas ferredoxin reductase is a key enzyme that facilitates the conversion of ferredoxin to NADPH in the photosystem I (PSI) complex, and these are also affected by salt stress [67,68]. Moreover, the psbP proteins, thylakoid luminal proteins, and ferredoxin reductase have been reported to be differentially expressed under salt stress [68]. Likewise, differential expression of photosystem proteins was reported in tomatoes in response to salt stress [69]. Similarly, the differential protein expression of protochlorophyllide reductase between the salt stress-induced and control, and its effects on chlorophyll biosynthesis, has been reported in rice [70]. Usually, in salt sensitive plants, salinity causes the down-regulation of photosynthesis proteins, compromising plant sustainability [2,71]. However, the analysis of iTRAQ-based proteomics revealed that the proteins involved in photosynthesis were upregulated in both rice genotypes, which might have aided the rice types to withstand salinity pressures.

3.2.4. Proteins Related to Carbohydrate Metabolism

Apart from being the building blocks in plants, soluble carbohydrates act as osmolytes, and thereby participate in salt tolerance in plants [72]. Besides, the onset of salt stress affects the protein dynamics in plants, resulting in differential protein accumulations [73]. In this study, several carbohydrate metabolism related proteins, including xyloglucan endotransglycosylase/hydrolase protein (XTH) (gi|115475445), β-glucosidase (gi|115454825), and polygalacturonase (gi|115479865), were found to be upregulated in both rice genotypes under various salt stress levels. XTH is known as a cell wall-modifying enzyme, however it also plays a role in salinity resistance responses in plants (Table 3). For instance, the constitutive and heterologous expression of CaXTH3 resulted in increased salt tolerance levels in Arabidopsis and tomato plants [74,75]. Similarly, β-glucosidase is a key enzyme in the cellulose hydrolysis process, and has been reported to be involved in the salt stress response. In barley, the activity of an extracellular β-glucosidase was reported to be highly induced in response to salt stress, and cause abscisic acid-glucose conjugate hydrolysis [76]. Further, the overexpression of Thkel1, a fungal gene that modulates β-glucosidase activity, improved the salt tolerance levels in transgenic Arabidopsis plants [77]. Polygalacturonase, another enzyme capable of hydrolyzing the α-1,4 glycosidic bonds, participates in the salt stress responses in plants. Characterization of the salt stress responses and the associated signal transduction pathways in Arabidopsis revealed the elevated transcript accumulation of a polygalacturonase gene (At1g48100) under salt stress [78]. However, several proteins related to carbohydrate metabolism, including xylanase inhibitor protein (XIP) (gi|297605789, gi|115467998) and MDH (gi|116310134), were found to be downregulated in the NPBA rice, while being upregulated in the LYP9 rice. MDH is a key enzyme in stress responses and actively participate in the tricarboxylic acid (TCA) cycle [74]. In the current study, upregulated expression of MDH was found in LYP9, however down-regulation in NPBA suggests the inhibition of the TCA cycle in the salt sensitive NPBA, but not in the tolerant LYP9 genotype. Further, OsXIP was reported to be induced under various abiotic stresses, including salt stress, and to take part in the rice defense mechanisms against several biotic and abiotic stresses [79]. Moreover, the induced many-fold expression of the carbohydrate metabolism related proteins in LYP9, but their down regulation in NPBA, indicates that carbohydrate metabolism might be a major physiological process that is affected under salinity in rice, and can show the dynamic changes in protein expression depending on the salt tolerance capacity of a genotype.

3.2.5. Proteins Related to Osmotic Stress

Often, salt stress induces the reduction of cellular water potential, causing osmotic stress to the plant. Osmotic stress responses in plants can be very complex in higher plants, including rice [80]. In this study, 11 osmotic stress related proteins were differentially expressed in both rice genotypes under various salt levels, suggesting salt stress in rice leads to the onset of osmotic stress. For instance, a putative lipid transferase protein (gi|297612544) identified as a DEP in both the rice genotypes was found to be upregulated under salt stress. The induced expression of TSW12 and SiLTP, coding the lipid transferase proteins in tomato and foxtail millet plants, has been reported under salt stress [80,81]. Conversely, osmotic stress responsive proteins such as sucrose synthase (gi|125544232) and NADH dehydrogenase (gi|115473055) were found to exhibit an induced response in LYP9 rice under salt stress, but were not significantly induced in the NPBA rice. Sucrose synthase (Sus) is the major enzyme in sucrose metabolism, however it also plays a part in osmotic stress responses in plants. In Arabidopsis, up-regulation of Sus1 has been reported in response to osmotic stresses and water deficit conditions [82]. In addition, involvement of Sus in the osmotic stress response has been reported in Beta vulgaris [83]. On the other hand, NADH dehydrogenase facilitates electron transfer from NADH to the mitochondrial respiratory chain [84]. The up-regulation of NADH dehydrogenase under salt stress indicates an increase in the ATP pool in the LYP9 rice, subsequently aiding in sustainable plant growth and salinity tolerance. However, no induced expression of the same in NPBA suggests that, under salt stress, the ATP pool might decrease, resulting in declining plant growth (Table 3).

3.2.6. Proteins Related to Other Metabolic Processes

Salt stress alters the protein pool that contributes to many metabolic mechanisms, such as stress responses, energy metabolism, and phytohormone synthesis [23,85]. In this study, several DEPs have been identified in the rice genotypes under salt stress, with various physiological and metabolic functions. For instance, putative glucan endo-1,3-β-glucosidase 4 (gi|297607511) was found to be up-regulated in both rice types under salt stress conditions. Similar findings were reported in cotton plants, where the subjected salt stress caused an increased accumulation of glucan endo-1,3-β-glucosidase [23]. Further, the strong induced response of a putative zinc finger protein (gi|28971968) was found under salt stress in both rice genotypes. Induced expression of gene finger proteins has been associated with several stresses, including salt stress. Overexpression of a rice zinc-finger protein OsISAP1 in transgenic tobacco resulted in enhanced abiotic stress tolerance levels, including salinity, dehydration, and cold [86]. Recently, OsZFP213 was reported to interact with OsMPK3, conferring salinity tolerance in rice [87]. In addition, many other proteins with annotated functions or which are uncharacterized were found to be differentially regulated at various salt levels in the rice genotypes. Moreover, these results collectively suggest that salinity affects many physiological processes in rice, irrespective of their salt tolerance levels. Furthermore, the protein pool of a salt tolerant and a salt sensitive rice genotype might differ at a specific point of time, which could be the basic reason of their differential salt tolerance responses (Table 3).

4. Materials and Methods

4.1. Plant Material and Growth Conditions

A pot culture experiment was conducted in a greenhouse at China National Rice Research Institute (39°4′49′′ N, 119°56′11′′ E), Zhejiang Province, China, during the rice growing season (May–November, 2017). Two rice cultivars (origin, China and Japan), Liangyoupiejiu (LYP9, Hybrid, indica) and Nipponbare (NPBA, japonica) were used as the planting materials. Thirty-day old seedlings were transplanted in pots (45 × 30 cm) with different salt stress levels and 23 kg air-dried soil. The experimental soil was loamy clay with an average bulk density of 1.12 g/cm, 4.7% organic matter, 0.0864 dS/m EC, and 5.95 pH. Each pot contained six rice seedlings with three replications.
Sodium chloride (NaCl) was used in each pot to develop artificial salinity in soil until the maximum tillering stage of the rice seeding was reached (about 45 days). The treatments were comprised of four NaCl levels: 0 (control, CK), 1.5 g NaCl/kg dry soil (low salt stress, LS), 4.5 g NaCl/kg dry soil (moderate salt stress, MS), and 7.5 g NaCl/kg dry soil (high salt stress, HS). After salinity development, the corresponding EC for these levels was 0.086 dS/m (CK), 1.089 dS/m (LS), 3.20 dS/m (MS), and 4.64 dS/m (HS).
Nitrogen was applied in the form of urea (N: 46%), phosphorous as superphosphate (P2O5: 12%), and potassium as potassium sulfate (K2O: 54%). Urea was used at the rate of 4.02 g/pot in two splits: 50% was applied as the basal dose, and 50% was applied at the tillering stage. Potassium sulfate (3.08 g/pot) was applied in two equal splits, as a basal dose and at the tillering stage, while the whole amount of superphosphate (6.93 g/pot) was applied as a basal dose.

4.2. Soil and Plant Sampling

Rice flag leaves were collected at the maximum tillering stage and stored at −80 °C after being frozen in liquid nitrogen. Plants were collected for measurement of Na+ and Cl contents in the roots and leaves at the maximum tillering stage. Soil samples were collected at the transplanting stage and at the maximum tillering stage to check the Na+ and Cl contents in the soil. Five flag leaves with three replicates were collected to measure the cell membrane injury in rice leaves at the maximum tillering stage, while root samples were collected to measure the rice root activity. All these experiments were performed with three independent biological replicates.

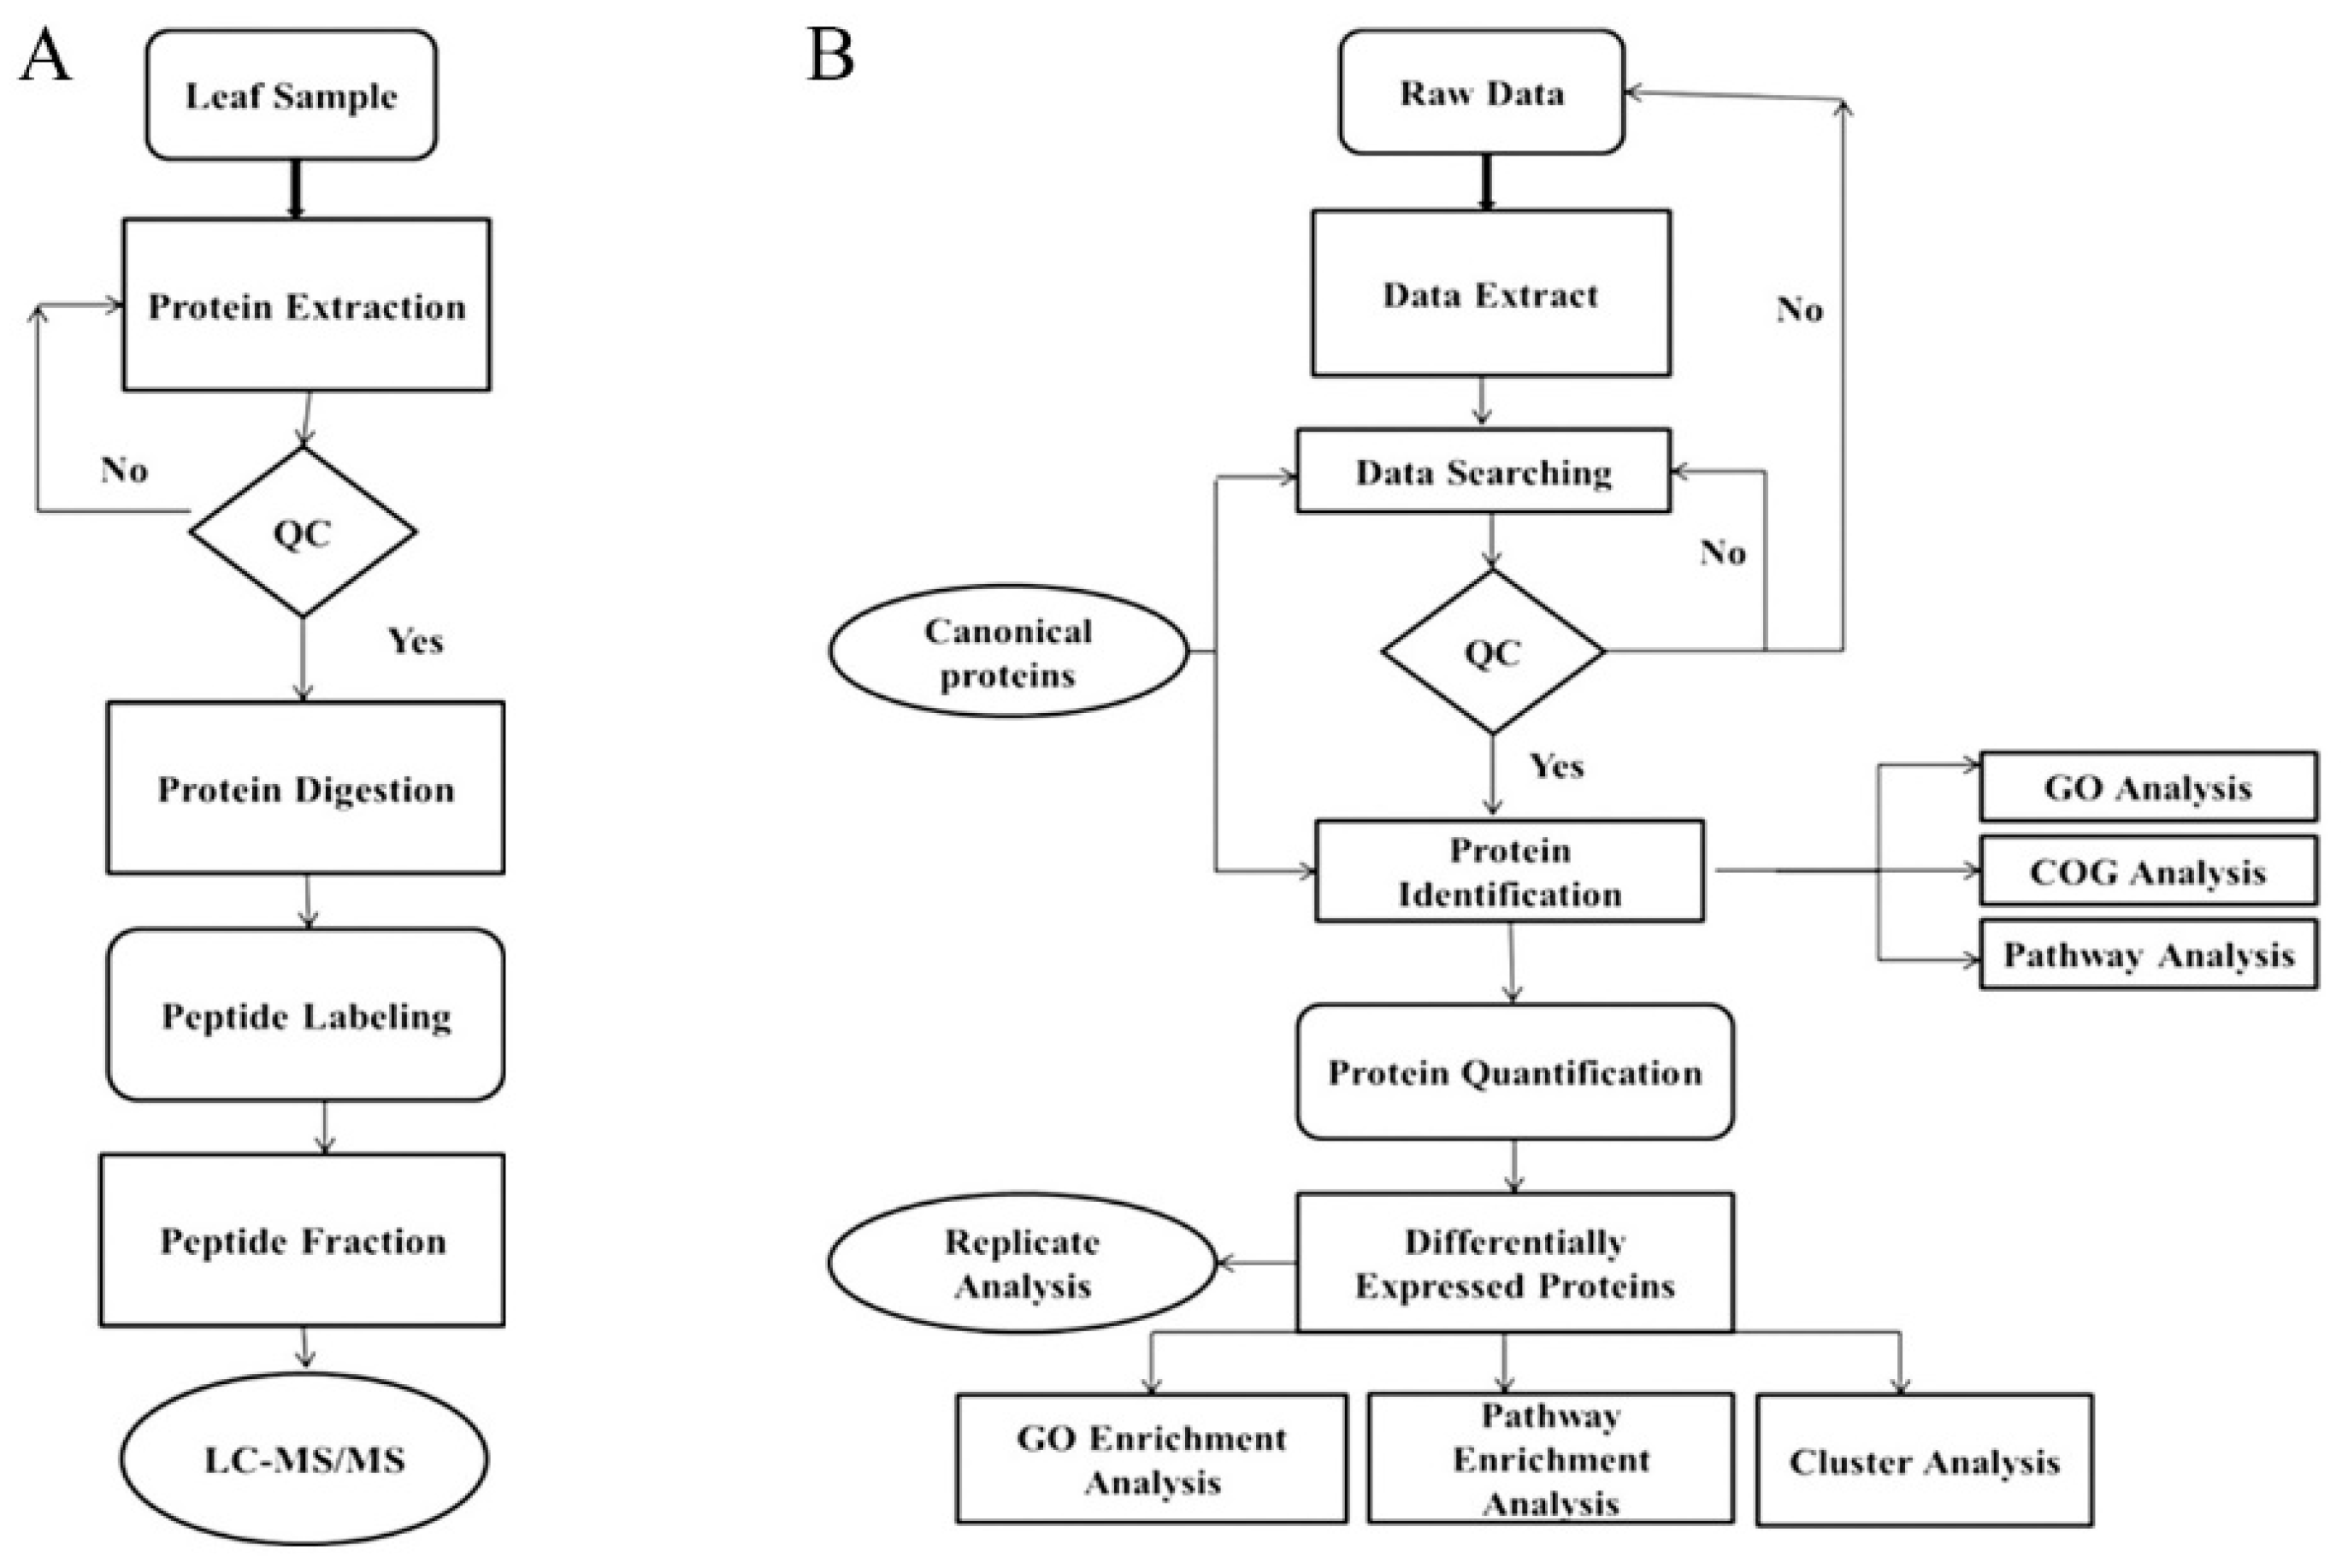
4.3. Leaf Proteomics Analysis Pipeline

4.3.1. Protein Extraction

A total of 1–2 g of plant leaves with 10% PVPP were ground in liquid nitrogen and then sonicated on ice for 5 min in Lysis buffer 3 (8M Urea and 40 mM Tris-HCl containing 1 mM PMSF, 2 mM EDTA, 10 mM DTT, and pH 8.5) with 5 mL of samples. After centrifugation, 5 mL of 10% TCA/acetone with 10 mM DTT were added to the supernatant to precipitate the proteins. The precipitation step was repeated with acetone alone until the supernatant became colorless. The proteins were air dried and re-suspended in Lysis buffer 3. Ultra-sonication on ice for 5 min was used to improve protein dissolution with the help of Lysis buffer 3. After centrifugation, the supernatant was incubated at 56 °C for 1 h for reduction, and then alkylated by 55 mM iodoacetamide (IAM) in the dark at room temperature for 45 min. Acetone (5 mL) were used to precipitate the proteins and stored at –80 °C. The quality and quantity of the isolated proteins were estimated by performing Bradford assay and SDS-PAGE [88].

4.3.2. Digestion of Proteins and Peptide Labeling

About 100 µg of the protein solution with 8 M urea was diluted four times with 100 mM TEAB. For the digestion of the proteins, Trypsin Gold (Promega, Madison, WI, USA) was used at a ratio of trypsin: protein of 40:1, at 37 °C, and was put into the samples overnight. After the digestion with trypsin, Strata X C18 column (Phenomenex, Torrance, CA, USA) were used to desalt the peptides and vacuum-dry them according to the manufacturer’s protocol. For peptide labeling, the peptides were dissolved in 30 µL 0.5 M TEAB. Then, the peptide labeling was performed by an iTRAQ reagent 8-plex kit. The labeled peptides with different reagents were combined and desalted with a Strata X C18 column (Phenomenex), and vacuum-dried.

4.3.3. Peptide Fractionation and HPLC

The peptide fractionations were performed by using a Shimadzu LC-20AB HPLC pump attached to a high pH RP column. About 2 mL of the reassembled peptides with buffer A (5% ACN, 95% H2O, pH 9.8) was loaded on a 5 μm particulate column (Phenomenex). The flow rate was adjusted to 1 mL/min with a 5% buffer B (5% H2O, 95% ACN, pH 9.8) gradient for 10 min, with 5–35% buffer B for 40 min, and with 35–95% buffer B for 1 min, to separate the peptides. An incubation of 3 min in 95% buffer B, and for 1 min in 5% buffer B, followed this, before the final equilibration with 5% buffer B. Each peptide fraction was collected at 1 min time intervals, and OD of the eluted fractions were measured at 214 nm. Twenty fractions were pooled together and vacuum dried. Post drying, the fractions were re-suspended in buffer A solution (2% CAN; 0.1% FA in water) individually and centrifuged. Then, the supernatant was collected and loaded onto a C18 trap column with a rate of 5 μL/min by using a LC-20AD nano-HPLC device (Shimadzu, Kyoto, Japan). Peptide elutions were performed afterwards and separated by using an analytical C18 column with an inner diameter of 75 μm. The gradients were run at 300 nL/min starting from 8 to 35% of buffer B (2% H2O; 0.1% FA in ACN) for 35 min, with an increase up to 60% in 5 min, then were maintained at 80% buffer B for 5 min before returning to 5% in 6 s, with a final equilibration period of 10 min.

4.3.4. Mass Spectrometer Detection

The spectrometric data were acquired using a TripleTOF 5600 System (SCIEX, Framingham, MA, USA) fit to a Nano-Spray III source (SCIEX, Framingham, MA, USA) and a pulled quartz tip-type emitter (New Objectives, Woburn, MA, USA), which was controlled with the franchise software Analyst v1.6 (AB-SCIEX, Concord, ON, Canada). The MS data procurements were undertaken as per the following conditions: the ion spray voltage was set to 2300 V, the curtain gas was set to 30, the nebulizer gas was set to 15, and the interface heater temperature was 150 °C. High sensitivity mode was used for the whole data acquisition process. The MS1 accumulation time was set to 250 ms, while 350–1500 Da was the allowed mass range. At least 30 product ion scans were collected based on the MS1 survey intensity, exceeding a threshold of 120 counts/s and a 2+ to 5+ charge-state. A value of ½ peak width was set for the dynamic exclusion. The collision energy was adjusted to all precursor ions for the collision-induced dissociation for the iTRAQ data acquisition, and the Q2 transmission window for 100 Da was at 100%. Three independent biological replicates were included for each sample in the experiment.

4.4. Cell Membrane Injury

Cell membrane injury (CMI) was determined by using flag leaves. Twenty pieces (1 cm diameter) were cut from these flag leaves, and were submerged into 20 mL distilled water (DI) contained in test tubes. The test tubes were kept at 10 °C in an incubator for 24 h. After 24 h, the samples were kept at 25 °C to warm the samples, and the electrical conductivity (C1) of the samples was measured. These samples were then autoclaved for 20 min at 120 °C and the electrical conductivity (C2) was determined again. Cellular injury was determined by using the following formula [89]:
C e l l m e m b r a n e i n j u r y = C 1 C 2 × 100
where, ‘C’ refers to EC 1 and 2. The experiment was performed with three independent biological replicates.

4.5. Rice Root Activity

Rice root activity was analyzed by the triphenyl tetrazolium chloride (TTC) method [90]. Briefly, rice root samples (0.5 g, root tips) were taken, and 5 mL of the phosphate buffer (pH 7) and 5 mL 0.4% TTC (Vitastain, C19H15N4Cl) were added to keep the root activity alive. The samples were kept in an incubator in the dark at 37 °C for 3 h. After 3 h, the samples were taken out and 1 mL 1 mol/L H2SO4 was added to stop the reaction. The rice roots were then removed from the test tubes. These root samples were ground by adding a pinch of silica sand, and mixed with 8 mL ethyle acetate. The extract was transferred to test tubes and a 10 mL final volume was reached by adding ethylene acetate. These samples were analyzed using a spectrophotometer (UV-2600, UV-VIS Spectrophotometer Shimadzu) at 485 nm. The formula used for calculation of root activity is as follows:
R o o t A c t i v t y = C W / 3
where C is the concentration of the samples calculated from a standard curve. W is the weight of the root samples. The experiment was performed with three independent biological replicates.

4.6. Na+ Concentration in the Soil and Plants

Na+ was extracted from the soil by ammonium acetate solution using Rihards (1954) method [91]. About 5 g ground (particle size ≤ 2mm) air dried soil was placed in 250 mL plastic bottles and 50 mL ammonium acetate (NH4OAc, 1 mol/L) was added. These bottles were kept on a shaker for 30 min at 120 rpm. After that, the samples were filtered by using filter paper to obtain the soil solution.
Na+ in the plants’ parts was extracted by digestion with sulfuric acid (H2SO4) by following Rihards (1954) method [91] with the necessary modifications. About 0.3 g ground (particle size ≤ 2 mm) root and leaf were taken in 50 mL glass tubes and mixed with 5 mL H2SO4. These glass bottles were kept overnight. The samples were put into the fume hood and were incubated at 320 °C for 2 h. After 2 h, hydrogen peroxide solution (H2O2) was added drop by drop and the samples were mixed until a whitish or transparent color appeared. Then, the samples were cooled at room temperature before being filtered by using filter paper to get the plant part extracts.
The soil and plant extracts were used to measure the sodium ions (Na+) by using a flame photometer. The standards used were 0, 2, 4, 6, 8, 10, 15, and 20 mL NaCl. The final soluble sodium (Na) in soil was measured by using the formula:
Na ( μ g g ) = A × C W
where A is the total volume of the extract (mL), C is the sodium concentration values given by the flame-photometer (µg/mL), and W is the weight of the air dried soil (g). The experiment was performed with three independent biological replicates.

4.7. Cl Concentration in the Soil and Plants

About 10 g air dried soil (particle size ≤ 2mm) was placed in 250 mL plastic bottles and mixed with 50 mL deionized water. These bottles were transferred onto a shaker and were shaken for 5 min at 180 rpm. The samples were then filtered by using filter paper to obtain the soil solution extract for Cl.
Plant samples weighing approximately 0.1 g were placed in 50 mL glass tubes and mixed with 15 mL deionized water. The tubes were transferred into a hot water bath and kept for 1.5 h. The samples were then diluted with 25 mL deionized water after cooling at room temperature.
The soil and plant extracts were used to measure the chloride (Cl) by using a chloride assay kit (QuantiChromTM Chloride Assay Kit, 3191 Corporate Place Hayward, CA 94545, USA) following the manufacturer’s instructions. The standards used were 0, 10, 20, 30, 40, 60, 80, and 100 mL. The final chloride concentration in the solution was measured by the formula:
Chloride = ODsample ODblank Slop × n ( mg dL )
where ODsample is the OD 610 nm values of the samples, and ODblank is the OD 610 nm values of the blanks (water). The experiment was performed with three independent biological replicates.

4.8. Statistical Analysis

The statistical software package IBS SPSS Statistics 19.0 was used for the analyses of data. For evaluating the statistical significance of the biochemical parameters, a one-way ANOVA was employed with LSD at the level of p = 0.05. For the iTRAQ-based protein quantification, all identified DEPs were required to satisfy the t-test at p ≤ 0.05, and with a fold change ratio of >1.2 or <0.8.

5. Conclusions

Using comparative iTRAQ-based protein quantification, the proteome dynamics of LYP9 and NPBA rice were explored in this study. The results from the study suggest that rice cell membrane integrity was inversely correlated and root activity was positively correlated with the concentration of salinity. Furthermore, the physiological processes, including carbohydrate metabolism, redox reactions, and photosynthesis, made significant contributions towards the salt tolerance in rice. The number of differentially expressed proteins—salt responsive proteins in particular—suggested that the protein pool in response to salt stress is different in a salt tolerant compared to a susceptible rice genotype. Finally, the indica rice LYP9 showed promising results under the subjected salt stress levels, and can be selected over the japonica NPBA for salt tolerance. Further works deciphering the functions of some particular proteins of interest will add new insights into their roles in salt tolerance in rice.

Author Contributions

S.H. (Sajid Hussain), J.Z., and Q.J. conceived and designed research. S.H. (Sajid Hussain), J.Z., and Q.J. conducted experiments. J.H., X.C., Z.B., and L.Z. contributed analytical tools. S.H. and C.Z. analyzed the data. S.H. (Sajid Hussain), S.N., and C.Z. wrote the manuscript. S.N., S.H. (Saddam Hussain), and A.R. revised the manuscript. Q.L., L.W., and Y.L. help in formal analysis. The manuscript has been read and approved by all authors.

Funding

This work was supported by the National Key Research and Development Program of China (2016YFD0200801), and the Natural Science Foundation of China (31872857, 31771733).

Conflicts of Interest

The authors declare no conflict of interest exists.

Abbreviations

LYP9Liangyoupeijiu
NPBANipponbare
iTRAQIsobaric tags for relative and absolute quantitation
CMICell membrane injury
RRARice root activity
DEPsDifferentially expressed proteins
GOGene ontology
KEGG Kyoto encyclopedia of genes and genomes
PSI Photosystem I
LSLow salt stress
MSModerate salt stress
HSHigh salt stress
COGCluster of orthologous groups

References

  1. Yamori, W.; Hikosaka, K.; Way, D.A. Temperature response of photosynthesis in C3, C4, and CAM plants: Temperature acclimation and temperature adaptation. Photosynth. Res. 2013, 119, 101–117. [Google Scholar] [CrossRef] [PubMed]
  2. UNFPA. Linking Population, Poverty and Development. 2014. Available online: http://www.unfpa.org/pds/trends.htm (accessed on 28 January 2019).
  3. Ray, D.K.; Mueller, N.D.; West, P.C.; Foley, J.A. Yield trends are insufficient to double global crop production by 2050. PLoS ONE 2013, 8, e66428. [Google Scholar] [CrossRef] [PubMed]
  4. Nachimuthu, V.V.; Sabariappan, R.; Muthurajan, R.; Kumar, A. Breeding Rice Varieties for Abiotic Stress Tolerance: Challenges and Opportunities; Springer: Singapore, 2017. [Google Scholar]
  5. Pushpam, R.; Rangasamy, S.R.S. In vivo response of rice cultivars to salt stress. J. Ecol. 2002, 14, 177–182. [Google Scholar]
  6. Joseph, B.; Jini, D.; Sujatha, S. Biological and Physiological Perspectives of Specificity in Abiotic Salt Stress Response from Various Rice Plants. Asian J. Agric. Sci. 2010, 2, 99–105. [Google Scholar]
  7. Hussain, S.; Chu, Z.; Zhigang, B.; Xiaochuang, C.; Lianfeng, Z.; Azhar, H.; Chunquan, Z.; Shah, F.; Allen, B.J.; Junhua, Z.; et al. Effects of 1-Methylcyclopropene on Rice Growth Characteristics and Superior and Inferior Spikelet Development Under Salt Stress. J. Plant Growth Regul. 2018, 37, 1368–1384. [Google Scholar] [CrossRef]
  8. Islam, T.; Manna, M.; Reddy, M.K. Glutathione peroxidase of Pennisetum glaucum (PgGPx) is a functional Cd21 dependent peroxiredoxin that enhances tolerance against salinity and drought stress. PLoS ONE 2015, 10, e0143344. [Google Scholar] [CrossRef] [PubMed]
  9. Islam, F.; Yasmeen, T.; Ali, S.; Ali, B.; Farooq, M.A.; Gill, R.A. Priming-induced antioxidative responses in two wheat cultivars under saline stress. Acta Physiol. Plant. 2015, 37, 153–161. [Google Scholar] [CrossRef]
  10. Islam, F.; Yasmeen, T.; Arif, M.S.; Ali, S.; Ali, B.; Hameed, S.; Zhou, W. Plant growth promoting bacteria confer salt tolerance in Vigna radiata by up-regulating antioxidant defense and biological soil fertility. Plant Growth Regul. 2016, 80, 23–36. [Google Scholar] [CrossRef]
  11. Islam, F.; Ali, B.; Wang, J.; Farooq, M.A.; Gill, R.A.; Ali, S.; Wang, D.; Zhou, W. Combined herbicide and saline stress differentially modulates hormonal regulation and antioxidant defense system in Oryza sativa cultivars. Plant Physiol. Biochem. 2016, 107, 82–95. [Google Scholar] [CrossRef] [PubMed]
  12. Naeem, M.S.; Jin, Z.L.; Wan, G.L.; Liu, D.; Liu, H.B.; Yoneyama, K.; Zhou, W.J. 5-Aminolevulinic acid improves photosynthetic gas exchange capacity and ion uptake under salinity stress in oilseed rape (Brassica napus L.). Plant Soil 2010, 332, 405–415. [Google Scholar] [CrossRef]
  13. Hussain, S.; Xiaochuang, C.; Chu, Z.; Lianfeng, Z.; Maqsood, A.K.; Sajid, F.; Junhua, Z.; Qianyu, J. Sodium chloride stress during early growth stages altered physiological and growth characteristics of rice. Chil. J. Agric. Res. 2018, 78, 183–197. [Google Scholar] [CrossRef]
  14. Islam, F.; Ali, S.; Farooq, M.A.; Wang, J.; Gill, R.A.; Zhu, J.; Ali, B.; Zhou, W. Butachlor-induced alterations in ultrastructure, antioxidant, and stress-responsive gene regulations in rice cultivars. Clean—Soil Air Water 2017, 45, 1500851. [Google Scholar] [CrossRef]
  15. Islam, F.; Farooq, M.A.; Gill, R.A.; Wang, J.; Yang, C.; Ali, B.; Wang, G.X.; Zhou, W. 2,4-D attenuates salinity-induced toxicity by mediating anatomical changes, antioxidant capacity and cation transporters in the roots of rice cultivars. Sci. Rep. 2017, 7, 10443. [Google Scholar] [CrossRef] [PubMed]
  16. Cui, P.; Liu, H.; Islam, F.; Li, L.; Farooq, M.A.; Ruan, S.; Zhou, W. OsPEX11, a peroxisomal biogenesis factor 11, contributes to salt stress tolerance in Oryza sativa. Front. Plant Sci. 2016, 7, 1357. [Google Scholar] [CrossRef] [PubMed]
  17. Shafi, A.; Chauhan, R.; Gill, T.; Swarnkar, M.K.; Sreenivasulu, Y.; Kumar, S.; Kumar, N.; Shankar, R.; Ahuja, P.S.; Singh, A.K. Expression of SOD and APX genes positively regulates secondary cell wall biosynthesis and promotes plant growth and yield in Arabidopsis under salt stress. Plant Mol. Biol. 2015, 87, 615–631. [Google Scholar] [CrossRef]
  18. Biswas, M.S.; Mano, J.I. Lipid peroxide-derived short-chain carbonyls mediate hydrogen peroxide induced and salt-induced programmed cell death in plants. Plant Physiol. 2015, 168, 885–898. [Google Scholar] [CrossRef]
  19. Ali, I.; Liu, B.; Farooq, M.A.; Islam, F.; Azizullah, A.; Yu, C.; Su, W.; Gan, Y. Toxicological effects of bisphenol A on growth and antioxidant defense system in Oryza sativa as revealed by ultrastructure analysis. Ecotoxicol. Environ. Saf. 2016, 124, 277–284. [Google Scholar] [CrossRef]
  20. Ali, I.; Jan, M.; Wakeel, A.; Azizullah, A.; Liu, B.; Islam, F.; Ali, A.; Daud, M.K.; Liu, Y.; Gan, Y. Biochemical responses and ultrastructural changes in ethylene insensitive mutants of Arabidopsis thialiana subjected to bisphenol A exposure. Ecotoxicol. Environ. Saf. 2017, 144, 62–71. [Google Scholar] [CrossRef]
  21. Li, H.; Chang, J.; Chen, H.; Wang, Z.; Gu, X.; Wei, C.; Zhang, Y.; Ma, J.; Yang, J.; Zhang, X. Exogenous Melatonin Confers Salt Stress Tolerance to Watermelon by Improving Photosynthesis and Redox Homeostasis. Front. Plant Sci. 2017, 8, 295. [Google Scholar] [CrossRef]
  22. Khare, T.; Kumar, V.; Kishor, P.K. Na+ and Cl- ions show additive effects under NaCl stress on induction of oxidative stress and the responsive antioxidative defense in rice. Protoplasma 2015, 252, 1149–1165. [Google Scholar] [CrossRef]
  23. Li, W.; Zhao, F.; Fang, W.; Xie, D.; Hou, J.; Yang, X.; Zhao, Y.; Tang, Z.; Nie, L.; Lv, S. Identification of early salt stress responsive proteins in seedling roots of upland cotton (Gossypium hirsutum L.) employing iTRAQ-based proteomic technique. Front. Plant Sci. 2015, 6, 732. [Google Scholar] [CrossRef] [PubMed]
  24. Wang, Z.Q.; Xu, X.Y.; Gong, Q.Q.; Xie, C.; Fan, W.; Yang, J.L.; Lin, Q.S.; Zheng, S.J. Root proteome of rice studied by iTRAQ provides integrated insight into aluminum stress tolerance mechanisms in plants. J. Proteom. 2014, 98, 189–205. [Google Scholar] [CrossRef] [PubMed]
  25. Hu, X.; Li, N.; Wu, L.; Li, C.; Li, C.; Zhang, L.; Liu, T.; Wang, W. Quantitative iTRAQ-based proteomic analysis of phosphoproteins and ABA regulated phosphoproteins in maize leaves under osmotic stress. Sci. Rep. 2015, 27, 15626. [Google Scholar] [CrossRef] [PubMed]
  26. Guo, G.; Ge, P.; Ma, C.; Li, X.; Lv, D.; Wang, S.; Ma, W.; Yan, Y. Comparative proteomic analysis of salt response proteins in seedling roots of two wheat varieties. J. Proteom. 2012, 75, 1867–1885. [Google Scholar] [CrossRef] [PubMed]
  27. Gong, B.; Zhang, C.; Li, X.; Wen, D.; Wang, S.; Shi, Q.; Wang, X. Identification of NaCl and NaHCO3 stress-responsive proteins in tomato roots using iTRAQ-based analysis. Biochem. Biophys. Res. Commun. 2014, 446, 417–422. [Google Scholar] [CrossRef] [PubMed]
  28. Kim, D.W.; Rakwal, R.; Agrawal, G.K.; Jung, Y.H.; Shibato, J.; Jwa, N.S.; Iwahashi, Y.; Iwahashi, H.; Kim, D.H.; Shim, I.S.; et al. A hydroponic rice seedling culture model system for investigating proteome of salt stress in rice leaf. Electrophoresis 2005, 26, 4521–4539. [Google Scholar] [CrossRef] [PubMed]
  29. Dooki, A.D.; Mayer-Posner, F.J.; Askari, H.; Zaiee, A.; Salekdeh, G.H. Proteomic responses of rice young panicles to salinity. Proteomics 2006, 6, 6498–6507. [Google Scholar] [CrossRef] [Green Version]
  30. Lee, D.G.; Kee, W.P.; Jae, Y.A.; Young, G.S.; Jung, K.H.; Hak, Y.K.; Dong, W.B.; Kyung, H.L.; Nam, J.K.; Byung-Hyun, L.; et al. Proteomics analysis of salt-induced leaf proteins in two rice germplasms with different salt sensitivity. Can. J. Plant Sci. 2011, 91, 337–349. [Google Scholar] [CrossRef]
  31. Zhang, X.; Huang, G.; Bian, X.; Zhao, Q. Effects of root interaction and nitrogen fertilization on the chlorophyll content, root activity, photosynthetic characteristics of intercropped soybean and microbial quantity in the rhizosphere. Plant Soil Environ. 2013, 59, 80–88. [Google Scholar] [CrossRef] [Green Version]
  32. Reddy, I.N.B.L.; Kim, S.M.; Kim, B.K.; Yoon, I.S.; Kwon, T.R. Identification of rice accessions associated with K1/Na1 ratio and salt tolerance based on physiological and molecular responses. Rice Sci. 2017, 24, 36–364. [Google Scholar] [CrossRef]
  33. Amirjani, M.R. Effect of salinity stress on growth, sugar content, pigments and enzyme activity of rice. Int. J. Bot. 2011, 7, 73–81. [Google Scholar] [CrossRef]
  34. Hinsinger, P.; Betencourt, E.; Bernard, L.; Brauman, A.; Plassard, C.; Shen, J.; Tang, X.; Zhang, F. P for two, sharing a scarce resource: Soil phosphorus acquisition in the rhizosphere of intercropped species. Plant Physiol. 2011, 156, 1078–1086. [Google Scholar] [CrossRef] [PubMed]
  35. Song, Y.N.; Zhang, F.S.; Marschner, P.; Fan, F.L.; Gao, H.M.; Bao, X.G.; Sun, J.H.; Li, L. Effect of intercropping on crop yield and chemical and microbiological properties in rhizosphere of wheat (Triticum aestivum L.), maize (Zea mays L.), and faba bean (Vicia faba L.). Biol. Fertil. Soils 2007, 43, 565–574. [Google Scholar] [CrossRef]
  36. Zhang, N.N.; Sun, Y.M.; Li, L.; Wang, E.T.; Chen, W.X.; Yuan, H.L. Effects of intercropping and Rhizobium inoculation on yield and rhizosphere bacterial community of faba bean (Vicia faba L.). Biol. Fertil. Soils 2010, 46, 625–639. [Google Scholar] [CrossRef]
  37. Salekdeh, G.H.; Siopongco, J.; Wade, L.J.; Ghareyazie, B.; Bennett, J. A proteomic approach to analyzing drough and salt responsiveness in rice. Field Crop Res. 2002, 76, 199–219. [Google Scholar] [CrossRef]
  38. Jiang, Q.; Xiaojuan, L.; Fengjuan, N.; Xianjun, S.; Zheng, H.; Hui, Z. iTRAQ-based quantitative proteomic analysis of wheat roots in response to salt stress. Proteomics 2017, 17, 1600265. [Google Scholar] [CrossRef]
  39. Abbasi, F.M.; Komatsu, S. A proteomic approach to analyze salt-responsive proteins in rice leaf sheath. Proteomics 2004, 4, 2072–2081. [Google Scholar] [CrossRef]
  40. Wen, B.; Zhou, R.; Feng, Q.; Wang, Q.; Wang, J.; Liu, S. IQuant: An automated pipeline for quantitative proteomics based upon isobaric tags. Proteomics 2014, 14, 2280–2285. [Google Scholar] [CrossRef]
  41. Eprintsev, A.T.; Fedorina, O.S.; Bessmeltseva, Y.S. Response of the Malate Dehydrogenase System of Maize Mesophyll and Bundle Sheath to Salt Stress. Russ. J. Plant Physiol. 2011, 58, 448–453. [Google Scholar] [CrossRef]
  42. Zhang, J.; Jia, W.; Yang, J.; Ismail, A.M. Role of ABA in integrating plant responses to drought and salt stresses. Field Crops Res. 2006, 97, 111–119. [Google Scholar] [CrossRef]
  43. Su, Y.; Wang, Z.; Liu, F.; Li, Z.; Peng, Q.; Guo, J.; Xu, Q.Y. Isolation and Characterization of ScGluD2, a New Sugarcane beta-1,3-Glucanase D Family Gene Induced by Sporisorium scitamineum, ABA, H2O2, NaCl, and CdCl2 Stresses. Front. Plant Sci. 2016, 7, 1348. [Google Scholar] [CrossRef] [PubMed]
  44. He, R.; Yu, G.; Han, X.; Han, J.; Li, W.; Wang, B.; Huang, S.; Cheng, X. ThPP1 gene, encodes an inorganic pyrophosphatase in Thellungiella halophila, enhanced the tolerance of the transgenic rice to alkali stress. Plant Cell Rep. 2017, 36, 1929. [Google Scholar] [CrossRef] [PubMed]
  45. Karan, R.; Prasanta, K.S. Overexpression of a nascent polypeptide associated complex gene (SabNAC) of Spartina alterniflora improves tolerance to salinity and drought in transgenic Arabidopsis. Bioch. Biophys. Res. Commun. 2012, 424, 747–752. [Google Scholar] [CrossRef] [PubMed]
  46. Singh, S.; Singh, C.; Tripathi, A.K. A SAM-dependent methyltransferase cotranscribed with arsenate reductase alters resistance to peptidyl transferase center-binding antibiotics in Azospirillum brasilense Sp7. Appl. Microbiol. Biotechnol. 2014, 98, 4625–4636. [Google Scholar] [CrossRef] [PubMed]
  47. Paiva, A.L.S.; Passaia, G.; Lobo, A.K.M.; Jardim-Messeder, D.; Silveira, J.A.; Margis-Pinheiro, M. Mitochondrial glutathione peroxidase (OsGPX3) has a crucial role in rice protection against salt stress. Environ. Exp. Bot. 2018, 158, 12–21. [Google Scholar] [CrossRef]
  48. Zeng, Y.; Tan, X.; Zhang, L.; Long, H.; Wang, B.; Li, Z.; Yuan, Z. A fructose-1,6-biphosphate aldolase gene from Camellia oleifera: Molecular characterization and impact on salt stress tolerance. Mol. Breed. 2015, 35, 1–17. [Google Scholar] [CrossRef]
  49. Lu, W.; Tang, X.; Huo, Y.; Xu, R.; Qi, S.; Huang, J.; Zheng, C.; Wu, C.A. Identification and characterization of fructose 1,6-bisphosphate aldolase genes in Arabidopsis reveal a gene family with diverse responses to abiotic stresses. Gene 2012, 503, 65–74. [Google Scholar] [CrossRef]
  50. Minhas, D.; Grover, A. Transcript levels of genes encoding various glycolytic and fermentation enzymes change in response to abiotic stresses. Plant Sci. 1991, 146, 41–51. [Google Scholar] [CrossRef]
  51. Sharma, S.; Mustafiz, A.; Singla-Pareek, S.L.; Shankar, S.P.; Sopory, S.K. Characterization of stress and methylglyoxal inducible triose phosphate isomerase (OscTPI) from rice. Plant Signal. Behav. 2012, 7, 1337–1345. [Google Scholar] [CrossRef] [Green Version]
  52. Zhu, J.K. Plant Salt Stress; John Wiley & Sons: Hoboken, NJ, USA, 2007. [Google Scholar]
  53. Habib, S.H.; Kausar, H.; Saud, H.M. Plant growthpromoting Rhizobacteria enhance salinity stress tolerance in Okra through ROS-scavenging enzymes. Biomed. Res. Int. 2016, 2016, 6284547. [Google Scholar]
  54. Hossain, M.S.; Dietz, K.J. Tuning of Redox Regulatory Mechanisms, Reactive Oxygen Species and Redox Homeostasis under Salinity Stress. Front. Plant Sci. 2016, 7, 548. [Google Scholar] [CrossRef] [PubMed]
  55. Sharma, P.; Jha, A.B.; Dubey, R.S.; Pessarakl, M. Reactive oxygen species, oxidative damage, and antioxidative defense mechanism in plants under stressful conditions. J. Bot. 2012, 2012, 217037. [Google Scholar] [CrossRef]
  56. Rejeb, K.B.; Benzarti, M.; Debez, A.; Bailly, C.; Savoure, A.; Abdelly, C. NADPH oxidase-dependent H2O2 production is required for saltinduced antioxidant defense in Arabidopsis thaliana. J. Plant Physiol. 2015, 174, 5–15. [Google Scholar] [CrossRef] [PubMed]
  57. Chen, J.H.; Han-Wei, J.; En-Jung, H.; Hsing-Yu, C.; Ching-Te, C.; Hsu-Liang, H.; Tsan-Piao, L. Drought and Salt Stress Tolerance of an Arabidopsis Glutathione S-Transferase U17 Knockout Mutant Are Attributed to the Combined Effect of Glutathione and Abscisic Acid. Plant Physiol. 2012, 158, 340–351. [Google Scholar] [CrossRef] [PubMed]
  58. Mishra, P.; Kumari, B.; Dubey, R.S. Differential responses of antioxidative defense system to prolonged salinity stress in salt-tolerant and salt-sensitive Indica rice (Oryza sativa L.) seedlings. Protoplasma 2013, 250, 3–19. [Google Scholar] [CrossRef] [PubMed]
  59. Li, C.R.; Liang, D.D.; Li, J.; Duan, Y.B.; Li, H.; Yang, Y.C.; Qin, R.Y.; Li, L.I.; Wei, P.C.; Yang, J.B. Unravelling mitochondrial retrograde regulation in the abiotic stress induction of rice Alternative oxidase 1 gene. Plant Cell Environ. 2013, 36, 775–788. [Google Scholar] [CrossRef]
  60. Gao, Y.; Cui, Y.; Long, R.; Sun, Y.; Zhang, T.; Yang, Q.; Kang, J. Salt-stress induced proteomic changes of two contrasting alfalfa cultivars during germination stage. J. Sci. Food Agric. 2019, 99, 1384–1396. [Google Scholar] [CrossRef]
  61. Belghith, I.; Jennifer, S.; Tatjana, H.; Chedly, A.; Hans-Peter, B.; Ahmed, D. Comparative analysis of salt-induced changes in the root proteome of two accessions of the halophyte Cakile maritime. Plant Physiol. Biochem. 2018, 130, 20–29. [Google Scholar] [CrossRef]
  62. Soares, A.L.C.; Christoph-Martin, G.; Sebastien, C.C. Genotype-Specific Growth and Proteomic Responses of Maize Toward Salt Stress. Front Plant Sci. 2018, 9, 661. [Google Scholar] [CrossRef]
  63. Fatehi, F.; Abdolhadi, H.; Houshang, A.; Tahereh, B.; Paul, C.S. The proteome response of salt-resistant and salt-sensitive barley genotypes to long-term salinity stress. Mol. Biol. Rep. 2012, 39, 6387. [Google Scholar] [CrossRef]
  64. Gao, L.; Yan, X.; Li, X.; Guo, G.; Hu, Y.; Ma, W.; Yan, Y. Proteome analysis of wheat leaf under salt stress by two-dimensional difference gel electrophoresis (2D-DIGE). Phytochemistry 2011, 72, 1180–1191. [Google Scholar] [CrossRef] [PubMed]
  65. Li, B.; Tester, M.; Gilliham, M. Chloride on the move. Trends Plant Sci. 2017, 22, 236–248. [Google Scholar] [CrossRef] [PubMed]
  66. Moolna, A.; Bowsher, C.G. The physiological importance of photosynthetic ferredoxin NADP+ oxidoreductase (FNR) isoforms in wheat. J. Exp. Bot. 2010, 61, 2669–2681. [Google Scholar] [CrossRef] [PubMed] [Green Version]
  67. Ngara, R.; Roya, N.; Jonas, B.J.; Ole, N.J.; Bongani, N. Identification and profiling of salinity stress-responsive proteins in Sorghum bicolor seedlings. J. Proteom. 2012, 75, 4139–4150. [Google Scholar] [CrossRef] [Green Version]
  68. Bai, J.; Yan, Q.; Jinghui, L.; Yuqing, W.; Rula, S.; Na, Z.; Ruizong, J. Proteomic response of oat leaves to long-term salinity stress. Environ. Sci. Pollut. Res. 2017, 24, 3387. [Google Scholar] [CrossRef] [PubMed]
  69. Chen, S.; Natan, G.; Bruria, H. Proteomic analysis of salt-stressed tomato (Solanum lycopersicum) seedlings: Effect of genotype and exogenous application of glycinebetaine. J. Exp. Bot. 2009, 60, 2005–2019. [Google Scholar] [CrossRef] [PubMed]
  70. Turan, S.; Baishnab, C.T. Salt-stress induced modulation of chlorophyll biosynthesis during de-etiolation of rice seedlings. Physiol. Plantarum. 2015, 153, 477–491. [Google Scholar] [CrossRef] [PubMed]
  71. Wang, H.; Wang, H.; Shao, H.; Tang, X. Recent advances in utilizing transcription factors to improve plant abiotic stress tolerance by transgenic technology. Front. Plant Sci. 2017, 7, 4563. [Google Scholar] [CrossRef] [PubMed]
  72. Boriboonkaset, T.; Theerawitaya, C.; Yamada, N.; Pichakum, A.; Supaibulwatana, K.; Cha-um, S.; Takabe, T.; Protoplasma, C.K. Regulation of some carbohydrate metabolism-related genes, starch and soluble sugar contents, photosynthetic activities and yield attributes of two contrasting rice genotypes subjected to salt stress. Protoplasma 2013, 250, 1157–1167. [Google Scholar] [CrossRef] [PubMed]
  73. Wu, G.; Jin-Long, W.; Rui-Jun, F.; Shan-Jia, L.; Chun-Mei, W. iTRAQ-Based Comparative Proteomic Analysis Provides Insights into Molecular Mechanisms of Salt Tolerance in Sugar Beet (Beta vulgaris L.). Int. J. Mol. Sci. 2018, 19, 3866. [Google Scholar] [CrossRef]
  74. Cho, S.K.; Jee, E.K.; Jong-A, P.; Tae, J.E. Woo Taek KimConstitutive expression of abiotic stress-inducible hot pepper CaXTH3, which encodes a xyloglucan endotransglucosylase/hydrolase homolog, improves drought and salt tolerance in transgenic Arabidopsis plants. FEBS Lett. 2006, 580, 3136–3144. [Google Scholar] [CrossRef] [PubMed]
  75. Choi, J.Y.; Seo, Y.S.; Kim, S.J.; Kim, W.T.; Shin, J.S. Constitutive expression of CaXTH3, a hot pepper xyloglucan endotransglucosylase/hydrolase, enhanced tolerance to salt and drought stresses without phenotypic defects in tomato plants (Solanum lycopersicum cv. Dotaerang). Plant Cell Rep. 2011, 30, 867–877. [Google Scholar] [CrossRef] [PubMed]
  76. Dietz, K.; Sauter, A.; Wichert, K.; Messdaghi, D.; Hartung, W. Extracellular β-glucosidase activity in barley involved in the hydrolysis of ABA glucose conjugate in leaves. J. Exp. Bot. 2000, 51, 937–944. [Google Scholar] [CrossRef] [PubMed]
  77. Hermosa, R.; Leticia, B.; Emma, K.; Jesus, A.J.; Marta, M.B.; Vicent, A.; Aurelio, G.-C.; Enrique, M.; Carlos, N. The overexpression in Arabidopsis thaliana of a Trichoderma harzianum gene that modulates glucosidase activity, and enhances tolerance to salt and osmotic stresses. J. Plant Physiol. 2011, 168, 1295–1302. [Google Scholar] [CrossRef] [PubMed]
  78. Liu, J.; Renu, S.; Ping, C.; Stephen, H.H. Salt stress responses in Arabidopsis utilize a signal transduction pathway related to endoplasmic reticulum stress signaling. Plant J. 2007, 51, 897–909. [Google Scholar] [CrossRef]
  79. Takaaki, T.; Muneharu, E. Induction of a Novel XIP-Type Xylanase Inhibitor by External Ascorbic Acid Treatment and Differential Expression of XIP-Family Genes in Rice. Plant Cell Phys. 2007, 48, 700–714. [Google Scholar] [Green Version]
  80. Upadhaya, H.; Sahoo, L.; Panda, S.K. Molecular Physiology of Osmotic Stress in Plants. In Molecular Stress Physiology of Plants; Rout, G., Das, A., Eds.; Springer: India, New Delhi, 2013. [Google Scholar]
  81. Torres-Schumann, S.; Godoy, J.A.; Pintor-Toro, J.A. A probable lipid transfer protein gene is induced by NaCl in stems of tomato plants. Plant Mol. Biol. 1992, 18, 749–757. [Google Scholar] [CrossRef] [Green Version]
  82. Pan, Y.; Li, J.; Jiao, L.; Li, C.; Zhu, D.; Yu, J. A Non-specific Setaria italica Lipid Transfer Protein Gene Plays a Critical Role under Abiotic Stress. Front. Plant Sci. 2016, 7, 1752. [Google Scholar] [CrossRef]
  83. Dejardin, A.; Sokolov, L.N.; Kleczkowski, L.A. An Arabidopsis Stress-Responsive Sucrose Synthase Gene is UP-Regulated by Low Water Potential. In Photosynthesis: Mechanisms and Effects; Garab, G., Ed.; Springer: Dordrecht, The Netherlands, 1998. [Google Scholar]
  84. Vastarelli, P.; Moschella, A.; Pacifico, D.; Mandolino, G. Water Stress in Beta vulgaris: Osmotic Adjustment Response and Gene Expression Analysis in ssp. Vulgaris and maritima. Am. J. Plant Sci. 2013, 4, 11–16. [Google Scholar] [CrossRef]
  85. Sobhanian, H.; Razavizadeh, R.; Nanjo, Y.; Ehsanpour, A.A.; Jazii, F.R.; Motamed, N.; Komatsu, S. Proteome analysis of soybean leaves, hypocotyls and roots under salt stress. Proteome Sci. 2010, 8, 19. [Google Scholar] [CrossRef] [Green Version]
  86. Sampath, K.I.; Ramgopal, R.S.; Vardhini, B.V. Role of Phytohormones during Salt Stress Tolerance in plants. Curr. Trends Biotechnol. Pharm. 2015, 9, 334–343. [Google Scholar]
  87. Mukhopadhyay, A.; Shubha, V.; Akhilesh, K.T. Overexpression of a zinc-finger protein gene from rice confers tolerance to cold, dehydration, and salt stress in transgenic tobacco. Proc. Natl. Acad. Sci. USA 2004, 101, 6309–6314. [Google Scholar] [CrossRef] [PubMed] [Green Version]
  88. Zhang, Z.; Huanhuan, L.; Ce, S.; Qibin, M.; Huaiyu, B.; Kang, C.; Yunyuan, X. A C2H2 zinc-finger protein OsZFP213 interacts with OsMAPK3 to enhance salt tolerance in rice. J. Plant Phys. 2018, 229, 100–110. [Google Scholar] [CrossRef] [PubMed]
  89. Jamil, M.; Iqbal, W.; Bangash, A.; Rehman, S.; Imran, Q.M.; Rha, E.S. Constitutive Expression of OSC3H33, OSC3H50 AND OSC3H37 Genes in Rice under Salt Stress. Pak. J. Bot. 2010, 42, 4003–4009. [Google Scholar]
  90. Wang, X.K.; Zhang, W.H.; Hao, Z.B.; Li, X.R.; Zhang, Y.Q.; Wang, S.M. Principles and Techniques of Plant Physiological Biochemical Experiment; Higher Education Press: Beijing, China, 2006; pp. 118–119. (In Chinese) [Google Scholar]
  91. U.S. Salinity Laboratory Staff. Diagnosis and Improvement of Saline and Alkali Soils; Richards, L.A., Ed.; U.S. Goverment Publishing Office: Washington, DC, USA, 1954. [Google Scholar]
Figure 1. Evaluation of cell membrane injury under the subjected salt stress in LYP9 and NPBA. Bars denoted mean values ± SE (n = 3). Values followed by different letters denote significant difference (p ≤ 0.05) according to LSD test. The similar lettering within rice genotype shows the significant and different lettering mean non-significance within treatment levels.
Ijms 20 00547 g001
Figure 2. Effects of different levels of salt stress on the rice growth at the early stage in both LYP9 and NPBA.
Ijms 20 00547 g002
Figure 3. Rice root activity under different salt stress in LYP9 and NPBA. Bars denoted mean values ± SE (n = 3). Bars denoted mean values ±SE (n = 3). Values followed by different letters denote significant difference (p ≤ 05) according to LSD test. The similar lettering within rice genotype shows the significant and different lettering mean non-significance within treatment levels.
Ijms 20 00547 g003
Figure 4. Identification of the differential expressive proteins (DEPs). (A) DEPs in LYP9 rice under various salt stress levels as compared with the control plants. (B) DEPs in NPBA under various salt stress levels as compared with the control plants. CK: control, LS: low salt, MS: medium salt, HS: high salt.
Ijms 20 00547 g004
Figure 5. Gene ontology (GO) and Clusters of Orthologous Group (COG) analysis of the differentially responsive proteins in response to salt stress. (A) The distribution of number of differentially responsive proteins alongside their corresponding GO terms. Different colors represent different GO categories. (B) The distribution of number of differentially responsive proteins alongside their different functions as annotated by COG analysis.
Ijms 20 00547 g005
Figure 6. Top 10 pathway enrichments of the identified DEPs in LYP9 and NPBA by KEGG analysis. The corresponding pathways are listed on the Y-axis and the Rich factor values are mentioned along X-axis. Different sized dots represent the distribution of DEPs for a corresponding pathway, whereas, their color represents the p value.
Ijms 20 00547 g006
Figure 7. The major pathway annotations of the identified DEPs in LYP9 and NPBA rice. (A) Different pathways and their annotated DEP percentages in NPBA rice. (B) Different pathways and their annotated DEP percentages in LYP9.
Ijms 20 00547 g007
Figure 8. The predicted subcellular localization and compartmentation of the identified DEPs in LYP9 and NPBA.
Ijms 20 00547 g008
Figure 9. Schematic diagram of the experimental procedures and the complete pipeline for isobaric tags for relative and absolute quantitation (iTRAQ) bioinformatics quantification analysis. (A) Steps of the experiment of iTRAQ quantitative proteomics. (B) The bioinformatics analysis pipeline for the identified proteins from iTRAQ analysis. All the proteins (FDR < 0.01) proceeded with downstream analysis, including GO, COG, and Kyoto Encyclopedia of Genes and Genomes (KEGG).
Ijms 20 00547 g009
Table 1. Differential Na+ and Cl uptake from soil to leaf via root in LYP9 and NPBA under different salt stress levels at rice maximum tillering stage.
CultivarsTreatmentsNa+ (mg/g)Cl (mg/g)Na+ (mg/g)Cl (mg/g)
RootLeafRootLeafSoilSoil
LYP9CK0.7 ± 0.05d0.2 ± 0.03c0.5 ± 0.3d6.8 ± 0.4d0.2 ± 0.01d0.04 ± 0.01e
LS1.1 ± 0.03bc0.5 ± 0.08b1.6 ± 0.7cd12.4 ± 1.7bcd1.0 ± 0.03c0.6 ± 0.06de
MS1.5 ± 0.04b0.8 ± 0.10a7.9 ± 1.3ab17.6 ± 2.4ab1.7 ± 0.04b2.2 ± 0.06bc
HS1.6 ± 0.09a0.9 ± 0.11a9.5 ± 1.6a19.1 ± 2.9a2.0 ± 0.07a2.4 ± 0.33b
NPBACK0.7 ± 0.03d0.15 ± 0.01cd1.0 ± 0.3d9.9 ± 0.9cd0.2 ± 0.01d0.01 ± 0.01e
LS1.0 ± 0.07c0.3 ± 0.01c3.8 ± 0.4c14.7 ± 2.8abc1.0 ± 0.02c0.7 ± 0.08e
MS1.3 ± 0.07b0.9 ± 0.02a6.3 ± 0.6b18.7 ± 2.4ab1.6 ± 0.12b1.6 ± 0.035d
HS----2.2 ± 0.07a3.0 ± 0.23a
Values are denoted as mean ± SE (n = 3). Values followed by different letters denote significant difference (p ≤ 0.05) according to LSD test. Abbreviations: control (no salt stress, CK), low salt stress (LS), moderate salt stress (MS), and high salt stress (HS), Liangyoupeijiu (LYP9), Nipponbare (NPBA). The similar lettering within rice genotype shows the significant and different lettering mean non-significance within treatment levels.
Table 2. Overview of the total protein identification in both rice genotypes.
Total SpectraSpectraUnique SpectraPeptidesUnique Peptide
402,82371,14653,83321,74118,899
Table 3. Differentially expressed proteins in NPBA and LYP9 rice under different salt levels with 1.2 fold change and Q-value > 0.05.
Protein IDNCBI AccessionProtein NameNPBALYP9
LS vs. CKMS vs. CKLS vs. CKMS vs. CKHS vs. CK
Salt responsive
tr|B9FWE4|B9FWE4_ORYSJgi|222636749Uncharacterized protein1.5161.4150.9061.2341.255
tr|A2Y7R4|A2Y7R4_ORYSIgi|115465579Malate dehydrogenase1.39321.0141.4881.573
tr|B8BBS3|B8BBS3_ORYSIgi|115476908Os08g0478200 protein1.3891.5930.9511.4022.706
tr|A2WT84|A2WT84_ORYSIgi|115438875Malate dehydrogenase1.8972.8351.0271.8712.006
tr|A0A0P0VS15|A0A0P0VS15_ORYSJgi|115450217Nascent polypeptide-associated complex subunit β (Fragment)2.5232.5581.0171.5941.384
tr|A2XA10|A2XA10_ORYSIgi|46805452Os02g0768600 protein1.5062.2251.0712.2132.212
tr|A0A190X658|A0A190X658_ORYSIgi|115477769l-isoaspartate methyltransferase1.5752.4030.9011.5911.69
sp|Q43008|SODM_ORYSJgi|115463191Superoxide dismutase1.7752.061.0711.5341.828
sp|Q9FE01|APX2_ORYSJgi|115474285Ascorbate peroxidase1.3081.260.9661.2271.119
sp|Q07661|NDK1_ORYSJgi|61679782Nucleoside diphosphate kinase 11.2951.8160.9091.0681.435
sp|Q5N725|ALFC3_ORYSJgi|297598143Fructose-bisphosphate aldolase 31.3991.6391.0231.0891.532
sp|Q7XDC8|MDHC_ORYSJgi|115482534Malate dehydrogenase1.371.7491.0041.2841.523
tr|A2X753|A2X753_ORYSIgi|115447273Os02g0612900 protein1.4411.5521.0361.5061.597
tr|A2X7X9|A2X7X9_ORYSIgi|125540544Putative uncharacterized protein1.1521.5020.8821.3781.25
tr|A0A0P0VTX8|A0A0P0VTX8_ORYSJgi|108706531Os03g0182600 protein0.8521.8760.9080.9491.367
tr|E0X6V4|E0X6V4_ORYSJgi|306415973Triosephosphate isomerase1.0031.2321.0271.1071.256
tr|A2ZAA7|A2ZAA7_ORYSIgi|115483468Nucleoside diphosphate kinase1.1972.4060.8821.081.768
tr|Q9ATR3|Q9ATR3_ORYSAgi|13249140Glucanase1.0632.0090.8760.9121.39
tr|A2ZIH2|A2ZIH2_ORYSIgi|115487556Expressed protein1.0481.5610.9571.2041.424
tr|B9FV80|B9FV80_ORYSJgi|222636335Peroxidase0.8881.8120.9661.2981.814
tr|B8B893|B8B893_ORYSIgi|218199240Plasma membrane ATPase1.4041.4350.9060.7160.86
tr|A2XA20|A2XA20_ORYSIgi|115448935Proteasome subunit β type0.8621.1090.9461.0671.059
tr|A2Y628|A2Y628_ORYSIgi|125552829Cysteine proteinase inhibitor0.961.7751.0561.4382.205
tr|Q9ZNZ1|Q9ZNZ1_ORYSAgi|4097938Beta-1,3-glucanase0.7951.7111.0030.9321.619
tr|A2ZCK1|A2ZCK1_ORYSIgi|148762354Alcohol dehydrogenase 20.630.8661.0551.0191.019
sp|A2XFC7|APX1_ORYSIgi|158512874l-ascorbate peroxidase 11.2161.3430.9421.211.327
tr|A2X822|A2X822_ORYSIgi|125540587Glutathione peroxidase0.7170.6170.9241.771.567
tr|A2XFD1|A2XFD1_ORYSIgi|125543402Putative uncharacterized protein1.11.5430.9431.231.554
tr|A2YLI3|A2YLI3_ORYSIgi|115472191Os07g0495200 protein1.1591.8210.9711.5051.818
tr|B8ADI1|B8ADI1_ORYSIgi|218187601NADH-cytochrome b5 reductase0.7710.721.0812.1822.316
tr|A2YSB2|A2YSB2_ORYSIgi|115475275Os08g0205400 protein1.5872.2170.9081.5971.194
tr|B8AY35|B8AY35_ORYSIgi|218196772Fructose-bisphosphate aldolase0.4580.2140.9640.741.505
tr|B8AY17|B8AY17_ORYSIgi|218196757Putative uncharacterized protein0.7250.8490.9961.1741.649
tr|Q9ZNZ1|Q9ZNZ1_ORYSAgi|4097938Beta-1,3-glucanase0.7951.7111.0030.9321.619
sp|Q941Z0|NQR1_ORYSJgi|115442299Putative uncharacterized protein0.6860.7660.9840.9311.369
tr|A2WWV4|A2WWV4_ORYSIgi|125528336Putative uncharacterized protein0.5180.551.0311.1591.304
sp|P93438|METK2_ORYSJgi|3024122S-adenosylmethionine synthase1.2821.0171.0131.2261.092
tr|A2XUB9|A2XUB9_ORY Igi|90265194B0812A04.3 protein1.0741.2251.2151.1861.437
tr|A2Z2Z0|A2Z2Z0_ORYSIgi|125564321Putative uncharacterized protein1.010.7760.9211.2021.102
tr|B8AEU4|B8AEU4_ORYSIgi|218191814Putative uncharacterized protein0.9541.2120.9480.9081.134
tr|A0A0P0VTX8|A0A0P0VTX8_ORYSJgi|108706531Os03g0182600 protein0.8521.8760.9080.9491.367
tr|Q688M9|Q688M9_ORYSJgi|51854423putative endo-1,31,4-β-D-glucanase1.161.140.9921.1111.144
tr|B8ATW7|B8ATW7_ORYSIgi|115460338Os04g0602100 protein1.3861.4941.1151.4481.482
sp|Q7FAH2|G3PC2_ORYSJgi|115459078Glyceraldehyde-3-phosphate dehydrogenase 20.8871.031.0040.9961.196
tr|Q0JG30|Q0JG30_ORYSJgi|297598314Os01g0946500 protein0.950.8440.9950.7990.959
tr|Q6L5I4|Q6L5I4_ORYSJgi|47900421Putative aldehyde dehydrogenase0.7350.7370.9111.1671.008
sp|A2XW22|DHE2_ORYSIgi|81686712Glutamate dehydrogenase 21.1771.1420.9120.81.184
sp|Q7FAY6|RGP2_ORYSJgi|115461086Amylogenin1.3571.0210.7760.5580.683
sp|Q259G4|PMM_ORYSIgi|115461390Phosphomannomutase0.8361.191.0070.9241.216
Photosynthesis related
tr|A2YWS7|A2YWS7_ORYSIgi|115477166Os08g0504500 protein1.3172.220.8831.8521.77
tr|Q2QWM7|Q2QWM7_ORYSJgi|108862278Os12g0190200 protein1.0531.5350.911.3631.279
tr|B8BCC6|B8BCC6_ORYSIgi|115477246Os08g0512500 protein2.3113.4091.0221.5511.349
tr|A2XZK1|A2XZK1_ORYSIgi|125550552Putative uncharacterized protein1.2461.0151.3012.612.439
tr|B8AAX3|B8AAX3_ORYSIgi|115440559Os01g0805300 protein1.4182.1780.9861.9431.703
tr|Q0D6V8|Q0D6V8_ORYSJgi|297607127Os07g0435300 protein2.2463.3870.9822.3052.053
tr|Q7XHS1|Q7XHS1_ORYSJgi|1154721412Fe-2S iron-sulfur cluster protein-like1.0161.4140.9361.621.548
tr|A2X7M2|A2X7M2_ORYSIgi|115447507Os02g0638300 protein1.0961.6111.141.731.825
tr|B0FFP0|B0FFP0_ORYSJgi|115470529Chloroplast 23 kDa polypeptide of PS II (Fragment)1.3191.7050.9971.7471.609
tr|Q7M1U9|Q7M1U9_ORYSAgi|218186547Photosystem I 9K protein1.8323.1721.0272.2062.383
tr|A0A0P0XF80|A0A0P0XF80_ORYSJgi|38636895Os08g0347500 protein1.6422.3470.9261.7561.81
tr|Q7M1Y7|Q7M1Y7_ORYSAgi|164375543Photosystem II oxygen-evolving complex protein 2 (Fragment)1.772.3730.9892.0151.756
tr|B8AJX7|B8AJX7_ORYSIgi|115455221Serine hydroxymethyltransferase2.242.8851.0781.5251.334
tr|B8AY24|B8AY24_ORYSIgi|218196765Putative uncharacterized protein1.2881.561.0261.6391.326
sp|Q6Z2T6|CHLP_ORYSJgi|297599916Geranylgeranyl reductase0.9561.1730.9730.9571.174
sp|P0C420|PSBH_ORYSAgi|11466818Photosystem II reaction center protein H0.7950.6941.0290.8641.14
Oxidation reduction responsive
tr|A3BVS6|A3BVS6_ORYSJgi|125604340Superoxide dismutase1.5121.9030.961.6181.684
sp|Q6H7E4|TRXM1_ORYSJgi|115447527Putative uncharacterized protein0.9411.6811.0491.752.489
sp|Q9SDD6|PRX2F_ORYSJgi|115435844Peroxiredoxin-2F, mitochondrial1.3631.7721.0211.6421.687
tr|B7FAE9|B7FAE9_ORYSJgi|215769368Glutathione peroxidase0.981.3470.9651.381.176
tr|A2Y043|A2Y043_ORYSIgi|125550744Peroxidase1.2322.0460.870.6331.271
tr|Q9FTN6|Q9FTN6_ORYSJgi|115434034Os01g0106300 protein0.7321.9770.7880.6061.476
tr|A2X2T0|A2X2T0_ORYSIgi|55700921Peroxidase0.7751.1220.9130.851.697
tr|O22440|O22440_ORYSAgi|115474063Peroxidase1.7632.5540.9632.0511.612
tr|A3A7Y3|A3A7Y3_ORYSJgi|125582491Uncharacterized protein1.0991.3611.1011.5552.4
tr|B9FL20|B9FL20_ORYSJgi|115464801Uncharacterized protein1.1751.4160.9651.1591.356
tr|Q9AS12|Q9AS12_ORYSJgi|115436300Peroxidase4.6545.1880.781.9482.334
tr|B8ATW7|B8ATW7_ORYSIgi|115460338Os04g0602100 protein1.3861.4941.1151.4481.482
tr|B9FCM4|B9FCM4_ORYSJgi|116309795OSIGBa0148A10.12 protein2.2082.051.0171.3651.123
tr|Q0JB49|Q0JB49_ORYSJgi|115459848Glutathione peroxidase1.4491.4350.9331.5371.271
tr|Q43006|Q43006_ORYSAgi|20286|embPeroxidase4.584.9231.161.4211.233
tr|Q5Z7J7|Q5Z7J7_ORYSJgi|55701041Peroxidase5.0255.2220.8022.4692.659
tr|Q25AK7|Q25AK7_ORYSAgi|90265065H0510A06.15 protein1.3261.0470.911.2091.022
tr|Q6K4J4|Q6K4J4_ORYSJgi|115479691Peroxidase1.231.0490.9881.160.919
tr|A2WJQ7|A2WJQ7_ORYSIgi|115434036Os01g0106400 protein0.8842.120.9731.3132.057
sp|P41095|RLA0_ORYSJgi|11547465360S acidic ribosomal protein1.3121.2311.0730.8820.83
sp|B8AUI3|GLO3_ORYSIgi|115460650Peroxisomal (S)-2-hydroxy-acid oxidase GLO30.6270.6151.3050.8330.972
tr|A0A0N7KI36|A0A0N7KI36_ORYSJgi|55700967Peroxidase0.8950.8170.9341.4031.041
tr|B8B5W7|B8B5W7_ORYSIgi|218200254Peroxidase1.111.510.9962.7081.966
tr|A2WPA1|A2WPA1_ORYSIgi|125525683Peroxidase1.2581.6251.072.1333.577
tr|A2ZAA6|A2ZAA6_ORYSIgi|115483466Putative peptide methionine sulfoxide reductase1.1211.1840.9021.7391.32
tr|A2XVK6|A2XVK6_ORYSIgi|125549044Putative uncharacterized protein0.8440.930.9461.3211.19
tr|B9F688|B9F688_ORYSJgi|222624472Uncharacterized protein2.0633.0911.0182.4072.351
tr|B8AU10|B8AU10_ORYSIgi|218194884Putative uncharacterized protein1.2060.7471.1451.3861.226
tr|Q7F1J9|Q7F1J9_ORYSJgi|115477368Os08g0522400 protein1.2251.3471.0721.3091.121
sp|Q6K471|FTRC_ORYSJgi|75125055Ferredoxin-thioredoxin reductase1.282.030.9051.5981.668
tr|A0A0B4U1V7|A0A0B4U1V7_ORYSAgi|115467518Aldehyde dehydrogenase ALDH2b1.1781.0291.0161.0061.233
sp|Q6AV34|ARGC_ORYSJgi|218193315Probable N-acetyl-gamma-glutamyl-phosphate reductase1.0461.0750.9710.9661.237
tr|Q2QV45|Q2QV45_ORYSJgi|11548799870 kDa heat shock protein1.4151.3871.0681.3911.254
sp|Q84VG0|CML7_ORYSJgi|115474531Putative uncharacterized protein1.3511.5790.8591.351.392
tr|A2Y8A8|A2Y8A8_ORYSIgi|115465902Os06g0104300 protein0.8772.1931.0781.3361.654
tr|A0A0P0X7V0|A0A0P0X7V0_ORYSJgi|115472943Os07g0573800 protein (Fragment)1.611.8980.9161.1611.207
tr|B8BAM3|B8BAM3_ORYSIgi|115474739Os08g0139200 protein1.0961.5390.8410.91.207
sp|Q69TY4|PR2E1_ORYSJgi|115469028Putative uncharacterized protein1.2891.2120.9441.3361.361
sp|Q8W3D9|PORB_ORYSJgi|75248671Protochlorophyllide reductase B0.8811.6210.8911.1922.065
tr|B8AGN1|B8AGN1_ORYSIgi|115445869Os02g0328300 protein1.632.9250.9271.8141.808
tr|B9F604|B9F604_ORYSJgi|222625905Uncharacterized protein1.4741.821.0861.621.613
tr|Q7F229|Q7F229_ORYSJgi|115471449Os07g0260300 protein0.9241.0840.9491.3752.104
tr|A6N0B2|A6N0B2_ORYSIgi|149391329Mitochondrial formate dehydrogenase 1 (Fragment)0.9931.0840.9310.991.212
sp|Q10L32|MSRB5_ORYSJgi|115453111Putative uncharacterized protein1.1161.4710.841.2721.479
tr|Q941T6|Q941T6_ORYSJgi|15408884Os01g0847700 protein1.0280.8711.181.4161.504
tr|B8B2F2|B8B2F2_ORYSIgi|218198209Formate dehydrogenase1.0141.190.970.8981.278
sp|Q7XPL2|HEM6_ORYSJgi|75232919OSIGBa0152L12.9 protein0.9931.2240.8730.9631.253
sp|P0C5D4|PRXQ_ORYSIgi|115466906Peroxiredoxin Q, chloroplastic1.2151.6910.9091.712.077
tr|A0A0P0WR9|A0A0P0WWR9_ORYSJgi|300681235Os06g0472000 protein1.3081.2691.0321.5321.593
tr|A2WL79|A2WL79_ORYSIgi|125524611Peroxidase0.8260.8521.0471.1821.233
sp|P37834|PER1_ORYSJgi|115464711Peroxidase0.7020.9990.8190.7421.764
tr|Q01LB1|Q01LB1_ORYSAgi|115458104OSJNBa0072K14.5 protein1.1751.2430.9371.1241.221
sp|P0C0L1|APX6_ORYSJgi|115487636Putative uncharacterized protein1.1271.2131.0311.2821.477
sp|Q7X8R5|TRXM2_ORYSJgi|115459582B1011H02.3 protein1.5572.1980.9161.5773.486
tr|B7E4J4|B7E4J4_ORYSJgi|215704355Putative uncharacterized protein0.8531.0620.7620.5791.105
tr|Q7XV08|Q7XV08_ORYSJgi|38567882OSJNBa0036B21.10 protein1.1591.3820.9711.0841.397
Carbohydrate metabolism
sp|Q8L7J2|BGL06_ORYSJgi|218192323Beta-glucosidase 60.1770.3831.0040.4241.741
sp|Q76BW5|XTH8_ORYSJgi|115475445Xyloglucan endotransglycosylase/hydrolase protein 80.9532.1010.9391.0741.369
tr|Q01JC3|Q01JC3_ORYSAgi|116310134Malate dehydrogenase0.7950.740.9950.5910.889
tr|Q0DCB1|Q0DCB1_ORYSJgi|115467998Os06g0356700 protein0.8491.0730.9121.2272.764
tr|Q10CU4|Q10CU4_ORYSJgi|115455353GH family 3 N terminal domain containing protein, expressed0.722.7990.660.6632.234
tr|Q9ZNZ1|Q9ZNZ1_ORYSAgi|4097938Beta-1,3-glucanase0.7951.7111.0030.9321.619
tr|H2KWT0|H2KWT0_ORYSJgi|108863034HIPL1 protein, putative, expressed1.1062.0990.9081.2312.014
tr|B8AIS2|B8AIS2_ORYSIgi|218191593Putative uncharacterized protein0.7730.8370.8751.4371.452
sp|Q0INM3|BGA15_ORYSJgi|115488372Beta-galactosidase 151.3481.6020.9241.1871.56
tr|B9FWS5|B9FWS5_ORYSJgi|222636880Uncharacterized protein0.8381.1771.1220.8661.141
tr|Q0JG30|Q0JG30_ORYSJgi|297598314Os01g0946500 protein0.950.8440.9950.7990.959
tr|Q0J0Q9|Q0J0Q9_ORYSJgi|115479865Os09g0487600 protein0.8291.2940.881.2721.594
tr|A2XM08|A2XM08_ORYSIgi|115455349GH family 3 N terminal domain containing protein, expressed0.8591.1240.8660.781.387
sp|Q10NX8|BGAL6_ORYSJgi|152013362Beta-galactosidase 61.0631.6840.9381.4131.814
tr|B8AII1|B8AII1_ORYSIgi|218190145Putative uncharacterized protein0.9041.550.9541.1671.478
tr|Q01IH0|Q01IH0_ORYSAgi|116310092H0502G05.3 protein0.7280.7830.8941.0011.193
tr|Q01JK3|Q01JK3_ORYSAgi|116310050Aldose 1-epimerase0.8231.2260.9391.5151.515
tr|B8BHM7|B8BHM7_ORYSIgi|10140702Alpha-galactosidase0.7231.321.0061.3311.544
tr|A2Z9V6|A2Z9V6_ORYSIgi|125532825Uncharacterized protein0.732.0170.8761.2761.194
tr|Q0DTS9|Q0DTS9_ORYSJgi|297600575Os03g0227400 protein (Fragment)1.1011.2260.8041.061.306
tr|A2XME9|A2XME9_ORYSIgi|115455637Malate dehydrogenase1.0491.2611.1511.5021.548
tr|Q6Z8F4|Q6Z8F4_ORYSJgi|115448091Phosphoribulokinase1.1431.3181.0661.1441.249
tr|A2YIJ5|A2YIJ5_ORYSIgi|50509727Os07g0168600 protein0.7790.930.9521.1181.317
sp|Q75I93|BGL07_ORYSJgi|115454825Beta-glucosidase1.2011.0660.951.2761.58
tr|Q7XIV4|Q7XIV4_ORYSJgi|115474081Alpha-galactosidase0.7861.3670.9191.1151.491
tr|A3A285|A3A285_ORYSJgi|115443693Uncharacterized protein0.831.1010.8431.1511.262
tr|A0A0P0XVT5|A0A0P0XVT5_ORYSJgi|297610712Alpha-galactosidase (Fragment)0.721.1150.8481.161.321
tr|B7F946|B7F946_ORYSJgi|297605789Os06g0356800 protein0.6811.0160.71.1592.984
Stress responsive
tr|Q9AQU0|Q9AQU0_ORYSJgi|13486733Peptidyl-prolyl cis-trans isomerase1.2491.8250.9651.5781.772
tr|Q8GTB0|Q8GTB0_ORYSJgi|27476086Putative heat shock 70 KD protein, mitochondrial1.2941.3540.921.0271.208
tr|Q84S20|Q84S20_ORYSJgi|28971968CHP-rich zinc finger protein-like2.6052.4160.8691.3741.439
tr|Q5JKK9|Q5JKK9_ORYSJgi|115442153Os01g0940700 protein1.8973.9480.9551.040.959
sp|Q75HQ0|BIP4_ORYSJgi|115464027Heat shock 70 kDa protein BIP410101.0580.80.72
tr|Q53NM9|Q53NM9_ORYSJgi|115486793DnaK-type molecular chaperone hsp70-rice1.871.4871.0090.8210.793
tr|Q10NA9|Q10NA9_ORYSJgi|11545222370 kDa heat shock protein2.1981.6681.0860.9070.816
sp|Q5VRY1|HSP18_ORYSJgi|11543494617.5 kDa heat shock protein1.4133.5081.0451.0841.043
tr|Q6YUA7|Q6YUA7_ORYSJgi|115476792Os08g0464000 protein1.3231.31.0410.8661.034
tr|A2YK26|A2YK26_ORYSIgi|115471453Os07g0262200 protein1.0961.2520.9940.9951.314
tr|B9FK56|B9FK56_ORYSJgi|222631026Uncharacterized protein1.0281.1061.0311.3141.25
tr|A2Z3L9|A2Z3L9_ORYSIgi|115480445Os09g0541700 protein1.11.2180.9991.1441.342
tr|O82143|O82143_ORYSJgi|11545185326S proteasome regulatory particle1.1381.1460.9811.2931.427
tr|Q5ZAV7|Q5ZAV7_ORYSJgi|115440349Os01g0783500 protein1.0661.4341.031.712.189
tr|A2Y628|A2Y628_ORYSIgi|125552829Cysteine proteinase inhibitor0.961.7751.0561.4382.205
Osmotic stress responsive
tr|A2XHR1|A2XHR1_ORYSIgi|125544232Sucrose synthase0.821.1020.5450.3661.005
tr|B8B835|B8B835_ORYSIgi|115473055NADH-dehydrogenase0.9921.1820.8791.2821.538
tr|Q2RBD1|Q2RBD1_ORYSJgi|115483847Non-specific lipid-transfer protein0.9881.2440.8941.2742.009
tr|Q0IQK7|Q0IQK7_ORYSJgi|297612544Non-specific lipid-transfer protein1.2262.9790.781.0232.235
tr|B8B936|B8B936_ORYSIgi|218201512Putative uncharacterized protein0.8711.2810.930.9761.51
tr|B8AII1|B8AII1_ORYSIgi|218190145Putative uncharacterized protein0.9041.550.9541.1671.478
tr|Q9SNL7|Q9SNL7_ORYSJgi|6006382Putative SAM-protoporphyrin IX methyltransferase0.9350.9740.9651.051.216
sp|Q10LR9|DCUP2_ORYSJgi|115452897Uroporphyrinogen decarboxylase 21.2651.8350.9020.951.425
tr|A2X8B7|A2X8B7_ORYSIgi|2420629342-C-methyl-d-erythritol 2,4-cyclodiphosphate synthase1.3621.3990.7461.2021.538
tr|Q2RBD1|Q2RBD1_ORYSJgi|115483847Non-specific lipid-transfer protein0.9881.2440.8941.2742.009
Ethylene responsive
tr|B9G3V3|B9G3V3_ORYSJgi|222641669Uncharacterized protein1.8372.3131.8371.8251.982
sp|Q8W3D9|PORB_ORYSJgi|75248671Protochlorophyllide reductase B0.8811.6210.8911.1922.065
tr|Q0IQK7|Q0IQK7_ORYSJgi|297612544Non-specific lipid-transfer protein (Fragment)1.2262.9790.781.0232.235
tr|Q2RBD1|Q2RBD1_ORYSJgi|115483847Non-specific lipid-transfer protein0.9881.2440.8941.2742.009
Metabolic responsive
tr|Q0D572|Q0D572_ORYSJgi|297607511Os07g0577300 protein1.281.7191.1050.8992.422
tr|A2YIJ5|A2YIJ5_ORYSIgi|50509727Os07g0168600 protein0.7790.930.9521.1181.317
tr|B9F240|B9F240_ORYSJgi|222622048Uncharacterized protein0.7391.1491.3721.241.422
tr|B9F7T1|B9F7T1_ORYSJgi|222624734Uncharacterized protein1.3891.0831.3170.8540.954

