Article

Key Maize Drought-Responsive Genes and Pathways Revealed by Comparative Transcriptome and Physiological Analyses of Contrasting Inbred Lines

1
Department of Crop Genetics and Breeding, College of Agronomy, Hebei Agricultural University, Baoding 071001, China
2
North China Key Laboratory for Crop Germplasm Resources of the Education Ministry, Hebei Agricultural University, Baoding 071001, China
*
Author to whom correspondence should be addressed.
These authors contributed equally to this work.
Int. J. Mol. Sci. 2019, 20(6), 1268; https://doi.org/10.3390/ijms20061268
Submission received: 1 February 2019 / Revised: 8 March 2019 / Accepted: 8 March 2019 / Published: 13 March 2019
(This article belongs to the Special Issue Mechanisms of Drought Stress Tolerance in Plants)

Abstract

:
To unravel the molecular mechanisms underpinning maize (Zea mays L.) drought stress tolerance, we conducted comprehensive comparative transcriptome and physiological analyses of drought-tolerant YE8112 and drought-sensitive MO17 inbred line seedlings that had been exposed to drought treatment for seven days. Resultantly, YE8112 seedlings maintained comparatively higher leaf relative water and proline contents, greatly increased peroxidase activity, but decreased malondialdehyde content, than MO17 seedlings. Using an RNA sequencing (RNA-seq)-based approach, we identified a total of 10,612 differentially expressed genes (DEGs). From these, we mined out four critical sets of drought responsive DEGs, including 80 specific to YE8112, 5140 shared between the two lines after drought treatment (SD_TD), five DEGs of YE8112 also regulated in SD_TD, and four overlapping DEGs between the two lines. Drought-stressed YE8112 DEGs were primarily associated with nitrogen metabolism and amino-acid biosynthesis pathways, whereas MO17 DEGs were enriched in the ribosome pathway. Additionally, our physiological analyses results were consistent with the predicted RNA-seq-based findings. Furthermore, quantitative real-time polymerase chain reaction (qRT-PCR) analysis and the RNA-seq results of twenty representative DEGs were highly correlated (R2 = 98.86%). Crucially, tolerant line YE8112 drought-responsive genes were predominantly implicated in stress signal transduction; cellular redox homeostasis maintenance; MYB, NAC, WRKY, and PLATZ transcriptional factor modulated; carbohydrate synthesis and cell-wall remodeling; amino acid biosynthesis; and protein ubiquitination processes. Our findings offer insights into the molecular networks mediating maize drought stress tolerance.

Graphical Abstract

1. Introduction

Drought remains the primary abiotic constraint to plant growth and development, as well as crop productivity [1,2]), accounting for approximately 70% potential yield loss worldwide, largely owing to climate change [3,4]. More startling, current global climate change models predict more frequent and severe extreme weather events, along with the general temperature increase [5,6]. Consequently, water deficiency is expected to become worse and its impact on the physiological status and productivity of agronomically important plants is expected to become even more relevant during the next few decades [7].
Worldwide, maize (Zea mays L.) is the third most essential food crop after wheat (Triticum aestivum L.) and rice (Oryza sativa L.) [8]. However, like most of the cereal crops on which the world population depends for food, maize productivity is threatened by drought. Whereas the maize crop is more sensitive to drought at pre-anthesis and grain-filling periods [9], drought stress at the seedling stage can also be devastating [3]. Yield loss emanating from seedling-stage-drought-stress is of major concern in arid and semi-arid areas, such as Hebei Province in Northern China, where maize often experience moisture deficit stress in spring and early summer, thereby threatening germination and seedling growth [10]. Generally, compared to late vegetative and anthesis growth phases, the maize seedling phase has less water demands [11]. However, moisture deficit at the seedling phase will hamper early crop establishment and negatively impact on plants’ grain yield potential, as a consequence of premature tasseling and a prolonged anthesis-silk interval [12]. Therefore, untying the molecular basis of maize seedling-stage drought response, in order to improve early crop establishment in such arid and semi-arid drought-prone regions, remains pertinent in maize breeding programs [3].
To cope with drought stress, plants have evolved complex adaptive mechanisms, including physiological and metabolic reprogramming, regulation of transcription and gene expression, as well as epigenetic plasticity [2,9,13]. Various genes are expressed and translated in response to water deficit conditions [14]. Several studies performed to understand the molecular mechanisms of drought stress response have identified conserved and species-specific drought responsive genes, including membrane stabilizing proteins and late embryogenic abundant proteins (LEA), which increases cells’ water binding capacity [15,16,17]. Several heat shock proteins (HSPs), which play a major role in stabilizing protein structure, were also identified [18,19,20]. The HSPs are chiefly involved in unwinding some folded proteins and averting protein denaturation under abiotic stress conditions [14]. Additionally, several transcription factors that also regulate and provide adaptive response under drought stress were identified, including myeloblastosis (MYB), dehydration responsive element binding (DREB), C-repeat binding factor (CBF), abscisic acid responsive elements binding factor (ABF), ABRE binding (AREB), (NAM, ATAF1/2, and CUC2 containing proteins) (NAC), WRKY, and SNF1-related kinase 2 (SnRK2) [21,22,23]. Despite these achievements being made; however, the gene network of the drought stress response is still not fully elucidated [3]. Moreover, the existence of a variety of drought-inducible genes suggests that the nature of the response to drought stress is complex [9]. Therefore, elucidating drought-tolerance mechanisms will greatly enhance the development of new crop cultivars that are better adapted to regions most experiencing climate-change-exacerbated droughts, consequently leading to improved sustainable crop productivity and food security.
Considerable scientific progress has been recorded in deciphering maize vegetative- and reproductive-stage drought response mechanisms [2]. Moreover, previous researchers [9,24,25] have attempted to untie the complex gene regulatory networks involved in maize inbred lines’ drought stress response at the seedling stage. Despite the recorded achievements in this respect, our understanding of the molecular mechanisms mediating maize seedling-stage drought response remains inadequate [3]. However, recent advances in molecular biology methods have offered us convenience in deciphering plants’ underlying response mechanisms to various abiotic stresses [8]. With the development of next generation sequencing, RNA sequencing (RNA-seq) has aided our convenience in carrying out transcriptome analyses of plants’ drought stress responses [2,26]. Using RNA-seq, we can obtain transcripts from the RNA in a tissue- or cell-specific manner, transcribed at a developmental stage or functional state, and this is fundamental to fishing out functional genes [27]. Furthermore, compared to traditional sequencing methods, RNA-seq boasts of its low cost, high-throughput, and high sensitivity [22,28]. Resultantly, our knowledge pertaining to gene expression networks modulating abiotic stress adaptation in plants has been improved [13]. Several studies [9,26,29,30,31] have employed the use of RNA-seq technology, and numerous genes that respond to abiotic stresses in various crop species have been identified. It is conceivable that the study of gene expression profiles and biological functions will enhance our in-depth comprehension of plants’ response to environmental stresses, thereby aiding in breeding better adapted crop species.
Herein; therefore, using an illumina RNA sequencing and analysis-based method; we have performed a comprehensive comparative transcriptome analysis of two contrasting maize inbred lines (drought-tolerant YE8112 and drought-sensitive MO17) at the seedling (three-fully-expanded-leaves) stage, in order to elucidate the dynamic molecular mechanisms underpinning the drought stress responses in maize. Further, we have evaluated some physiological indices in order to have a systems biology approach to understanding plants’ drought response mechanisms. Our findings provide further elucidation of maize drought stress tolerance, in addition to providing a basis for further targeted cloning studies.

2. Results

2.1. Physiological Analysis of Two Contrasting Maize Inbred Line Seedlings Responses to Drought Stress

First, we exposed three-leaf-stage maize seedlings (for both tolerant line YE8112 and sensitive line MO17) to water-sufficient (control) and water-deficit (drought) treatment for seven days under greenhouse environment. Some physiological and phenotypic responses of the inbred lines to drought stress were then analyzed. In both maize inbred lines, leaf relative water content significantly (p ≤ 0.05) decreased with the increasing number of days of exposure to drought stress (Table 1). The decline in leaf relative water content in the sensitive line MO17 was evidently greater than that in the tolerant line YE8112 under drought stress conditions. Proline content and peroxidase (POD) enzyme activity significantly increased with increasing duration of stress exposure (Table 1). Comparatively, tolerant line YE8112 maintained relatively higher values of proline and POD contents than sensitive line MO17 at any given time point (Table 1). Results of the malondialdehyde (MDA) content showed that the parameter increased with the increasing number of stress exposure days, starting from day one in sensitive line MO17 and day three in tolerant line in YE8112. The significant increase in MDA content was greatest from day three to day five, becoming minimal thereafter, with sensitive line MO17 exhibiting comparatively higher values than tolerant line YE8112 (Table 1). This observation may indicate that, with the increase of drought exposure duration, leaf cell membranes are severely injured, consequently resulting in cell membrane lipid release and membrane structures destruction [32]. As we had already observed in our most recent study [32], phenotypically, the two inbred lines showed no apparent differences under control conditions. However, after seven days of drought treatment exposure, they exhibited some considerable variations, with tolerant line YE8112 maintaining fully expanded green leaves and intact plant stature, whilst sensitive line MO17 leaves became shriveled up and the plant structure became distorted (Table 1; [32]).

2.2. RNA Sequencing (RNA-seq) Analysis

RNA for use in RNA-seq transcriptome analysis was isolated from the leaves of the three-leaf-stage maize seedlings that had been subjected to the drought treatment, as described in Section 2.1 above. Six samples for tolerant line YE8112 (T01, T02, T03, T04, T05, and T06) and six for the sensitive line MO17 (T07, T08, T09, T10, T11, and T12) were categorized into four groups, viz; (T01, T02, and T03), (T07, T08, and T09)—under water-sufficient conditions; and (T04, T05, and T06), (T10, T11, and T12)—under water-deficit conditions. These four groups were named as tolerant control (TC), sensitive control (SC), tolerant drought (TD), and sensitive drought (SD), respectively. We then analyzed the transcriptomes of the two lines in response to drought stress. The cDNA libraries were prepared from these two inbred lines, before (control, C) and after drought treatment (D), and then subjected to RNA-seq profiling on the Illumina Hiseq Xten platform (San Diego, CA, USA). The raw data were deposited in the NCBI Sequence Read Archive (SRA), under accession numbers SRR5989965–SRR5989974.
After filtering, a total of 98.61 GB of clean data was generated from ten samples (two unfit samples, T07 and T12, were retrieved). For the ten samples, we obtained 567.03 million total reads, with 56.70 million reads on average from each sample. The clean reads were mapped to the maize reference genome B73. The Q30 base percentage, an indicator of the overall reproducibility and quality of the assay, was above 85.0%, which met the demands for further analysis. The mapping rates ranged from 56.83% to 78.49% (Table 2). Interestingly, the percentage of mapped reads was lower in the samples from drought-stressed MO17 than in the other samples (Table 2). This might be because drought stress increases variation in transcripts in MO17.
Mortazavi’s [33] method of fragments per kilobases of exon model per million mapped reads (FPKM) was used to measure the transcript abundance of each gene. To test the repeatability and reliability of the results, we tested the relation of expression patterns among the drought treatment (DT) and drought control (DC) replicates by Pearson’s correlation test (Figure S1). The RNA-seq correlation coefficients of FPKM, among DT and DC replicates, showed that the gene expression patterns were similar (Figure S1), thus confirming the repeatability and reliability of evaluation results. Further, to analyze the similarities and differences between the twelve samples, principal component analysis (PCA) of all samples was performed [33]. The PCA analysis showed that there was low consistence amongst the three replications of the two (one drought-stress and one control) samples, probably due to a technical failure (Figure S2). Thus, sequencing results were analyzed by retrieving samples T07 (MO17 water-sufficient) and T12 (MO17 water-deficit). The PCA results of the remaining 10 samples showed clear separation between the drought tolerant and drought sensitive lines. Additionally, the replicates of each treatment clustered together (Figure S2). These results showed that this experiment was reproducible and reliable.

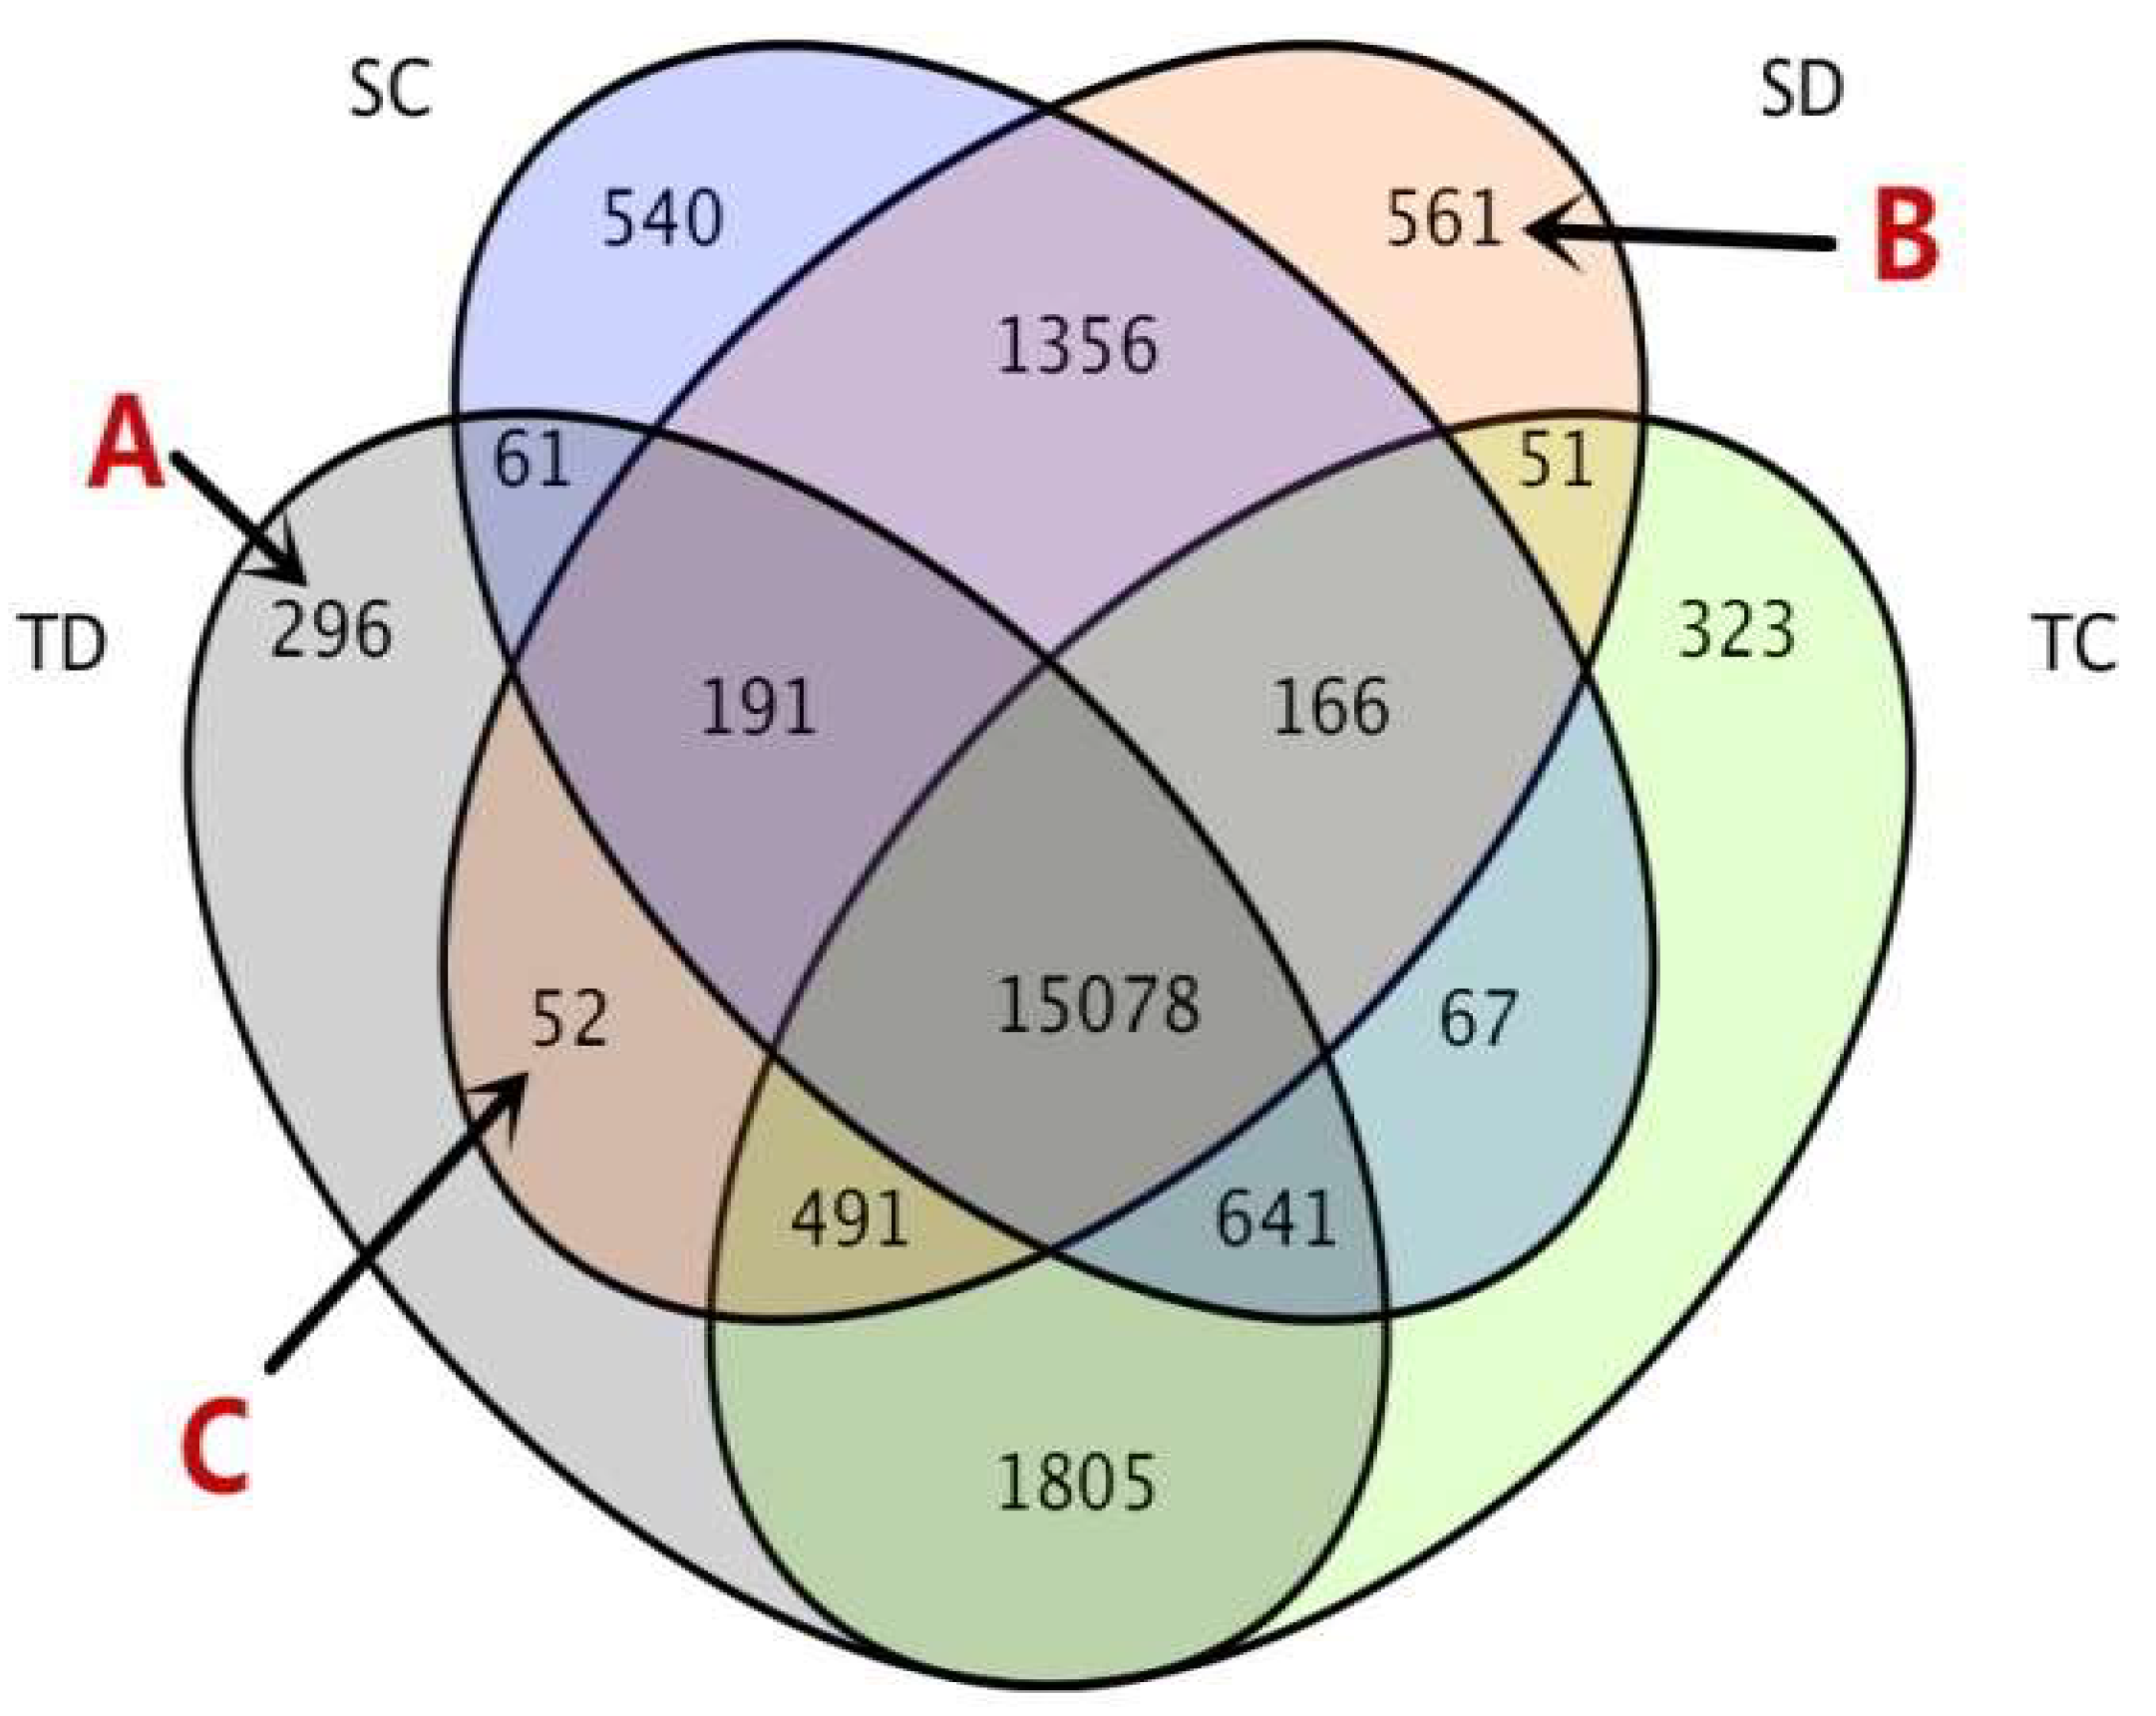
2.3. Transcriptomic Responses

In the current study, fragments per kilobase of exon model per million mapped reads (FPKM) values ≥ 1 were used to determine genes expressed. Using Cufflinks software package [34], a total of 21,679 annotated gene transcripts was identified from the four (TC, SC, TD, SD) drought treatments. The Venn diagram (Figure 1) shows the number of genes exclusively expressed in each treatment, overlapping genes between treatments, and common genes among all treatment combinations. Of these 21,679 gene transcripts, 69.55% (15,078) were represented in all treatments. Before drought stress, 83.49% (18,100) and 85.90% (18,622) of the genes were expressed in the sensitive line (MO17, SC) and the tolerant line (YE8112, TC), respectively. After drought stress, 82.78% (17,946) and 85.87% (18,615) were expressed in MO17 (SD) and YE8112 (TD), respectively (Figure 1).
A total of 296 genes (Group A in Figure 1) were exclusively expressed in tolerant line YE8112 after drought treatment (TD). Gene ontology (GO) annotation analysis (agriGO, http://systemsbiology.cau.edu.cn/agriGOv2/#, accessed on 13 October 2018) of this group showed that GO: 0008152 (metabolic process), GO: 0009987 (cellular process), and GO: 0050896 (response to stimulus) were the most significantly enriched GO terms in the biological process (BP) category. Within the molecular function (MF) category, GO: 0005488 (binding) and GO: 0003824 (catalytic activity) were most significantly enriched (Table S1, Sheet 1).
Group B, containing 561 genes, represents the genes specifically expressed in sensitive line MO17 after drought treatment (SD). In this group, GO: 0008152 (metabolic process), GO: 0009987 (cellular process), GO: 0050896 (response to stimulus), GO: 0065007 (biological regulation), and GO: 0044699 (single-organism process) were the most significantly enriched GO terms in the BP category. In the MF category, GO: 0005488 (binding), GO: 0003824 (catalytic activity), and GO: 0005215 (transporter activity) were most significantly enriched (Table S1, Sheet 2).
Group C represents the 52 expressed genes that were shared by the tolerant and sensitive lines after drought treatment. In this group, GO: 0008152 (metabolic process), GO: 0009987 (cellular process), GO: 0044699 (single organism process), and GO: 0065007 (biological regulation) were the most significantly enriched GO terms in the BP category, whilst GO: 0005488 (binding) and GO: 0003824 (catalytic activity) were prominent in the MF category (Table S1, Sheet 3).

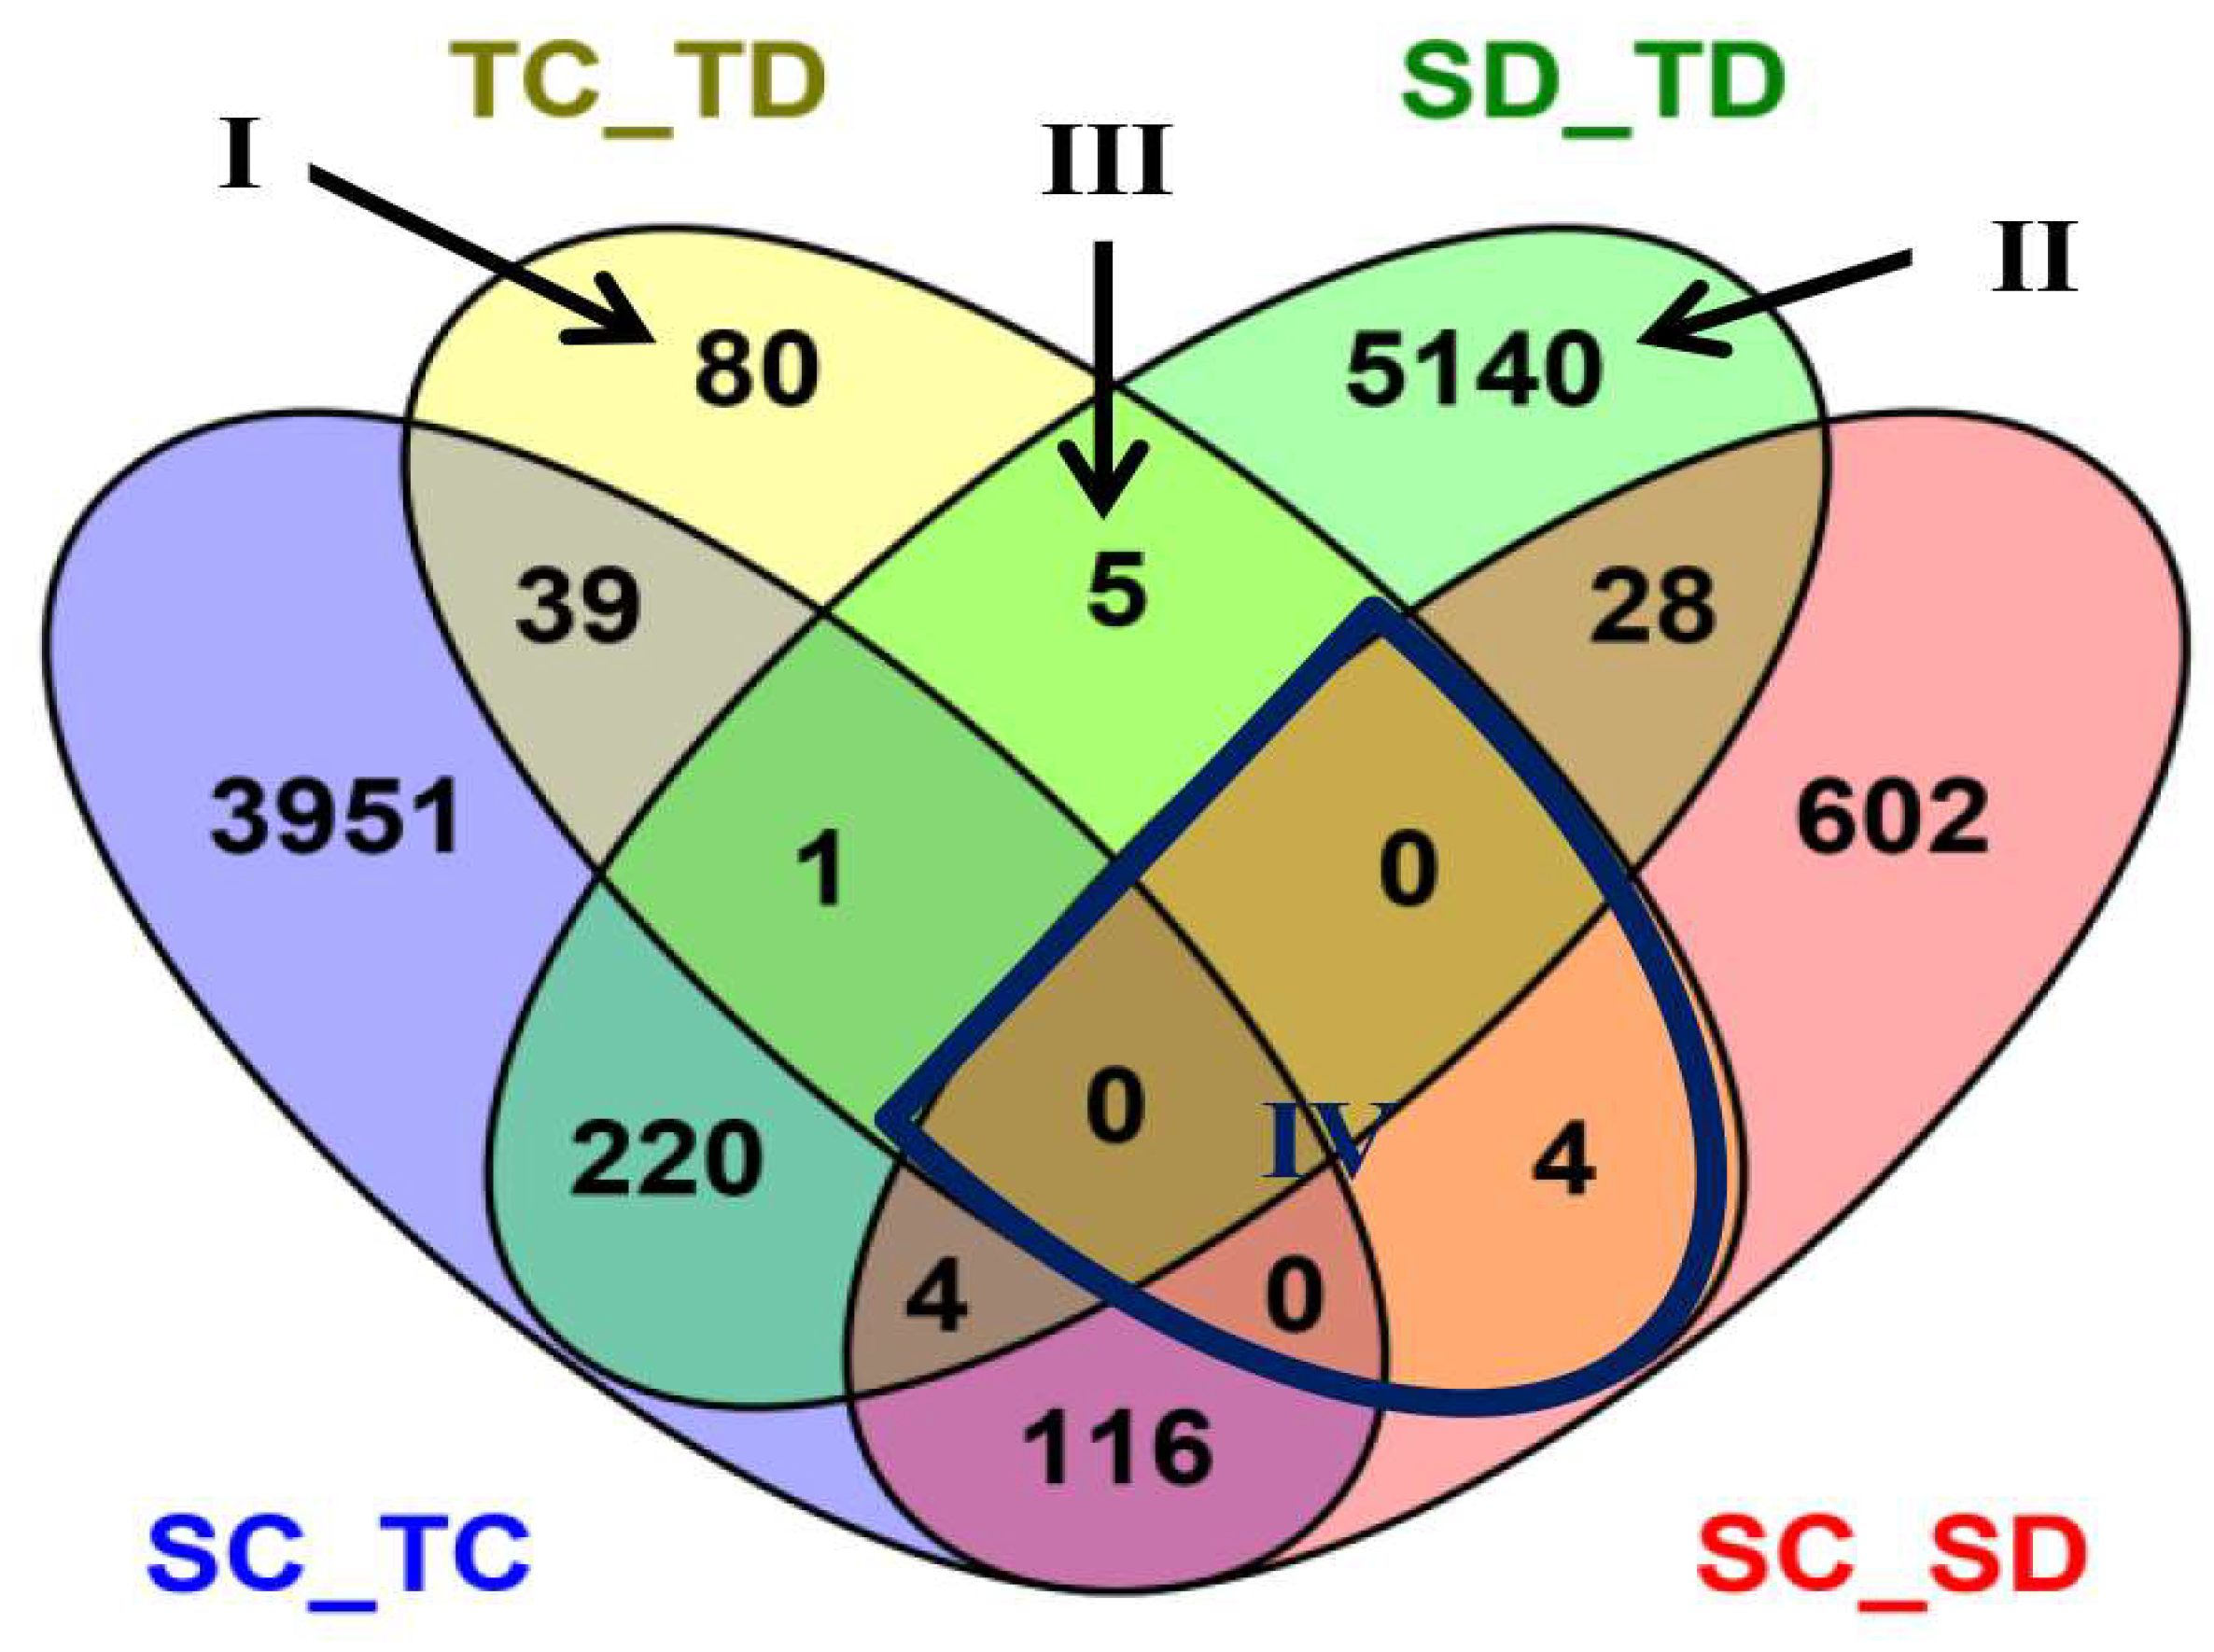
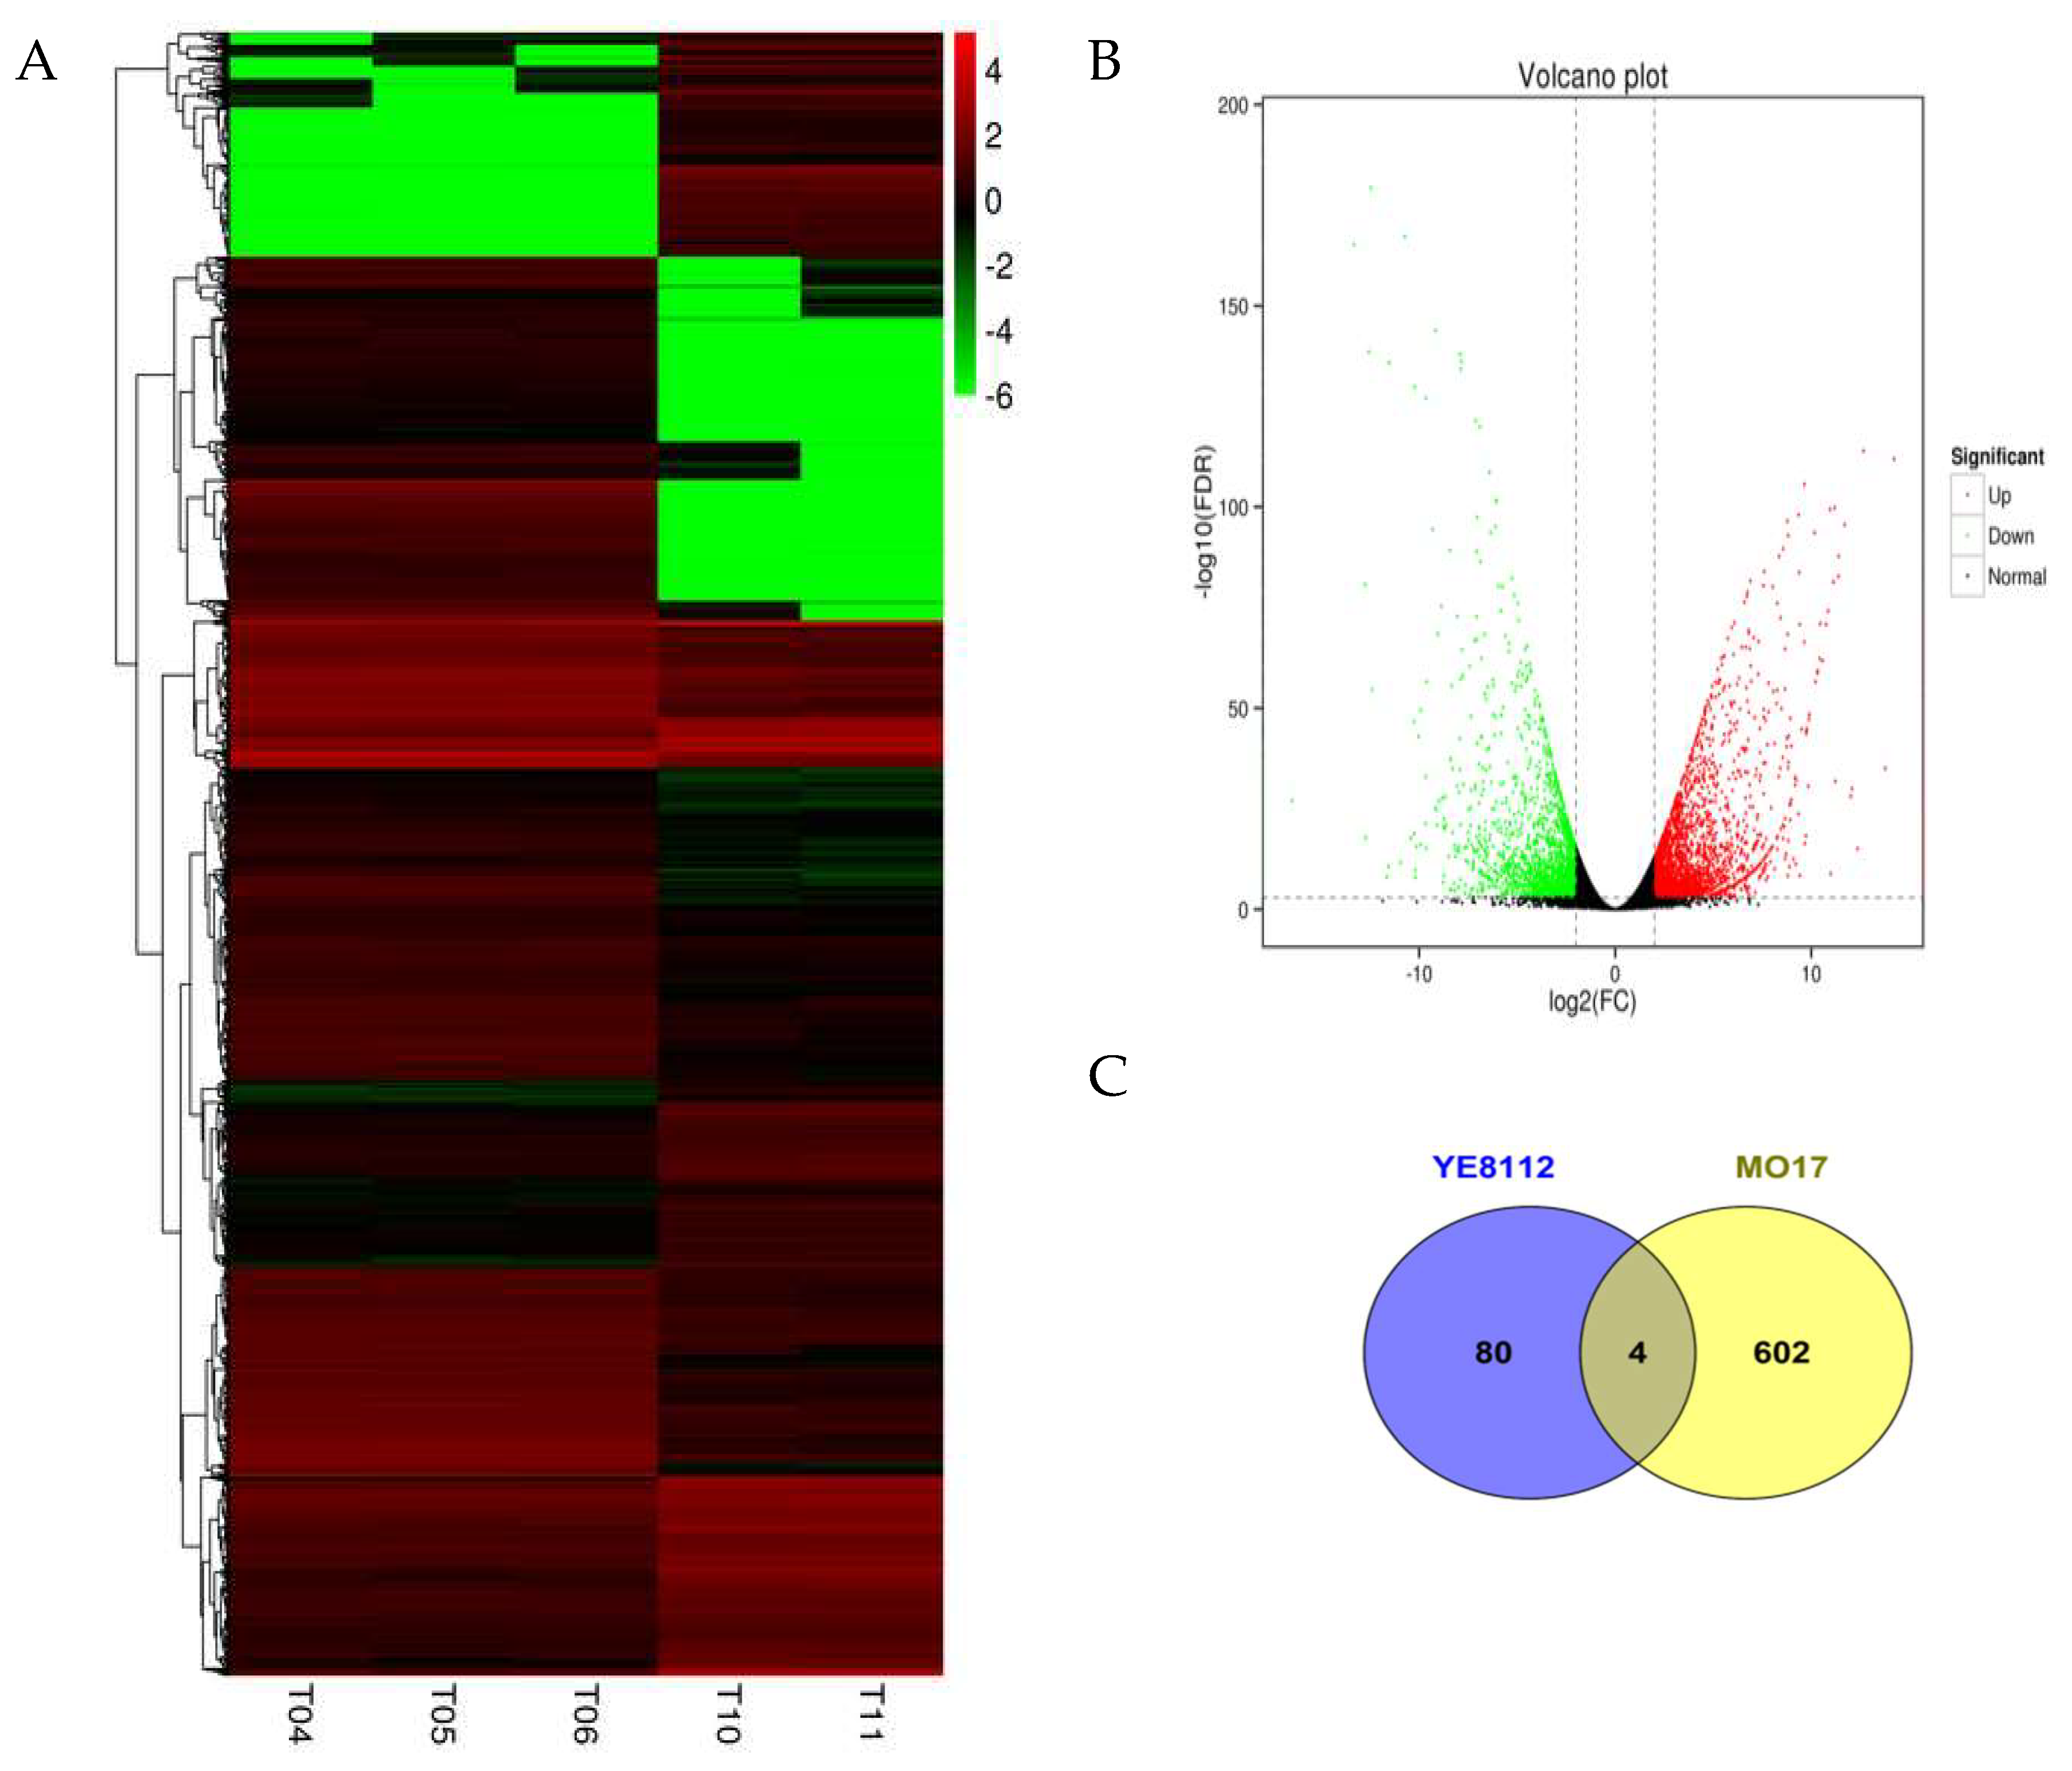
2.4. Differential Gene Expression Analysis

The software package Cuffdiff [35] was used to explore differentially expressed genes (DEGs) between different treatments. Generally, at a standard fold change of less or equal to four (≤4) and false discovery rate (FDR < 0.001), both up- and down-regulated genes are expressed when plants are exposed to drought, in either treatment (before or after drought) or line type (tolerant or sensitive) [36]. Herein (at log2 FC, <0.001 FDR), before drought treatment, we identified a total of 4331 (1964 up-regulated and 2367 down-regulated) genes to be differentially expressed between the tolerant and sensitive lines (SC_TC in Table 3; Table S2).
Under water-deficit conditions, 5398 (2485 up-regulated and 2913 down-regulated) genes were observed in between the tolerant and sensitive lines (SD_TD in Table 3; Table S3). From these results, we further compared the differences (in DEGs) between the tolerant line YE8112 and sensitive line MO17. We identified 129 (49 up-regulated and 80 down-regulated) DEGs in the tolerant line (TC_TD) and 754 (329 up-regulated and 425 down-regulated) DEGs in the sensitive line (SC_SD), to be differentially expressed before and after drought treatment (Table 3; Tables S4 and S5). Between TC_TD and SD_TD, there were a total of five DEGs, which represent drought responsive DEGs specific to the tolerant line that were also differentially expressed between the tolerant and sensitive lines after drought treatment. In total, we found a total of 10,612 DEGs among the four comparison groups, which reflect the impact of lines or treatment (Figure 2).
Some of the combinations are more important than others in respect of drought tolerance. Area I represents 80 specific DEGs of TC_TD, that is, the specific drought responsive DEGs of the drought tolerant line YE8112. Of these DEGs, 31 were up-regulated and 49 were down-regulated (Table 4). Area II represents 5140 specific DEGs of SD_TD, that is, specific DEGs shared between the drought sensitive and drought tolerant lines after drought treatment. Of these, 2371 were up-regulated whilst 2769 were down-regulated (Table S6). Area III represents the five specifically shared DEGs between TC_TD and SD_TD, that is, drought responsive DEGs of the tolerant line that were also differentially expressed between the tolerant and sensitive lines after drought treatment. Of these, two were up-regulated and three were down-regulated in TC_TD comparison; whilst one was up-regulated and four were down-regulated in SD_TD comparison (Table 5). Area IV represents the four DEGs shared by TC_TD and SC_SD, that is, the common (overlapping) drought responsive DEGs within line. These DEGs showed differential expression in the two inbred lines after drought treatment, with two DEGs being up-regulated and the other two down-regulated in TC_TD. However, all the four DEGs were down-regulated in SC_SD (Table 6, Table S7).
Clustering analysis of the DEGs of the SD_TD experimental comparison showed that, after drought stress exposure, DEGs were grouped into eight clusters, and more DEGs were down-regulated than up-regulated (Figure 3A). Additionally, analysis of the log2 fold changes of these DEGs showed that highest –log10 values were noted in the down-regulated DEGs than up-regulated DEGs (Figure 3B). Further, greater number of drought responsive DEGs were observed in the sensitive line MO17 than tolerant line YE8112 (Figure 3C).

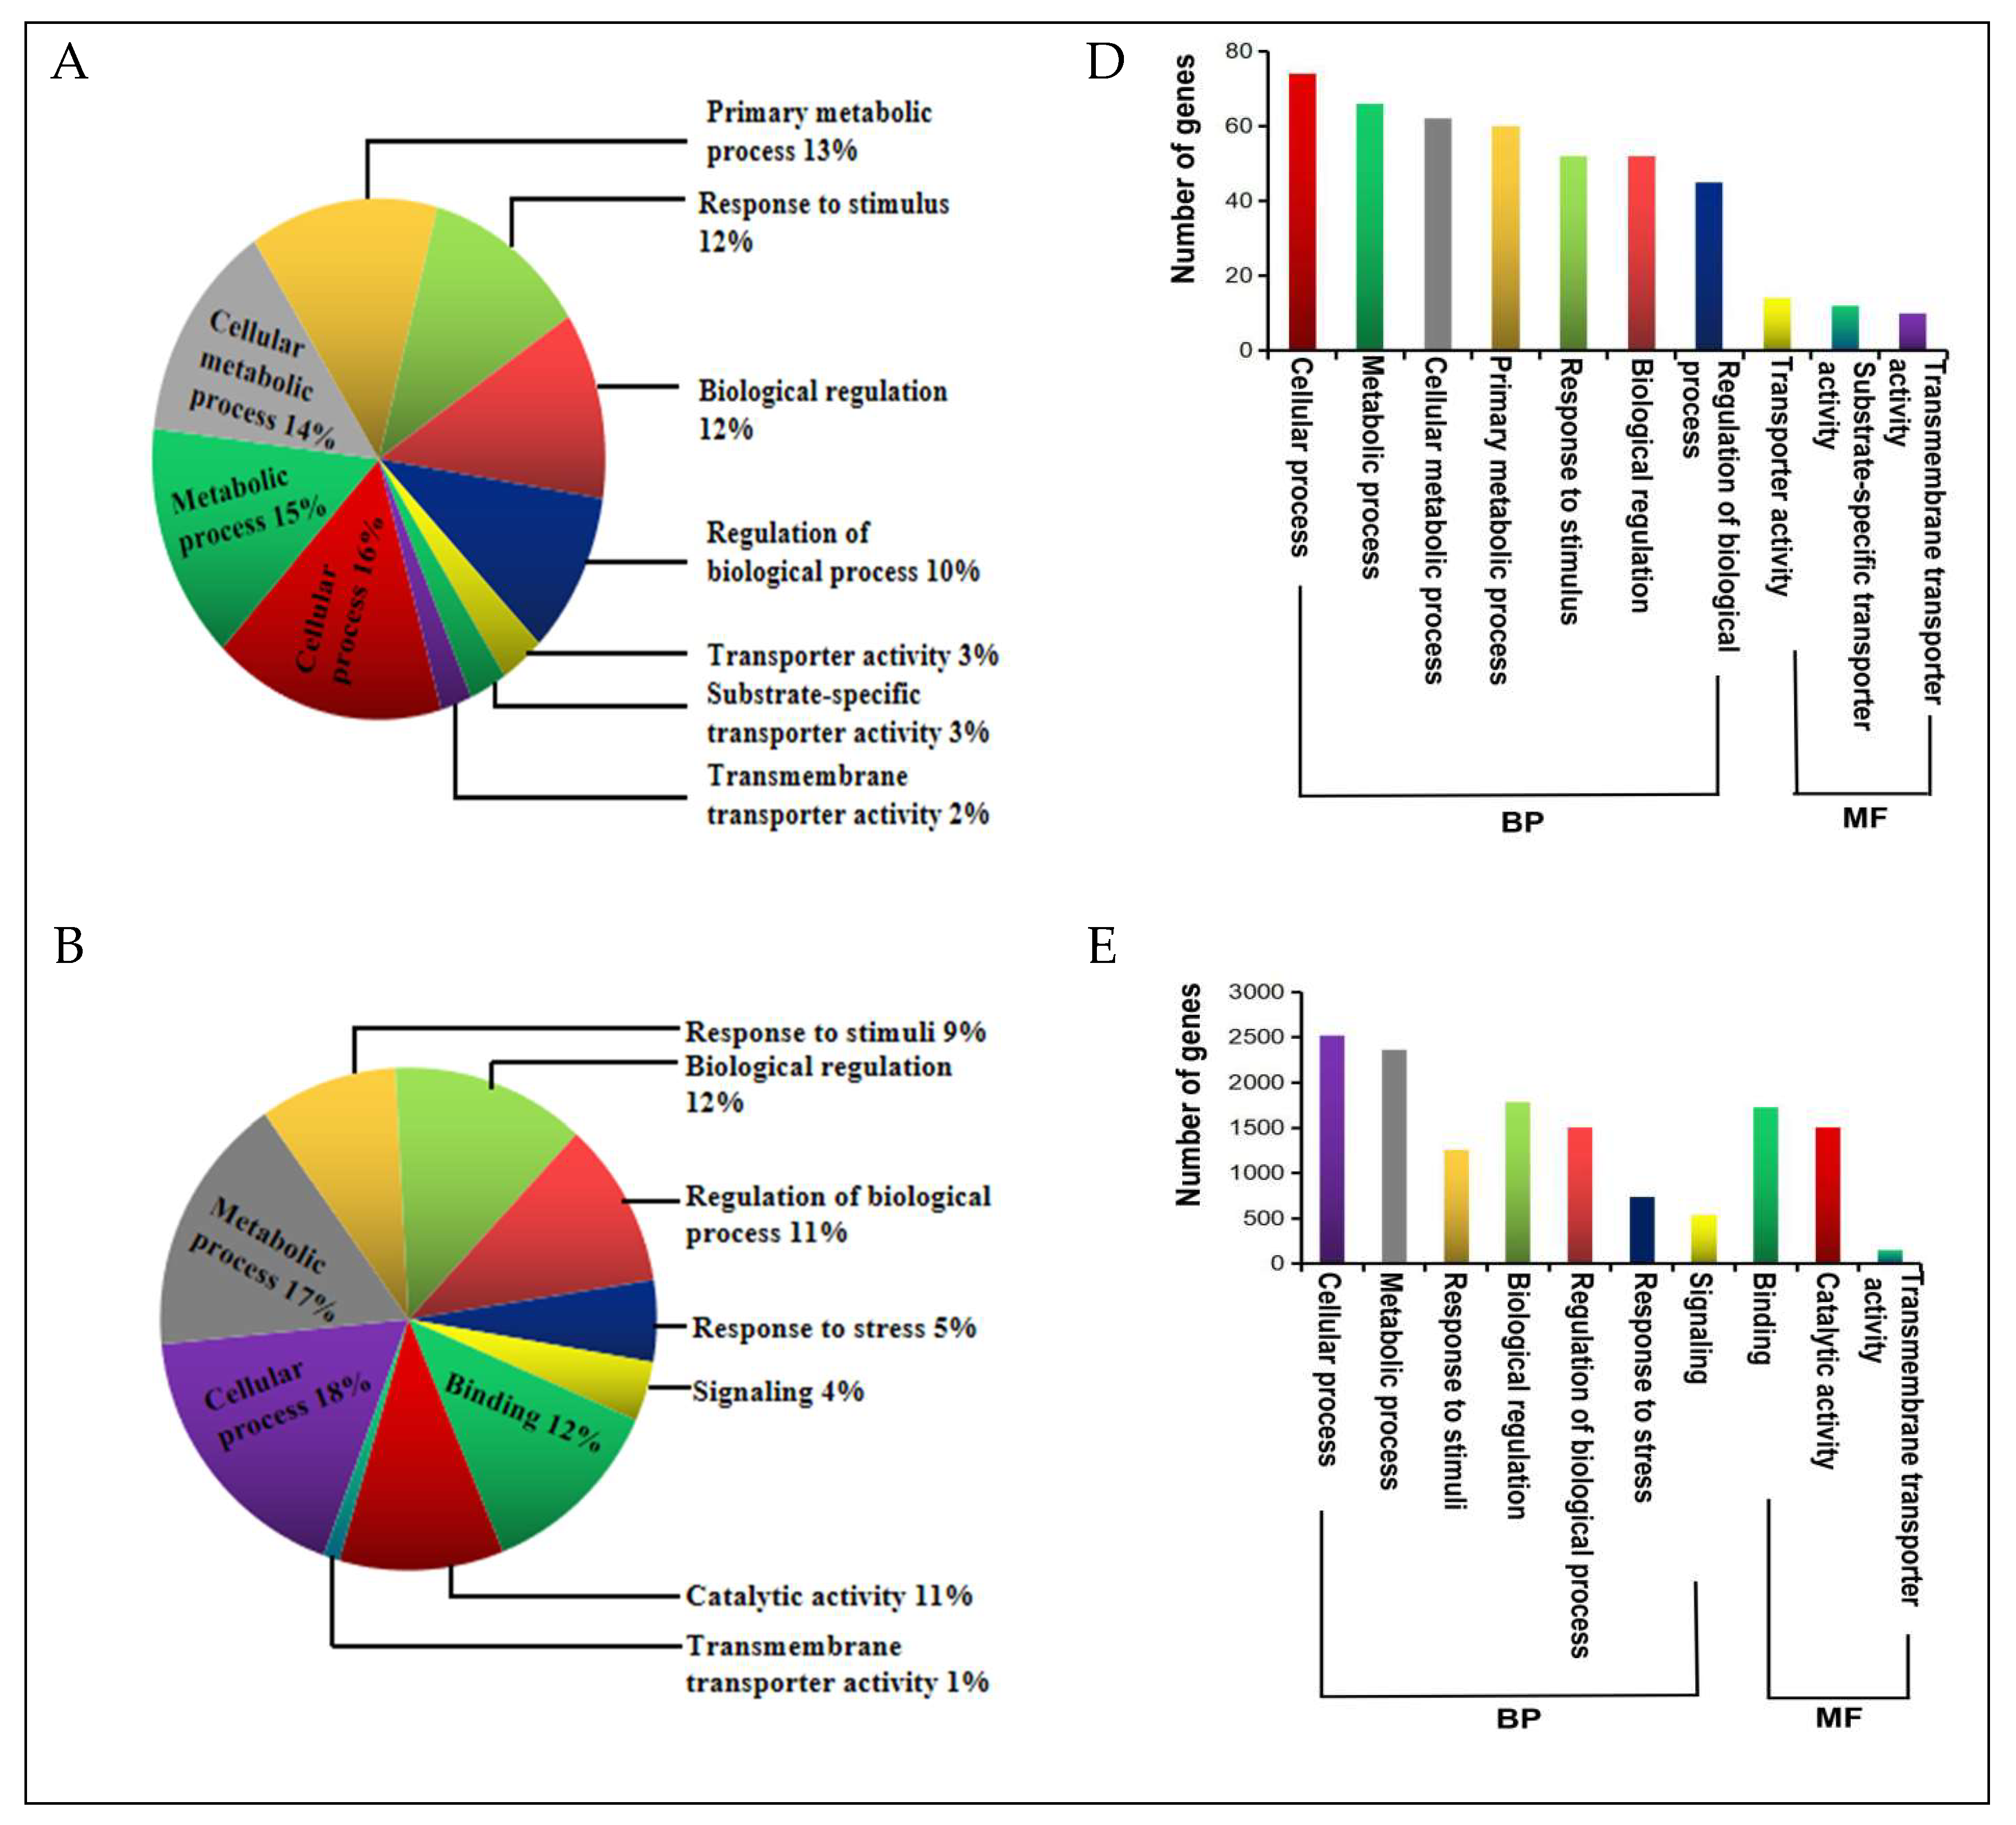
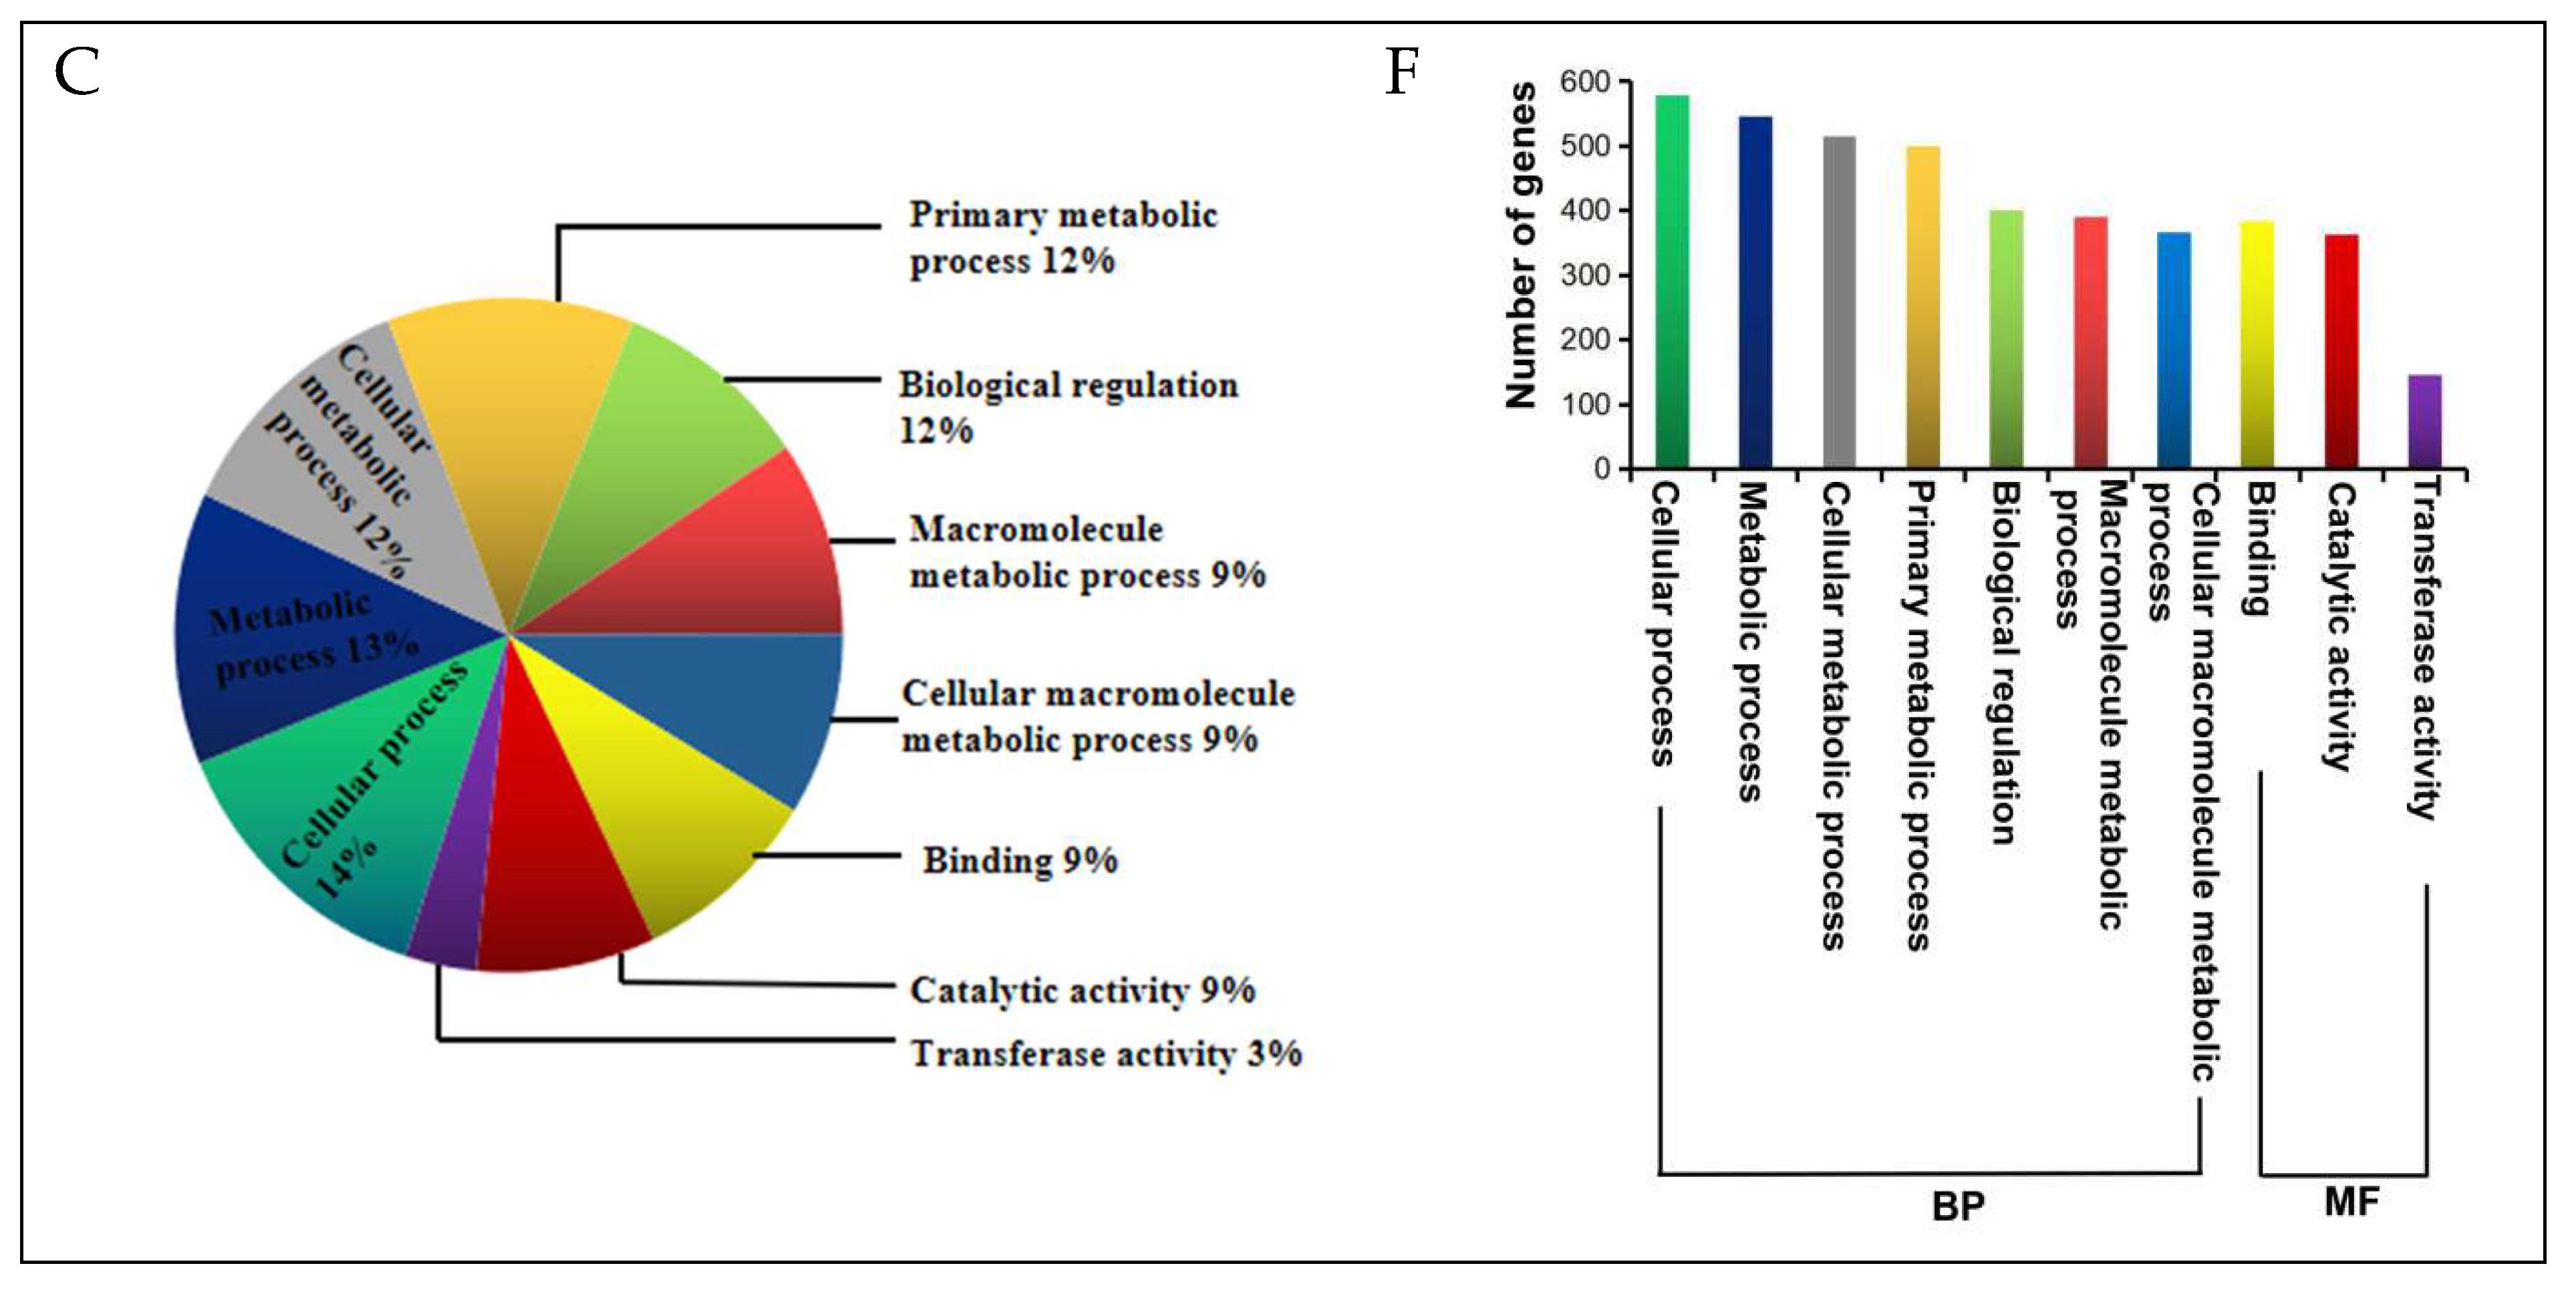
2.5. DEGs Annotation and Functional Categorization

All the DEGs got annotation and functional classification based on different databases (Table S8). To determine the broad biological functions of the DEGs from the four critical areas (labeled I–IV on Figure 2), we performed gene ontology (GO) functional annotation and categorization of those DEGs using the agriGO web-based program [37]. The GO analysis showed that a great number of DEGs were associated with biological processes (BP) and molecular functions (MF) under drought stress (Figure 4; Tables S9–S11).
For the Area I–IV specific DEGs, GO: 0009987 (cellular process); GO: 0008152 (metabolic process), GO: 0065007 (biological regulation), GO: 0006950 (response to stress), and GO: 0050896 (response to stimuli) were observed as the common and top most significantly enriched GO terms in the biological process (BP) category (Figure 4A–C). Within the molecular function (MF) group, GO: 005488 (binding); GO: 0005215/GO: 0005218 (transporter activity), and GO: 0003824 (catalytic activity) were most enriched among others (Figure 4A–C). These results suggest that the DEGs with these identified biological processes and molecular functions may be the key contributors to the drought response of the tolerant line YE8112 and the different drought responses between the two lines. For a comparative analysis, since the SC_SD specific DEGs were also enriched with the same common GO terms (Figure 4A–C), the significant difference in drought tolerance between the two inbred lines could be emanating from the difference in the number and specific types of genes enriched in each of those shared GO terms (Figure 4D–F), as well as the difference in the metabolic pathways in which those DEGs are involved.

2.6. Differentially Expressed Genes Encoding Transcription Factors

Transcription factors (TFs) are important regulators of drought stress [38]. Our analysis of the tolerant line YE8112 specific DEGs identified some transcription factor genes that were altered in response to drought stress. Two MYB-related genes, Zm00001d011297 (MYB-related TF35) and Zm00001d008808 (MYB-related TF24), were up-regulated in response to drought stress. Two WRKY genes, Zm00001d009698 (WRKY-TF20) and Zm00001d044162 (WRKY-TF64), were down-regulated. Meanwhile, two G2-like TF genes, Zm00001d013202 (G2-LIKE-TF8) and Zm00001d026542 (G2-LIKE-TF52), were down–regulated. On the other hand, one NAC gene, Zm00001d024268 (NAC-TF110), was up-regulated in response to drought stress (Table 4). Further, the TF gene Zm00001d051511 (PLATZ-TF7) was observed to be differentially expressed in the tolerant line YE8112 and in cultivar-specific comparison after drought stress (SD_TD); it was up-regulated in tolerant line YE8112, but down-regulated in SD_TD (Table 5). These TF genes could be the key contributors to drought stress tolerance in the tolerant maize inbred line.

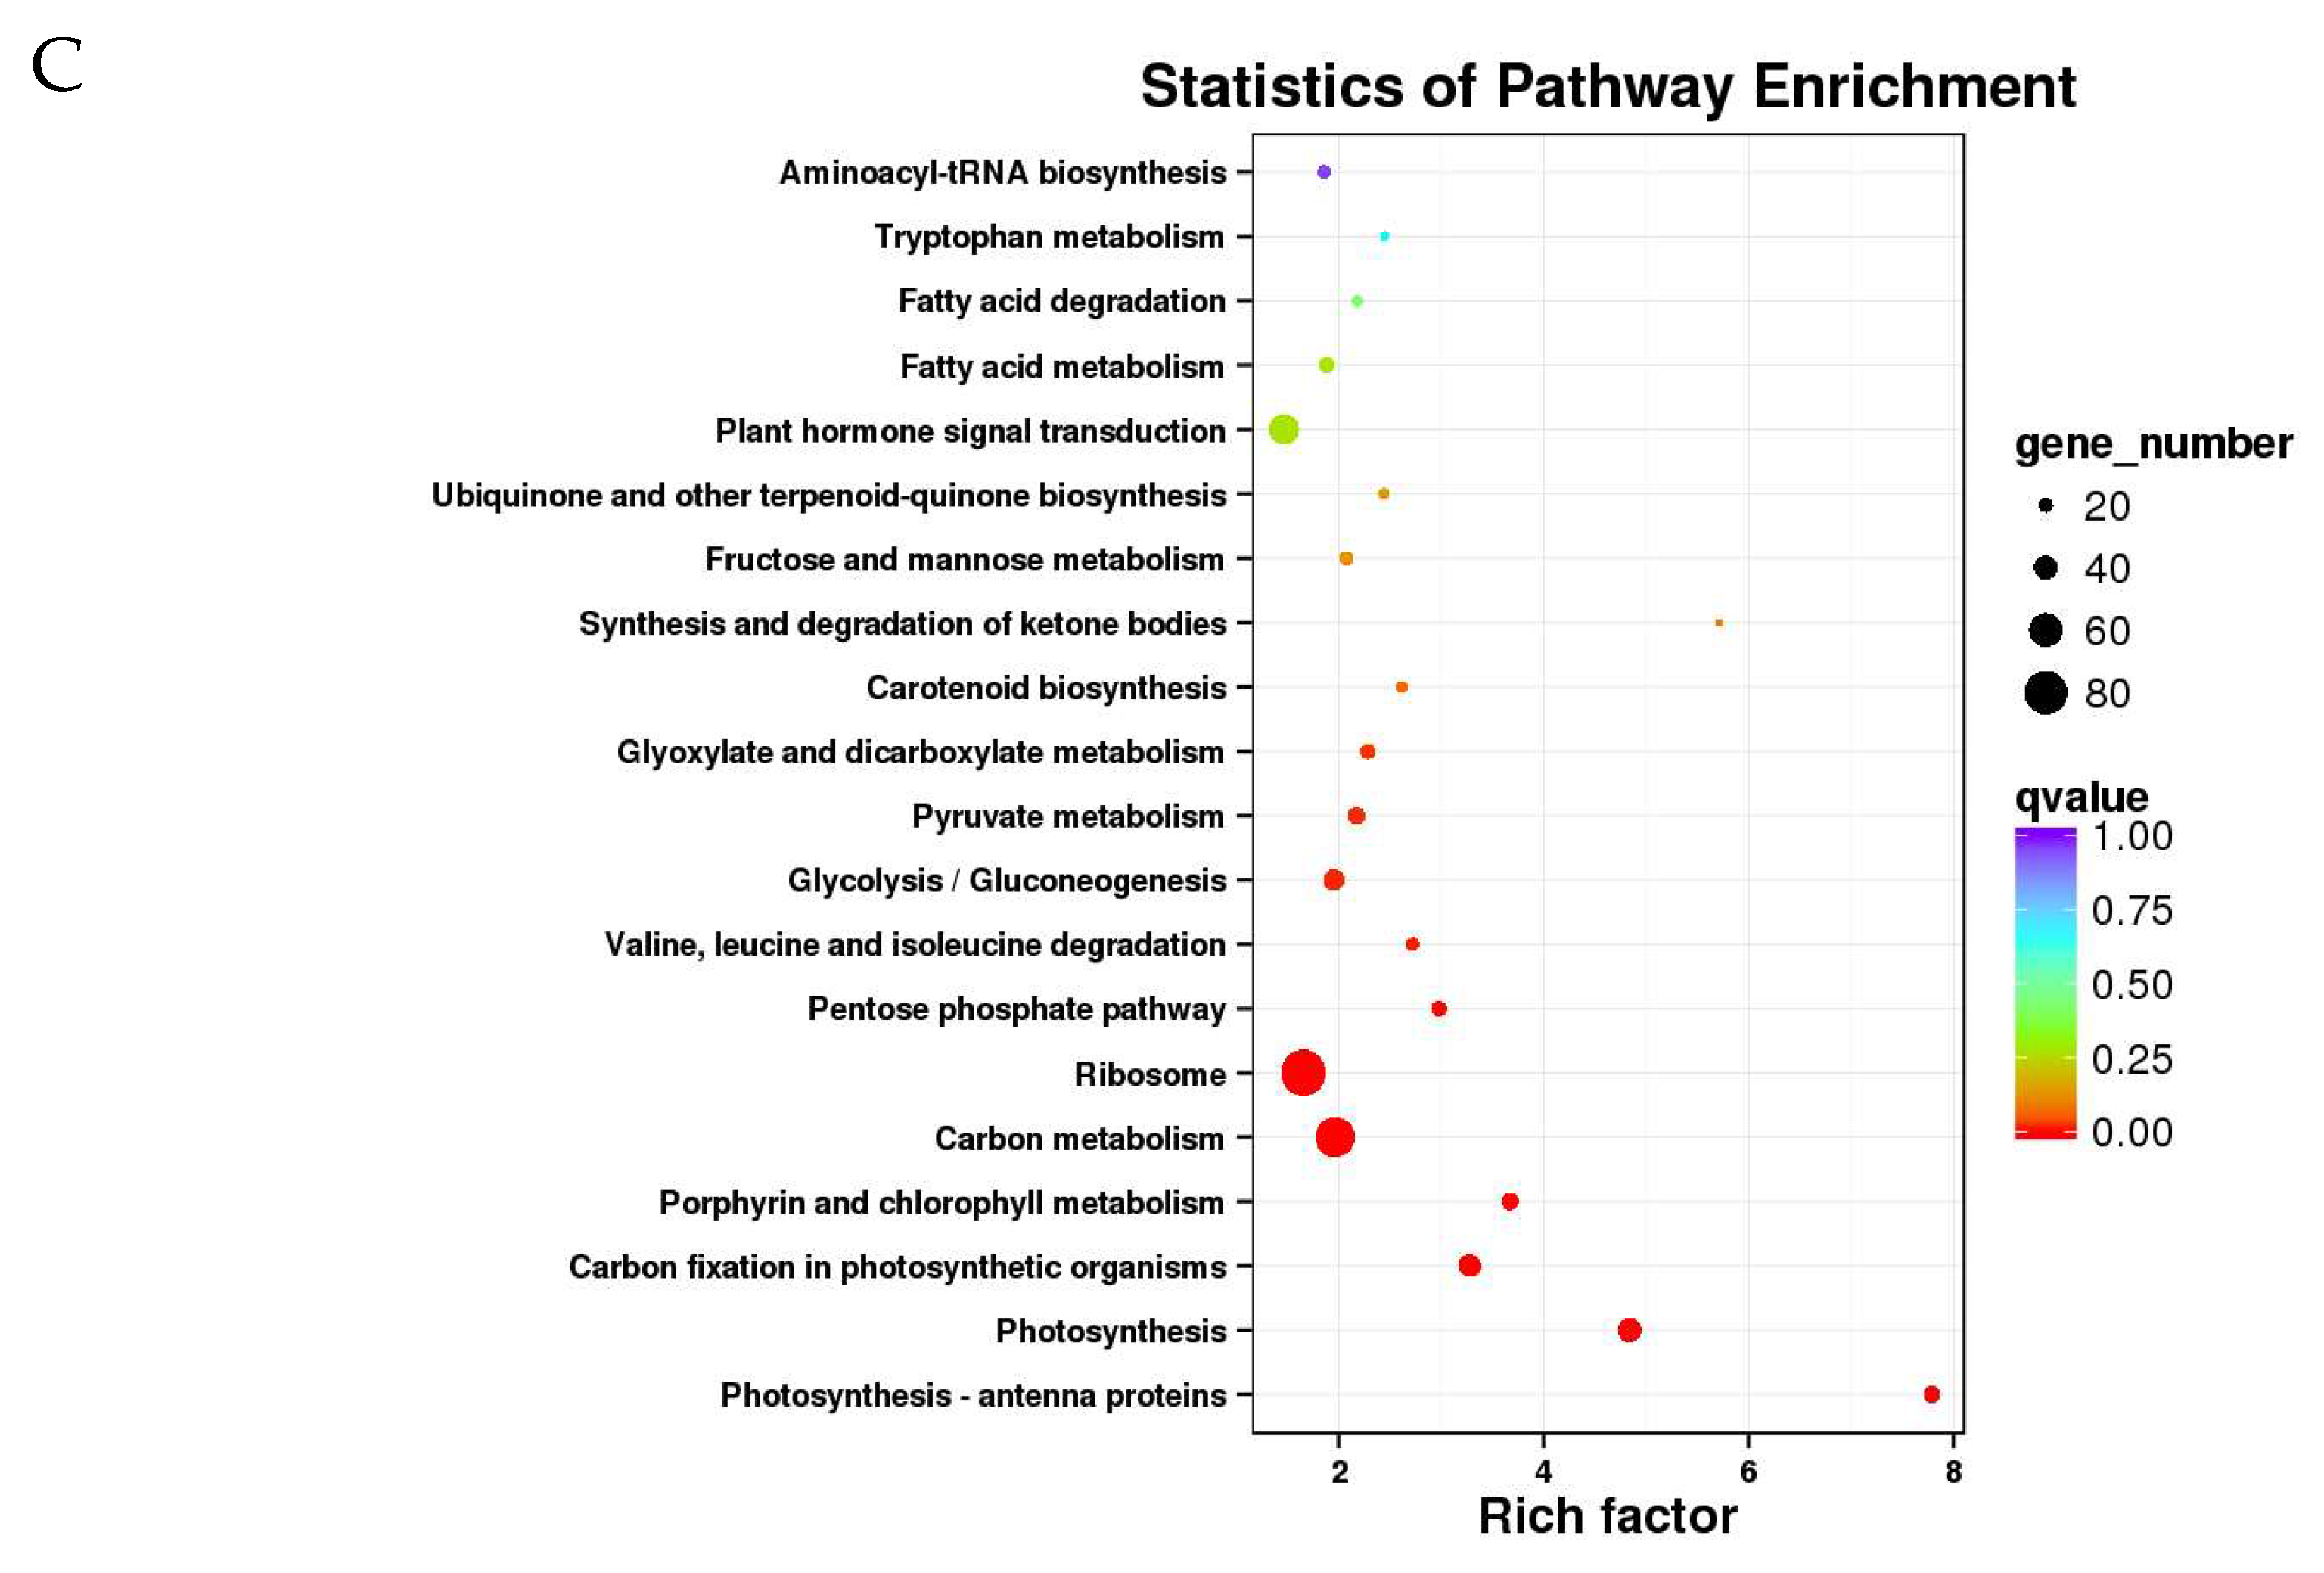
2.7. Metabolic Pathways Enrichment Analysis of the DEGs

We further analyzed the functional involvement of the identified drought-responsive DEGs in various metabolic pathways by mapping them to the Kyoto Encyclopedia of Genes and Genomes (KEGG, available online: https://www.genome.jp/kegg/; accessed on 18 April 2018) database. Moreover, we performed significant KEGG pathway enrichment analysis of these DEGs by using the hypergeometric test [39]. By comparing the top twenty pathways that were most enriched in DEGs from different experimental comparisons, we discovered that nitrogen metabolism (five genes), carbon metabolism (4), biosynthesis of amino acids (3), and alanine and glucamate metabolism (3) were dominant in tolerant line YE8112 (TC_TD) (Figure S3A).
In the SD_TD experimental comparison, plant hormone signal transduction (90 genes), phenylpropanoid biosynthesis (68), carbon metabolism (66), phenylalanine metabolism (57), and biosynthesis of amino acids (56) pathways had the greatest number of genes enriched (Figure S3B). However, the composition of the enriched KEGG pathways in the sensitive line MO17 (SC_SD) differed significantly, with ribosome (85 genes), carbon metabolism (73), plant hormone signal transduction (53), biosynthesis of amino acids (43), and photosynthesis (40) being the top most enriched pathways (Figure S3C). These results show that more DEGs were enriched in the pathways in MO17 than in pathways in YE8112, as we had noted previously [32].
Using a hypergeometric test, KEGG pathways that had a q value < 0.01 were considered to be significantly affected by drought stress. The results showed that the nitrogen metabolism pathway was the most highly enriched of the KEGG pathways in the tolerant line YE8112 (Figure 5A), whilst plant hormone signal transduction, phenylpropanoid biosynthesis, phenylalanine metabolism, and nitrogen metabolism pathways were highly enriched in the SD_TD comparison (Figure 5B). In contrast, ribosome, carbon metabolism, and photosynthesis related pathways were the most significantly enriched in the sensitive line MO17 (Figure 5C).

2.8. DEGs Related to “Response to Stress” and “Response to Stimuli”

Our analysis of the DEGs that were enriched in each level 2 GO term showed that, among the tolerant line YE8112 specific DEGs (listed in Table 4), 28 (Table S12) were significantly enriched in GO term “response to stress” (GO:0006950). Further analysis of these DEGs also showed that they were enriched in GO term “response to stimuli” (GO: 0050896), and they were also found in the SD_TD experimental comparison (Table S10). Among these genes were Zm00001D023425 (CRINKLY4), Zm00001D019983 (BRI1-like receptor kinase 1), Zm00001D034345 (ferredoxin NADP reductase 1), Zm00001D018738 (pathogenesis related protein 4), Zm00001D011473 (potassium channel 5), Zm00001D024546 (late hypocotyl elongation protein), Zm00001D044162 (WRKY 64), Zm00001D028164 (Sulfate transporter 2.2), Zm00001D044642 (calcineurin B-like-interacting kinase), and Zm00001D033047 (SPX domain-containing protein 3) (Table S10). These genes are involved in stress signal perception and transduction, nutrient and water uptake, and cell elongation under stress conditions, and; thus, are considered vital in drought stress tolerance in maize seedlings.

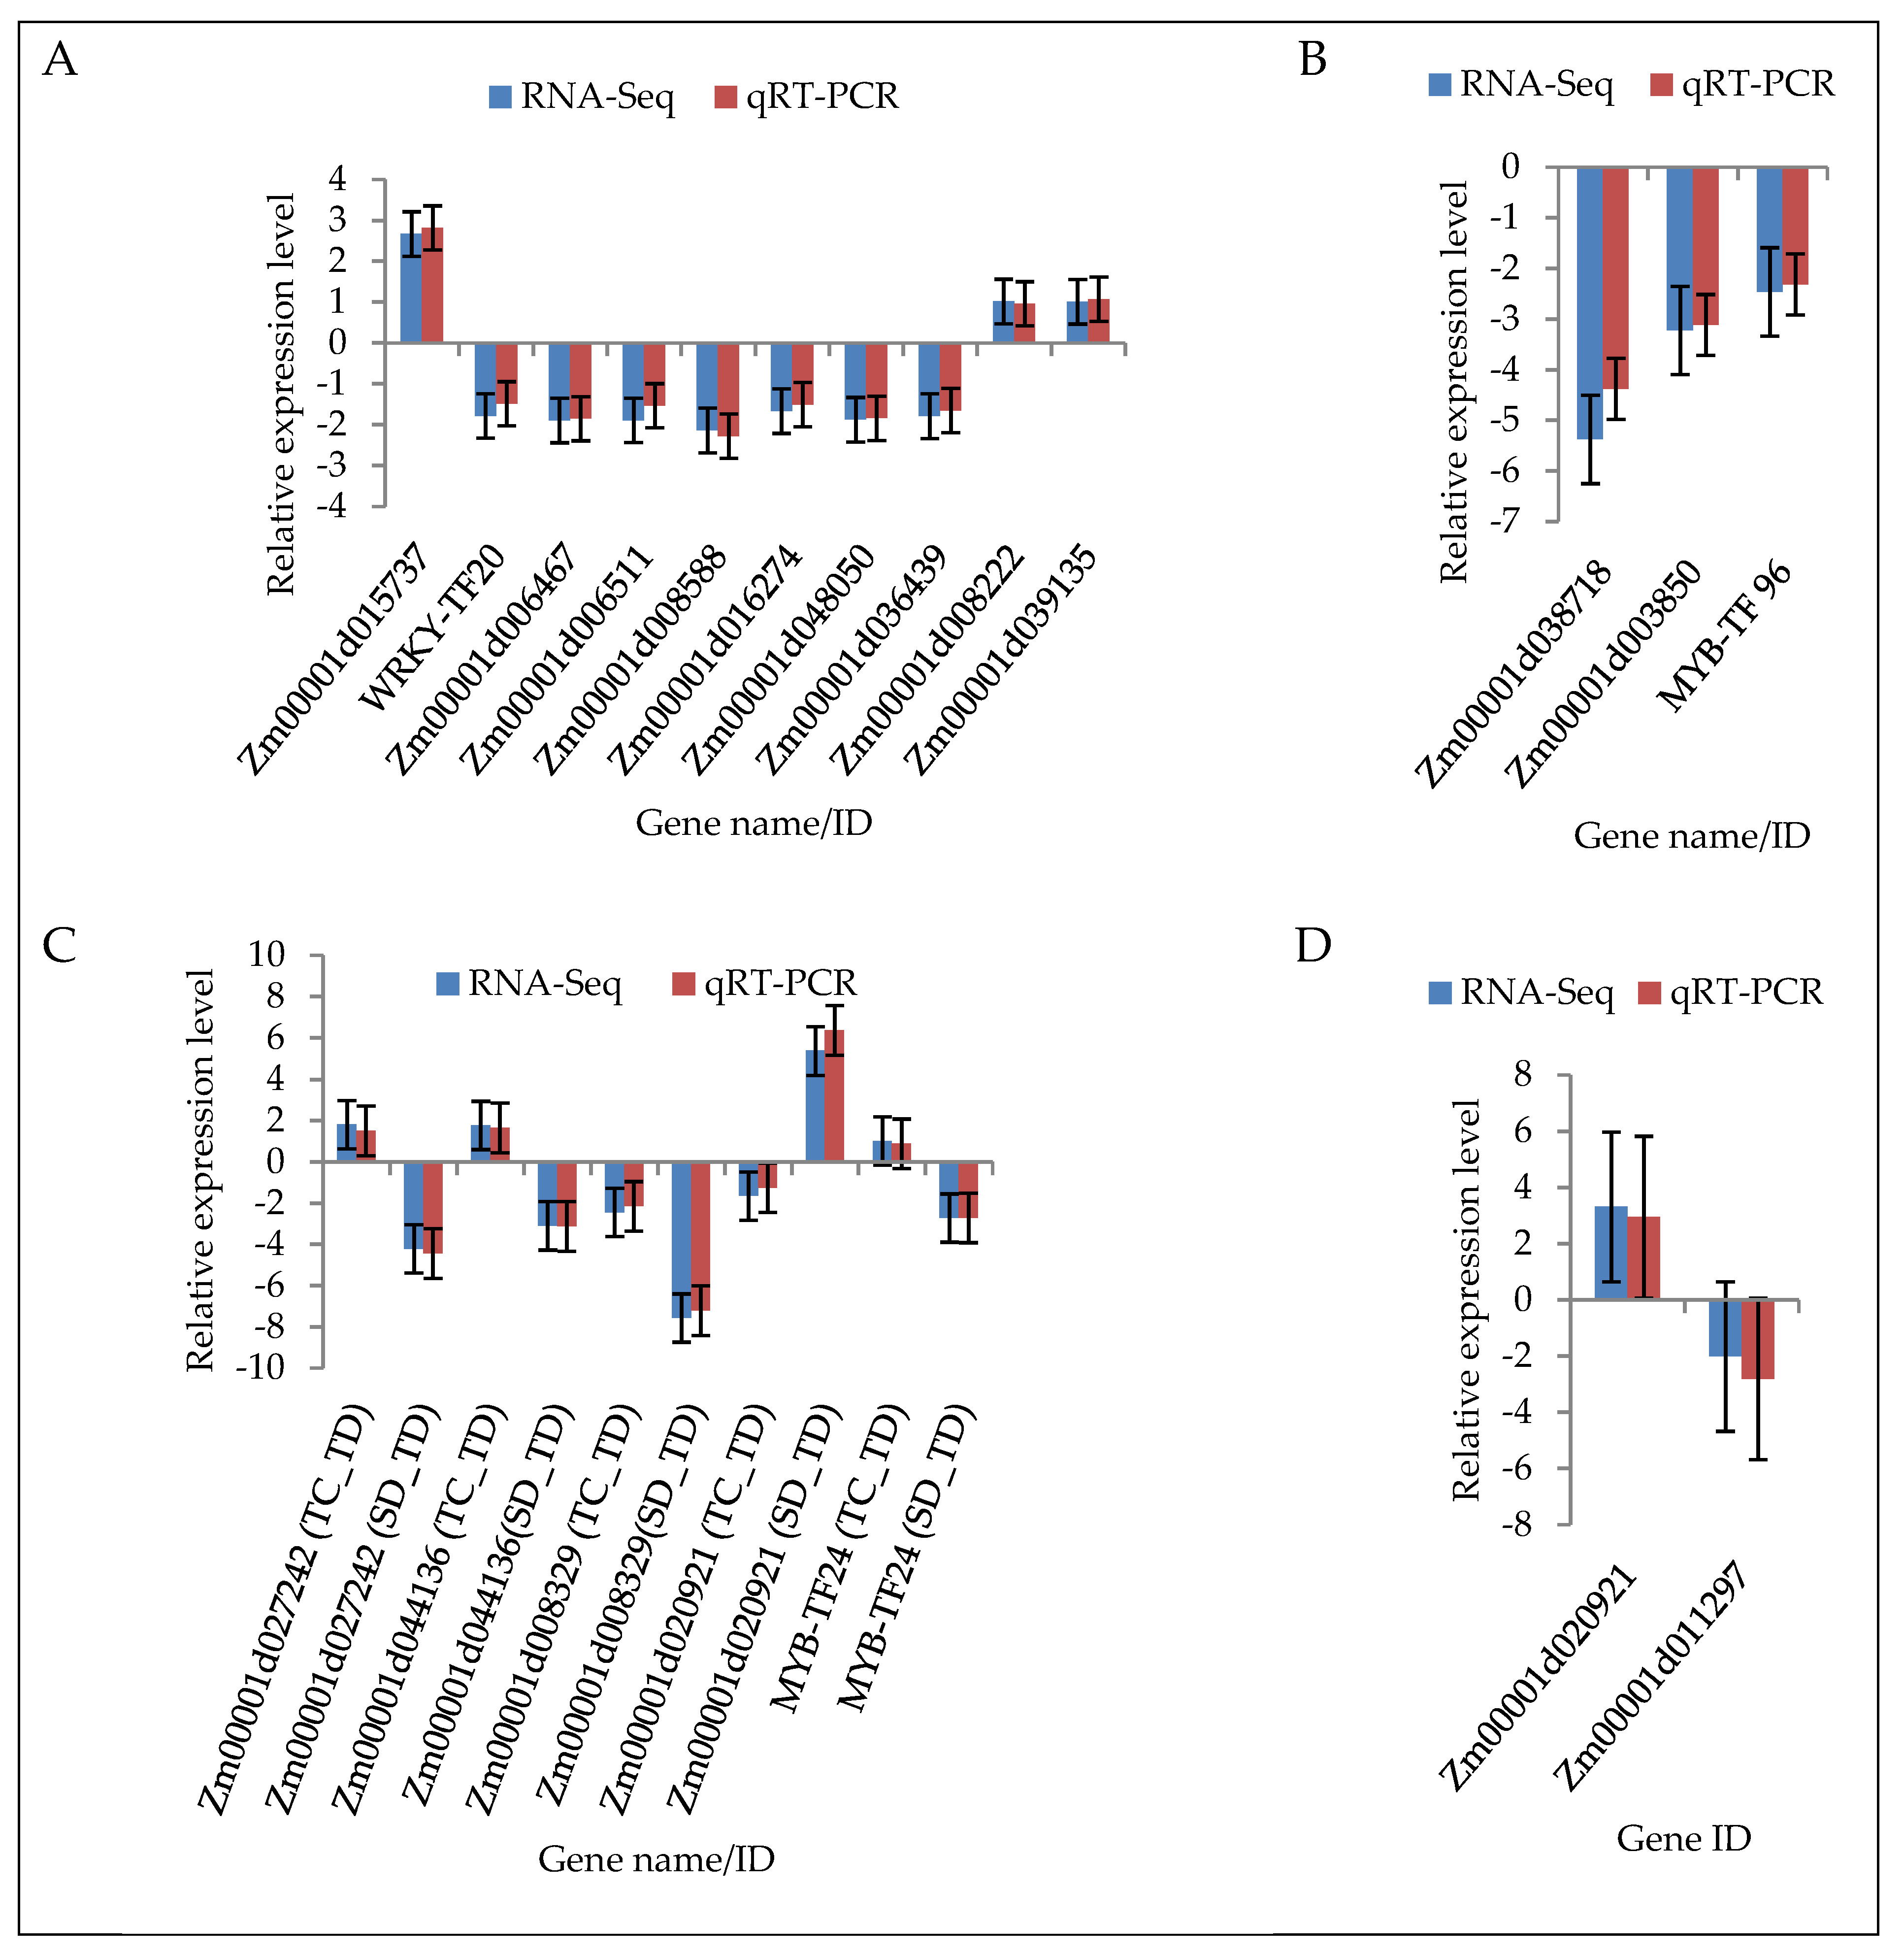
2.9. Validation of DEGs by Quantitative Real-Time PCR (qRT-PCR)

To confirm the accuracy of the RNA sequencing (RNA-seq) results, a sample of 20 DEGs were randomly chosen for quantitative real-time PCR (qRT-PCR) analysis. The gene specific primers (Table S13) used for qRT-PCR analysis were designed using Primer Premier 5.0 software (Premier Biosoft International, Palo Alto, CA, USA). The results of the qRT-PCR analysis validated our findings based on RNA-seq data. Precisely, for all the 20 DEGS, the PCR expressions were consistent with the RNA-seq data, that is, the patterns of the RNA-seq expression on all the sampled genes were replicated by the qRT-PCR approach (Figure 6; Table S14). A correlation coefficient (R2) (of the fold changes between qRT-PCR and RNA-seq) of 98.86% was obtained (Figure S4), endorsing that our RNA-seq data was reliable.

3. Discussion

In order to respond to drought stress, plants have evolved complex adaptive mechanisms at the physiological, biochemical, and molecular levels [13,40]. However, the molecular mechanisms underpinning this phenomenon have remained elusive despite recent advances in molecular biology approaches [41]. Therefore, in the current report, we have employed an RNA-seq-based approach to perform a comprehensive comparative transcriptome analysis of two contrasting maize (drought-tolerant YE8112 and drought-sensitive MO17) inbred lines to identify key regulatory genes and metabolic pathways involved in maize drought stress tolerance. In addition, we have conducted some physiological analyses to support the RNA-seq data. Further, functional validation by qRT-PCR analysis corroborated the differential expression of these identified genes. Our findings provide further insights into the elucidation of drought stress tolerance in maize, as well as providing a basis for further downstream analyses of the identified individual specific genes.

3.1. Clear Divergence Exist Between Inbred Lines YE8112 and MO17 in Their Drought Stress Responses

Tolerant line YE8112 seedlings exhibited higher leaf relative water content than sensitive line MO17 seedlings under drought stress conditions (Table 1). Additionally, analysis of the proline and POD contents of the two genotypes revealed that YE8112 seedlings always accumulated greater amounts of the protective osmolyte and antioxidant enzyme than MO17 seedlings under water limited conditions (Table 1); this was in agreement with the previous report [42]. Furthermore, tolerant line YE8112 maintained lower MDA content than sensitive line MO17, both under control and water-deficit conditions (Table 1).
It is well known that drought stress physiologically represses plant growth by having less biomass accumulation per unit area and lower photosynthesis rates [43]. At the cellular level, when plants suffer from drought stress, the decreased cellular volume causes crowding of cytoplasmic components. The chances for molecular interactions would increase, effected by the increasingly viscous cell contents, consequently resulting in protein denaturation and membrane fusion [44]. As a response, and in order to avoid these deleterious interactions, plants maintain the membrane stability and stabilize protein structures by employing several measures, including decreasing photosynthesis rate through leaf rolling, stomata closure, cell turgor maintenance, and osmotic adjustment [45,46].
Here, our results showed that, in tolerant line YE8112, proline content and POD activity increased under water stress condition. Proline reduces osmotic potential; then, the plants could maintain cell turgor pressure and growth by changing the turgor-raising potential of the existing cells [47]. Peroxidases act as the first line of cell defense by scavenging and detoxifying ROS-generated H2O2 [48], hence better cushion of cells possessing enhanced POD activity. Moreover, the tolerant line YE8112 cells’ enhanced ROS quenching competency resulted in greater cell membrane integrity and, consequently, better drought stress endurance than sensitive line MO17 [3,32,42].
Further, the results from RNA-seq analysis showed that the two genotypes’ responses to drought stress were quite different. Cultivar-specific pairwise analysis showed that, after drought treatment (at log2 FC, <0.001 FDR), drought-tolerant YE8112 had relatively lower DEGs than drought-sensitive MO17 (Table 3). Under water limited conditions and compared to sensitive line MO17, tolerant line YE8112 sustained greater leaf relative water and proline contents (Table 1), consequently resulting in relatively lower stress at the cellular level. This explains why tolerant line YE8112 exhibited a limited transcriptome response. Similarly, previous studies [3,9] have observed higher number of DEGs in sensitive than tolerant maize inbred lines after drought and freezing treatments. Taken collectively, our results have shown that divergent responses to drought stress exist between YE8112 and MO17 inbred lines, and that there was coherence between the physiological characterization and transcriptome profiling data of the two lines.

3.2. Stress Signal Transduction and Protein Kinases under Drought Stress Conditions

Stress perception is the first step to ensure plant survival to abiotic stress exposure [49]. The stress is first perceived by the receptors present on cell membranes. The signals are then transduced downstream and this results in the generation of secondary messengers including K+, Ca2+, sugars, ROS, cyclic nucleotides, and inositol phosphates [4]. The secondary messengers further modulate the intracellular calcium level. This perturbation in the cytosolic Ca2+ level is sensed by calcium binding proteins known as Ca2+ sensors [50]. These secondary messengers will eventually trigger the corresponding signaling pathways to transduce the signals [51]. Central to the signal transduction machinery are protein kinases and phosphates that mediate protein phosphorylation and dephosphorylation, respectively [14]. The calcium-dependent protein kinases (CDPKs) and mitogen activated protein kinases (MAPKs) pathways are vitally involved in plant abiotic stress responses [52,53]. At the end of the signal transduction cascade, transcription factors (TFs) are modulated by the protein kinases or phosphates, consequently effecting corresponding responses to the downstream drought responsive genes [38].
In the current study, a set of genes implicated in signaling and cell communication, such as K+ channel (Zm00001d011473) and Cl channel (Zm00001d015700) were up-regulated by 2.59 times and down-regulated by 1.08 times, respectively (Table 4). Several protein kinases were also identified to be differentially expressed in the tolerant line YE8112, including CALCINEURIN_B-LIKE10 (CBL, Zm00001d044285) and protein kinase superfamily protein (Zm00001d017374) that were up-regulated in response to drought stress. Calcineurin B-like protein interacting kinases (CIPKs) are a group of Ser/Thr protein kinases that mediate calcium signals [54]. In rice (Oryza sativa L.), CIPK gene OsCIPK31 has been involved in germination and seedling growth under abiotic stress conditions [54]. Further, ZmCIPK8, a CBL-interacting protein kinase, has been crucially involved in regulating maize drought stress response [55]. From this discussion, we can infer that these protein kinases play pivotal roles in the drought stress response mechanism. However, the down-regulation of some protein kinase related genes (Zm00001d021135 and Zm00001d044642) herein may imply the complexity of the stress signaling network, as various elements interact to effect drought stress responses.

3.3. Transcription Factor (TF) Related Genes Are a Critical Component of Drought Response Machinery

Drought stress response is controlled by a complex gene regulatory system [56]. Transcription factors (TFs) have been designated as master regulators of abiotic stresses, including drought, participating as key controllers of multiple downstream stress-responsive genes [38]. Most of these reported TFs belong to MYB, NAC, WRKY, zinc finger, AP2-EREBP, and bZIP families, and their analysis has played a very important part in stress response research [13,14,22]. Herein, several TF related DEGs were identified in the tolerant line YE8112. There were a set of transcription factors, including WRKY (2), MYB-related (2), GARP-G2-like (2), and NAC (1) (Table 4). Among these, two WRKY genes were down-regulated, two MYB-related genes were up-regulated, and two GARP-G2-like genes were down-regulated, whilst one NAC gene was up-regulated in response to drought stress (Table 4). Furthermore, numerous transcriptional factors were up-regulated in SD_TD comparison, especially the AP2-EREBP, WRKY, bZIP, MYB, bHLH, NAC, and G2-like TFs (Table S6).
Previously, in a transcriptome study to identify 20% PEG 6000—induced osmotic responsive genes in maize seedlings, Shan et al. [13] observed that, among the up-regulated genes, the NAC, MYB, and DREB transcriptional factor genes were prominent. Shi et al. [57] identified twelve transcription factor related DEGs, among them five up-regulated NACs, three up-regulated MYBs, and two down-regulated MYBs were expressed in foxtail millet (Setaria italic L.) drought stress response. Interestingly, among the four overlapping DEGs in the current study, gene Zm00001d014863 (MYB-related-TF96) was up-regulated in tolerant line YE8112, but down-regulated in sensitive line MO17 (Table 6). A previous study by Bianchi et al. [58] revealed that amongst the TFs genes, the WRKY genes were redundant, largely exhibiting down-regulation under drought stress. However, the NAC factor was up-regulated and played diverse roles in drought stress response. Additionally, Zhang et al. [59] observed several genes with expression tightly coupled to plant water potential, including eight NACs, eight MYBs, six AP2/EREBPs, six bZIPs, five HDs, four bHLHs, and other TFs, suggesting their involvement in Medicago truncatula drought adaptation responses. Furthermore, in a study by Yan et al. [60], WRKY TFs were identified as the key drought response elements. More recently, in a study in foxtail millet (Setaria italic L.) by Shi et al. [57], several transcriptional factors were identified to be differentially expressed in tolerant line M79 in response to drought stress, including 20 NAC, 14 WRKY, and five DREB, among others. Taken together, we can conclude that the differential expression of the WRKY, MYB-related, GARP-G2-like, and NAC TF genes crucially contribute to the drought stress tolerance of maize inbred line YE8112, through these TF genes interacting with each other in complex networks.

3.4. Enhanced Cellular Redox Homeostasis Is Essential for Plants to Tolerate Drought Stress

When plants are subjected to drought stress, there is a rapid and transient production of ROS, which can damage cellular components and structures [43]. In response, the drought stressed plants achieve the re-establishment of the cellular redox balance and homeostasis by altering their metabolism through various means [19]. These include the production of osmoprotectants (such as proline) that reorganize proteins and cellular components, and maintain cell turgor by osmotic adjustment and modifying the antioxidant system [50]. Additionally, the drought responsive genes, such as the late embryogenesis abundant (LEA) proteins, dehydrins, heat shock proteins (HSPs), and other molecular chaperons are modulated in response to stress [14,16]. In the current study, our physiological characterization of the inbred lines has confirmed higher accumulation of proline and peroxidase (POD) in the tolerant line YE8112 than sensitive line MO17 under drought stress (Table 1). Further, our transcriptome results have observed several enzymes, proteins, or genes implicated in redox homeostasis to be up-regulated in the SD_TD experimental comparison group (labeled Area II on Figure 2). These include thioredoxin reductase (Zm00001d053118, Zm00001d052034), peroxidase (Zm00001d052336), betaine aldehyde dehydrogenase (Zm00001d050339), FAD/NAD (P) binding oxidoreductase family protein (Zm00001d052784), and dehydrins (DHNs) (Zm00001d051420, Zm00001d051263), among others. Moreover, drought responsive genes were up-regulated, including LEA proteins (Zm00001d052774 and Zm00001d050863), HSPs (Zm00001d051607 and Zm00001d052809), heat stress transcriptional factor B-2b (Zm00001d052738), and chaperons and chaperonins (Zm00001d051342 Zm00001d052001, Zm00001d053667, Zm00001d053279 and Zm00001d052101), among others (Table S6).
The chloroplast thioredoxin (THX) systems constitute a critical component of the redox network, with thioredoxin reductase (TRs) functioning in restoring redox homeostasis by reducing the oxidization. These versatile plant chloroplast TRs systems comprise two reductases, dependent on ferredoxin and NADPH, respectively [61]. The proline osmolyte and POD antioxidant enzyme detoxify the damaging ROS, hence protect the cells from the oxidative damage; their roles have been extensively discussed in previous reports [62,63]. The LEA proteins are known to accumulate during late embryogenesis and are induced in vegetative tissues by various abiotic factors (including drought stress) that cause dehydration. They are activated to prevent intracellular water loss [16]. Further, the DHNs, a distinct group of LEAs, are ubiquitous and responsive to ABA, that is, their expression is increased by the phytohormone abscisic acid [64], and they have been observed to play a critical role in plant stress responses [16]. Drought stress induced constitutive expression of HSPs and chaperons helps in cushioning intracellular proteins against denaturation, thereby preserving their functional confirmation [19]. Taken collectively, this discussion can reveal that enhanced cellular redox homeostasis is essential for plants to tolerate drought stress.

3.5. Carbohydrate Metabolism and Cell Growth Promotion Are Vital for Seedlings Survival under Drought

Carbohydrate (CHO) metabolism is at the center of bio-molecular metabolism; substrates participating in CHO breakdown offer the important saccharides and energy that the cell requires [3,20]. Additionally, the essential expression profile changes effected to the CHO metabolism related genes may induce positive feedback and corresponding adjustment in plants adapting to drought stress [3]. In the current study, our GO term enrichment analysis (under the biological process (BP) category) revealed that GO:0008152 (metabolic process), GO:0009987 (cellular process), and GO:0065007 (biological regulation) were the top most enriched terms in the tolerant line YE8112 (TC_TD) specific DEGs (Table S9). Further analysis of these DEGs showed that 37 genes were overlapping in these three top GO terms. We then considered these genes central to better drought stress tolerance of inbred line YE8112. Among these 37 DEGs, some genes involved in starch synthesis, such as granule-bound starch synthase (Zm00001d027242) and beta-amylase (Zm00001d029154) were up-regulated in the tolerant line YE8112 after drought stress treatment (Table 4); this contributed to enhanced CHO reserves.
Cell-wall metabolism related genes were also up-regulated in the tolerant line YE8112 in response to drought stress exposure. Among these were BETA EXPANSIN 7 (Zm00001d029906), TRICHOME BIREFRINGENCE-LIKE 20 (TBL20, Zm00001d017918), and putative O-Glycosyl hydrolase (Zm00001d038049). Beta-expansins, together with alpha-expansins, are cell wall proteins that have become widely acknowledged as key regulators of cell wall modifications, particularly during tissue elongation [65,66]. TBL20 gene participates in secondary wall cellulose synthesis and deposition, probably by influencing the esterification form of pectic polymers [67]. In Oryza sativa L., the O-Glycosyl hydrolases have been implicated in plant adaptation processes, including response to biotic and abiotic stresses, phytohormones activation, cell wall remodeling, and lignification [68]. Taken collectively, the up-regulation of cell-wall-related genes could indicate that cell-wall adjustment may be a protective strategy of tolerant line YE8112 against moisture deficit, and; thus, an indispensable adaptive response to drought stress in maize. This observation resonated well with previous findings [3,69].
Furthermore, proteins involved in cell growth promotion were up-regulated in response to drought stress, including late hypocotyl elongation protein ortholog 1 (LHY, Zm00001d024546) and protein light-dependent short hypocotyls 5 (LSH5, Zm00001d046998) (Table 4). In plants, the LHY gene is involved in circadian rhythms coordination, a critical process modulating leaf movements, stomata opening, hypocotyl elongation, flower initiation, and gene expression [70]. The LSH5 gene has been designated a probable transcription regulator that coordinate plant development in Arabidopsis thaliana, through promoting cell growth in response to light (www.uniprot.org/uniprot/, accessed on 5 November 2018). The up-regulation of these genes may suggest that the tolerant maize line seedlings battle drought stress by prioritizing cell growth in the hypocotyl so that they get well-established in the shortest possible time. Overall, enhanced carbohydrate metabolism could have resulted in increased energy production and cell elongation, which assisted drought stressed plants to maintain normal growth under adverse conditions, whereas cell wall remodeling could have helped the cells to conserve water, thereby helping YE8112 seedlings to better adapt to water deficit conditions [69].

3.6. Protein Ubiquitination Plays a Significant Role in Drought Stress Response Regulation

Protein ubiquitination has been widely acknowledged as a central regulator of stress responsive transcription factors and other regulatory proteins, effectually contributing to abiotic stress adaptation [69,71,72]. Protein ubiquitination, via the ubiquitin-proteasome system (UPS), acts as a signal for selective protein degradation [73]. The UPS functions in the efficient perception of abiotic stresses and modulation of the downstream responses. It achieves this through suppression of certain stress signaling pathways during normal non-stress conditions, blocking negative stress signal response regulators, or attenuating the signal pathway once the stress has terminated [74]. In the current study, among the tolerant line YE8112 specific DEGs, several genes encoding proteins involved in ubiquitination were up-regulated, including Probable BOI-related E3 ubiquitin-protein ligase 2 (Zm00001d003850), RING-H2 finger protein ATL3F (Zm00001d040639) and cysteine protease 1 (Zm00001d013261) among others (Table 4). Moreover, among the SD_TD specific DEGs, there were numerous (above 90) ubiquitin-related and several RING zinc finger domain super family protein related genes that were up-regulated in response to drought stress (Table S6). The E3 ubiquitin ligases have been identified as key elements in nuclear protein homeostasis during plant stress responses. Particularly, they participate in transcription-dependent resistance to high temperature and drought stress [75]. The RING-H2 finger protein and cysteine proteases play a critical housekeeping function by removing damaged, abnormal, or misfolded proteins, as well as controlling the accumulation of certain regulatory proteins during abiotic stress [76]. From this discussion, we can herein infer that the protein turnover mechanism effected by these up-regulated protein ubiquitination-related genes is vital for coordinating the cellular crosstalk between stress and hormone signaling, effectively contributing to drought stress adaptation.

3.7. Overlapping Drought Responsive DEGs between Inbred Lines under Drought Stress

Our key observation that the two overlapping genes, viz., MYB-related TF96 and pyrophosphate fructose-6-phosphate 1-phosphotransferase subunit alpha 1 (PFP ALPHA 1) were up-regulated in tolerant line YE8112, but down-regulated in sensitive line MO17 (Table 6), offered us some clue as to some of the key differences in drought tolerance between the two lines. MYB transcription factor (TF) constitutes one of the largest TF families that coordinate plant defense responses to various stresses, phytohormone signaling, and various metabolic processes [77]. Specifically, MYB96 participates in cuticular wax biosynthesis under drought stress, consequently leading to enhanced plant tolerance to drought by reducing stomatal opening [78]. Further, in Arabidopsis thaliana, MYB96 has been identified as a molecular link that mediates ABA-auxin cross talk regulating lateral root growth under drought stress conditions, thereby offering an adaptive strategy under such conditions [79]. Our results suggest that, in response to drought stress, the tolerant line YE8112 activated the MYB TF gene to modulate ABA-signaling, the defense response, and cell-wall modification. The invigorated ABA signaling cascade enhanced the seedlings’ stress signal perception and transduction, as well as lateral root growth for better scavenging of water and nutrients. Enhanced cell-wall modification, through differentiation and stomatal regulation, offered the YE8112 seedlings better adaptation to drought stress as compared to the sensitive line MO17.
PFP ALPHA 1 is the regulatory subunit of pyrophosphate fructose-6-phosphate 1-phosphotransferase (PFP), and is involved in the glycolysis pathway. PFP is stimulated by Fru-2,6-P2 allosterically [80]. Fru-2,6-P2 is a signal metabolite, and in Nicotiana tabacum L. leaf tissues, it critically regulates photosynthetic carbon metabolism; contributing to the coordination of sucrose synthesis, as well as to the control of photosynthate partitioning between sucrose and starch [81]. This may suggest that PFP and Fru-2,6-P2 functions overlap in plant stress responses [82]. In Daucus carota L. plants, PFP has been implicated in mobilization of energy reservoirs upon cold and drought stresses, by promoting the re-synthesis of transportable sucrose via gluconeogenesis from accumulated starch in taproots [81]. Here, we submit that the up-regulation of PFP ALPHA 1 in drought stressed YE8112 seedlings may have enhanced better stress signal perception, carbon metabolism, and efficient CHO partitioning, as well as energy mobilization to different cell and plant parts.

3.8. Metabolic Pathways Significantly Enriched under Drought Stress Conditions

Analysis of metabolic pathways enrichment contributes to the systems-biology approach of understanding stress biology of plants [83]. Here, our KEGG pathway enrichment analysis revealed that the nitrogen metabolism pathway was the most significantly (p < 0.01) enriched in the tolerant line YE8112 under drought stress conditions (Figure 5A). Interestingly, the same pathway was also significantly enriched in the SD_TD specific DEGs, suggesting that it plays a key role in drought stress response. Nitrogen metabolism pathway is the most basic and important physiological metabolic process during plants’ growth period; it directly influences the formation of cellular components and regulation of cellular activities, as well as the transformation of photosynthetic products, mineral nutrient absorption, and the process of protein synthesis [43,84]. Moreover, inorganic-to-organic nitrogen conversion process is a vital protective mechanism employed by plants against ammonia toxicity [84]. A transcriptome study on Pugiomium cornutum L.—a xerophytic plant species adapted to sandy and desert conditions—revealed the nitrogen metabolism pathway is significantly correlated to drought response [36]. Further, the nitrogen metabolism pathway has been revealed as a key response pathway in salt stress [84], suggesting its importance in abiotic stress responses.
Plant hormone signal transduction, phenylpropanoid biosynthesis, and phenylalanine metabolism pathways were the top most significantly enriched in the SD_TD specific DEGs (Figure 5B). Plant hormone signaling pathways participate in abiotic stress adaptation through various manners, including ubiquitin-mediated proteolysis [72] or ABA-mediated response [13]. Phenylalanine ammonia lyase (PAL) takes part in the initial stage of phenylpropanoid metabolism, which is the first step of the secondary metabolites (flavonoids, phenylpropanoids, and lignin) biosynthesis [85]. The phenylpropanoid metabolism pathway serves to provide these secondary metabolites, which then contribute to stress tolerance [72]. A coordinated reaction of the genes and pathways involved in secondary metabolite biosynthesis is; thus, considered vital to improved drought stress tolerance in plants.
Comparatively, in the sensitive line MO17, the ribosome pathway was the most significantly enriched in response to drought stress (Figure 5C). Ribosomes are the site for protein synthesis, one of the fundamental biological processes that is influenced by abiotic stress [72], and hence the pathway was enriched. However, the drought susceptibility of the sensitive line MO17 may be emanating from its nitrogen metabolism incompetency, probably due to inefficient nitrate reduction or poor photosynthetic products transformation and mobilization. Additionally, MO17 seedlings’ lavish production of redundant proteins (as evidenced by ribosome pathway getting enriched) may have weakened plants’ thriving ability under drought stressed conditions. Contrastingly, it may be probable that the tolerant line YE8112 may have decreased the production of redundant proteins as an adaptive response to conserve energy and enable the plants to overcome the effects of the imposed stress [86,87]. We refer you to Figure S5 for a full pictorial view of the top most significantly enriched pathways in the two inbred lines.

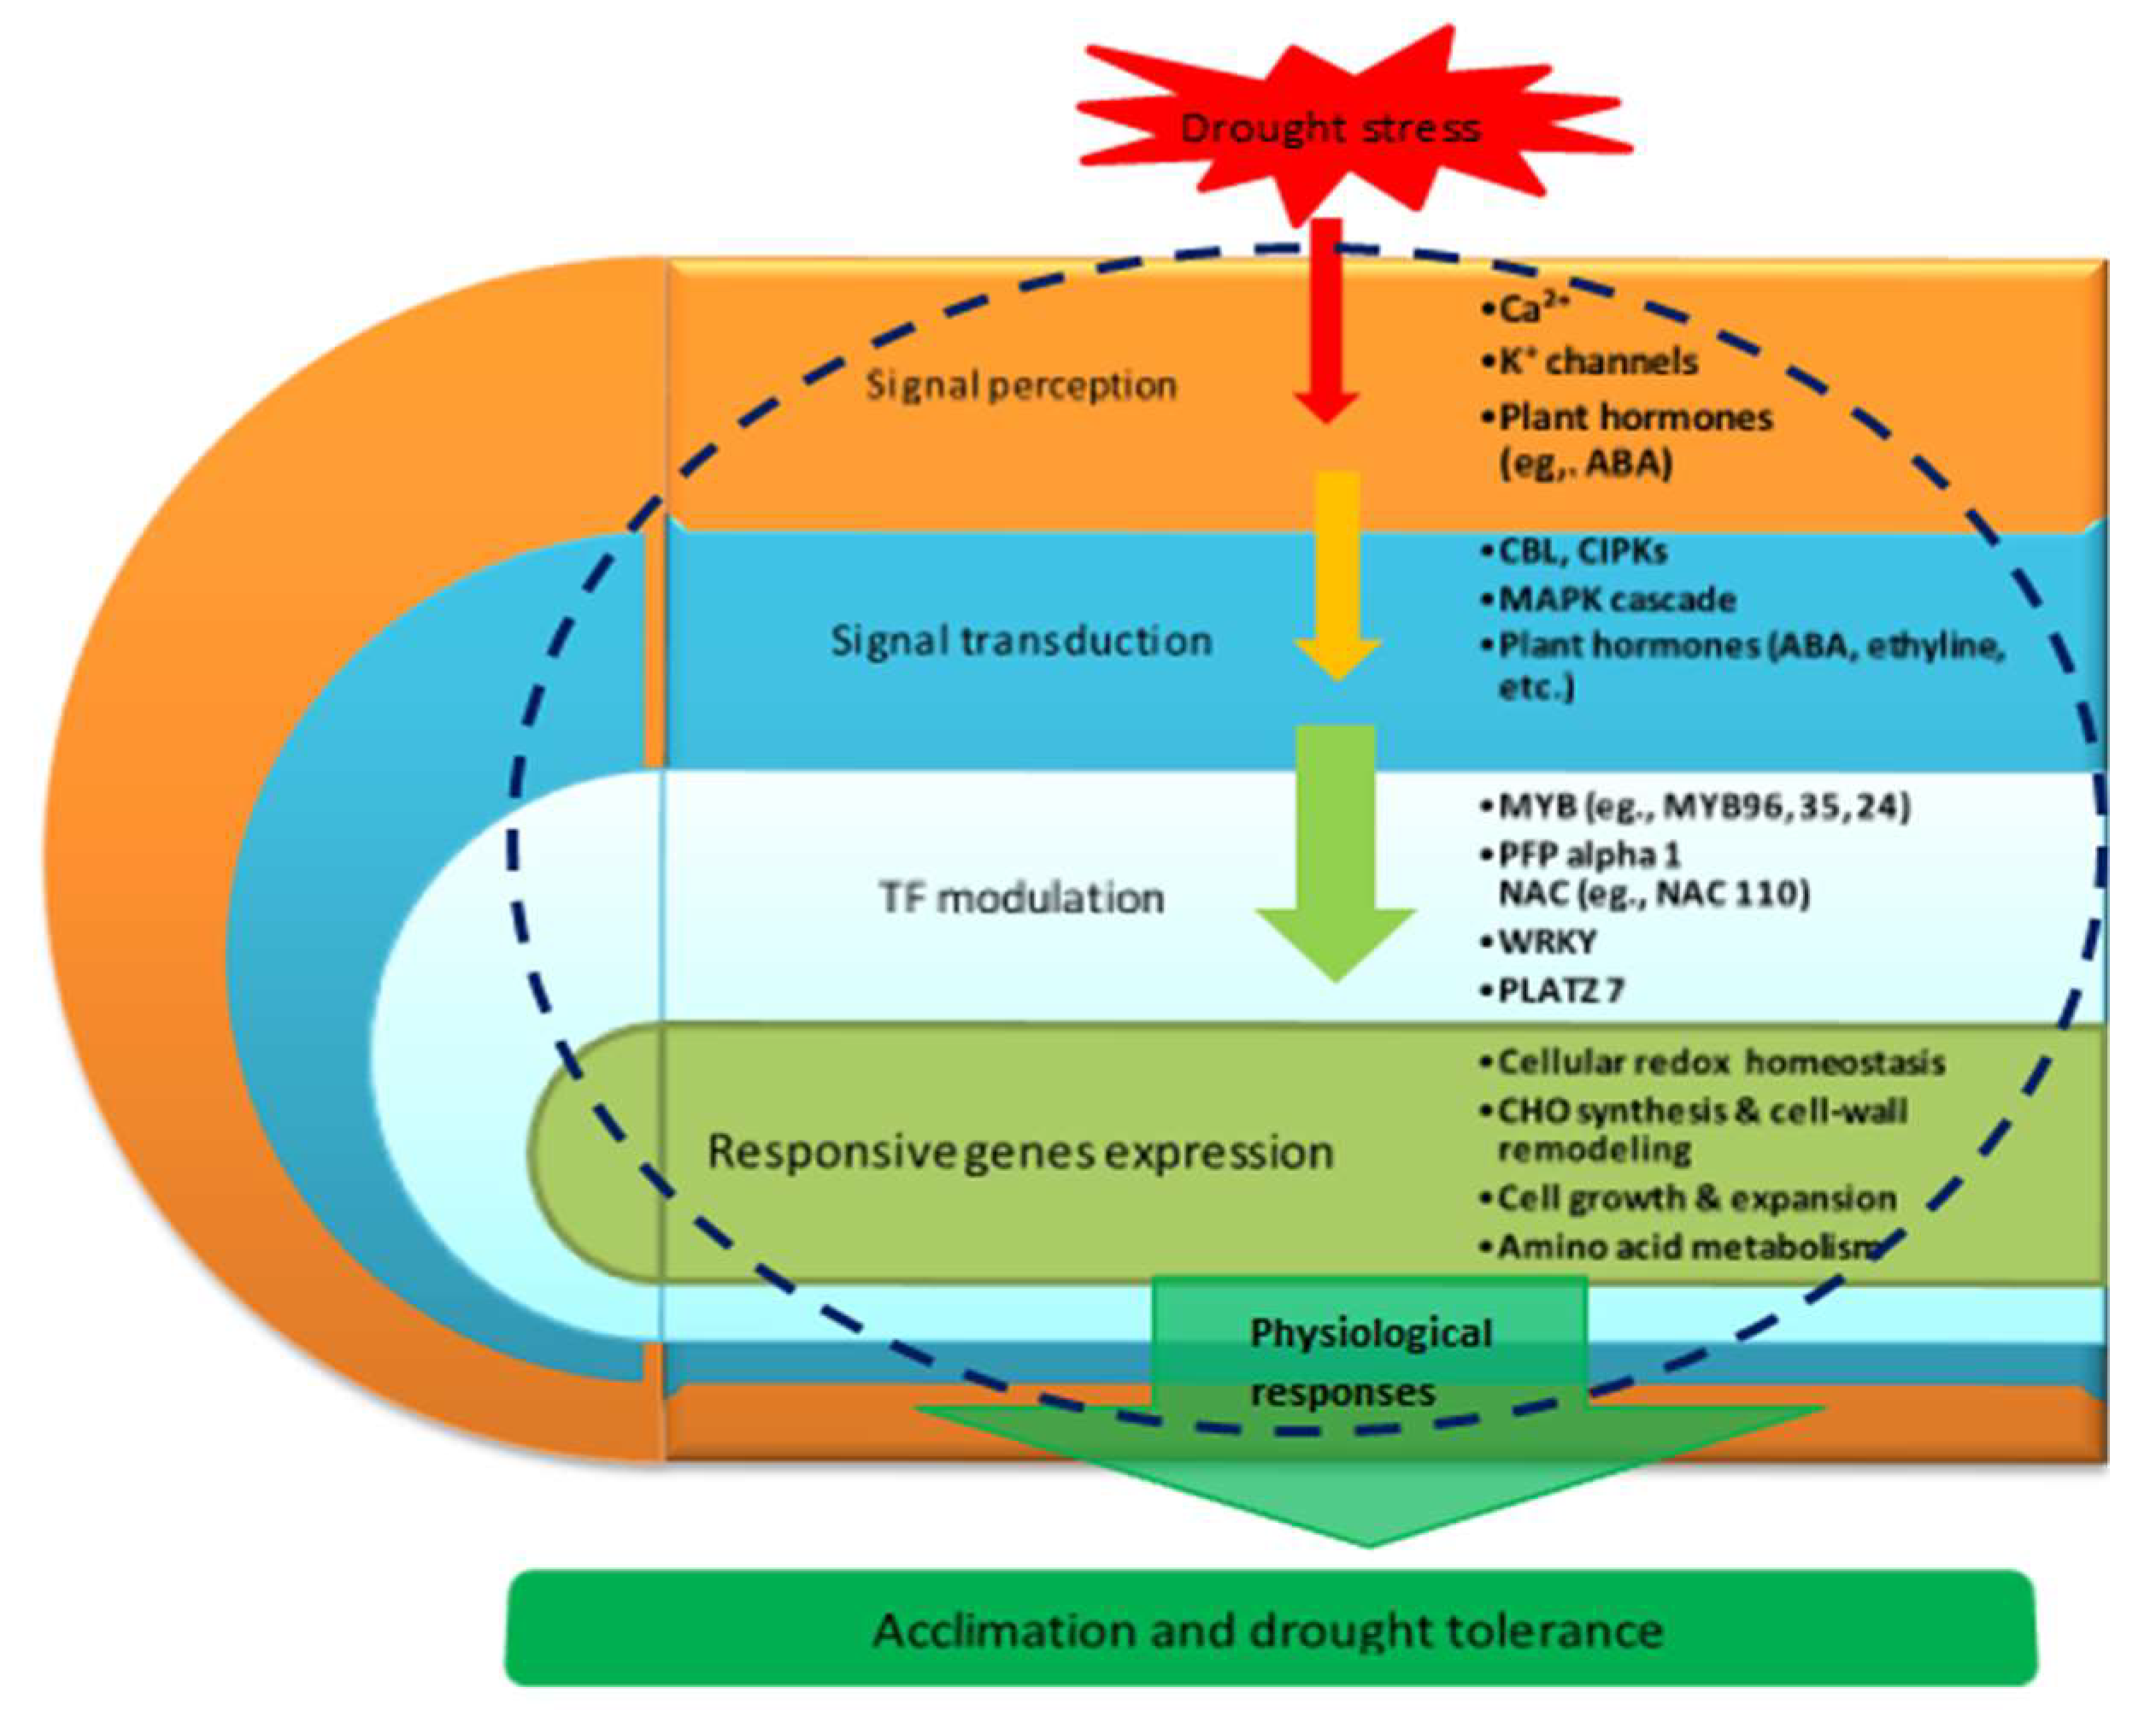
3.9. Proposed Molecular Model of Maize Seedling Drought Stress Tolerance

Based on our main findings of the key drought responsive DEGs and their associated pathways/networks, and the relevant published citations contained in this study, we have developed a molecular model for drought stress tolerance in maize seedlings as shown in Figure 7.

4. Materials and Methods

4.1. Plant Materials and Drought Stress Treatment

The two maize inbred lines contrasting in drought stress sensitivity (tolerant YE8112 and sensitive MO17) used in this experiment were provided by our lab (North China Key Laboratory for Crop Germplasm Resources of Education Ministry, Hebei Agricultural University, Baoding, China). Detailed information on the selection of these inbred lines, seedlings establishment, and drought stress treatment is contained in our most recent study [32]. Flag leaves from the control and drought stress treated plants were collected seven days post drought treatment exposure for transcriptomic analysis. The collected samples were immediately liquid-nitrogen frozen prior to storage under an extreme low temperature (−80 °C) conditions awaiting subsequent analyses; each treatment had three replications.

4.2. Physiological and Phenotypic Characterizations

As already presented in our most recent paper [32], we analyzed some physiological and phenotypic responses of both inbred lines to drought treatment (control and water-deficit) conditions. Seedling leaf relative water content (RWC) was estimated as per the protocol of Galmés et al. [88]. Additionally, leaf peroxidase (POD) activity was estimated by Han’s guaiacol method [89]. The thiobarbituric acid (TBA) method [90] was used to determine the level of lipid peroxidation (MDA content) in the leaf samples, whereas proline content was measured using nin-hydrin as per the protocol of Bates et al. [91]. Phenotypic responses were analyzed by visual observation.

4.3. Total RNA Extraction, cDNA Library Construction, and Transcriptome Sequencing

Maize inbred lines YE8112 (drought-tolerant) and MO17 (drought-sensitive) were grown according to the method described [32]. Total RNA of the leaf samples (control and drought-exposed second-upper-most-leaf samples), which had been stored at −80 °C, was isolated using Trizol reagent (Invitrogen, Carlsbad, CA, USA) following the manufacturer’s protocols. To remove genomic DNA, the RNA was purified and concentrated using a RNeasy column (QIAGEN, Pudong, Shanghai, China). RNA degradation and contamination (integrity) was monitored on 1% agarose gels. RNA purity and concentration were checked using the NanoDrop 1000 spectrophotometer (NanoDrop Technologies Inc., Wilmington, DE, USA). The cDNA library construction and sequencing (on an Illumina Hiseq Xten platform, San Diego, CA, USA) were conducted by Novogene Bioinformatics Technology Co., Ltd. (Beijing, China).

4.4. Sequencing Reads Processing, Mapping, and Gene Expression Quantification

Initial processing of raw data/reads (FASTQ format) was achieved through in-house PERL scripts. Basically, this stage involves trimming raw data by removing some reads containing adaptor sequences, ploy-N-containing reads, and low-quality sequences in order to obtain clean data (clean reads). Simultaneously, quality (Phred quality) scores for assessing sequencing accuracy were calculated, including Q20 (99% base call accuracy), Q30 (99.9% base call accuracy), as well as the GC content and sequence duplication level of the clean data. Consequently, high quality clean data was used in all the subsequent analyses. Qualified clean reads were then mapped to the maize reference genome sequence (B73 RefGen_v3) using a spliced aligner Tophat 2.0.12 software [92]. Only reads with a perfect match or one mismatch were further analyzed and annotated based on the reference genome. In addition, HTSeq v 0.6.1 software [93] was used to count the read numbers that were mapped to each gene. Quantification of gene expression levels were estimated by reads per kilobase of transcript per million mapped reads (RPKM = otal exon reads/mapped reads in million × exon length in kb) for each gene and log2 transformed [33]. After the aligned reads had been analyzed using Cufflinks v2.2.1 [34], the assembled transcripts were further filtered using the FPKM value > 1.

4.5. Functional Annotation of Gene Transcripts

For functional annotation, the assembled gene transcripts that might search against the following public databases: non-redundant protein sequence database (Nr) (https://www.ncbi.nlm.nih.gov/); Swiss-Port (a manually annotated and reviewed protein sequence database) (https://web.expasy.org/docs/swiss-prot); Clusters of Orthologous Groups (COG) (https://www.ncbi.nlm.nih.gov/COG/); and the Kyoto Encyclopedia of Genes and Genomes (KEGG) (http://www.genome.jp/kegg) were scavenged using the BLAST (basic local alignment search) search program [94]. Gene ontology (GO) terms were assigned to each gene transcript using the agriGO (http://systemsbiology.cau.edu.cn/agriGOv2/#) web-based program [37]. The threshold for significantly enriched GO terms was set at p-value < 0.05, FDR < 0.001.

4.6. Differentially Expressed Genes (DEGs) Library Construction and Differential Analysis

The differentially expressed genes (DEGs) sequencing libraries were constructed as per the expected standards of the transcriptome sequencing libraries. Anders’ [95] DESeq R software package (1.10.1) was employed to execute gene differential expression analysis of two experimental groups/conditions, based on the negative binomial distribution model [96]. The method uses student t-test to calculate the p-values, and the threshold level was set at p-value ≤ 0.05. The resulting p-values were adjusted using the Benjamini and Hochberg’s [97] approach for controlling the false discovery rate. Finally, DEGs with an FDR < 0.001 |log2 FC| were assigned as differentially expressed.

4.7. Gene Ontology (GO) Enrichment and KEGG Pathway Enrichment Analyses

To study the biological significance of the DEGs, the agriGO web-based program (http://systemsbiology.cau.edu.cn/agriGOv2/#) [37] was used to perform GO enrichment analysis of the DEGs. The KEGG (http://www.genome.jp/kegg/) database [98] was used to analyze the functional involvement of DEGs in various metabolic pathways. Additionally, the KOBAS 2.0 web server (http://kobas.cbi.pku.edu.cn/) [99] was used to test the statistical enrichment of DEGs in KEGG pathways [39]. Using hypergeometric test, based on the Student’s t-test, all KEGG pathways that had a q value < 0.01 were considered to be significantly enriched.

4.8. Quantitative Real Time-PCR (qRT-PCR) Analysis

To validate the assembled sequences and the expression profiles obtained by illumina RNA-seq, quantitative real-time PCR (qRT-PCR) was performed. Twenty DEGs were randomly selected and gene-specific primers were designed for qRT-PCR using Primer Premier 5 Designer (Premier Biosoft International, Palo Alto, CA, USA). Total RNA was isolated from seedling leaves as already described above in Section 4.3. Independent RNA from YE8112 and MO17 inbred lines leaf samples, and from control and drought-stress conditions was prepared for qRT-PCR analysis. HiFiscript cDNA Synthesis Kit (CWBIO, Beijing, China) was used as per the manufacturer’s protocol to perform cDNA synthesis, with 1 µg of total RNA being reverse-transcribed in 25 µL (total volume) reaction. The qRT-PCR analysis was carried out using Bestar® SYBR Green qPCR Mastermix (DBI® Bioscience, Ludwigshafen, Germany) in a Bio-Rad iQ5 thermo cycler (Bio-RAD, Hercules, CA, USA). The thermal profile for amplification was: 2 min at 95 °C; followed by 35 cycles, each consisting of 95 °C for 15 s, 55 °C for 30 s, and 72 °C for 15 s. The maize GAPDH (accession no. X07156) gene was employed as the endogenous control (forward primer: 5′-ACTGTGGATGTCTCGGTTGTTG-3′ and reverse primer: 5′-CCTCGGAAGCAGCCTTAATAGC-3′). Each PCR reaction (total volume of 20 µL) contained 10 µL of SYBR Green mix (TOYOBO, Osaka, Japan), 0.5 µL of each primer (50 pmol), and 2 µL of template cDNA; with all reactions being performed in triplicate. We monitored primer specificity and stability by dissociation curve analysis and agarose gel electrophoresis on a 3% agarose gel. Livak and Schmittgen’s [100] 2−ΔΔCt method was used to calculate the relative mRNA abundance in samples. We used SPSS statistical package (version 19.0, SPSS Institute Ltd., Armonk, NY, USA) to perform Pearson correlation coefficient analysis of RNA-seq versus qRT-PCR data.

4.9. Statistical Analysis of Physiological Data

We used the SPSS software package (version 19.0; SPSS Institute Ltd., Armonk, NY, USA) to conduct the statistical analysis of physiological data by Fisher’s protected least significant differences (PLSD) test. The level of significance was set at p ≤ 0.05.

5. Conclusions

In this study, we have comprehensively compared the leaf transcriptome and physiological responses of drought-tolerant YE8112 and drought-sensitive MO17 maize inbred line seedlings after a seven-day drought exposure period. Resultantly, YE8112 seedlings maintained comparatively higher leaf relative water and proline contents, alongside increased peroxidase activity, but decreased MDA content, than MO17 seedlings. Using an RNA-seq-based approach, we mined out four critical sets of drought responsive DEGs, including 80 exclusive to YE8112, five DEGs of YE8112 also regulated in SD_TD, and four overlapping DEGs between the two inbred lines, among others. In drought-stressed YE8112, the DEGs were predominantly associated with the nitrogen metabolism, carbon metabolism, and amino-acid biosynthesis pathways, whilst those in MO17 were enriched in the ribosome pathway. More crucially, drought-responsive genes in tolerant line YE8112 were mainly implicated in stress signal transduction; cellular redox homeostasis maintenance; MYB, NAC, WRKY, and PLATZ transcriptional factor regulated; carbohydrate synthesis and cell wall remodeling; and protein ubiquitination processes. Our results enhance further elucidation of the molecular networks mediating drought tolerance, as well as providing foundational basis for further targeted cloning and downstream analysis of the identified specific individual genes.

Supplementary Materials

Supplementary materials can be found at https://www.mdpi.com/1422-0067/20/6/1268/s1.

Author Contributions

Conceptualization, T.Z., S.L., and H.D.; data curation, T.Z., S.L., and H.D.; formal analysis, T.Z., S.L., X.W., Guo Liu, and H.D.; funding acquisition, H.D.; investigation, T.Z., S.L., X.W., G.L., J.H., A.D., and T.Z.; methodology, T.Z., S.L., and H.D.; project administration, H.D.; resources, H.D.; software, S.L. and X.W.; supervision, H.D.; validation, T.Z., S.L., X.W., G.L., J.H., A.D., Y.Y., and H.D.; visualization, T.Z., S.L. and X.W.; writing—original draft, T.Z. and S.L.; writing—review and editing, T.Z., S.L., X.W., G.L., J.H., A.D., Y.Y., and H.D.

Funding

This research was supported by the National Key Research and Development Project of China (Selection and Efficient Combination Model of Wheat and Maize Water Saving, High Yield and High-Quality Varieties) (Grant No. 2017YFD0300901).

Conflicts of Interest

The authors declare that they have no conflicts of interest. Furthermore, the founding sponsors had no role in the design of the study; in the collection, analyses, or interpretation of data; in the writing of the manuscript, and in the decision to publish the results.

Abbreviations

ABAAbscisic acid
ABF/AREBABA-responsive element binding factor/ABA-responsive element binding
Ca2+Calcium signals receptors/messengers
CBLCalcineurin B-like
CDPKsCalcium dependent protein kinases
CIPKsCBL-interacting protein kinases
DEGsDifferentially expressed genes
DREB/CBFDehydration responsive element binding/C-repeat binding factor
ENTH/ANTH/VHSEpsin N-terminal homology/AP180 N-terminal homology/Vps27, Hrs and STAM
GOGene ontology
HSPsHeat shock proteins
K+Potassium channels signal receptors
KEGGKyoto Encyclopedia of Genes and Genomes
LEA Late embryogenesis abundant proteins
LHYLate hypocotyl elongation protein
LSH5Light dependent short hypocotyls 5
MAPKMitogen-activated protein kinases
MDAMalondialdehyde
MYBMyeloblastosis oncogene
NACNAM, ATAF1/2, and CUC2 domain proteins
PFP alpha 1Pyrophosphate fructose-6-phosphate 1-phosphotransferase subunit alpha 1
PLATZ Plant AT-rich sequence and zinc binding protein
PODPeroxidases
qRT-PCRQuantitative real-time polymerase chain reaction
RNA-seq RNA sequencing
ROSReactive oxygen species
SnRK2SNF1-related kinase 2
SODSuperoxide dismutase
TBL20Trichome birefringence-like 20
TFTranscription factor
TRThioredoxin reductase
WRKY TF family denoted by protein domain composed of a conserved WRKYGQK motif and a zinc-finger domain

References

  1. Ghatak, A.; Chaturvedi, P.; Weckwerth, W. Cereal crop proteomics: Systemic analysis of crop drought stress responses towards marker-assisted selection breeding. Front. Plant Sci. 2017, 8, 757. [Google Scholar] [CrossRef] [PubMed]
  2. Miao, Z.; Han, Z.; Zhang, T.; Chen, S.; Ma, C. A systems approach to spatio-temporal understanding of the drought stress response in maize. Sci. Rep. 2017, 7, 6590. [Google Scholar] [CrossRef] [PubMed]
  3. Min, H.; Chen, C.; Wei, S.; Shang, X.; Sun, M.; Xia, R.; Liu, X.; Hao, D.; Chen, H.; Xie, Q. Identification of drought tolerant mechanisms in maize seedlings based on transcriptome analysis of recombination inbred lines. Front. Plant Sci. 2016, 7, 1080. [Google Scholar] [CrossRef] [PubMed]
  4. Wu, S.; Ning, F.; Zhang, Q.; Wu, X.; Wang, W. Enhancing omics research of crop responses to drought under field conditions. Front. Plant Sci. 2017, 8, 174. [Google Scholar] [CrossRef] [PubMed]
  5. Feller, U.; Vaseva, I.I. Extreme climatic events: Impacts of drought and high temperature on physiological processes in agronomically important plants. Front. Environ. Sci. 2014, 2, 39. [Google Scholar] [CrossRef]
  6. IPCC. Climate Change 2014: Synthesis Report; Contribution of Working Groups I, II and III to the Fifth Assessment Report of the Intergovernmental Panel on Climate Change; Pachauri, R.K., Meyer, L.A., Eds.; IPCC: Geneva, Switzerland, 2014; 151p. [Google Scholar]
  7. Andjelkovic, V. Introductory Chapter: Climate Changes and Abiotic Stress in Plants; IntechOpen Publishers: London, UK, 2018; p. 4. [Google Scholar]
  8. Thirunavukkarasu, N.; Sharma, R.; Singh, N.; Shiriga, K.; Mohan, S.; Mittal, S.; Mittal, S.; Mallikarjuna, M.G.; Rao, A.R.; Dash, P.K.; et al. Genomewide expression and functional interactions of genes under drought stress in maize. Int. J. Genet. 2017, 2017, 2568706. [Google Scholar] [CrossRef]
  9. Zheng, J.; Fu, J.; Gou, M.; Huai, J.; Liu, Y.; Jian, M.; Huang, Q.; Guo, X.; Dong, Z.; Wang, H.; et al. Genome-wide transcriptome analysis of two maize inbred lines under drought stress. Plant Mol. Biol. 2010, 72, 407–421. [Google Scholar] [CrossRef]
  10. Yin, X.G.; Jørgen, E.O.; Wang, M.; Kersebaum, K.-C.; Chen, H.; Baby, S.; Öztürk, I.; Chen, F. Adapting maize production to drought in the northeast farming region of China. Eur. J. Agron. 2016, 77, 47–58. [Google Scholar] [CrossRef]
  11. Maiti, R.K.; Maiti, L.E.; Sonia, M.; Maiti, A.M.; Maiti, M.; Maiti, H. Genotypic variability in maize (Zea mays L.) for resistance to drought and salinity at the seedling stage. J. Plant Physiol. 1996, 148, 741–744. [Google Scholar] [CrossRef]
  12. Li, Z.; Xu, W.; Xue, B.; Cao, P. Discuss on evaluating method to drought-resistance of maize in seedling stage. J. Maize Sci. 2004, 12, 73–75. [Google Scholar]
  13. Shan, X.; Li, Y.; Jiang, Y.; Jiang, Z.; Hao, W.; Yuan, Y. Transcriptome profile analysis of maize seedlings in response to high-salinity, drought and cold stresses by deep sequencing. Plant Mol. Biol. Rep. 2013, 31, 1485–1491. [Google Scholar] [CrossRef]
  14. Harb, A. Identification of candidate genes for drought stress tolerance. In Drought Stress Tolerance in Plants; Hossain, M.A., Wani, S.H., Bhattacharjee, S., Burritt, D.J., Tran, L.-S.P., Eds.; Springer International Publishing: Cham, Switzerland, 2016; Volume 2. [Google Scholar]
  15. Farooq, M.; Wahid, A.; Kobayashi, N.; Fujita, D.; Basra, S.M.A. Plant drought stress: Effects, mechanisms and management. In Sustainable Agriculture; Springer: Dordrecht, The Netherlands, 2009; Volume 29, pp. 185–212. [Google Scholar]
  16. Hanin, M.; Brini, F.; Ebel, C.; Toda, Y.; Takeda, S.; Masmoudi, K. Plant dehydrins and stress tolerance versatile proteins for complex mechanisms. Plant Signal. Behav. 2011, 6, 1503–1509. [Google Scholar] [CrossRef] [PubMed]
  17. Kosova, K.; Vitamvas, P.; Prasil, I.T. Wheat and barley dehydrins under cold, drought, and salinity—What can LEA-II proteins tell us about plant stress response? Front. Plant Sci. 2014, 5, 343. [Google Scholar] [CrossRef] [PubMed]
  18. Wang, W.; Vinocur, B.; Shoseyov, O.; Altman, A. Role of plant heat-shock proteins and molecular chaperons in the abiotic stress response. Trends Plant Sci. 2004, 9, 244–252. [Google Scholar] [CrossRef] [PubMed]
  19. Hasanuzzaman, M.; Nahar, K.; Mahabub Alam, M.; Roychowdhury, R.; Fujita, M. Physiological, biochemical, and molecular mechanisms of heat stress tolerance in plants. Int. J. Mol. Sci. 2013, 14, 9643–9684. [Google Scholar] [CrossRef] [PubMed]
  20. Zhang, X.; Lei, L.; Lai, J.; Zhao, H.; Song, W. Effects of drought stress and water recovery on physiological responses and gene expression in maize seedlings. BMC Plant Biol. 2018, 18, 68. [Google Scholar] [CrossRef]
  21. Singh, D.; Laxmi, A. Transcriptional regulation of drought response: A tortuous network of transcriptional factors. Front. Plant Sci. 2015, 6, 895. [Google Scholar] [CrossRef] [PubMed]
  22. Mun, B.G.; Lee, S.U.; Park, E.J.; Kim, H.H.; Hussain, A.; Imran, Q.M.; Lee, I.J.; Yun, B.W. Analysis of transcription factors among differentially expressed genes induced by drought stress in Populus davidiana. 3 Biotech 2017, 7, 209. [Google Scholar] [CrossRef]
  23. Wang, C.T.; Ru, J.N.; Liu, Y.W.; Yang, J.F.; Li, M.; Xu, Z.S.; Fu, J.D. The maize WRKY transcription factor ZmWRKY40 confers drought resistance in transgenic Arabidopsis. Int. J. Mol. Sci. 2018, 19, 2580. [Google Scholar] [CrossRef]
  24. Liu, X.; Li, X.; Li, W.; Li, M.; Liu, X. Analysis on difference for drought responses of maize inbred lines at seedling stage. J. Maize Sci. 2004, 12, 63–65. [Google Scholar]
  25. Bin, W.; Xinhai, L.; Muji, X. Genetic variation in fifty-three maize inbred lines in relation to drought tolerance at seedling stage. Sci. Agric. Sin. 2007, 40, 665–676. [Google Scholar]
  26. Wang, G.; Zhu, Q.G.; Meng, Q.W.; Wu, C.A. Transcript profiling during salt stress of young cotton (Gossypium hirsutum) seedlings via Solexa sequencing. Acta Physiol. Plant. 2012, 34, 107–115. [Google Scholar] [CrossRef]
  27. Luz, H.P.; Juan, D.R. RNA-seq in kinetoplastids: A powerful tool for the understanding of the biology and host-pathogen interactions. Infect. Genet. Evol. 2017, 49, 273–282. [Google Scholar] [CrossRef]
  28. Kakumanu, A.; Ambavaram, M.M.R.; Klumas, C.; Krishnan, A.; Batlang, U.; Myers, E.; Grene, R.; Pereira, A. Effects of drought on gene expression in maize reproductive and leaf meristem tissue revealed by RNA-seq. Plant Physiol. 2012, 160, 846–867. [Google Scholar] [CrossRef]
  29. Chen, Y.; Liu, Z.H.; Feng, L.; Zheng, Y.; Li, D.D.; Li, X.B. Genome-wide functional analysis of cotton (Gossypium hirsutum) in response to drought. PLoS ONE 2013, 8, e80879. [Google Scholar] [CrossRef]
  30. Nakashima, K.; Ito, Y.; Yamaguchi-Shinozaki, K. Transcriptional regulatory networks in response to abiotic stresses in Arabidopsis and grasses. Plant Physiol. 2009, 149, 88–95. [Google Scholar] [CrossRef]
  31. Zhang, T.; Huang, L.; Wang, Y.; Wang, W.; Zhao, X.; Zhang, S.; Zhang, J.; Fengyi, H.; Fu, B.; Li, Z. Differential transcriptome profiling of chilling stress response between shoots and rhizomes of Oryza longistaminata using RNA sequencing. PLoS ONE 2017, 12, e0188625. [Google Scholar] [CrossRef]
  32. Zenda, T.; Liu, S.; Wang, X.; Jin, H.; Liu, G.; Duan, H. Comparative proteomic and physiological analyses of two divergent maize inbred lines provide more insights into drought-stress tolerance mechanisms. Int. J. Mol. Sci. 2018, 19, 3225. [Google Scholar] [CrossRef]
  33. Mortazavi, A.; Williams, B.A.; McCue, K.; Schaeffer, L.; Wold, B. Mapping and quantifying mammalian transcriptomes by RNA-seq. Nat. Meth. 2008, 5, 621–628. [Google Scholar] [CrossRef]
  34. Trapnell, C.; Williams, B.A.; Pertea, G.; Mortazavi, A.; Kwan, G.; van Baren, M.J.; Salzberg, S.L.; Wold, B.J.; Pachter, L. Transcript assembly and quantification by RNA-seq reveals unannotated transcripts and isoform switching during cell differentiation. Nat. Biotechnol. 2010, 28, 511–515. [Google Scholar] [CrossRef]
  35. Trapnell, C.; Roberts, A.; Goff, L.; Pertea, G.; Kim, D.; Kelley, D.R.; Pimentel, H.; Salzberg, S.L.; Rinn, J.L.; Pachter, L. Differential gene and transcript expression analysis of RNA-seq experiments with TopHat and Cufflinks. Nat. Protoc. 2012, 7, 562–578. [Google Scholar] [CrossRef] [Green Version]
  36. Wang, P.; Wang, F.F.; Yang, J. De novo assembly and analysis of the Pugionium cornutum (L.) Gaertn. transcriptome and identification of genes involved in the drought response. Gene 2017, 626, 290–297. [Google Scholar] [CrossRef]
  37. Du, Z.; Zhou, X.; Ling, Y.; Zhang, Z.; Su, Z. agriGO: A GO analysis toolkit for the agricultural community. Nucleic Acids Res. 2010, 38, W64–W70. [Google Scholar] [CrossRef]
  38. Wang, H.; Wang, H.; Shao, H.; Tang, X. Recent advances in utilizing transcription factors to improve plant abiotic stress tolerance by transgenic technology. Front. Plant Sci. 2016, 7, 67. [Google Scholar] [CrossRef]
  39. Mao, X.; Cai, T.; Olyarchuk, J.G.; Wei, L.P. Automated genome annotation and pathway identification using the KEGG Orthology (KO) as a controlled vocabulary. Bioinformatics 2005, 21, 3787–3793. [Google Scholar] [CrossRef] [Green Version]
  40. Edmeades, G.O. Progress in Achieving and Delivering Drought Tolerance in Maize—An Update; ISAA: Ithaca, NY, USA, 2013; pp. 1–39. [Google Scholar]
  41. Bhanu, B.D.; Ulaganathan, K.; Shanker, A.R.; Desai, S. RNA-seq analysis of irrigated vs. water stressed transcriptomes of Zea mays cultivar Z59. Front. Plant Sci. 2016, 7, 239. [Google Scholar] [CrossRef]
  42. Moussa, H.R.; Abdel-Aziz, S.M. Comparative response of drought tolerant and drought sensitive maize genotypes to water stress. Aust. J. Crop Sci. 2008, 1, 31–36. [Google Scholar]
  43. Ahmadi, A.; Emam, Y.; Pessarakli, M. Biochemical changes in maize seedlings exposed to drought stress conditions at different nitrogen levels. J. Plant Nutr. 2010, 33, 541–556. [Google Scholar] [CrossRef]
  44. Marenduzzo, D.; Finan, K.; Cook, P.R. The depletion attraction: An underappreciated force driving cellular organization. J. Cell Biol. 2006, 175, 681–686. [Google Scholar] [CrossRef] [PubMed]
  45. Oliver, S.N.; Dennis, E.S.; Dolferus, R. ABA regulates apoplastic sugar transport and is a potential signal for cold-induced pollen sterility in rice. Plant Cell Physiol. 2007, 48, 1319–1330. [Google Scholar] [CrossRef]
  46. Barkla, B.; Pantoja, O. Plasma membrane and abiotic stress. Plant Cell Monogr. 2010, 19, 457–470. [Google Scholar] [CrossRef]
  47. Hyacinthe, L.G.; Philippe, F.; Domon, J.M.; Gillet, F.; Pelloux, J.; Rayon, C. Cell wall metabolism in response to abiotic stress. Plants 2015, 4, 112–166. [Google Scholar] [CrossRef]
  48. Sharma, P.; Jha, A.B.; Dubey, R.S.; Pessarakli, M. Reactive Oxygen Species, Oxidative Damage, and Antioxidative Defense Mechanism in Plants under Stressful Conditions. J. Bot. 2012, 10, 26. [Google Scholar] [CrossRef]
  49. Andrej, F.; Tatiana, B.; Gagan, P.; Robert, B.; Gerd, U.B.; Claudia, B.; Ludger, A.W. Early responses of mature arabidopsis thaliana plants to reduced water potential in the agar-based polyethylene glycol infusion drought model. J. Plant Physiol. 2017, 208, 70–83. [Google Scholar] [CrossRef]
  50. Mahajan, S.; Tuteja, N. Cold, salinity and drought stresses: An overview. Arch. Biochem. Biophys. 2005, 444, 139–158. [Google Scholar] [CrossRef]
  51. Chaves, M.M.; Flexas, J.; Pinheiro, C. Photosynthesis under drought and salt stress: Regulation mechanisms from whole plant to cell. Ann. Bot. 2009, 103, 551–560. [Google Scholar] [CrossRef]
  52. Jonak, C.; Kiergerl, S.; Ligterink, W.; Barker, P.J.; Huskisson, N.S.; Hirt, H. Stress signaling in plants: A mitogen-activated protein kinase pathway is activated by cold and drought. Plant Biology. Proc. Natl. Acad. Sci. USA 1996, 93, 11274–11279. [Google Scholar] [CrossRef]
  53. Dudhate, A.; Shinde, H.; Tsugama, D.; Liu, S.; Takano, T. Transcriptomic analysis reveals the differentially expressed genes and pathways involved in drought tolerance in pearl millet [Pennisetum glaucum (L.) R. Br]. PLoS ONE 2018, 13, e0195908. [Google Scholar] [CrossRef]
  54. Piao, H.L.; Xuan, Y.H.; Park, S.H.; Je, B.; Park, S.J.; Park, S.H.; Kim, C.M.; Huang, J.; Wang, G.K.; Kim, M.J.; et al. OsCIPK31, a CBL-interacting protein kinase is involved in germination and seedling growth under abiotic stress conditions in rice plants. Mol. Cells 2010, 30, 19–27. [Google Scholar] [CrossRef]
  55. Tai, F.; Yuan, Z.; Li, S.; Wang, Q.; Liu, F. ZmCIPK8, a CBL-interacting protein kinase, regulates maize response to drought stress. Plant Cell Tissue Organ Cult. 2016, 124, 59–469. [Google Scholar] [CrossRef]
  56. Kubilay, Y.; Zeki, K. Gene regulation network behind drought escape, avoidance and tolerance strategies in black poplar (Populus nigra L.). Plant Physiol. Biochem. 2017, 115, 183–199. [Google Scholar] [CrossRef]
  57. Shi, W.; Cheng, J.; Wen, X. Transcriptomic studies reveal a key metabolic pathway contributing to a well-maintained photosynthetic system under drought stress in foxtail millet (Setaria italica L.). PeerJ 2018, 6, e4752. [Google Scholar] [CrossRef] [PubMed]
  58. Bianchi, V.J.; Rubio, M.; Trainotti, L.; Verde, I.; Bonghi, C.; Martínez-Gómez, P. Prunus transcription factors: Breeding perspectives. Front. Plant Sci. 2015, 6, 443. [Google Scholar] [CrossRef] [PubMed]
  59. Zhang, J.Y.; Cruz de Carvalho, M.H.; Torres-Jerez, I.; Kang, Y.; Allen, S.N.; Huhman, D.V.; Tang, Y.; Murray, J.; Sumner, L.W.; Udvardi, M.K. Global reprogramming of transcription and metabolism in Medicago truncatula during progressive drought and after rewatering. Plant Cell Environ. 2014, 37, 2553–2576. [Google Scholar] [CrossRef] [PubMed]
  60. Yan, H.; Jia, H.; Chen, X.; Hao, L.; An, H.; Guo, X. The cotton WRKY transcription factor GhWRKY17 functions in drought and salt stress in transgenic Nicotiana benthamiana through ABA signalling and the modulation of reactive oxygen species production. Plant Cell Physiol. 2014, 55, 2060–2076. [Google Scholar] [CrossRef]
  61. Meyer, Y.; Siala, W.; Bashandy, T.; Riondet, C.; Vignols, F.; Reichheld, J.P. Glutaredoxins and thioredoxins in plants. Biochem. Biophys. Acta. 2008, 1783, 589–600. [Google Scholar] [CrossRef] [Green Version]
  62. Munns, R.; Tester, M. Mechanisms of salinity tolerance. Ann. Rev. Plant Biol. 2008, 59, 651–681. [Google Scholar] [CrossRef]
  63. Gill, S.S.; Tuteja, N. Reactive oxygen species and antioxidant machinery in abiotic stress tolerance in crop plants. Plant Physiol. Biochem. 2010, 48, 909–930. [Google Scholar] [CrossRef]
  64. Campbell, S.A.; Close, T.J. Dehydrins: Genes, proteins, and associations with phenotypic traits. New Phytol. 1997, 137, 61–74. [Google Scholar] [CrossRef]
  65. Reidy, B.; McQueen-Mason, S.; Nösberger, J.; Fleming, A. Differential expression of alpha- and beta-expansin genes in the elongating leaf of Festuca pratensis. Plant Mol. Biol. 2001, 46, 491–504. [Google Scholar] [CrossRef] [PubMed]
  66. Marowa, P.; Ding, A.; Kong, Y. Expansins: Roles in plant growth and potential applications in crop improvement. Plant Cell Rep. 2016, 35, 949–965. [Google Scholar] [CrossRef] [PubMed]
  67. Bischoff, V.; Selbig, J.; Scheible, W.R. Involvement of TBL/DUF231 proteins into cell wall biology. Plant Signal. Behav. 2010, 5, 1057–1059. [Google Scholar] [CrossRef] [Green Version]
  68. Opassiri, R.; Pomthong, B.; Onkoksoong, T.; Akiyama, T.; Esen, A.; Cairns, J.R.K. Analysis of rice glycosyl hydrolase family 1 and expression of Os4bglu l2 ß-glucosidase. BMC Plant Biol. 2006, 6, 33. [Google Scholar] [CrossRef]
  69. Zhang, C.; Shi, S. Physiological and proteomic responses of contrasting alfalfa (Medicago sativa L.) varieties to PEG-Induced osmotic stress. Front. Plant Sci. 2018, 9, 242. [Google Scholar] [CrossRef] [PubMed]
  70. Lu, X.S.; Knowles, S.M.; Andronis, C.; Ong, M.S.; Tobin, E.M. CIRCADIAN CLOCK ASSOCIATED 1 and LATE ELONGATED HYPOCOTYL function synergistically in the circadian clock of Arabidopsis. Plant Physiol. 2009, 50, 834–843. [Google Scholar] [CrossRef]
  71. Zhang, Z.; Li, J.; Liu, H.; Chong, K.; Xu, Y. Roles of ubiquitination-mediated protein degradation in plant responses to abiotic stresses. Environ. Exp. Bot. 2015, 114, 92–103. [Google Scholar] [CrossRef]
  72. Shinde, H.; Tanaka, K.; Dudhate, A.; Tsugama, D.; Mine, Y.; Kamiya, T.; Gupta, S.K.; Liu, S.; Takano, T. Comparative de novo transcriptomic profiling of the salinity stress responsiveness in contrasting pearl millet lines. Environ. Exp. Bot. 2018, 155, 619–627. [Google Scholar] [CrossRef]
  73. Serrano, I.; Campos, L.; Rivas, S. Roles of E3 ubiquitin-ligases in nuclear protein homeostasis during plant stress responses. Front. Plant Sci. 2018, 9, 139. [Google Scholar] [CrossRef]
  74. Lyzenga, W.J.; Stone, S.L. Abiotic stress tolerance mediated by protein ubiquitination. J. Exp. Bot. 2012, 63, 599–616. [Google Scholar] [CrossRef]
  75. Hu, X.; Wu, L.; Zhao, F.; Zhang, D.; Li, N.; Zhu, G.; Li, C.; Wang, W. Phosphoproteomic analysis of the response of maize leaves to drought, heat and their combination stress. Front. Plant Sci. 2015, 6, 298. [Google Scholar] [CrossRef]
  76. Sharma, M.; Pandey, A.; Pandey, G.K. Role of plant U-BOX (PUB) protein in stress and development. In Plant Stress, 7th ed.; Pandey, G.K., Ed.; Global Science Books: New Delhi, India, 2013; pp. 1–9. [Google Scholar]
  77. Lindemose, S.; O’Shea, C.; Jensen, M.K.; Skriver, K. Structure, function and networks of transcription factors involved in abiotic stress responses. Int. J. Mol. Sci. 2013, 14, 5842–5878. [Google Scholar] [CrossRef]
  78. Ambawat, S.; Sharma, P.; Yadav, N.R.; Yadav, R.C. MYB transcription factor genes as regulators for plant responses: An overview. Physiol. Mol. Biol. Plants 2013, 19, 307–321. [Google Scholar] [CrossRef]
  79. Seo, P.J.; Xiang, F.; Qiao, M.; Park, J.Y.; Lee, Y.N.; Kim, S.G.; Lee, Y.H.; Park, W.J.; Park, C.M. The MYB96 transcription factor mediates abscisic acid signaling during drought stress response in Arabidopsis. Plant Physiol. 2009, 151, 275–289. [Google Scholar] [CrossRef]
  80. Nielsen, T.H.; Rung, J.H.; Villadsen, D. Fructose-2,6-bisphosphate: A traffic signal in plant metabolism. Trends Plant Sci. 2004, 9, 556–563. [Google Scholar] [CrossRef]
  81. Scott, P.; Lange, A.J.; Pilkis, S.J.; Kruger, N.J. Carbon metabolism in leaves of transgenic tobacco (Nicotiana tabacum L.) containing elevated fructose 2,6-bisphosphate levels. Plant J. 1995, 7, 461–469. [Google Scholar] [CrossRef] [PubMed]
  82. Kovács, G.; Sorvari, S.; Scott, P.; Toldi, O. Pyrophosphate:fructose 6-phosphate 1-phosphotransferase operates in net gluconeogenic direction in taproots of cold and drought stressed carrot plants. Acta Biol. Szeged. 2006, 50, 25–30. [Google Scholar]
  83. Yadav, B.S.; Sing, A.K.; Kushwaha, S.K. Systems-based approach to the analyses of plant functions: Conceptual understanding, implementation and analysis. In Plant Bionformatics; Hakeem, K., Malik, A., Varda-Sukan, F., Ozturk, M., Eds.; Springer: Cham, Switzerland, 2017; pp. 107–133. [Google Scholar]
  84. Luo, M.; Zhao, Y.; Wang, Y.; Shi, Z.; Zhang, P.; Zhang, Y.; Song, W.; Zhao, J. Comparative proteomics of contrasting maize genotypes provides insights into salt-stress tolerance mechanisms. J. Proteome Res. 2018, 17, 141–153. [Google Scholar] [CrossRef]
  85. Verberne, M.C.; Budi Muljono, R.A.; Verpoorte, R. Salicylic acid biosynthesis. New Compr. Biochem. 1999, 33, 295–312. [Google Scholar] [CrossRef]
  86. Wahid, A.; Gelani, S.; Ashraf, M.; Foolad, M.R. Heat tolerance in plants: An overview. Environ. Exp. Bot. 2007, 61, 199–223. [Google Scholar] [CrossRef]
  87. Cui, D.; Wu, D.; Liu, J.; Li, D.; Xu, C.; Li, S.; Li, P.; Zhang, H.; Liu, X.; Jiang, C.; et al. Proteomic analysis of seedling roots of two maize inbred lines that differ significantly in the salt stress response. PLoS ONE 2015, 10, e0116697. [Google Scholar] [CrossRef]
  88. Galmés, J.; Flexas, J.; Savé, R.; Medrano, H. Water relations and stomatal characteristics of Mediterranean plants with different growth forms and leaf habits: Responses to water stress and recovery. Plant Soil 2007, 290, 139–155. [Google Scholar] [CrossRef]
  89. Han, L.B.; Song, G.L.; Zhang, X. Preliminary observation of physiological responses of three turfgrass species to traffic stress. HortTechnology 2008, 18, 139–143. [Google Scholar] [CrossRef]
  90. Dhindsa, R.S.; Plumb-Dhindsa, P.; Thorpe, T.A. Leaf senescence: Correlated with increased leaves of membrane permeability and lipid peroxidation, and decreased levels of superoxide dismutase and catalase. J. Exp. Bot. 1981, 32, 93–101. [Google Scholar] [CrossRef]
  91. Bates, T.S.; Waldren, R.P.; Teare, I.D. Rapid determination of free proline for water-stress studies. Plant Soil 1973, 39, 205–207. [Google Scholar] [CrossRef]
  92. Kim, D.; Pertea, G.; Trapnell, C.; Pimentel, H.; Kelley, R.; Salzberg, S.L. TopHat2: Accurate alignment of transcriptomes in the presence of insertions, deletions and gene fusions. Genome Biol. 2013, 14, R36. [Google Scholar] [CrossRef] [PubMed]
  93. Anders, S.; Pyl, P.T.; Huber, W. HTSeq—A Python framework to work with high-throughput sequencing data. Bioinformatics 2015, 31, 166–169. [Google Scholar] [CrossRef]
  94. Alstchul, S.F.; Madden, T.L.; Schaffer, A.A.; Zhang, J.; Zhang, Z. Gapped BLAST and PSI-BLAST: A new generation of protein database search programs. Nucleic Acids Res. 1997, 25, 389–3402. [Google Scholar]
  95. Anders, S.; Huber, W. Differential expression analysis for sequence count data. Genome Biol. 2010, 106, 10–11. [Google Scholar] [CrossRef]
  96. Wang, L.; Feng, Z.; Wang, X.; Wang, X.; Zhang, X. DEGseq: An R package for identifying differentially expressed genes from RNA-seq data. Bioinformatics 2010, 26, 136–138. [Google Scholar] [CrossRef]
  97. Benjamini, Y.; Hochberg, Y. Controlling the false discovery rate: A practical and powerful approach to multiple testing. J. R. Stat. Soc. B 1995, 57, 289–300. [Google Scholar] [CrossRef]
  98. Kanehisa, M.; Araki, M.; Goto, S.; Hattori, M.; Hirakawa, M.; Itoh, M.; Katayama, T.; Kawashima, S.; Okuda, S.; Tokimatsu, T.; et al. KEGG for linking genomes to life and the environment. Nucleic Acids Res. 2008, 36, D480–D4884. [Google Scholar] [CrossRef] [PubMed]
  99. Xie, C.; Mao, X.; Huang, J.; Ding, Y.; Wu, J.; Dong, S.; Kong, L.; Gao, G.; Li, C.Y.; Wei, L. KOBAS2.0:a web server for annotation and identification of enriched pathways and diseases. Nucleic Acids Res. 2011, 39, W316–W322. [Google Scholar] [CrossRef] [PubMed]
  100. Livak, K.J.; Schmittgen, T.D. Analysis of relative gene expression data using real-time quantitative PCR and the 2−Δ∆CT method. Methods 2001, 25, 402–408. [Google Scholar] [CrossRef] [PubMed]
Figure 1. Profile of gene expression by inbred line and drought treatment. The gene expression profile is illustrated as the number of transcriptomic responses by using a Venn diagram. A total of 21,679 genes were expressed. Drought treatments are labeled Control (C) and Drought (D). The tolerant line (YE8112) and the sensitive line (MO17) are labeled “T” and “S”, respectively. The biological samples of four combinations are TC, TD, SC, and SD, respectively. The area labeled “A” represents the genes exclusively expressed in tolerant line YE8112 after drought treatment (TD). The area labeled “B” represents the genes specifically expressed in sensitive line MO17 after drought treatment (SD). The area labeled “C” represents the drought responsive genes shared by the tolerant and sensitive lines (i.e., TD and SD, but excluding SC and TC).
Ijms 20 01268 g001
Figure 2. Venn diagram showing the profile of differentially expressed genes (DEGs). The differentiations were compared between inbred lines under each drought treatment, or between drought treatments in each inbred line. Drought treatments are labeled Control (C) and Drought (D). The tolerant line (YE8112) and the sensitive line (MO17) are labeled “T” and “S”, respectively. The four treatment-line biological samples are tolerant-control (TC), tolerant-drought (TD), sensitive-control (SC), and sensitive-drought (SD). Each compared combination is separated by an underscore (e.g., TC_TD). In the Venn diagram, the numbers of DEGs are shown across intersection areas among the compared combinations. In total we found 10,612 DEGs from all the areas. Four critical areas, labeled I, II, III, and IV, totally contain 5229 DEGs. Area I contains the tolerant treatment response DEGs, excluding others. Area II contains the line response under drought DEGs, excluding others. Area III contains both tolerance treatment response and line response under drought DEGs, excluding others. Area IV contains the treatment response DEGs within line.
Ijms 20 01268 g002
Figure 3. Clustering analysis of differentially expressed genes (DEGs) and number of DEGs in YE8112 and MO17. (A) Clustering analysis of DEGs in the inbred lines after drought stress treatment (SD_TD). The x-axis represents different samples. T04, T05, and T06 refer to the three replicates of tolerant line YE8112 drought stressed (TD); T10 and T11 refer to the two replicates of the sensitive MO17 drought stressed (SD); and the y-axis represents the differential genes expressed. The scale bar indicates up-regulated (red) and down-regulated (green) DEGs. The darker the color, the higher the expression, while the lighter the color, the lower the expression; G=genes of the same expression pattern are clustered together; (B) volcano plot showing the (log2 FC, −log10 FDR) expression of the DEGs in the SD_TD experimental comparison; (C) number of DEGs in drought stressed YE8112 and MO17 seedlings. The overlapping section of the Venn diagram shows the DEPs common to YE8112 and MO17 seedlings under drought stress conditions.
Ijms 20 01268 g003
Figure 4. Gene ontology (GO) enrichment analysis of the DEGs (from the critical areas labelled I, II, and V in Figure 2) in specific level 2 GO terms. The GO analysis results shown here are for the top 10 GO terms from the biological processes (BP) and molecular functions (MF) categories combined, for (A) GO enrichment of DEGs corresponding to tolerant treatment response (TC_TD); (B) GO enrichment of DEGs corresponding to line response under drought (SD_TD); and (C) GO enrichment of DEGs corresponding to sensitive treatment response (SC_SD); (DF) Number of DEGs enriched in each specific GO term in each experimental comparison (TC_TD, SD_TD, and SC_SD, respectively). Each area contained a background total of 80, 5140, and 602 DEGs, for TC_TD, SD_TD, and SC_SD, respectively.
Ijms 20 01268 g004aIjms 20 01268 g004b
Figure 5. KEGG pathway enrichment analysis of the differentially expressed genes (DEGs). The sub-figures show the most significantly enriched pathways in (A) TC_TD; (B) SD_TD; and (C) SC_SD experimental comparisons, based on the hypergeometric test. The significance of the enrichment of the KEGG pathway is based on the Student’s t-test, q < 0.01. The color gradient represents the size of the q value; the color is from red to blue, and the nearer the red represents the smaller the q value, and the higher the significant level of enrichment of the corresponding KEGG pathway. The “rich factor” shows the ratio of the number of the DEGs to the total gene number in certain pathways.
Ijms 20 01268 g005aIjms 20 01268 g005b
Figure 6. qRT-PCR validation of the RNA-seq data of the 20 randomly selected maize seedling leaf differentially expressed genes (DEGs). (A) TC_TD specific DEGs; (B) SD_TD specific DEGs; (C) DEGs shared between TC_TD and SD_TD; and (D) DEGs specific to SC_SD. The y-axis represents the gene relative expression levels (fold changes) in the real-time PCR analysis and fold changes in the RNA-seq data. All the genes with negative values of expression level means that they were down-regulated in response to drought stress. Maize gene GAPDH (accession no. X07156) was used as the internal reference. Error bars represent the SE (n = 3).
Ijms 20 01268 g006
Figure 7. Schematic molecular model of maize seedling drought stress tolerance. This model was developed based on our key putative components of drought response identified in this study, supported by previously described schemes of plant abiotic stress response pathways/networks [9,38,72]. The blue dotted enclosure signifies the molecular interactions occurring in the cellular environment. The down-ward pointing arrows show the connections between the components of the drought response network, from stress signal perception through signal transduction to transcriptional regulation of gene expression, until physiological and acclimation mechanisms are instituted in whole plants to effect drought tolerance. Key to abbreviations: Ca2+, calcium signals receptors; K+, potassium channels signal receptors; ABA, abscisic acid; CBL, calcineurin B-like; CIPKs, CBL-interacting protein kinases; MAPK, mitogen-activated protein kinases; TF, transcription factor; MYB, myeloblastosis oncogene; PFP alpha 1, pyrophosphate fructose-6-phosphate 1-phosphotransferase subunit alpha 1; NAC, (NAM, ATAF1/2, and CUC2) domain proteins; WRKY, family denoted by protein domain composed of a conserved WRKYGQK motif and a zinc-finger domain; PLATZ, plant AT-rich sequence and zinc binding protein 1; CHO, carbohydrates.
Ijms 20 01268 g007
Table 1. Physiological responses of the two contrasting maize inbred lines to drought stress.
Physiological CharacteristicsTreatment Exposure Period (days) 1Sensitive Inbred Line MO17Tolerant Inbred Line YE8112
Control Stress Control Stress
Leaf relative water content (%)192.23 ± 0.1763 b90.33 ± 0.8819 c94.63 ± 0.2603 a92.53 ± 0.1202 b
393.03 ± 0.0882 a88.53 ± 0.1202 b93.70 ± 0.4163 a89.90 ± 0.3056 b
592.83 ± 0.4910 a70.43 ± 0.1202 c94.60 ± 0.4042 a86.53 ± 0.2848 b
792.73 ± 0.2403 a65.40 ± 0.2082 c93.80 ± 0.3215 a81.80 ± 1.0214 b
Proline content
(µg·g−1 FW)
188.62 ± 0.3358 a80.45 ± 0.6265 b73.99 ± 0.7420 c89.95 ± 0.3259 a
388.78 ± 0.1981 c93.68 ± 0.5860 b74.29 ± 1.1873 d97.19 ± 1.0451 a
588.69 ± 0.5200 c99.78 ± 1.3309 b75.25 ± 0.6094 d108.00 ± 0.9824 a
787.67 ± 1.2440 c109.21 ± 0.7280 b78.07 ± 0.9696 d121.96 ± 0.7967 a
Peroxidase activity
(unit·mg−1 protein FW min−1)
10.2653 ± 0.0028 b0.2747 ± 0.0023 b0.2590 ± 0.0012 c0.3083 ± 0.0035 a
30.2630 ± 0.0059 c0.3147 ± 0.0015 b0.2557 ± 0.0008 c0.3553 ± 0.0047 a
50.2530 ± 0.0064 d0.3677 ± 0.0020 b0.2643 ± 0.0052 c0.3847 ± 0.1186 a
70.2563 ± 0.0043 c0.4033 ± 0.0039 b0.2653 ± 0.0073 c0.4350 ± 0.0012 a
MDA content (µmol·g−1 FW) 10.0119 ± 0.00003 b0.0128 ± 0.00024 a0.0118 ± 0.00067 b0.0119 ± 0.00006 b
30.0117 ± 0.00031 c0.0152 ± 0.00015 a0.0117 ± 0.00018 c0.0123 ± 0.00028 b
50.0115 ± 0.00012 a0.0207 ±0.0002 8 c0.0119 ± 0.00023 a0.0153 ± 0.00057 b
70.0120 ± 0.00012 a0.0220 ± 0.00005 c0.0118 ± 0.00018 a0.0204 ± 0.00036 b
Drought stress injury symptomsAt 7 daysNot visibleLeaves distinctly shriveled upNot visibleLeaves remain green and relatively intact
1 Physiological indices were recorded at different time points, viz. 1, 3, 5, and 7 days after drought treatment exposure; FW, fresh weight. Data are presented as mean of three replicates ± standard deviation. Means with similar letter(s) within the same row and for a particular characteristic do not differ significantly at 5% level using least significant difference (LSD) test.
Table 2. Summary of RNA sequencing results for the twelve maize seedling leaf samples.
Sample 1 Rep 2Total Reads 3 Clean Reads 4 GC Content (%) 5 % ≥ Q30 6 Mapped Reads (%) 7Uniq. Map Reads (%) 8Multiple Map Reads (%) 9
YE8112CK165,863,88032,931,94057.0589.7850,491,140 (76.66%)48,782,990 (74.07%)1,708,053 (2.59%)
YE8112CK264,181,68832,090,84456.1589.0749,434,118 (77.02%)47,831,879 (74.53%)1,708,053 (2.59%)
YE8112CK359,227,50629,613,75356.8289.9645,756,005 (77.25%)44,156,338 (74.55%)1,599,667 (2.70%)
YE8112D157,696,30028,848,15056.4790.1745,284,984 (78.49%)41,401,607 (77.82%)1,466,413 (2.54%)
YE8112D259,181,57029,590,78556.1389.5445,357,186 (76.67%)43,736,983 (73.90%)1,638,203 (2.77%)
YE8112D353,205,05426,602,52756.5390.1641,401,607 (77.82%)40,072,870 (75.32%)1,152,150 (2.47%)
MO17CK146,584,38623,292,19356.0489.1730,323,524 (65.09%)29,171,374 (62.62%)1,590,356 (3.34%)
MO17CK247,641,29423,820,64755.8788.9931,266,355 (65.63%)29,675,999 (62.29%)1,590,356 (3.34%)
MO17CK347,180,62223,590,31156.5488.7031,791,159 (67.38%)27,907,153 (59.15%)3,884,006 (8.23%)
MO17D144,255,82422,127,91256.1086.7926,090,436 (58.95%)24,995,448 (56.48%)1,094,998 (2.47%)
MO17D268,595,58434,297,77456.2287.0141,355,964 (60.29%)38,616,715 (56.30%)2,739,249 (3.99%)
MO17D347,342,68023,671,34056.3885.0226,906,481 (56.83%)24,564,920 (51.82%)2,371,561 (5.01%)
1 Sample, treatment sample; YE8112CK, tolerant line YE8112 under water-sufficient (control) conditions; YE8112D, tolerant line under drought stress; MO17CK, sensitive line MO17 under control; MO17D, sensitive line under drought stress; 2 Rep., treatment repeat; 3 Total reads, total clean reads counted by single end; 4 Clean reads, total number of pair-end reads in clean data; 5 GC content, clean data GC content, that is, the percentage of G and C bases out of total bases in the data; 6 % ≥ Q30, the percentage of the bases with a data mass value greater than or equal to 30; 7 Mapped reads, the number of reads in the reference genome and the percentage in clean reads; 8 Uniq. map reads, the number of reads compared in one location to the reference genome and the percentage in the clean reads; 9 Multiple map reads, the number of reads compared in multiple locations to the reference genome and the percentage in clean reads.
Table 3. Expression patterns of the differentially expressed genes (DEGs) by group.
Comparison/Group 1DEG Number 2Up-Regulated 3Down-Regulated 4
SC__TC433119642367
SC__SD754329425
TC__TD1294980
SD__TD539824852913
1 Comparison/group, experimental comparison group; SD, sensitive inbred line (MO17) under drought treatment conditions; SC, sensitive inbred line under well-watered (control) conditions; TD, tolerant inbred line (YE8112) under drought conditions; TC, tolerant inbred line under control conditions; an underscore between two line-treatment combinations implies comparison of those combinations; 2 DEG number, total number of differentially expressed genes (DEGs) in the group; 3 Up-regulated, number of DEGs whose expression levels were increased; 4 Down-regulated, number of DEGs whose expression levels were decreased by the treatment.
Table 4. Drought responsive differentially expressed genes (DEGs) specific to tolerant line YE8112.
Gene ID 1Gene Name/Description 2log2 FC 3Expr. 4FDR 5p-Value 6KEGG Pathway 7
Zm00001d027242Granule-bound starch synthase 14.3867007Up6.57 × 10−60.0001190 --
Zm00001d044136Glycerol-3-phosphate acyltransferase 13.814405Up1.09 × 10−50.0020520 Glycerophospholipid metabolism
Zm00001d029906BETA_EXPANSIN72.8909994Up0.0023830.0015080 --
Zm00001d036676Putative B-box type zinc finger family protein2.666452Up0.00341153.60 × 10−9--
Zm00001d011473POTASSIUM_CHANNEL52.5990283Up0.00205240.0000007 --
Zm00001d013261Cysteine protease 11.9554585Up2.60 × 10−81.72 × 10⁻⁹--
Zm00001d038199Mildew resistance locus O (MLO)-like protein 11.9445226Up3.07 × 10−60.0135900 --
Zm00001d044765Benzoate carboxyl methyltransferase1.7383231Up0.00049040.0148800 --
Zm00001d012220Putative ENTH/ANTH/VHS superfamily protein1.7341537Up0.00085040.0000584 --
2626N/A1.7277288Up0.00391070.0061660 --
Zm00001d044285CALCINEURIN_B-LIKE101.6791443Up7.19 × 10−60.0042720 --
1650N/A1.6197127Up0.00168580.0000231 --
Zm00001d033985N/A1.6129169Up0.00404340.0000005 --
Zm00001d046998LIGHT-DEPENDENT SHORT HYPOCOTYLS 51.5404762Up0.00255830.0011140 --
2197N/A1.5333337Up7.19 × 10−60.0022920 --
Zm00001d028399Thaumatin-like protein 11.532225Up4.36 × 10−92.63 × 10⁻⁸--
Zm00001d024268NAC-TRANSCRIPTION_FACTOR_1101.5062543Up1.30 × 10−60.0001437 --
Zm00001d011297MYB-RELATED-TRANSCRIPTION_FACTOR_351.4840701Up0.00376624.04 × 10−9--
Zm00001d024546LATE_HYPOCOTYL_ELONGATION_PROTEIN_ORTHOLOG11.4762326Up1.03 × 10−50.0001785 Circadian rhythm—plant
Zm00001d031349Serine--glyoxylate aminotransferase1.415994Up8.99 × 10−70.0003943 Alanine; glutamate; and carbohydrate metabolisms
Zm00001d048622N/A1.4131758Up1.02 × 10−60.0000001 --
3628N/A1.3978699Up0.00255830.0081300 --
Zm00001d038049Putative O-glycosyl hydrolase1.2684934Up0.006030.0459900 --
Zm00001d017374Protein kinase superfamily protein1.2481588Up0.00620810.0042520 --
Zm00001d008222N/A1.1376143Up0.00265420.0001437 --
1682N/A1.1285633Up0.00512551.04 × 10−10--
Zm00001d008808MYB-RELATED-TRANSCRIPTION_FACTOR_241.1148561Up0.00698040.0000014 --
Zm00001d040639RING-H2 finger protein ATL3F1.0980329Up0.00393890.0089120 --
Zm00001d017918TRICHOME BIREFRINGENCE-LIKE 201.0976007Up0.00062131.40 × 10−8--
Zm00001d029154Inactive beta-amylase 91.0845327Up0.00343680.0020340 --
Zm00001d003850Probable botrytis susceptible 1 interactor (BOI) -related E3 ubiquitin-protein ligase 21.0379841Up0.00085160.0001594 --
Zm00001d046318Putative flavin adenine dinucleotide (FAD)-binding berberine family protein−1.0302981Down0.00343680.0001458 --
Zm00001d005118Sec14p-like phosphatidylinositol transfer family protein−1.0555703Down0.00049040.0000696 --
Zm00001d011428Urophorphyrin methylase 1−1.0643172Down0.00512550.0002838 --
Zm00001d044228THIAMINE_BIOSYNTHESIS2−1.065855Down0.00976280.0002834 Thiamine metabolism
Zm00001d015700Putative chloride channel-like protein CLC-g−1.0848056Down0.00032170.0000007 --
Zm00001d015504Protein phosphatase 2C isoform gamma−1.0960379Down0.00518890.0018030 --
Zm00001d034345FERREDOXIN_NADP_REDUCTASE1−1.11374Down9.83 × 10−50.0134500 Photosynthesis
Zm00001d028164Sulfate transporter 2.2−1.1852218Down0.00085160.0002960 --
Zm00001d038186Protein NRT1/PTR FAMILY 3.1−1.2124124Down0.00012310.0216600 --
Zm00001d019312BETA_GLUCOSIDASE_AGGREGATING_FACTOR1−1.2524453Down0.00145240.0004082 --
Zm00001d013202G2-LIKE-TRANSCRIPTION_FACTOR_8−1.2938652Down0.00365960.0020330 --
Zm00001d011648Nuclear pore complex protein NUP50A−1.2960047Down0.00220730.0222900 --
Zm00001d002126loricrin-related−1.3017332Down0.00417430.0013570 --
Zm00001d015025Adenosine monophosphate (AMP) binding protein−1.3030892Down4.79 × 10−60.0002818 --
Zm00001d049831Nodulin-like protein−1.3069293Down1.24 × 10−57.30 × 10⁻⁹--
Zm00001d003116Major facilitator superfamily protein−1.3071872Down0.00239190.0071570 --
Zm00001d002069DNA topoisomerase 2−1.3224108Down0.00148310.0024900 --
Zm00001d023592Amino acid permease 2−1.4219628Down0.00148310.0240500 --
Zm00001d003457Plant AT-rich and zinc (PLATZ) domain-containing protein 3−1.4228022Down0.00298830.0151800 --
Zm00001d018738PATHOGENESIS_RELATED_PROTEIN4−1.5048829Down0.00032170.0010230 Plant hormone signal transduction; plant–pathogen interaction
Zm00001d007517Subtilisin-like serine endopeptidase family protein−1.5493362Down0.00114010.0005202 --
Zm00001d021653Glucose-6-phosphate/phosphate translocator 2−1.5573945Down0.00400434.00 × 10−7--
Zm00001d017279PHENYLALANINE_AMMONIA_LYASE7−1.7207427Down0.00700582.595 × 10−7Phenylalanine metabolism; phenylpropanoid biosynthesis
1 Gene ID, unique gene identifying number in the Maize Genetics and Genomics Database (Maize GDB); 2 Gene name/description, name or description of the gene identified by the given Gene ID; 3 Log2 FC, fold change, is expressed as the ratio of intensities of up-regulated or down-regulated genes between drought stress treatments and control (well-watered conditions); all the negative fold change values means that the genes were down-regulated. All the positive fold change values means the genes were up-regulated; 4 Expr., gene relative expression, with up meaning up-regulation and down meaning down-regulation; 5 FDR, false discovery rate, that is, the corrected p-value, set at <0.001 as the level at which gene differential expression was accepted as significant; 6 p-value, statistical level (using Student’s t test) below < 0.05; 7 KEGG pathways, Kyoto Encyclopedia of Genes and Genomes (KEGG), metabolic pathways in which the identified gene was found to be significantly enriched; N/A, means the gene is a newly discovered gene, without any functional annotation ascribed to it at the present.
Table 5. Drought responsive DEGs of the tolerant line that were also differentially expressed between the tolerant and sensitive lines after drought treatment.
Gene IDGene Name/Description Expression in TC_TD Expression in SD_TDKEGG Pathway
Expr.Log2FCp-ValueFDRExpr.Log2FCp-ValueFDR
Zm00001d051511PLATZ-TF7Up1.038691.287 × 10−90.00747Down−1.737551.03 × 10−48.48 × 10⁻¹²_
Zm00001d052139Nitrate reductase [NAD(P)H]Down−1.644725.367 × 10−80.000867Down −7.529451.95 × 10−321.92 × 10⁻⁹Nitrogen metabolism
Zm00001d052164Ferredoxin—nitrite reductaseDown−1.06420.0001620.003449Up 4.1926230.0001650.007743Nitrogen metabolism
Zm00001d052247Shikimate kinase 1 chloroplasticDown −1.187982.60 × 10−60.009651Down −7.091982.37 × 10−112.00 × 10⁻²³Phenylalanine, biosynthesis; biosynthesis of amino acids
Zm00001d053568N/AUp 1.7546271.83 × 10−72.6 × 10⁻⁶Down −1.751251.74 × 10−37.69 × 10⁻⁷_
For Table columns description, please refer to Table 4 caption above.
Table 6. Common DEGs between lines (YE8112 and MO17) after drought treatment.
Gene IDGene Name/Description Expression in TC_TDExpression in SC_SDKEGG Pathway
log2 FCExpres.FDRp-Valuelog2 FCExpres.FDRp-Value
Zm00001d007012Ribonucleoprotein A−1.10345Down0.0039323.979 × 10−7−1.95005Down2.79 × 10−60.000617 --
Zm00001d014863MYB- RELATED TF 961.121959Up8.85 × 10−50.002432−1.19141Down0.0019883.68 × 10−6--
Zm00001d026501GLUTAMINE_SYNTHETASE1−1.92817Down3.62 × 10−60.00001242−2.62577Down9.96 × 10−190.000174 --
Zm00001d045919Pyrophosphate—fructose-6-phosphate 1-phosphotransferase subunit alpha 21.510247Up0.0045430.00001574−2.95099Down0.000411.118 × 10−9Fructose and mannose metabolism
For Table columns description, please refer to Table 4 caption above.

