Article

Identification and Characterization of EI (Elongated Internode) Gene in Tomato (Solanum lycopersicum)

Institute of Vegetables and Flowers, Chinese Academy of Agricultural Sciences, Key Laboratory of Biology and Genetic Improvement of Horticultural Crops, Ministry of Agriculture, 12 Zhongguancun Nandajie Street, Beijing 100081, China
*
Authors to whom correspondence should be addressed.
These authors equally contributed to this work.
Int. J. Mol. Sci. 2019, 20(9), 2204; https://doi.org/10.3390/ijms20092204
Submission received: 19 April 2019 / Revised: 2 May 2019 / Accepted: 3 May 2019 / Published: 5 May 2019
(This article belongs to the Special Issue Plant Genetics and Molecular Breeding)

Abstract

:
Internode length is an important agronomic trait affecting plant architecture and crop yield. However, few genes for internode elongation have been identified in tomato. In this study, we characterized an elongated internode inbred line P502, which is a natural mutant of the tomato cultivar 05T606. The mutant P502 exhibits longer internode and higher bioactive GA concentration compared with wild-type 05T606. Genetic analysis suggested that the elongated internode trait is controlled by quantitative trait loci (QTL). Then, we identified a major QTL on chromosome 2 based on molecular markers and bulked segregant analysis (BSA). The locus was designated as EI (Elongated Internode), which explained 73.6% genetic variance. The EI was further mapped to a 75.8-kb region containing 10 genes in the reference Heinz 1706 genome. One single nucleotide polymorphism (SNP) in the coding region of solyc02g080120.1 was identified, which encodes gibberellin 2-beta-dioxygenase 7 (SlGA2ox7). SlGA2ox7, orthologous to AtGA2ox7 and AtGA2ox8, is involved in the regulation of GA degradation. Overexpression of the wild EI gene in mutant P502 caused a dwarf phenotype with a shortened internode. The difference of EI expression levels was not significant in the P502 and wild-type, but the expression levels of GA biosynthetic genes including CPS, KO, KAO, GA20ox1, GA20ox2, GA20ox4, GA3ox1, GA2ox1, GA2ox2, GA2ox4, and GA2ox5, were upregulated in mutant P502. Our results may provide a better understanding of the genetics underlying the internode elongation and valuable information to improve plant architecture of the tomato.

Graphical Abstract

1. Introduction

Plant height is an important component of plant architecture, and is highly correlated with the yield [1]. One of the decisive factors affecting plant height is internode length. The reduced plant height or internode length of semi-dwarf varieties has improved the harvest index and biomass production. The introduction of the “green revolution” semi-dwarf gene SD1 in rice and Rht in wheat resulted in substantial increases in grain yields and helped to avert predicted food shortages in Asia during the 1960s and 1970s [2,3,4,5]. To explore the genetic potential, several genes or quantitative trait loci (QTL) controlling the internode length in rice [6,7,8], maize [9,10,11], wheat [12,13], and sorghum [14,15] have been identified. In a recent report, the semi-dwarf gene SBI was cloned, which could shorten the basal internode of rice. Moreover, the SBI allele-introduced varieties have great potential for improving lodging resistance and yield [16].
The molecular genetic analysis of dwarf and slender mutants revealed that most of the mutations are related to the biosynthesis pathways and signal transduction of phytohormones, mostly gibberellins (GAs) [2,9,17,18,19]. GAs are a group of tetracyclic diterpenoid that affect plant developmental processes such as stem elongation [20]. Nowadays, more than 130 GAs have been identified, but relatively few GAs (e.g., GA1, GA3, GA4, and GA7) have intrinsic biological activity [21]. The rice SD1 encodes GA20ox2 and catalyzes the conversion of GA12/GA53 to bioactive GA precursors GA9/GA20. The recessive semi-dwarf mutant sd1 can be restored by exogenous GA3 [22,23]. DELLA protein is a negative regulatory factor in the GA signaling pathway, which inhibits plant growth. The semi-dominant mutations that occurred in Arabidopsis GAI, maize D8, wheat Rht, and rice GAI were caused by the gain of function of DELLA protein, which led to the dwarfism [3,24,25,26,27,28]. In contrast, the loss-of-function of DELLA protein in barley SLN1, rice SLR1, and tomato PRO increased growth and caused a GA-constitutive response phenotype [29,30,31]. In addition, other phytohormones including brassinosteroid (BR), indole-3-acetic acid (IAA), and strigolactones (SLs) have also been proven to be involved in the regulation of internode length or plant height [7,14,32,33,34].
Tomato (Solanum lycopersicum) is the second most consumed vegetable crop and is widely grown around the world [35]. The tomato internode length not only affects the plant architecture, but also plays an important role in mechanized harvesting. However, there are few reports on the genetic regulation of internode length in tomato. Evidence has shown that the well-known dwarf cultivar Micro-Tom, which has the characteristics of extreme dwarfing, dark and wrinkled leaves, has at least two mutations (d and mnt) affecting internode length [36]. However, Micro-Tom was produced for ornamental purposes, and as a conventional model system for research due to its small size, rapid growth, and easy transformation. Due to its characteristics of extreme dwarfing, it seems very limited in a practical breeding program. Moreover, the tomato br locus contributes to a shorter internode and could be useful source for tomato short internode breeding. However, the br locus was only mapped to a 763.1-kb region on chromosome 1, and the gene has not been cloned yet [37]. Therefore, to clone new gene or locus that controls internode elongation is of great theoretical and practical significance. It is helpful to clarify the regulatory mechanism of tomato internode elongation and to provide the possibility of establishing a breeding approach. Furthermore, with the completion of tomato genome sequencing as well as the rapid development of sequencing, marker development has become easier, which has accelerated the speed of gene cloning [38].
In this study, we performed a phenotypic characterization of the mutant P502, which shows a significantly elongated internode compared with wild-type 05T606. Then, we report on the molecular identification of the EI (Elongated Internode) gene by map-based cloning. EI, which is expressed in the root, stem, and leaf, encodes the GA2ox7 enzyme involved in the GA metabolism pathway. Overexpressing of EI can cause a dwarf phenotype with short internode. Our results indicate that EI plays an important role in controlling the tomato internode elongation.

2. Results

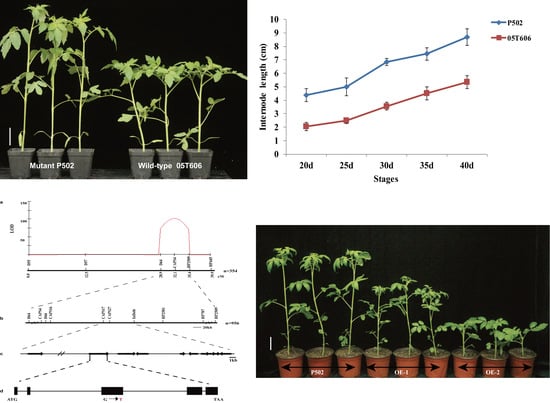
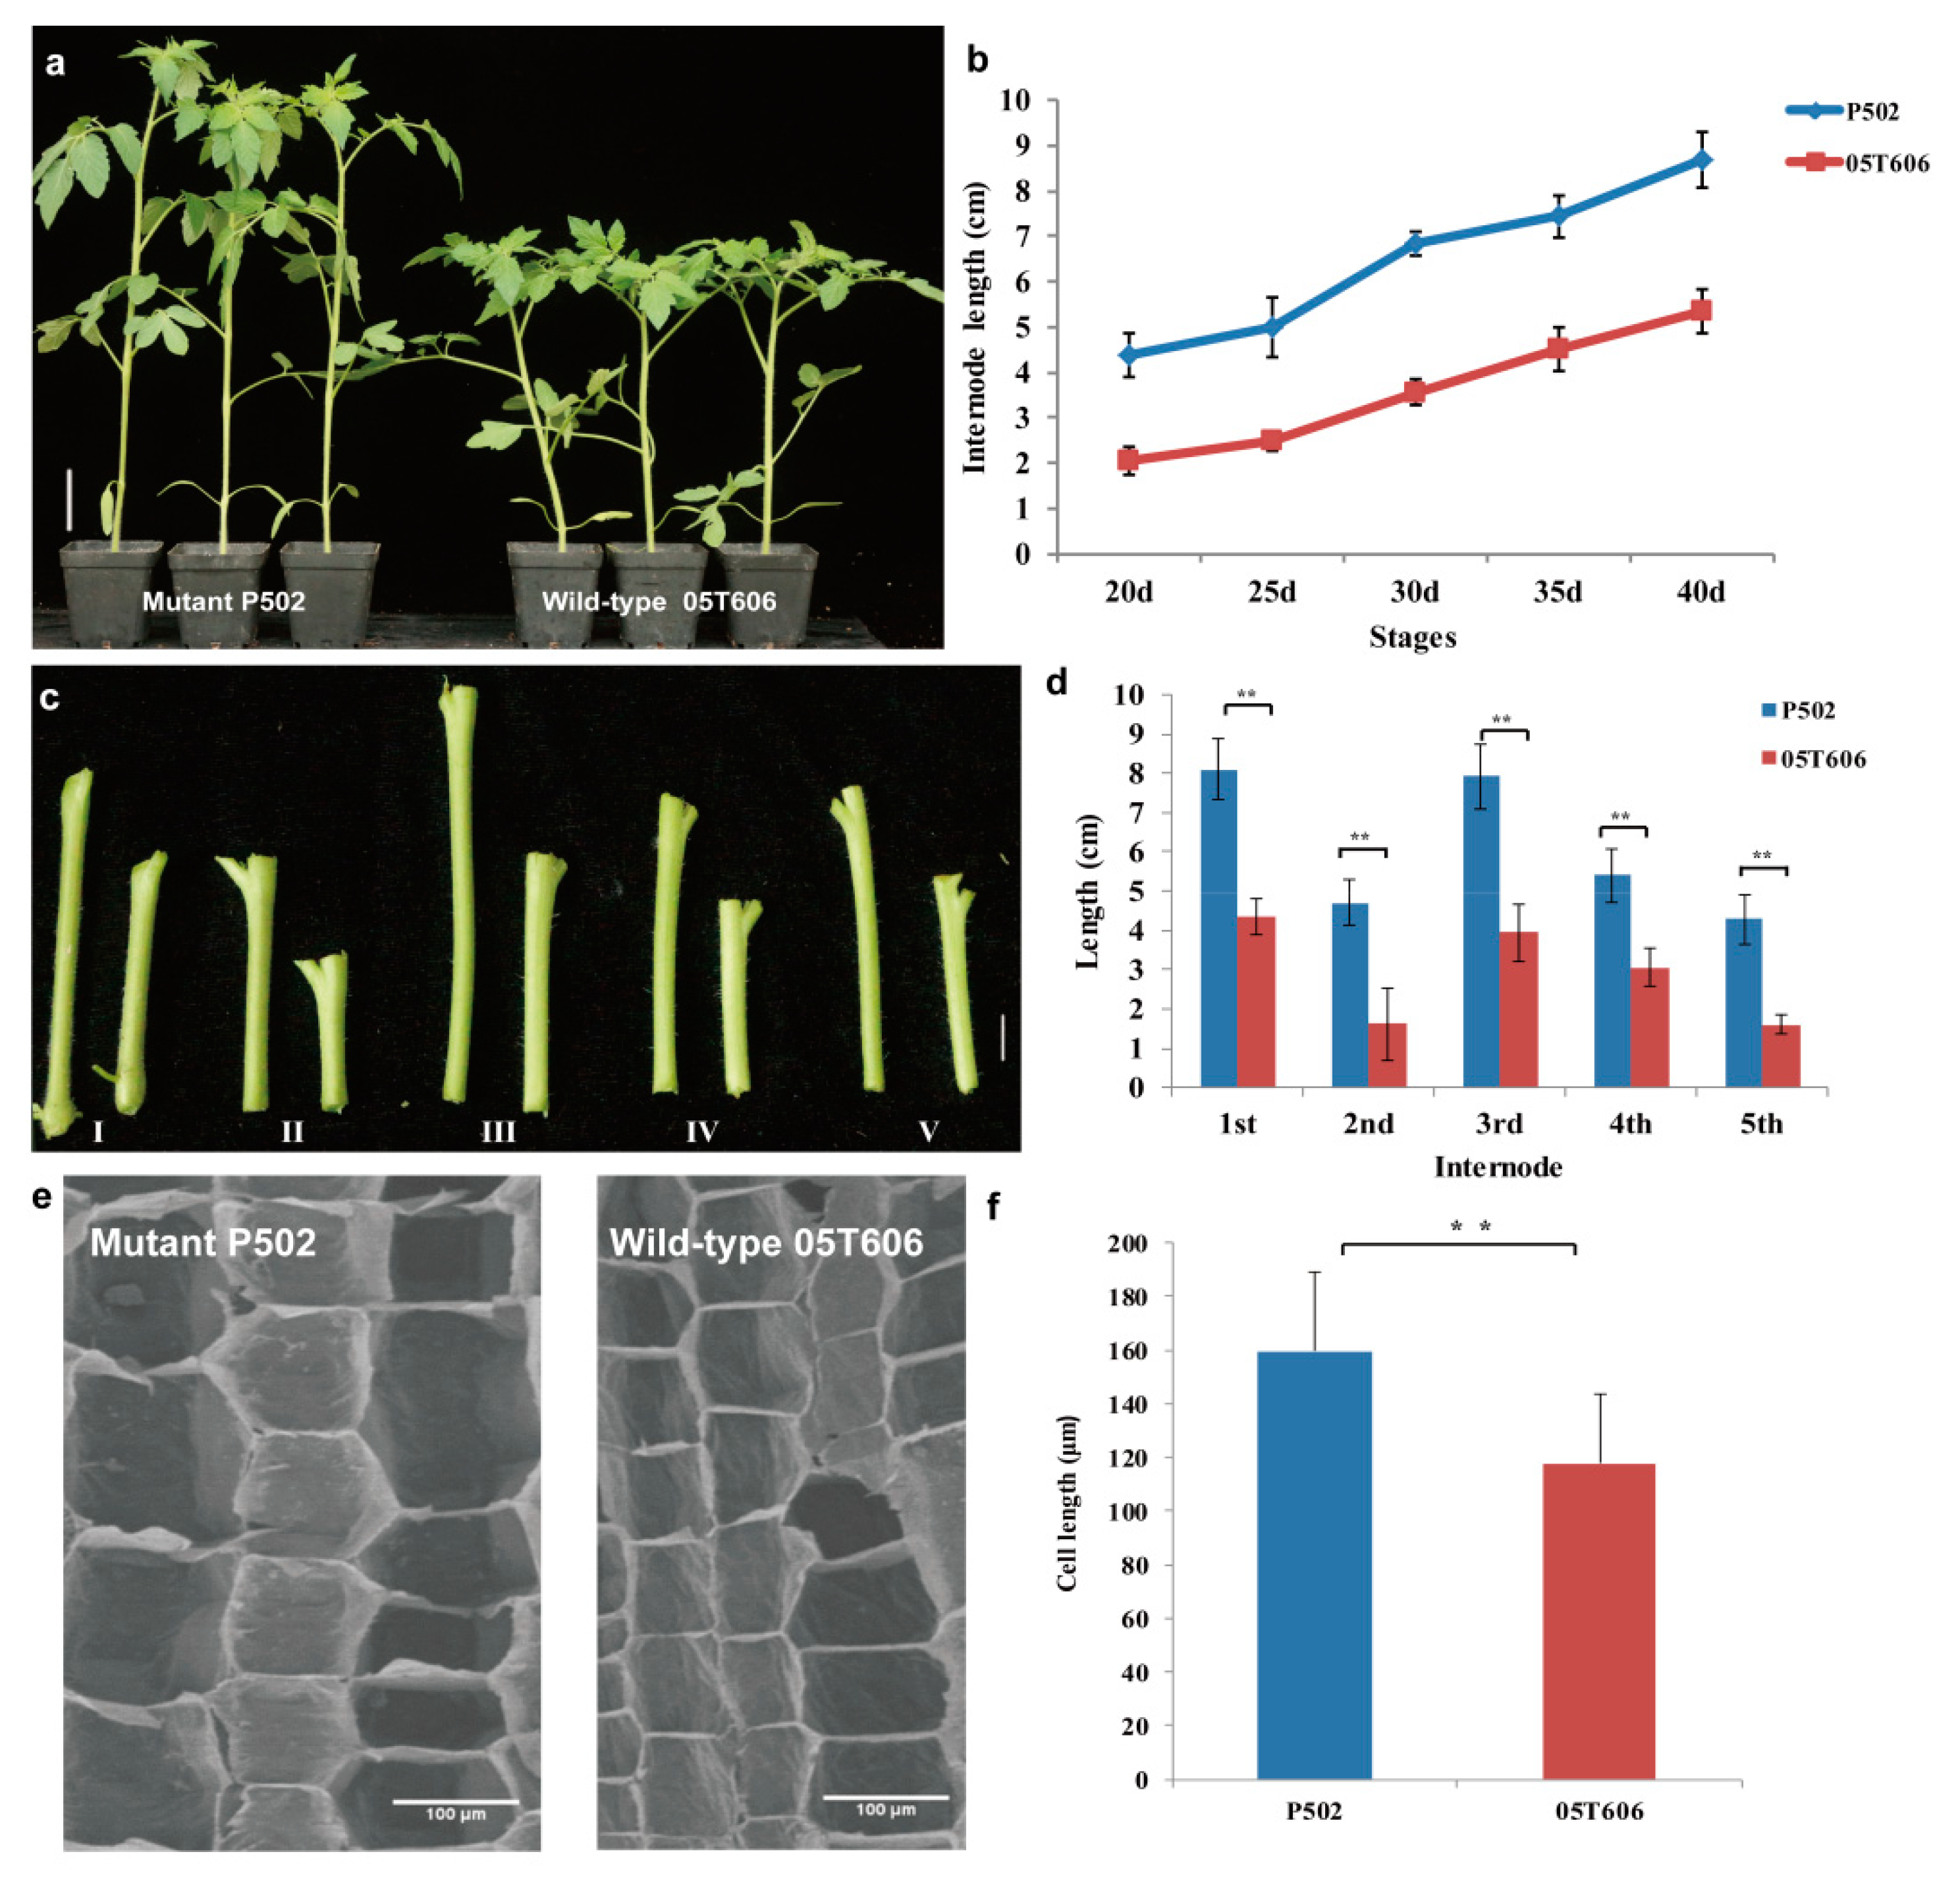
2.1. Characterization of Elongated Internode Inbred Line P502

To compare the dynamic difference in the internode lengths of P502 and wild-type 05T606, we recorded the mean internode lengths of 20-day-old, 25-day-old, 30-day-old, 35-day-old, and 40-day-old seedlings. The results showed that P502 had a longer internode than the wild-type across the seedling stages (Figure 1a,b). Additionally, we compared individual internode lengths including the first, second, third, fourth, and fifth internodes of 40-day-old seedlings. The results indicated that each internode of P502 was significantly greater than the corresponding internode of the wild-type (Figure 1c,d). An analysis of the longitudinal sections of the third internode with a scanning electron microscope revealed that the cells were much longer in P502 than in the wild-type (Figure 1e,f). These results suggest that the mutant P502 phenotype is characterized by the elongated internode.

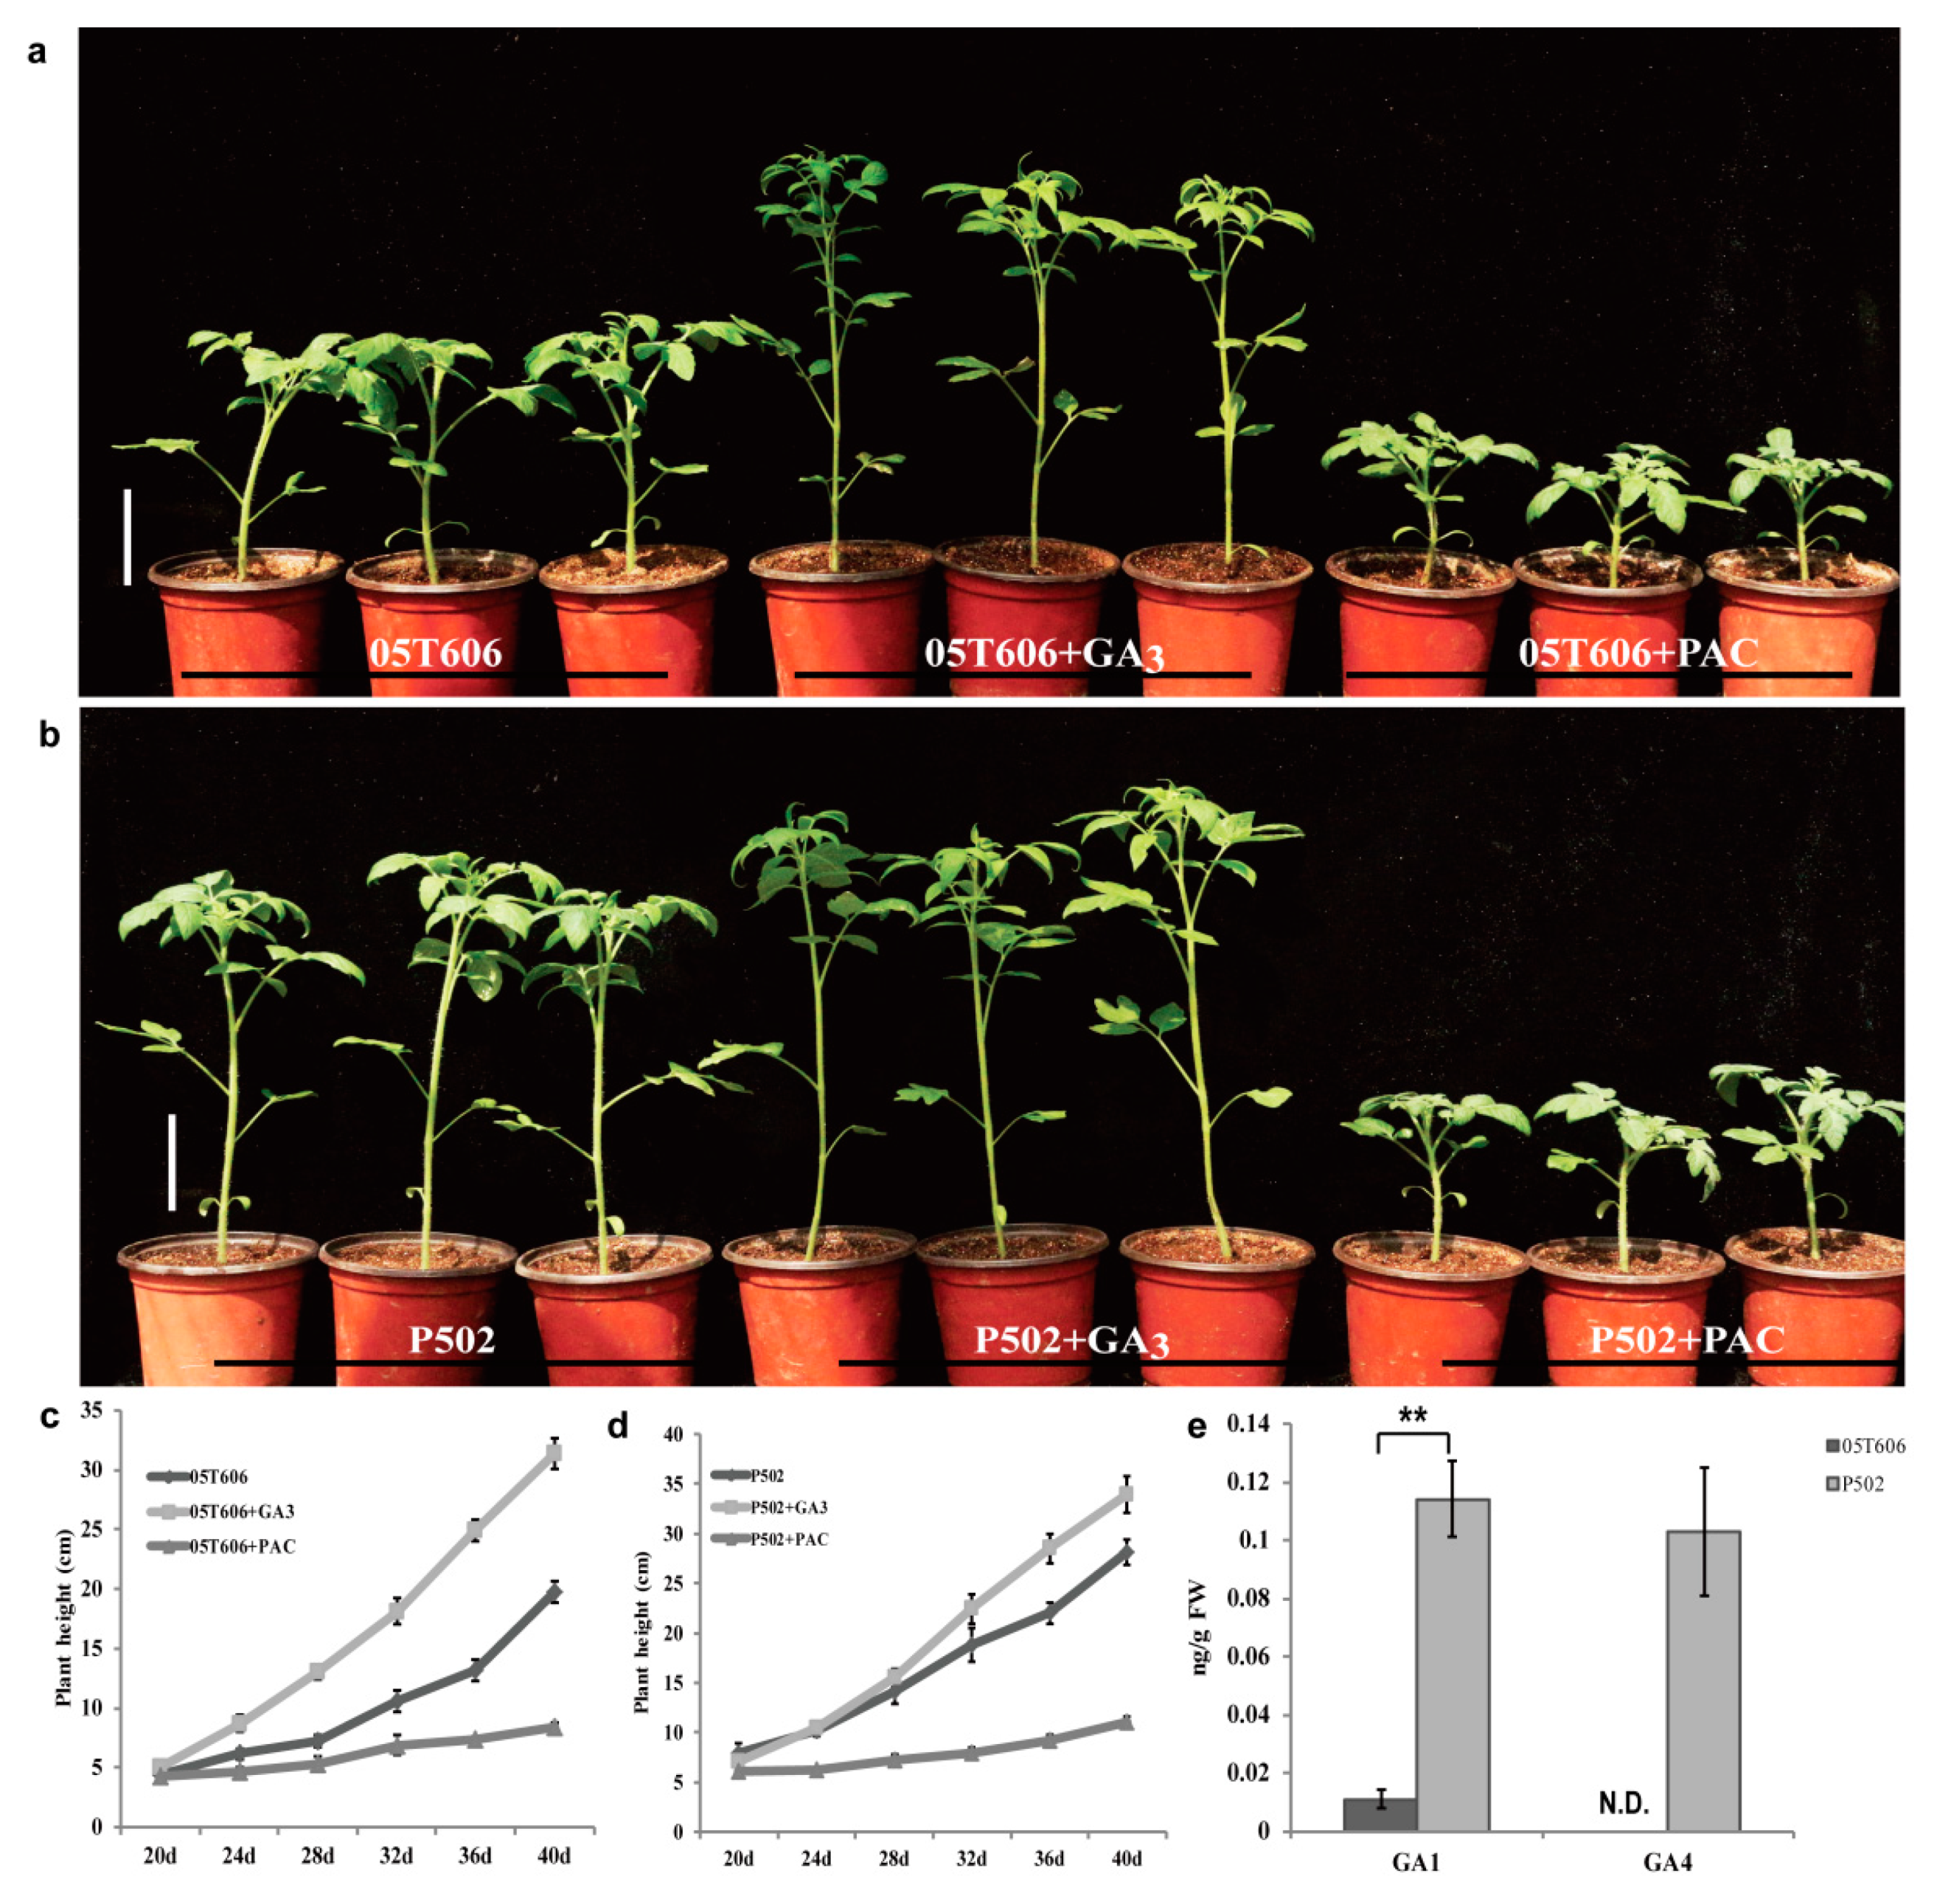
2.2. Elongated Internode Mutation Is Related to the GA Metabolic Pathway

The GAs stimulate cell elongation, and are effective internode elongation regulators. Paclobutrazol (PAC) inhibits the oxidation of ent-kaurene, an early step in GA biosynthesis, and can reduce endogenous GA level [39]. To examine the responses to GAs, we sprayed 20-day-old wild-type 05T606 and mutant P502 seedlings with exogenous GA3 and PAC. For the 40-day-old seedlings, the plant height of 05T606 and P502 increased by 58.2% and 20.5%, respectively, after GA3 treatment. However, the PAC treatment decreased the height of 05T606 by 57.6%, and decreased the height of P502 by 61.0% (Figure 2a–d). Next, we measured the endogenous GA concentration of the first five internodes in 30-day-old seedlings of P502 and 05T606 plants. There was an increase in the bioactive GA1 in P502, and bioactive GA4 was only detected in mutant P502 (Figure 2e). These results indicate that the elongated internode of mutant P502 is related to the GA metabolic pathway and was caused by a higher level of bioactive GAs.

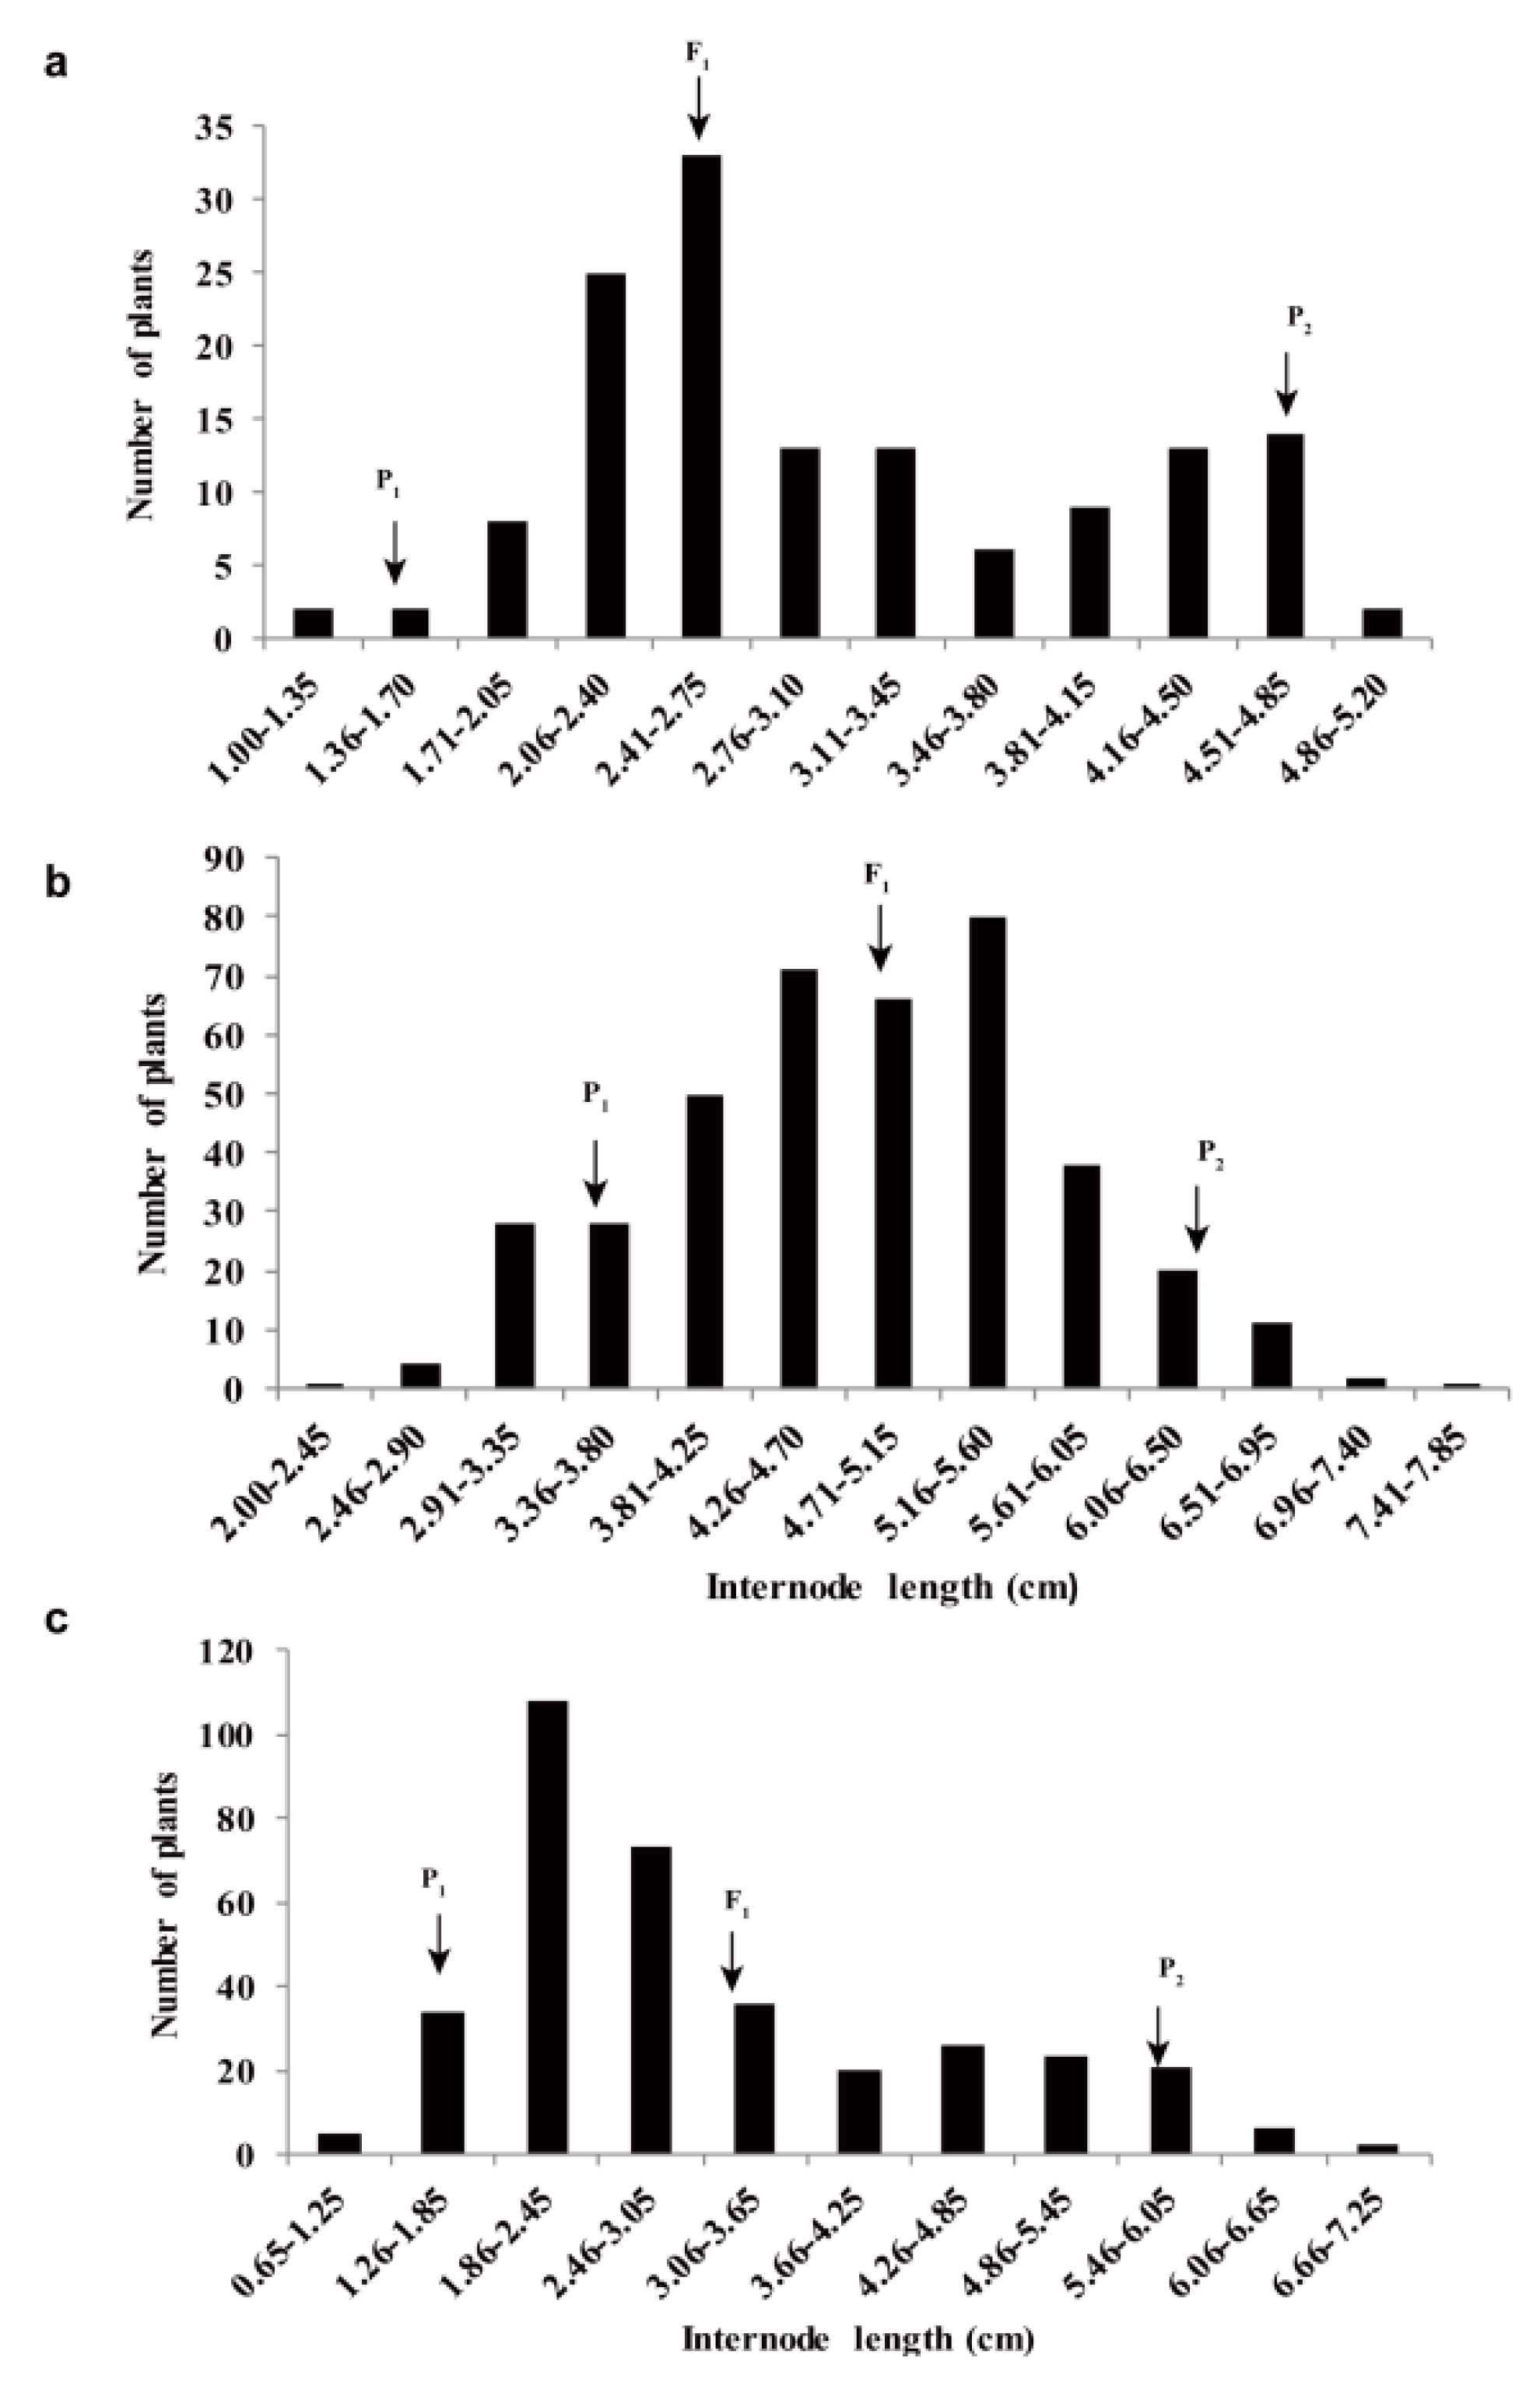
2.3. Genetic Analysis of the Elongated Internode Trait

To determine whether the elongated internode trait is controlled by a single gene or QTL, the first five average internode lengths of the P1 (Heinz 1706), P2 (P502), F1 (Heinz 1706 × P502), and F2 population were recorded in the spring of 2016, 2017, and 2018. The internode length frequency of the F2 population exhibited a continuous and skewed distribution in different years (Figure 3), and the F1 was biased toward the parent Heinz 1706. Moreover, the differences of P1, P2, and F1 were significant (Table 1). These results indicate that the elongated internode length is a quantitative trait and that this population was ideal for elongated internode QTL analysis.

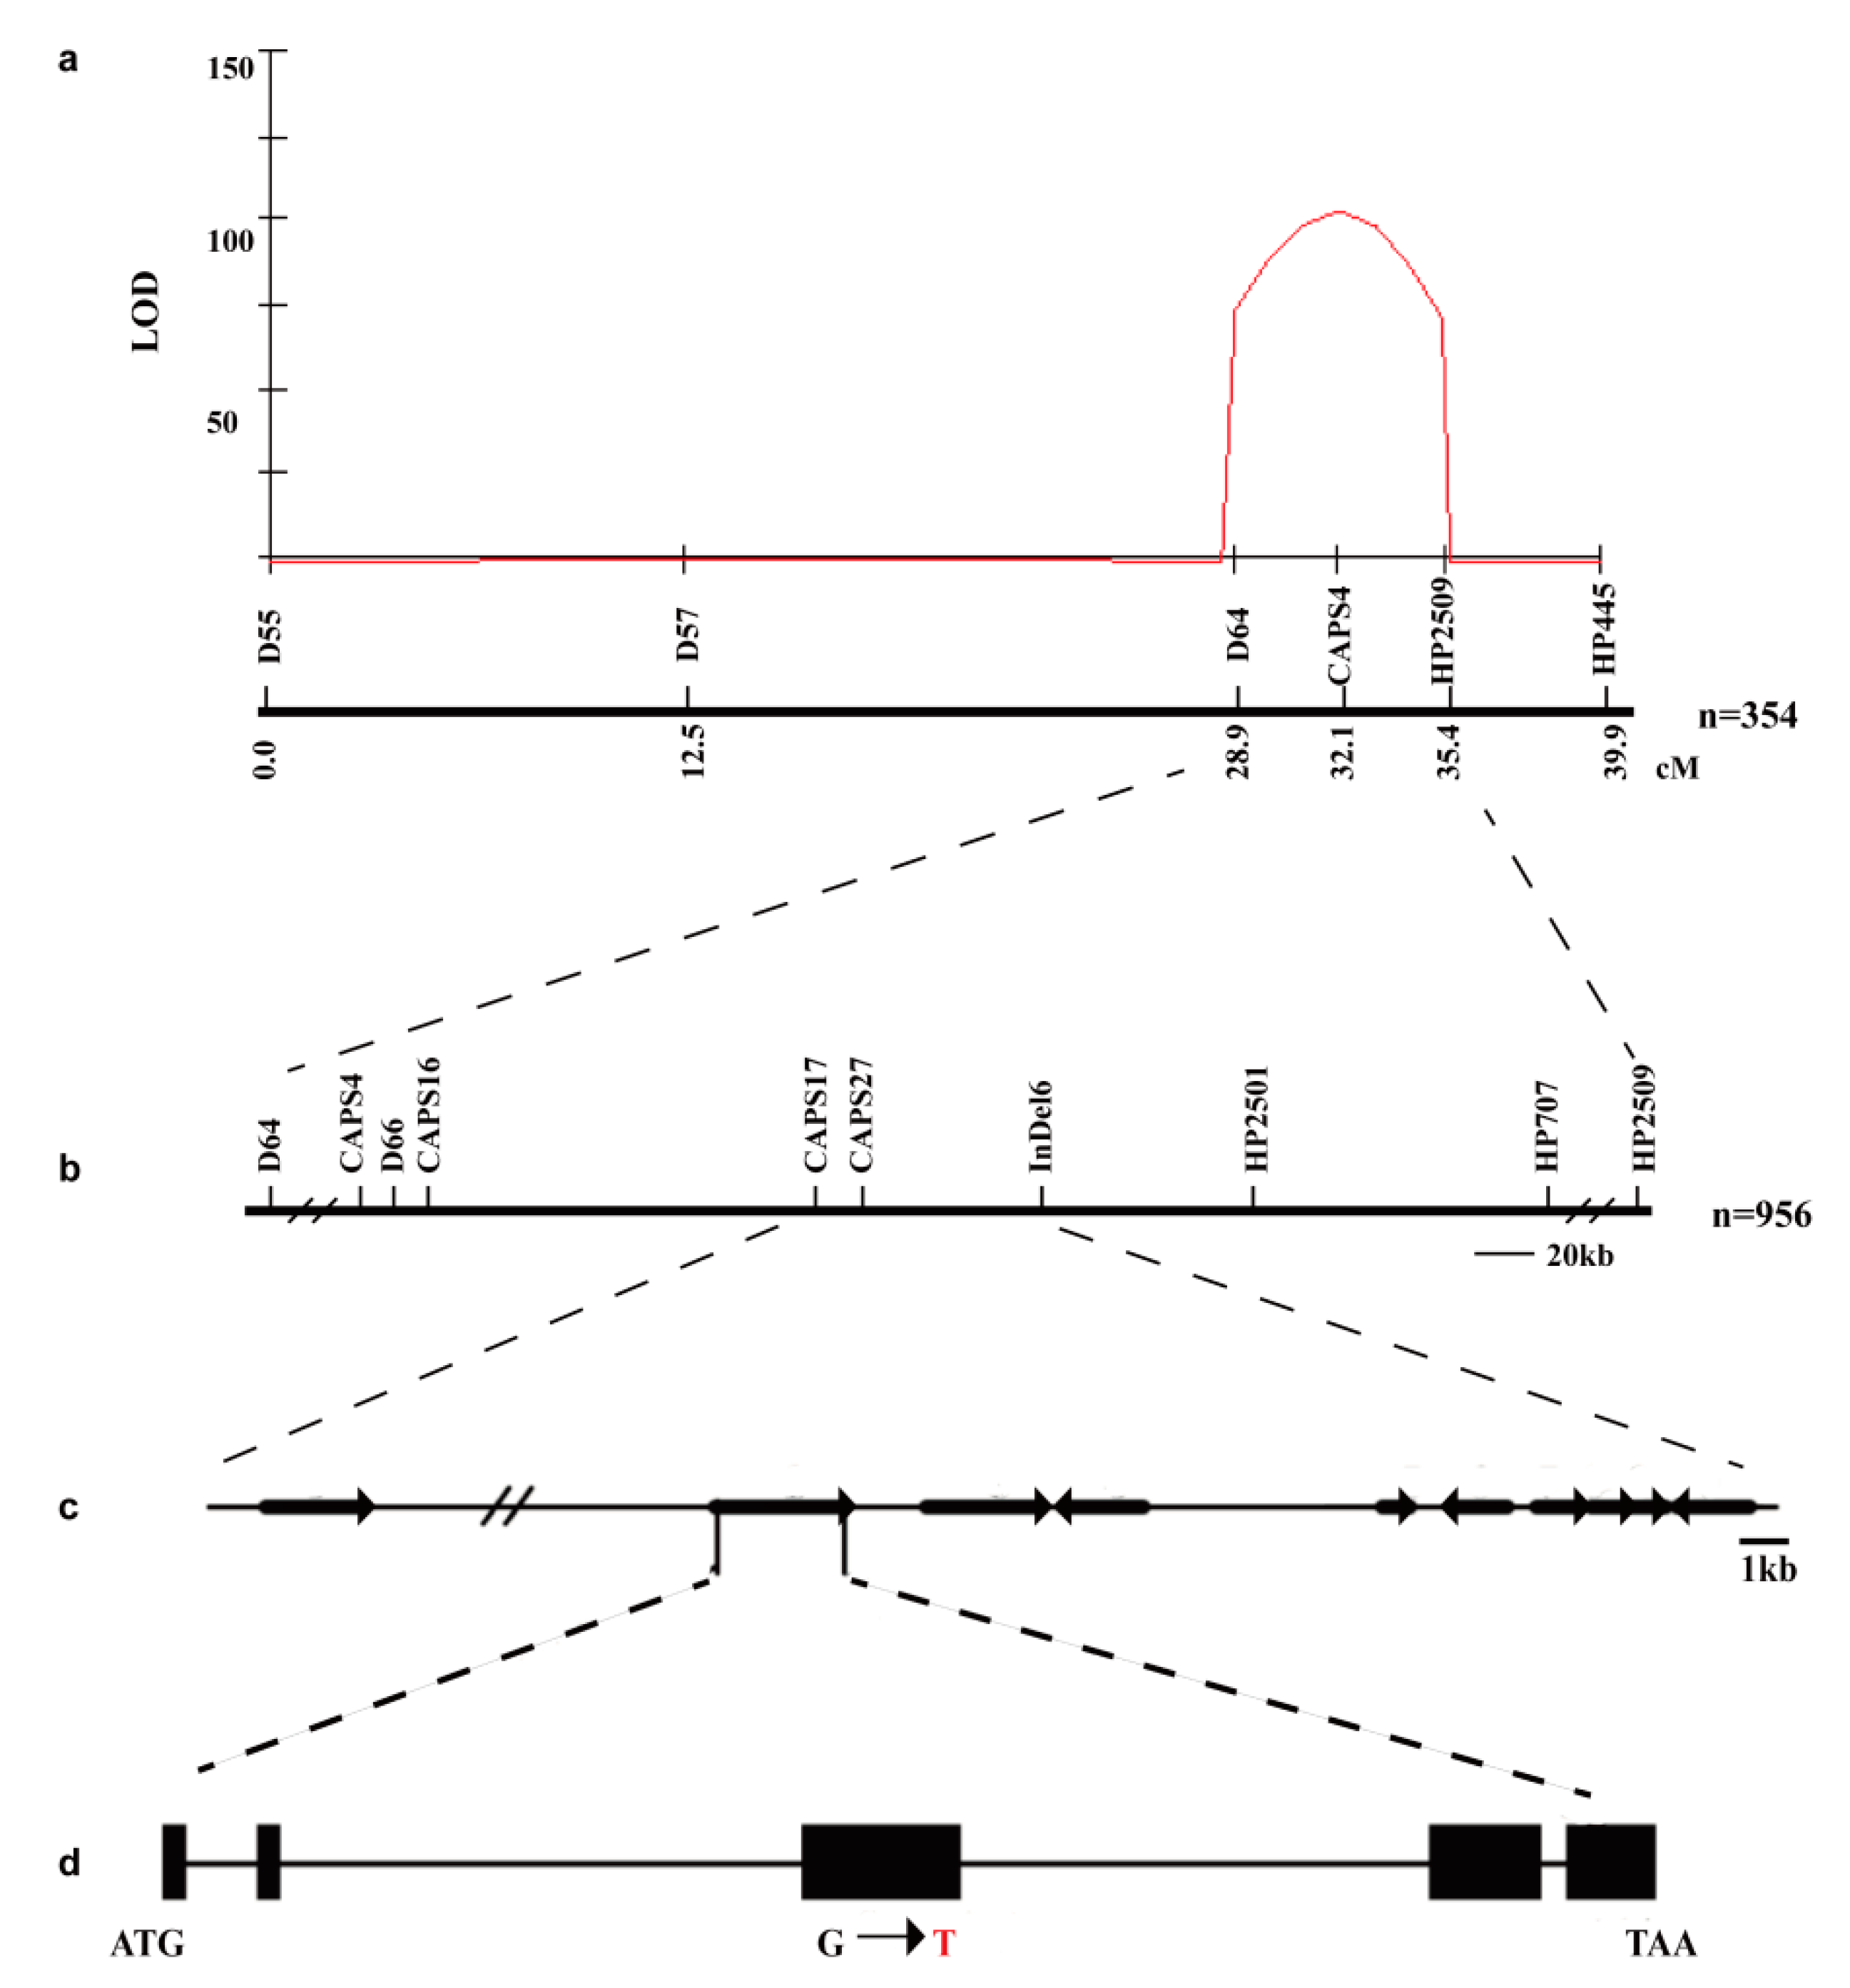
2.4. Map-Based Cloning of the EI Gene

A total of 372 InDel markers distributed on 12 chromosomes were screened, and 90 were polymorphic between the parents. Of these 90 markers, four markers (D55, D57, D64, and D67) located on chromosome 2 were polymorphic between the E and N bulks. The bands of the E pool were consistent with those of the parent P502, whereas the bands of the N pool were heterozygous. These results suggest that the locus is present on chromosome 2.
The 354 F2 individuals, derived from Heinz 1706 × P502, were used for QTL analysis. The results showed that there was only a single peak, with a logarithm of odds score of 102.4 explaining 73.6% phenotypic variance (Figure 4a). Therefore, we concluded that the locus named elongated internode (ei) was located between markers D64 and HP2509. Another 956 F2 individuals were screened for recombinants with the flanking markers D64 and HP2509. The detected recombinants were analyzed with another seven CAPS and InDel markers between the flanking markers (Figure 4b). According to the genotypes of the recombinants and the phenotypes of F3 individuals, we narrowed the ei locus to an interval between CAPS17 and InDel6 (Table 2), corresponding to a 75.8-kb region on chromosome 2 of the reference Heinz 1706 genome.
The Solanaceae Genomics Network website (SGN; http://solgenomics.net) searches [40] indicated that there were 10 genes in this region (Figure 4c, Table 3). By analyzing the sequenced P502 genome, we determined that the DNA sequence had no mutations in the other nine genes, whereas solyc02g080120.1 contained a SNP (G–T) in the exon region (Figure 4d). Thus, solyc02g080120.1 was amplified using genomic DNA extracted from 05T606 and P502 plants and eight primer pairs (A1, A2, A3, A4, A5, A6, A7, and A8; Table S1). The amplification results revealed that the EI gene consists of 4626 bp (with five exons and four introns). Moreover, the EI gene in mutant P502 includes a SNP mutation in the third exon (G2152T) (Figure S1). To confirm this mutation site, the solyc02g080120.1 coding sequence (CDS) was amplified by RT-PCR (CDS-F and CDS-R primers) (Table S1). Sequences of the CDS further confirmed the presence of a SNP mutation in the coding region, which resulted in an amino acid mutation in mutant P502.
To determine whether the G-to-T transition was directly associated with the elongated internode phenotype, a co-segregation analysis was conducted with a functional marker (KASP) developed from this SNP. The KASP marker (S-A1: GAAGGTGACCAAGTTCATGCTCACAAGCTTCACAAGAATGGGG; S-A2: GAAGGTCGGAGTCAACGGATTGCACAAGCTTCACAAGAATGGGT; S-C: GTGATACTCCATGGTTTACAACTTGGAA) was used to validate the genotypes of 354 F2 individuals derived from the cross of Heinz 1706 × P502 hybridization. The results showed that this KASP marker was co-segregated with internode length (Figure S2), with a 100% accuracy rate. It further confirmed that SNP mutation is associated with the elongated internode.

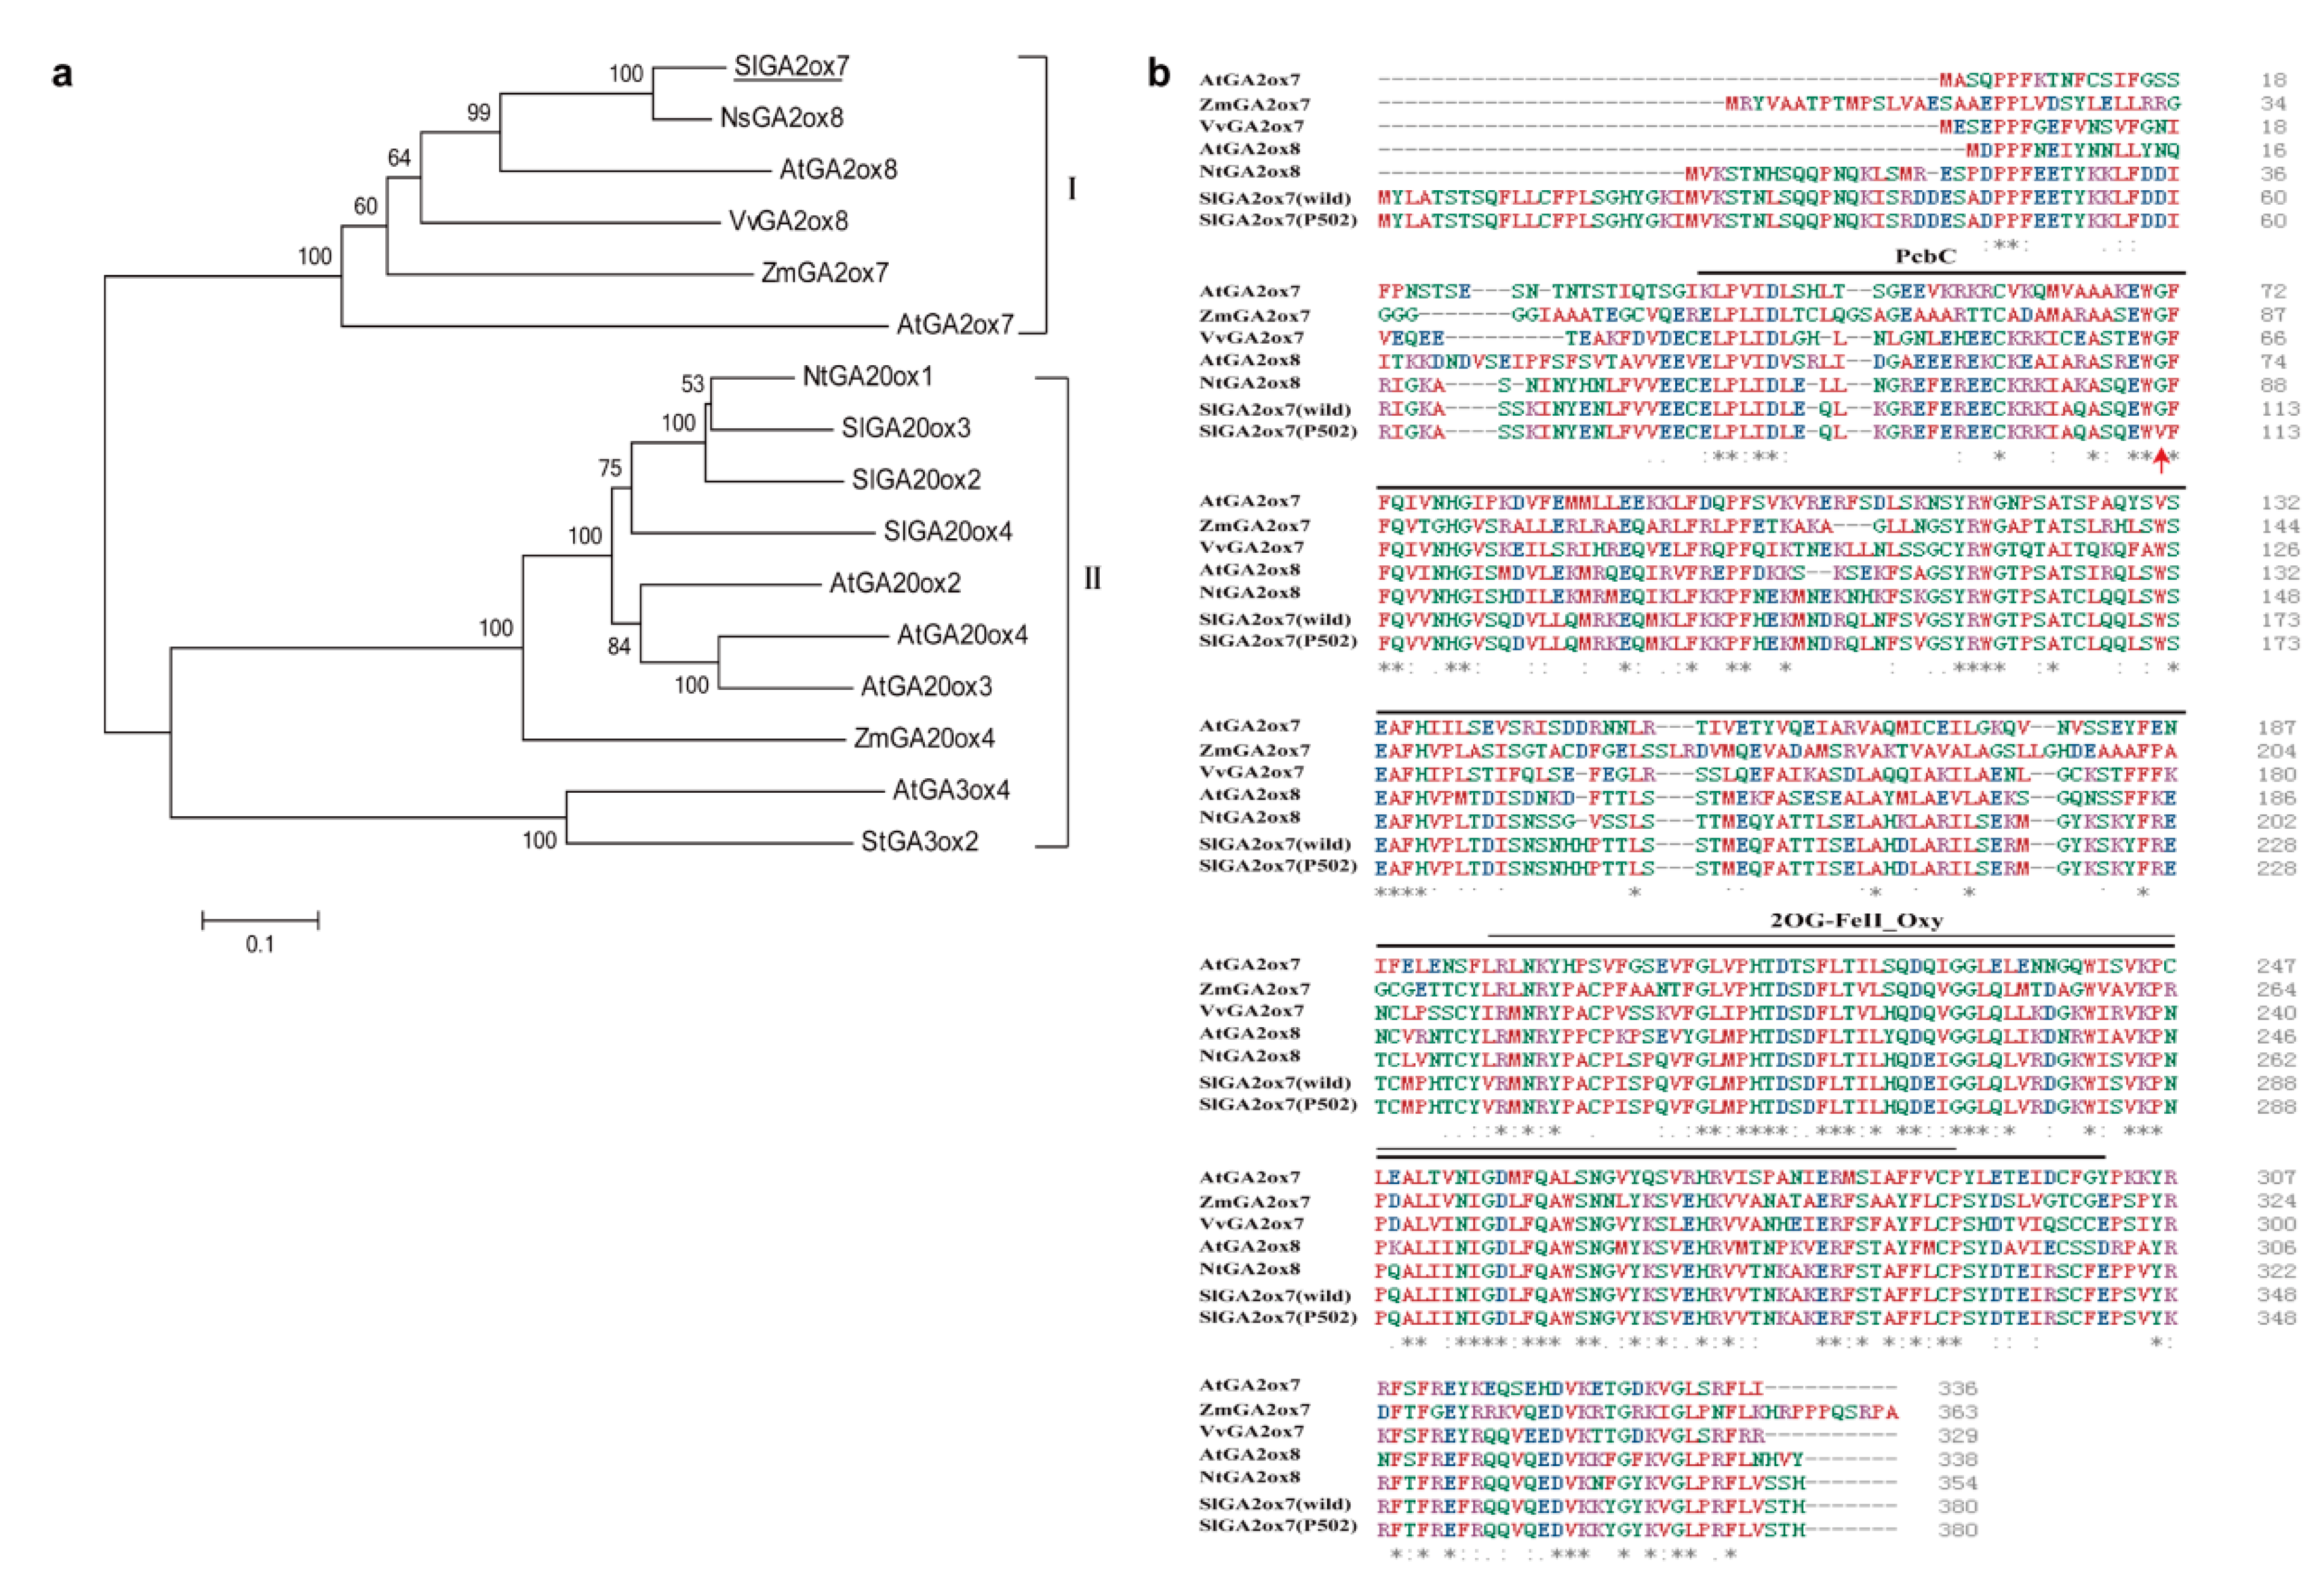
2.5. Protein Sequence Alignment and Phylogenetic Analysis of SlGA2ox7

According to the gene annotation, EI encodes the SlGA2ox7 enzyme, which comprises 380 amino acids. The sequence alignment and phylogenetic analysis revealed that GA2ox7 and GA2ox8 are clustered in one group, which is separate from GA20oxs and GA3oxs (Figure 5a), indicating that GA2ox7 and GA2ox8 are conserved in tobacco, Arabidopsis, maize, and grape. Moreover, amino acid position 112 of wild-type SlGA2ox7 is a hydrophilic glycine, whereas it is a hydrophobic valine in P502. The SlGA2ox7 at this position is located within a conserved region of the PcbC superfamily (Figure 5b), indicating that the altered hydrophobicity of the amino acid may affect the function of SlGA2ox7.

2.6. Overexpression of Wild-Type EI in P502 Resulted in Dwarfism

To confirm the function of EI, the recombinant plasmid 35S: EI was introduced into the mutant P502. Transgenic plants were obtained after screening for regenerated shoots on selection medium containing kanamycin. The transgenic plants were analyzed further by PCR with primers NPTII-F and NPTII-R, and two positive transgenic plants (T0-1 and T0-2) were obtained. The EI-overexpressing transgenic T1 homozygous lines (OE-1 and OE-2) exhibited dwarfism with shortened internodes (CK: 36.00 ± 1.32 cm; OE-1: 24.7 ± 1.14 cm; OE-2: 8.53 ± 0.91 cm) (Figure 6a). The EI expression level was 1.44-fold and 14-fold higher in the OE-1 and OE-2 plants, respectively, than in the P502 control plants (Figure 6b). These results indicated that overexpression of EI could result in dwarf phenotype with shortened internodes, and the degree of shortness is related to the expression level of EI.

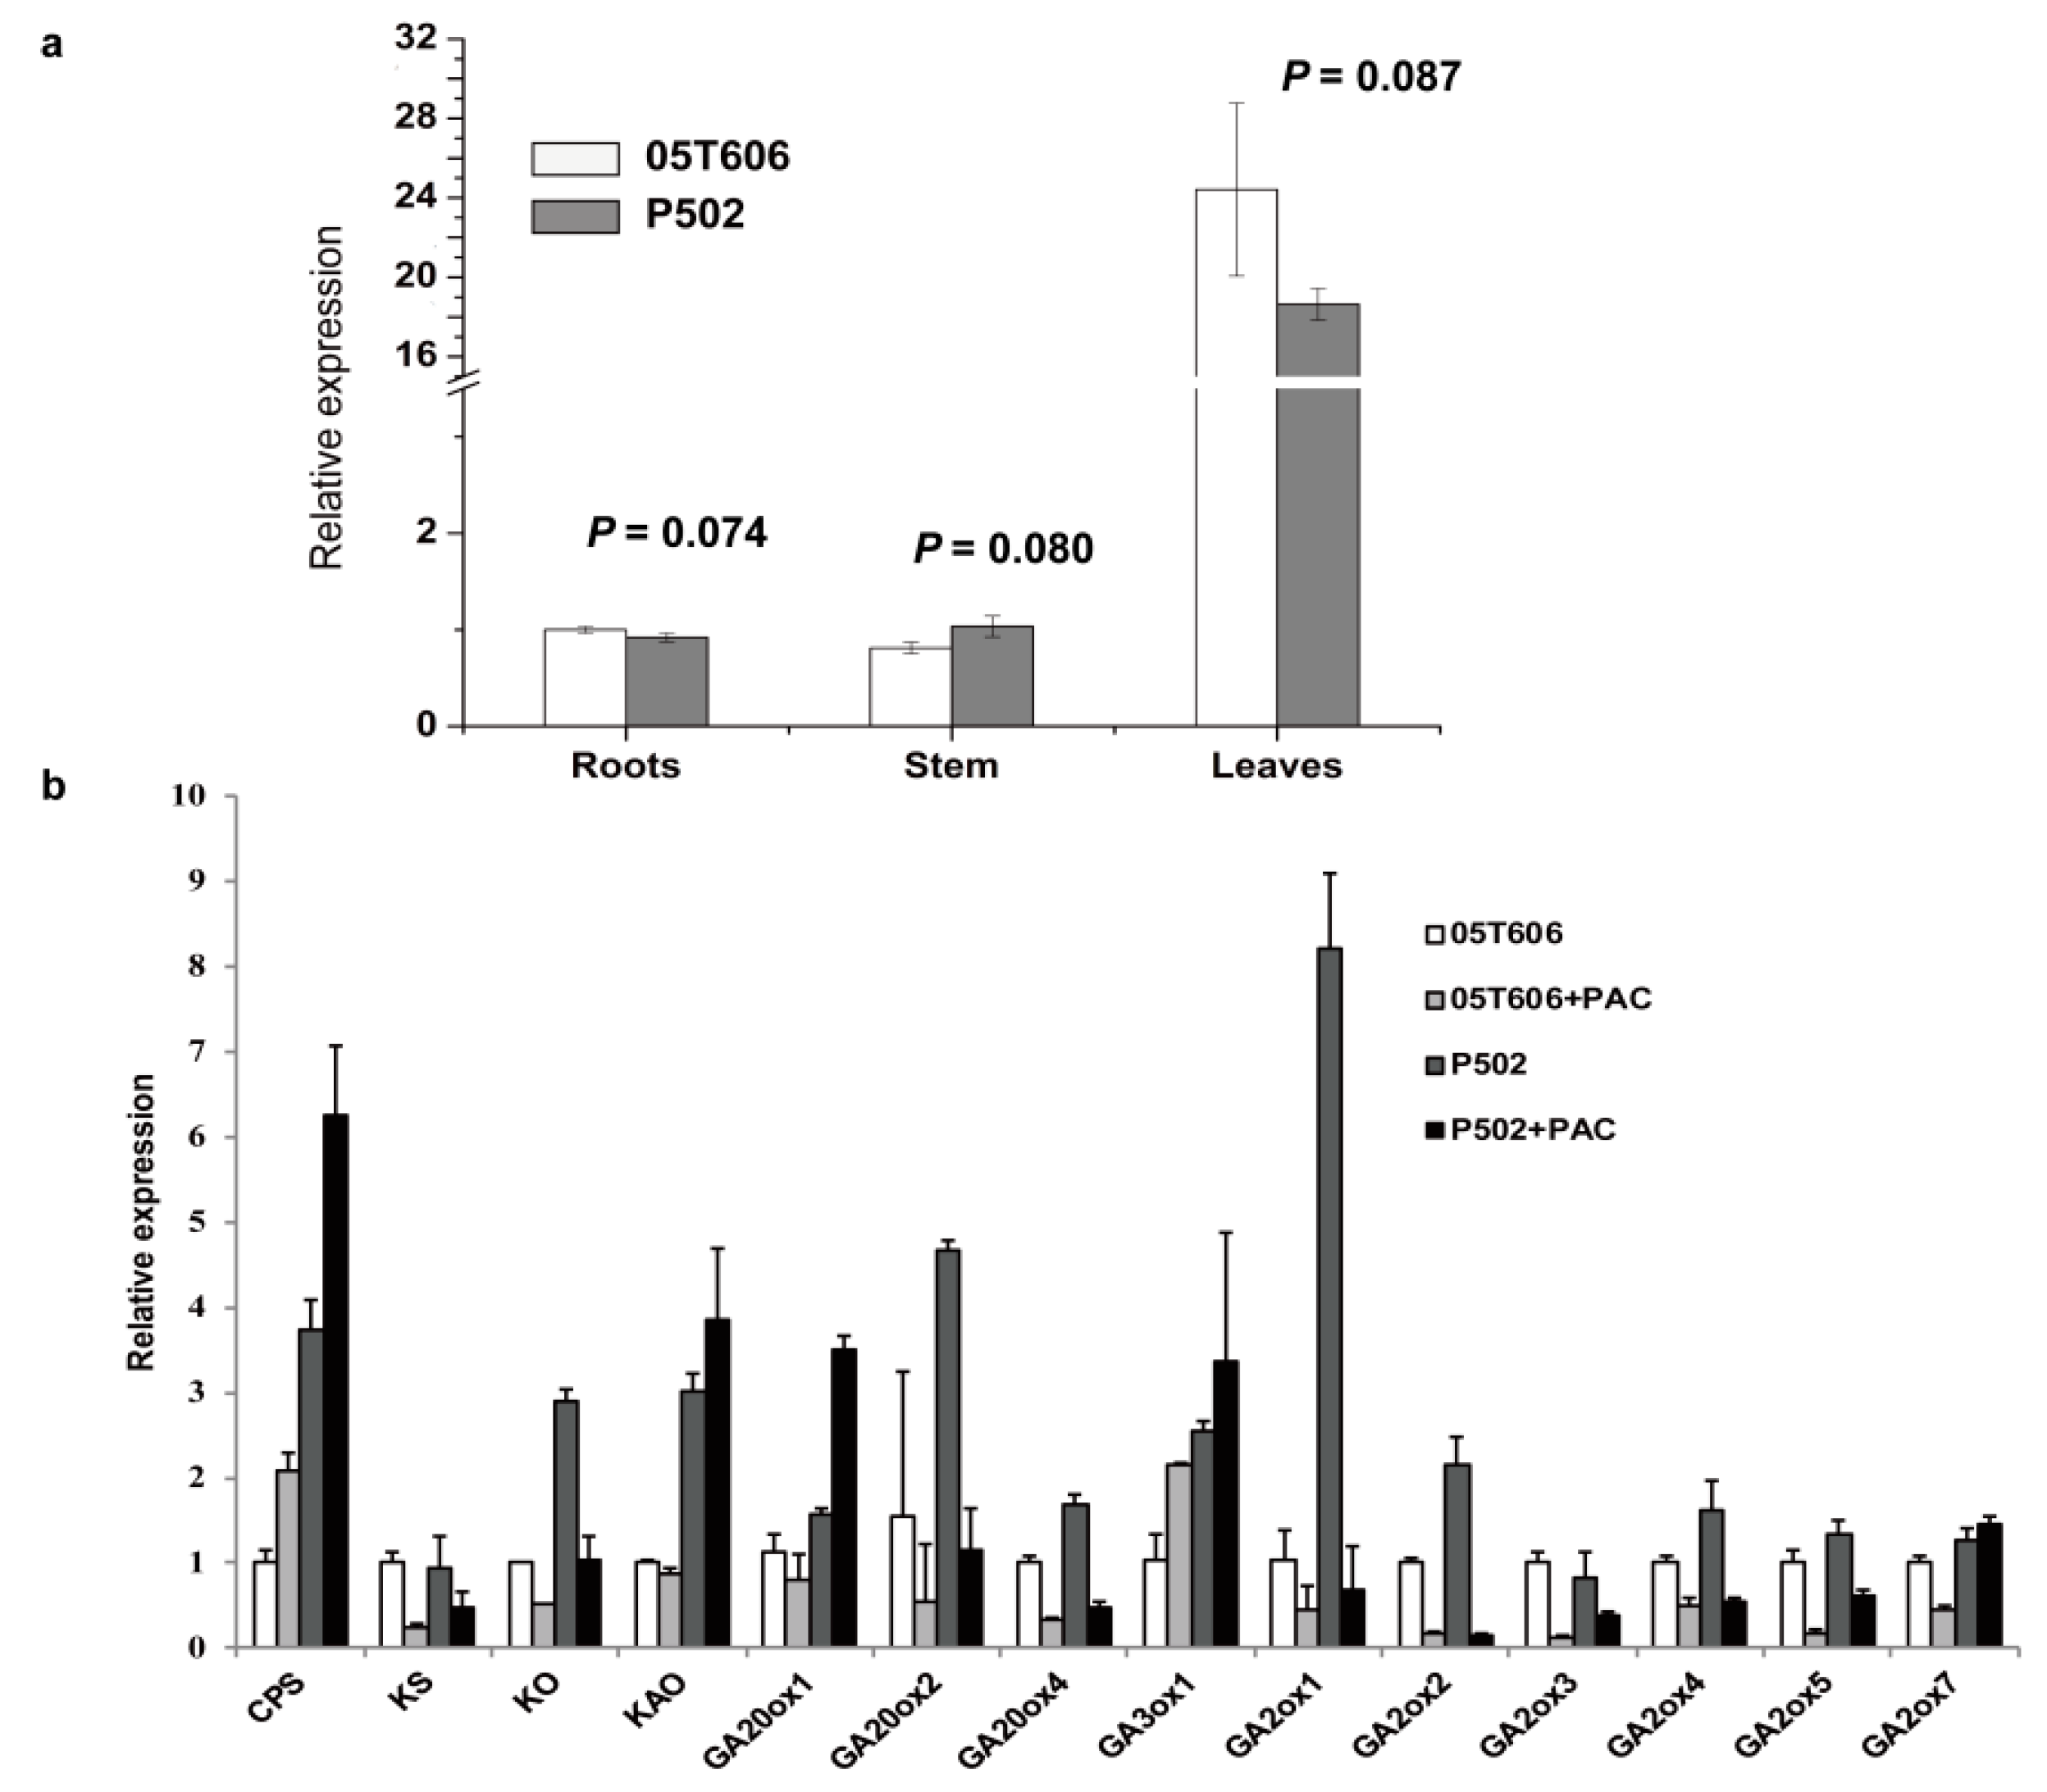
2.7. The Expression Analysis of GA Metabolic Pathway-Related Genes

To study the spatiotemporal expression patterns of EI, total RNA was extracted from the leaves, stem (the third internode), and roots of 40-day-old wild-type and mutant P502 seedlings. The results of a qRT-PCR assay indicated that EI was expressed in the leaves, stem, and roots (Figure 7a), and the expression level in the leaves was more than 18-fold higher than that in the stem and roots. Interestingly, the differences of expression levels were not significant (p > 0.05) in the wild-type and mutant P502 (Figure 7a), indicating the G-to-T mutation does not alter the expression level of the EI.
Many genes are involved in the GA biosynthetic pathway. CPS, KS, and KO are each encoded by a single gene in most plant species examined. However, the cytosol-localized GA20ox, GA3ox, and GA2ox each is encoded by a small gene family [41]. The qRT-PCR assay indicated that CPS, KO, KAO, GA20ox1, GA20ox2, GA20ox4, GA3ox1, GA2ox1, GA2ox2, GA2ox4, and GA2ox5, were more highly expressed in P502 than in the wild-type 05T606. PAC treatment decreased the expression levels of KS, KO, GA20ox2, GA20ox4, GA2ox1, GA2ox2, GA2ox3, GA2ox4, and GA2ox5, but increased the expression level of CPS and GA3ox1. However, the expression of EI (GA2ox7) in P502 was not significantly changed after PAC treatment (Figure 7b).

3. Discussion

The GA-related mutants have been categorized into GA-deficient (GA-sensitive) mutants and GA-insensitive mutants according to their response to exogenous GAs [42]. In GA-deficient dwarfs, the normal phenotype can be restored by the application of exogenous GAs and the mutations are usually due to a deficiency in the GA metabolic pathway [43]. In GA-insensitive types, the mutants are deficient in GA signaling and exhibit altered GA responses or the constitutive activation of GA responses [29,30,31,44]. In our study, the plant height of wild-type and the mutant P502 increased by 58.2% and 20.5%, respectively, after GA3 treatment, whereas PAC treatment decreased the height of the wild-type by 57.6%, and the mutant P502 by 61.0% (Figure 2a–d). These results indicated that the mutant P502 was responsive to GA3 and PAC, and the mutation was related to the GA metabolic pathway. In addition, it was found that mutant P502 was far less sensitive to GA3 and more sensitive to PAC compared with the wild-type. This may be caused by a higher GA concentration of mutant P502 (Figure 2e), which reduced its sensitivity to GA3 and increased its sensitivity to PAC.
GA2ox members are thought to disable GA functions by hydroxylating the C-2 position of active GAs or their precursors. The genes encoding 2-oxidases have been isolated from Arabidopsis, rice, spinach, and pea [45,46,47,48]. However, few GA2-oxidase genes have been isolated from tomato. In our study, we isolated the tomato EI gene by map-based cloning. The EI gene encodes SlGA2ox7, which belongs to GA2-oxidase. A point mutation in the exon region of EI gene resulted in the amino acid mutation (glycine to valine) of SlGA2ox7. GA2ox7 or GA2ox8 is conserved in various species (Figure 5a), and amino acid mutation occurs in the conserved domain of the PcbC superfamily (Figure 5b). Overexpression of EI inhibited the internode elongation of mutant P502, leading to dwarfism with a shortened internode (Figure 6a). These results are consistent with the research reported by Schomburg et al. [45], who revealed that the overexpression of AtGA2ox7 and AtGA2ox8 induced a dwarf phenotype of Arabidopsis and tobacco. Similar results have been obtained in transgenic plants overexpressing GA 2-oxidases from rice (O. sativa) [49]. Taken together, the elongated internode is caused by the loss-of-function of SlGA2ox7.
So far, three different kinds of GA deactivation have been identified. One type of GA2oxs hydroxylates the C-2 of active C19-GAs (GA1 and GA4) or C19-GA precursors (GA20 and GA9) to produce biologically inactive GAs (GA8, GA34, GA29, and GA51, respectively) [18]. Another type of GA2oxs including AtGA2ox7, AtGA2ox8, OsGA2ox5, OsGA2ox6, and SoGA2ox3 (Spinacia oleracea) accept C20-GAs (GA12 and GA53) as their substrates to produce GA110 and GA97, respectively [45,50]. In addition, the recombinant SoGA2ox1 can work on both C19-GA and C20-GA substrates [47]. Although SlGA2ox7 is orthologous to NsGA2ox8 and AtGA2ox8, whether they catalyze the same substrate needs further research.
Bioactive GA (GA1, GA3, GA4, and GA7) concentrations are maintained mainly by the balanced activities of GA 3-oxidases (GA3oxs) and GA 20-oxidases (GA20oxs), essential enzymes regulating GA biosynthesis, and GA 2-oxidases (GA2oxs) necessary for GA inactivation [51]. In our study, the expression of EI (GA2ox7) did not significantly change in the mutant P502 compared with the wild-type 05T606 (Figure 7a), indicating that the mutation of EI did not affect its transcript level. However, the expression of GA biosynthesis pathway genes including CPS, KO, KAO, GA20ox1, GA20ox2, GA20ox4, GA3ox1, GA2ox1, GA2ox2, GA2ox4 and GA2ox5 were increased (Figure 7b). Similarly, the dw mutant of the soybean had lower expression levels of CPS and GA20oxs than the wild-type [19]. These results indicated that the mutations of genes related to GA synthesis may regulate the expression of other genes involved in the GA biosynthesis pathway by changing the GA concentrations. After exogenous PAC treatment, the growths of the mutant P502 and wild-type 05T606 were blocked. The expression levels of KS, KO, GA20ox2, GA20ox4, GA2ox1, GA2ox2, GA2ox3, GA2ox4, and GA2ox5, were downregulated (Figure 7b), revealing that these genes may be involved in the homeostatic maintenance of bioactive GA levels. Interestingly, the expression of the EI (GA2ox7) gene in the mutant P502 was not significantly changed after PAC treatment. We speculated that the mutation of EI may result in more complex regulation of GA homeostasis.
Tomato cultivars with determinate growth habit, compact, and short internode have been developed for commercial use [35]. The sp gene controlling determinate growth habit was cloned and the introduction of the sp allele into tomato cultivars has transformed the industry by creating a major modification in plant architecture [52]. However, few genes controlling internode elongation have been cloned. In our study, the EI gene for internode elongation was identified by map-based cloning and this gene encodes SlGA2ox7. Increased expression of EI caused different degrees of dwarfism, which may provide a useful resource for improving the plant architecture in tomato. Meanwhile, the co-segregated KASP marker developed in our study might be useful for high throughput maker assistant selection (MAS) in short internode breeding programs.

4. Materials and Methods

4.1. Plant Materials

Three determinate tomato inbred lines, P502, 05T606, and Heinz 1706, were used in this study. The mutant P502 shows an elongated internode, derived from a natural mutant of tomato cultivar 05T606. These were generated at the Institute of Vegetables and Flowers, Chinese Academy of Agricultural Sciences. Heinz 1706 was obtained from the Tomato Genetics Resource Center and displays a normal internode length, which is significantly shorter than the mutant P502 [53].
The mutant P502 (as the male parent) and Heinz 1706 (as the female parent) were hybridized to obtain an F1 generation, and F1 plants were self-pollinated to generate the F2 population, which were used for inheritance analysis and fine mapping. All of the plant materials were grown in a greenhouse in Beijing, China. The average day and night temperatures were set at 25 °C and 20 °C, respectively.

4.2. Scanning Electron Microscopy Observation

To measure the cell lengths, the third internode was collected from 40-day-old 05T606 and P502 seedlings. The internode was cut into 5-mm segments and fixed in 3.5% glutaraldehyde for 24 h at room temperature. After washing in 0.1 M phosphate buffer (pH 7.4), the samples were fixed in 1% osmic acid for 2 h, dehydrated in a graded ethanol series, and dried in a Leica-EM CPD 300 desiccator (Leica, Frankfurt, Germany). Longitudinal sections were prepared by cutting the middle of the internode, which was then coated with a gold film. The pith cells at approximately the center of the stem were visualized and photographed with the Hitachi SU 8010 scanning election microscope (Hitachi, Tokyo, Japan). The cell length was measured with IMAGEJ software [54].

4.3. Exogenous GA3 Treatments and Endogenous GA Quantification

To assess the response of P502 and 05T606 to GAs, the aerial parts of the 20-day-old seedlings were separately sprayed with 10−5 M GA3 (Sigma, St. Louis Missouri, USA) and 10−7 M paclobutrazol (PAC, GA biosynthesis inhibitor; Biotopped, Beijing, China) [55] solutions containing 0.02% Tween-20 at an interval of one day. Control plants were sprayed with water. We sprayed ten times, and stopped at 40-day-old seedlings. The effects of GA3 and PAC on stem expansion (from the cotyledons to the uppermost internode) were evaluated every four days. Each treatment was completed with three replicates (each with eight plants).
To determine the concentration of endogenous GAs, the first five internodes from the 30-day-old seedlings of P502 and wild-type 05T606 were collected into three biological replicates. Each biological replicate contained 1 g of tissue fresh weight. Tissue was immediately frozen in liquid nitrogen, and then was stored at −80 °C. The phytohormone extraction and quantitative profiling of GAs (GA1, GA4, GA9, GA19, and GA20) were performed by HPLC-MS/MS [56].

4.4. DNA Extraction and Molecular Marker Development

A single young leaf was collected from each plant at 2-week-old seedlings. Genomic DNA was extracted according to a modified CTAB method [57] and then diluted to a concentration of 100–150 ng/µL in RNase (10 mg/mL) H2O (1:100). To develop new markers, the elongated internode line P502 was sequenced with the Illumina HiSeq PE150 system, with a 50× genome coverage (Sequence Read Archive accession number: PRJNA540748). According to differences with the reference genome sequence (Heinz 1706), insertion and deletion (InDel) and competitive allele specific PCR (KASP) markers were designed using Primer Premier 5.0 software [58], and cleaved amplified polymorphic sequence (CAPS) markers were designed by dCAPS Finder 2.0 [59].

4.5. Mapping Strategy

The mean internode lengths from the first internode to the fifth internode (starting from the cotyledons) of 40-day-old seedlings were recorded for phenotypic analysis [36,53]. The bulked segregant analysis (BSA) strategy was used for the quick identification of molecular markers linked with the target locus [60]. Two DNA bulks, the elongated internode bulk (E bulk) and the normal internode bulk (N bulk), were generated by pooling equal amounts of DNA from ten elongated internode and ten normal F2 plants, respectively.
To screen for polymorphic makers, the two parents were genotyped with 372 InDel markers across 12 tomato chromosomes (unpublished). All polymorphic markers were used to analyze the two bulked DNA samples. The target chromosome was identified based on the BSA results. Subsequently, QTL mapping was conducted according to the internode lengths of 354 F2 individuals and genotypes of ideal markers on the target chromosome by using JoinMap 4.0 and MapQTL 6.0 [61,62]. After flanking markers were identified, another 956 F2 individuals derived from the same cross were used for selecting recombinants. The F3 individuals from eight F2 recombinants were obtained for the confirmation of the progeny phenotype. Each F2:3 contained 60 plants, and the internode lengths were evaluated on 40-day-old seedlings. Details regarding the polymorphic markers are provided in Table 4.

4.6. RNA Extraction and qRT-PCR

Total RNA was extracted using an RNA pure kit (Aidlab, Beijing, China) following the user manual. First-strand cDNA was synthesized using TransScript One-Step gDNA Removal and cDNA Synthesis SuperMix (Transgene, Beijing, China). A quantitative real-time polymerase chain reaction (qRT-PCR) assay was conducted using a SYBR Green reagent (Yeasen, Shanghai, China) and the LightCycler 480 Real-Time detection system (Roche, Basel, Switzerland). Housekeeping gene actin (solyc03g078400) was used as an internal control to normalize the data. Details regarding the qRT-PCR primers are listed in Table S1 [63]. The qRT-PCR data for each sample were validated with three biological and three technical replicates. The relative expression levels were quantified according to the 2−ΔΔCt method [64].

4.7. Protein Sequence Alignment and Phylogenetic Analysis

The sequence was retrieved from the National Center for Biotechnology Information database (NCBI). The BLASTP program [65] was used for homology searches in GenBank. A multiple protein sequence alignment was performed by the ClustalW program, and the phylogenetic tree was constructed according to the neighbor-joining method of the MEGA 6.0 program with 1000 bootstrap replicates [66].

4.8. Plasmid Construction and Transformation

The genomic clone including the whole EI coding region was amplified from full-length cDNA of wild-type 05T606 with primers OE-F (5′-CACGGGGGACTCTAGAATGTACTTAGCCACCTCCA-3′) and OE-R (5′-GATCGGGGAAATTCGAGCTCTTAGTGAGTTGAGACAAGAAAC-3′). The amplified fragment was cloned into the XbaI and SacI sites of the binary vector pBI121 by using an In-Fusion HD Cloning Kit (Takara, Dalian, China) to generate an EI transformation plasmid under the control of the CaMV35S promoter. The plasmid mediated by Agrobacterium tumefaciens strain GV3101 was transformed into the mutant P502 as described by the method of Sharma et al. [67]. After screening for regenerated shoots on the selection medium, the transgenic plants were further confirmed by PCR using NPTII-F (5′-GACAATCGGCTGCTCTGA-3′) and NPTII-R (5′-AACTCCAGCATGAGATCC-3′) primers. The positive transgenic plants were selected and the T1 generation was obtained for phenotypic observation and gene expression analysis.
Accession numbers: SlGA2ox7 (XP_004232746), NsGA2ox8 (NP_001289506.1), AtGA2ox8 (NP_193852.2), AtGA2ox7 (NP_175509.1), VvGA2ox8 (NP_001268435.1), ZmGA2ox7 (NP_001148252.2), NtGA20ox1 (NP_001313089.1), SlGA20ox3 (NP_001234579.1), SlGA20ox2 (NP_001234628.2), SlGA20ox4 (NP_001234363.1), AtGA20ox2 (NP_199994.1), AtGA20ox4 (NP_176294.1), AtGA20ox3 (NP_196337.1), ZmGA20ox4 (NP_001308615.1) StGA3ox2 (NP_001275412.1), and AtGA3ox4 (NP_178149.1).

Supplementary Materials

Supplementary materials can be found at https://www.mdpi.com/1422-0067/20/9/2204/s1.

Author Contributions

J.L., L.L., J.S., and X.S. conceived and designed the experiments; X.S., J.S., A.M.A.M., and X.D. performed the experiments; X.S. analyzed the data and prepared the manuscript; J.S. improved the manuscript; X.Z., J.B., Y.C., and X.L. assisted in the field experiment; J.L., L.L., J.S., Y.D., X.W., Z.H., and Y.G. contributed reagents and materials; J.L. provided guidance on the whole study and revised the manuscript. All authors read and approved the final manuscript.

Funding

This work was supported by the National Natural Science Foundation of China (Grant No. 31872103), the National Key Research and Development Program of China (Grant No. 2016YFD0101703), the China Postdoctoral Science Foundation (2017M623289, 2018T111123), the Fundamental Research Funds for Central Non-profit Scientific Institution (IVF-BRF2018007), the Key Laboratory of Biology and Genetic Improvement of Horticultural Crops, Ministry of Agriculture, China, and the Science and Technology Innovation Program of the Chinese Academy of Agricultural Sciences (Grant No. CAAS-ASTIPIVFCAAS).

Conflicts of Interest

The authors declare that they have no conflicts of interest.

References

  1. Salas Fernandez, G.S.; Becraft, P.W.; Yin, Y.; Lübberstedt, T. From dwarves to giants? Plant height manipulation for biomass yield. Trends Plant Sci. 2009, 14, 454–461. [Google Scholar] [CrossRef] [PubMed]
  2. Itoh, H.; Tatsumi, T.; Sakamoto, T.; Otomo, K.; Toyomasu, T.; Kitano, H.; Ashikari, M.; Ichihara, S.; Matsuoka, M. A rice semi-dwarf gene, Tan-Ginbozu (D35), encodes the gibberellin biosynthesis enzyme, ent-kaurene oxidase. Plant Mol. Biol. 2004, 54, 533–547. [Google Scholar] [CrossRef]
  3. Peng, J.; Richards, D.E.; Hartley, N.M.; Murphy, G.P.; Devos, K.M.; Flintham, J.E.; Beales, J.; Fish, L.J.; Worland, A.J.; Pelica, F.; et al. Green revolution’ genes encode mutant gibberellin response modulators. Nature 1999, 400, 256–261. [Google Scholar] [CrossRef]
  4. Hedden, P. The genes of the Green Revolution. Trends Genet. 2003, 19, 5–9. [Google Scholar] [CrossRef]
  5. Khush, G.S. Green revolution: The way forward. Nat. Rev. Genet. 2001, 2, 815–822. [Google Scholar] [CrossRef] [PubMed]
  6. Md. Babul, A.; Piao, R.; Reflinur; Md. Lutfor, R.; Yunjoo, L.; Jeonghwan, S.; Backki, K.; Hee-Jong, K. Characterization and mapping of d13, a dwarfing mutant gene, in rice. Genes Genom. 2015, 37, 893–903. [Google Scholar]
  7. Hong, Z.; Ueguchi-Tanaka, M.; Umemura, K.; Uozu, S.; Fujioka, S.; Takatsuto, S.; Yoshida, S.; Ashikari, M.; Kitano, H.; Matsuoka, M. A rice brassinosteroid-deficient mutant, ebisu dwarf (d2), is caused by a loss of function of a new member of cytochrome P450. Plant Cell 2003, 15, 2900–2910. [Google Scholar] [CrossRef]
  8. Zhou, H.; He, S.; Cao, Y.; Chen, T.; Du, B.; Chu, C.; Zhang, J.; Chen, S. OsGLU1, a putative membrane-bound endo-1,4-ß-D-glucanase from rice, affects plant internode elongation. Plant Mol. Biol. 2006, 60, 137–151. [Google Scholar] [CrossRef]
  9. Chen, Y.; Hou, M.; Liu, L.; Wu, S.; Shen, Y.; Ishiyama, K.; Kobayashi, M.; McCarty, D.R.; Tan, B.C. The maize DWARF1 encodes a gibberellin 3-oxidase and is dual localized to the nucleus and cytosol. Plant Physiol. 2014, 166, 2028–2039. [Google Scholar] [CrossRef]
  10. Li, X.; Zhou, Z.; Ding, J.; Wu, Y.; Zhou, B.; Wang, R.; Ma, J.; Wang, S.; Zhang, X.; Xia, Z.; et al. Combined linkage and association mapping reveals QTL and candidate genes for plant and ear height in maize. Front Plant Sci. 2016, 7, 833. [Google Scholar] [CrossRef]
  11. Teng, F.; Zhai, L.; Liu, R.; Bai, W.; Wang, L.; Huo, D.; Tao, Y.; Zheng, Y.; Zhang, Z. ZmGA3ox2, a candidate gene for a major QTL, qPH3.1, for plant height in maize. Plant J. 2013, 73, 405–416. [Google Scholar] [CrossRef] [PubMed]
  12. Tian, X.; Wen, W.; Xie, L.; Fu, L.; Xu, D.; Fu, C.; Wang, D.; Chen, X.; Xia, X.; Chen, Q.; et al. Molecular mapping of reduced plant height gene Rht24 in Bread Wheat. Front. Plant Sci. 2017, 8, 1379. [Google Scholar] [CrossRef]
  13. Zhai, H.; Feng, Z.; Li, J.; Liu, X.; Xiao, S.; Ni, Z.; Sun, Q. QTL analysis of spike morphological traits and plant height in Winter Wheat (Triticum aestivum L.) using a high-density SNP and SSR-based linkage map. Front Plant Sci. 2016, 7, 1617. [Google Scholar] [CrossRef] [PubMed]
  14. Multani, D.S.; Briggs, S.P.; Chamberlin, M.A.; Blakeslee, J.J.; Murphy, A.S.; Johal, G.S. Loss of an MDR transporter in compact stalks of maize br2 and sorghum dw3 mutants. Science 2003, 302, 81–84. [Google Scholar] [CrossRef]
  15. Yamaguchi, M.; Fujimoto, H.; Hirano, K.; Araki-Nakamura, S.; Ohmae-Shinohara, K.; Fujii, A.; Tsunashima, M.; Song, X.J.; Ito, Y.; Nagae, R.; et al. Sorghum Dw1, an agronomically important gene for lodging resistance, encodes a novel protein involved in cell proliferation. Sci. Rep. 2016, 6, 28366. [Google Scholar] [CrossRef] [PubMed]
  16. Liu, C.; Zheng, S.; Gui, J.; Fu, C.; Yu, H.; Song, D.; Shen, J.; Qin, P.; Liu, X.; Han, B.; et al. Shortened Basal Internodes encodes a gibberellin 2-oxidase and contributes to lodging resistance in rice. Mol. Plant 2018, 11, 288–299. [Google Scholar] [CrossRef] [PubMed]
  17. Helliwell, C.A.; Sheldon, C.C.; Olive, M.R.; Walker, A.R.; Zeevaart, J.A.; Peacock, W.J.; Dennis, E.S. Cloning of the Arabidopsis ent-kaurene oxidase gene GA3. Proc. Natl. Acad. Sci. USA 1998, 95, 9019–9024. [Google Scholar] [CrossRef]
  18. Sakamoto, T.; Miura, K.; Itoh, H.; Tatsumi, T.; Ueguchi-Tanaka, M.; Ishiyama, K.; Kobayashi, M.; Agrawal, G.K.; Takeda, S.; Abe, K.; et al. An overview of gibberellin metabolism enzyme genes and their related mutants in rice. Plant Physiol. 2004, 135, 1642–1653. [Google Scholar] [CrossRef] [PubMed]
  19. Li, Z.; Guo, Y.; Ou, L.; Hong, H.; Wang, J.; Liu, Z.; Guo, B.; Zhang, L.; Qiu, L. Identification of the dwarf gene GmDW1 in soybean (Glycine max L.) by combining mapping-by-sequencing and linkage analysis. Theor. Appl. Genet. 2018, 131, 1001–1016. [Google Scholar] [CrossRef]
  20. Richards, D.E.; King, K.E.; Ait-Ali, T.; Harberd, N.P. How gibberellin regulates plant growth and development: A molecular genetic analysis of gibberellin signaling. Annu. Rev. Plant Physiol. Plant Mol. Biol. 2001, 52, 67–88. [Google Scholar] [CrossRef]
  21. Hedden, P.; Thomas, S.G. Gibberellin biosynthesis and its regulation. Biochem. J. 2012, 444, 11–25. [Google Scholar] [CrossRef] [Green Version]
  22. Sasaki, A.; Ashikari, M.; Ueguchi-Tanaka, M.; Itoh, H.; Nishimura, A.; Swapan, D.; Ishiyama, K.; Saito, T.; Kobayashi, M.; Khush, G.S.; et al. Green revolution: A mutant gibberellin-synthesis gene in rice. Nature 2002, 416, 701–702. [Google Scholar] [CrossRef] [PubMed]
  23. Spielmeyer, W.; Ellism, M.H.; Chandler, P.M. Semidwarf (sd-1), ‘green revolution’ rice, contains a defective gibberellin 20-oxidase gene. Proc. Natl. Acad. Sci. USA 2002, 99, 9043–9048. [Google Scholar] [CrossRef] [PubMed]
  24. Koorneef, M.; Elgersma, A.; Hanhart, C.J.; Van Loenen Martinet, E.P.; Van Rijn, L.; Zeevaart, J.A. A gibberellin insensitive mutant of Arabidopsis thaliana. Physiol Plant. 2010, 65, 33–39. [Google Scholar] [CrossRef]
  25. Peng, J.; Carol, P.; Richards, D.E.; King, K.E.; Cowling, R.J.; Murphy, G.P.; Harberd, N.P. The Arabidopsis GAI gene defines a signaling pathway that negatively regulates gibberellin responses. Gene Dev. 1997, 11, 3194–3205. [Google Scholar] [CrossRef] [PubMed]
  26. Harberd, N.P.; Freeling, M. Genetics of dominant gibberellin-insensitive dwarfism in maize. Genetics 1989, 121, 827–838. [Google Scholar]
  27. Winkler, R.G.; Freeling, M. Physiological genetics of the dominant gibberellin-nonresponsive maize dwarfs, Dwarf 8 and Dwarf 9. Planta 1994, 193, 341–348. [Google Scholar] [CrossRef]
  28. Ogawa, M.; Kusano, T.; Katsumi, M.; Sano, H. Rice gibberellin-insensitive gene homolog, OsGAI, encodes a nuclear-localized protein capable of gene activation at transcriptional level. Gene 2000, 245, 21–29. [Google Scholar] [CrossRef]
  29. Fu, X.D.; Richards, D.E.; Ait-Ali, T.; Hynes, L.W.; Ougham, H.; Peng, J.; Harberd, N.P. Gibberellin-mediated proteasome-dependent degradation of the barley DELLA protein SLN1 repressor. Plant Cell 2002, 14, 3191–3200. [Google Scholar] [CrossRef]
  30. Ikeda, A.; Ueguchi-Tanaka, M.; Sonoda, Y.; Kitano, H.; Koshioka, M.; Futsuhara, Y.; Matsuoka, M.; Yamaguchi, J. Slender rice, a constitutive gibberellin response mutant, is caused by a null mutation of the SLR1 gene, an ortholog of the height-regulating gene GAI/RGA/RHT/D8. Plant Cell 2001, 13, 999–1010. [Google Scholar] [CrossRef]
  31. Carrera, E.; Ruiz-Rivero, O.; Peres, L.E.; Atares, A.; Garcia-Martinez, J.L. Characterization of the procera tomato mutant shows novel functions of the SlDELLA protein in the control of flower morphology, cell division and expansion, and the auxin-signaling pathway during fruit-set and development. Plant Physiol. 2012, 160, 1581–1596. [Google Scholar] [CrossRef]
  32. Yamamuro, C.; Ihara, Y.; Wu, X.; Noguchi, T.; Fujioka, S.; Takatsuto, S.; Ashikari, M.; Kitano, H.; Matsuoka, M. Loss of function of a rice brassinosteroid insensitive1 homolog prevents internode elongation and bending of the lamina joint. Plant Cell 2000, 12, 1591–1606. [Google Scholar] [CrossRef]
  33. Lin, H.; Wang, R.; Qian, Q.; Yan, M.; Meng, X.; Fu, Z.; Yan, C.; Jiang, B.; Su, Z.; Li, J.; et al. DWARF27, an iron-containing protein required for the biosynthesis of strigolactones, regulates rice tiller bud outgrowth. Plant Cell 2009, 21, 1512–1525. [Google Scholar] [CrossRef]
  34. Jiang, L.; Liu, X.; Xiong, G.; Liu, H.; Chen, F.; Wang, L.; Meng, X.; Liu, G.; Yu, H.; Yuan, Y.; et al. DWARF 53 acts as a repressor of strigolactone signalling in rice. Nature 2013, 504, 401–405. [Google Scholar] [CrossRef]
  35. Foolad, M.R. Genome mapping and molecular breeding of tomato. Int. J. Plant Genom. 2007, 2007, 64358. [Google Scholar] [CrossRef] [PubMed]
  36. Martí, E.; Gisbert, C.; Bishop, G.J.; Dixon, M.S.; Garcíamartínez, J.L. Genetic and physiological characterization of tomato cv. Micro-Tom. J. Exp. Bot. 2006, 57, 2037–2047. [Google Scholar] [CrossRef] [Green Version]
  37. Barabaschi, D.; Tondelli, A.; Desiderio, F.; Volante, A.; Vaccino, P.; Valè, G.; Cattivelli, L. Next generation breeding. Plant Sci. 2016, 242, 3–13. [Google Scholar] [CrossRef]
  38. Tong, G.L.; Samuel, F.H. Fine mapping of the brachytic locus on the tomato genome. J. Amer. Soc. Hort. Sci. 2018, 143, 239–247. [Google Scholar]
  39. Cowling, R.J.; Kamiya, Y.; Seto, H.; Harberd, N.P. Gibberellin dose-response regulation of GA4 gene transcript levels in Arabidopsis. Plant Physiol. 1998, 117, 1195–1203. [Google Scholar] [CrossRef] [PubMed]
  40. Mueller, L.A.; Solow, T.H.; Taylor, N.; Skwarecki, B.; Buels, R.; Binns, J.; Lin, C.; Wright, M.H.; Ahrens, R.; Wang, Y.; Herbst, E.V.; Keyder, E.R.; Menda, N.; Zamir, D.; Tanksley, S.D. The SOL Genomics Network: A comparative resource for Solanaceae biology and beyond. Plant Physiol. 2005, 138, 1310–1317. [Google Scholar] [CrossRef]
  41. Olszewski, N.; Sun, T.P.; Gubler, F. Gibberellin signaling: Biosynthesis, catabolism, and response pathways. Plant Cell 2002, 14, S61–S80. [Google Scholar] [CrossRef]
  42. Mitsunaga, S.; Tashiro, T.; Yamaguchi, J. Identification and characterization of gibberellin-insensitive mutants selected from among dwarf mutants of rice. Theor. Appl. Genet. 1994, 87, 705–712. [Google Scholar] [PubMed]
  43. Hedden, P.; Phillips, A.L. Gibberellin metabolism: New insights revealed by the genes. Trends. Plant Sci. 2000, 5, 523–530. [Google Scholar] [CrossRef]
  44. Gomi, K.; Matsuoka, M. Gibberellin signalling pathway. Curr. Opin. Plant Biol. 2003, 6, 489–493. [Google Scholar] [CrossRef]
  45. Schomburg, F.M.; Bizzell, C.M.; Lee, D.J.; Zeevaart, J.A.; Amasino, R.M. Overexpression of a novel class of gibberellin 2-oxidases decreases gibberellin levels and creates dwarf plants. Plant Cell 2003, 15, 151–163. [Google Scholar] [CrossRef]
  46. Lo, S.F.; Yang, S.Y.; Chen, K.T.; Hsing, Y.I.; Zeevaart, J.A.; Chen, L.J.; Yu, S.M. A novel class of gibberellin 2-oxidases control semidwarfism, tillering, and root development in rice. Plant Cell 2008, 20, 2603–2618. [Google Scholar] [CrossRef] [PubMed]
  47. Lee, D.J.; Zeevaart, J.A. Differential Regulation of RNA Levels of Gibberellin Dioxygenases by Photoperiod in Spinach. Plant Physiol. 2002, 130, 2085–2094. [Google Scholar] [CrossRef] [PubMed]
  48. Martin, D.N.; Proebsting, W.M.; Hedden, P. The SLENDER gene of pea encodes a gibberellin 2-oxidase. Plant Physiol. 1999, 121, 775–781. [Google Scholar] [CrossRef] [PubMed]
  49. Huang, J.; Tang, D.; Shen, Y.; Qin, B.; Hong, L.; You, A.; Li, M.; Wang, X.; Yu, H.; Gu, M.; et al. Activation of gibberellin 2-oxidase 6 decreases active gibberellin levels and creates a dominant semi-dwarf phenotype in rice (Oryza sativa L.). J. Genet. Genom. 2010, 37, 23–36. [Google Scholar] [CrossRef]
  50. Lee, D.J.; Zeevaart, J.A. Molecular Cloning of GA 2-Oxidase3 from Spinach and Its Ectopic Expression in Nicotiana sylvestris. Plant Physiol. 2005, 138, 243–254. [Google Scholar] [CrossRef]
  51. Sun, T.P. Gibberellin metabolism, perception and signaling pathways in Arabidopsis. Arabidopsis Book 2008, 6, e0103. [Google Scholar] [CrossRef]
  52. Pnueli, L.; Carmel-Goren, L.; Hareven, D.; Gutfinger, T.; Alvarez, J.; Ganal, M.; Zamir, D.; Lifschitz, E. The SELF-PRUNING gene of tomato regulates vegetative to reproductive switching of sympodial meristems and is the ortholog of CEN and TFL1. Development 1998, 125, 1979–1989. [Google Scholar]
  53. Sun, X.R.; Liu, L.; Zhi, X.N.; Bai, J.R.; Cui, Y.N.; Shu, J.S.; Li, J.M. Genetic analysis of tomato internode length via mixed major gene plus polygene inheritance model. Sci. Hortic. 2019, 246, 759–764. [Google Scholar] [CrossRef]
  54. Collins, T.J. ImageJ for microscopy. BioTechniques 2007, 43, 25–30. [Google Scholar] [CrossRef] [PubMed]
  55. García-Hurtado, N.; Carrera, E.; Ruiz-Rivero, O.; López-Gresa, M.P.; Hedden, P.; Gong, F.; García-Martínez, J.L. The characterization of transgenic tomato overexpressing gibberellin 20-oxidase reveals induction of parthenocarpic fruit growth, higher yield, and alteration of the gibberellin biosynthetic pathway. J. Exp. Bot. 2012, 63, 5803–5813. [Google Scholar] [CrossRef] [Green Version]
  56. Dong, C.F.; Gu, H.R.; Ding, C.L.; Xu, N.X.; Zhang, W.J. Effects of gibberellic acid on forage quality of rice (Oryza sativa) straw. Acta Pratacult. Sin. 2016, 25, 94–102. [Google Scholar]
  57. Saghaimaroof, M.A.; Soliman, K.M.; Jorgensen, R.A.; Allard, R.W. Ribosomal DNA spacer-length polymorphisms in barley: Mendelian inheritance, chromosomal location, and population dynamics. Proc. Natl. Acad. Sci. USA 1984, 81, 8014–8018. [Google Scholar] [CrossRef]
  58. Lalitha, S. Primer Premier 5. Biotech Softw. Internet Report. 2000, 1, 270–272. [Google Scholar] [CrossRef]
  59. Neff, M.M.; Turk, E.; Kalishman, M. Web-based primer design for single nucleotide polymorphism analysis. Trends Genet. 2002, 18, 613–615. [Google Scholar] [CrossRef]
  60. Michelmore, R.W.; Paran, I.; Kesseli, R.V. Identification of markers linked to disease-resistance genes by bulked segregant analysis: A rapid method to detect markers in specific genomic regions by using segregating populations. Proc. Natl. Acad. Sci. USA 1991, 88, 9828–9832. [Google Scholar] [CrossRef]
  61. Van Ooijen, J.W. JoinMap® 4.0. Software for the Calculation of Genetic Linkage Maps in Experimental Populations; Kyazma: Wageningen, The Netherlands, 2006. [Google Scholar]
  62. Van Ooijen, J.W. MapQTL® 6.0, Software for the Mapping of Quantitative trait Loci in Experimental Populations; Kyazma: Wageningen, The Netherlands, 2009. [Google Scholar]
  63. Li, J.; Sima, W.; Ouyang, B.; Wang, T.; Ziaf, K.; Luo, Z.; Liu, L.; Li, H.; Chen, M.; Huang, Y.; et al. Tomato SlDREB gene restricts leaf expansion and internode elongation by downregulating key genes for gibberellin biosynthesis. J. Exp. Bot. 2012, 63, 6407–6420. [Google Scholar] [CrossRef]
  64. Livak, K.J.; Schmittgen, T.D. Analysis of relative gene expression data using real-time quantitative PCR and the 2−ΔΔCT method. Methods 2001, 25, 402–408. [Google Scholar] [CrossRef] [PubMed]
  65. Altschul, S.; Madden, T.; Schäffer, A. Gapped BLAST and PSI-BLAST: A new generation of protein database search programs. Nucleic Acids Res. 1997, 25, 3389–3402. [Google Scholar] [CrossRef]
  66. Tamura, K.; Stecher, G.; Peterson, D.; Filipski, A.; Kumar, S. MEGA6: Molecular evolutionary genetics analysis version 6.0. Mol. Biol. Evol. 2013, 30, 2725–2729. [Google Scholar] [CrossRef]
  67. Sharma, M.K.; Solanke, A.U.; Jani, D.; Singh, Y.; Sharma, A.K. A simple and efficient Agrobacterium-mediated procedure for transformation of tomato. J. Biosci. 2009, 34, 423. [Google Scholar] [CrossRef] [PubMed]
Figure 1. The phenotypic characterization of the mutant P502 and wild-type 05T606 at 40-day-old seedlings. Morphological phenotypes (a) and the statistical data of internode lengths (b) of the mutant P502 and wild-type 05T606. (c) Morphological phenotypes of the first five internode lengths of the mutant P502 (left) and wild-type (right). (d) Statistical data of internode length in (c). Longitudinal sections (e) and the statistical data (f) of the third internode pith cell length of P502 and wild-type. Scale bar is 5 cm in (a), 1 cm in (c), 100 μm in (e). A Student’s t test indicated a significant difference ((b,d), n = 30 plants; (f) n = 90 cells) in (d,f). ** p < 0.01. All data are given as mean ± SD.
Ijms 20 02204 g001
Figure 2. The line P502 is a GA-sensitive mutant. (a,b) The morphological phenotypes of 30-day-old wild-type and P502 seedlings after treatment with GA3 (10−5 M) and PAC (10−7 M, GA biosynthesis inhibitor), respectively. (c,d) The statistical data of wild-type and P502 plant height in different stages, respectively. (e) Concentration of endogenous bioactive GAs in the first five internodes of 30-day-old mutant P502 and wild-type seedlings. The water treatment was used as control and the scale bar is 5 cm in (a,b). Data for (c,d) are based on three replicates of eight plants per group. N.D. represents not detectable. Data for (e) are based on three independent biological replicates, and the asterisk indicates a statistically significant difference (Student’s t-test, ** p < 0.01). All data are given as mean ± SD.
Ijms 20 02204 g002
Figure 3. Internode length frequency distribution of F2 individuals at 40-day-old seedlings. (a) 2016 (n = 140). (b) 2017 (n = 400). (c) 2018 (n = 354). The mean internode lengths were recorded from the first internode to the fifth internode (starting from the cotyledons).
Ijms 20 02204 g003
Figure 4. Map-based cloning of ei locus. (a) The genetic map of ei on chromosome 2, mapped using 354 F2 individuals and six polymorphic markers. (b) The ei locus was fine-mapped to the interval between markers CAPS17 and InDel6. (c) Predicted genes in the region encompassing the ei locus. The arrows indicate the direction of transcription. (d) Gene structure and the mutation site. The black rectangles and black line indicate exons and introns, respectively. The red letter represents the mutation base in mutant P502.
Ijms 20 02204 g004
Figure 5. Phylogenetic analysis and sequence alignment of SlGA2ox7 with various species. (a) Phylogenetic analysis of SlGA2ox7. The phylogenetic tree was generated using the neighbor-joining method built in MEGA6.0, and the inferred phylogeny was tested by bootstrap analysis with 1000 replicate datasets. Numbers shown at the tree forks indicate the frequency of occurrence among all bootstrap iterations performed. (b) Alignment of the SlGA2ox7 sequences. The proteins were aligned with the ClustalW program. The bold black line and the thin black line indicate the PcbC domain (81–343) and 2OG-FeII_Oxy domain (237–332), respectively. The red arrow represents the amino acid at position 112 of SlGA2ox7.
Ijms 20 02204 g005
Figure 6. Overexpression of wild-type EI gene reduced the internode length of mutant P502. (a) Phenotype of P502 (CK) and T1 transgenic plants (OE-1 and OE-2) at 40-day-old seedlings. (b) Expression level of EI in T1 lines (OE-1 and OE-2). Total RNA was isolated from internode of P502 and transgenic T1 plants at 40-day-old seedlings. Data represent mean ± SD based on three independent biological and three technical experiments. Scale bar is 5 cm in (a). Statistical significances were calculated based on two-tailed, two-sample Student’s t-test at * p < 0.05 and ** p < 0.01.
Ijms 20 02204 g006
Figure 7. Expression analysis in the qRT-PCR assay. (a) Expression patterns of EI in the roots, stem, and leaves of P502 and the wild-type. Total RNA was isolated from P502 and wild-type at 40-day-old seedlings. A Student’s t test was used for statistical analysis. (b) Expression levels of the GA biosynthetic genes after 10−7 M paclobutrazol (PAC, GA biosynthesis inhibitor) treatment. Data represent mean ± SD based on three independent biological and three technical experiments.
Ijms 20 02204 g007
Table 1. Internode lengths of P1, P2, and F1 population plants.
Materials2016 (cm) a2017 (cm) a2018 (cm) a
P1 (Heinz 1706)1.52 ± 0.35 a1.48 ± 0.63 a1.85 ± 0.30 a
P2 (P502)4.62 ± 0.19 c4.66 ± 0.60 c5.54 ± 0.48 c
F1 (Heinz 1706 × P502)2.74 ± 0.28 b2.53 ± 0.47 b3.10 ± 0.24 b
a Values followed by different letters (a, b, and c) are significantly different (p < 0.01). n = 15 plants.
Table 2. Genotypes of F2 recombinants and phenotypes of F2:3 individuals.
RecombinantsGenotype (F2) aPhenotype(F3)
D64CAPS4D66CAPS16CAPS17CAPS27InDel6HP2501HP707HP2509N bE b
6–11bhhhhhhhhh--
13–5bbbhhhhhhh4415
7–48bbbbhhhhhh4515
7–71bbbbhhhhhh4314
15–543bbbbbhhhhh4514
17–18bbbbbhhhhh4515
15–741hhhhhhbbbb4614
1–2hhhhhhbbbb4515
1–72hhhhhhhbbb4416
6–21hhhhhhhhhb--
a b in green backgroud: homozygous like P502; h in gray background: heterozygous; b N: the number of normal internode plants; E: the number of elongated internode plants; -: no data.
Table 3. Ten predicted genes in the 75.8-kb fine mapping interval according to the reference genome.
Gene ID aPositionFunctional Annotation
solyc02g080110.2SL2.50ch02: 44414686..44417879 (+)Unknown Protein (AHRD V1)
solyc02g080120.1SL2.50ch02: 44432042..44436667 (+)Gibberellin 2-beta-dioxygenase 7
solyc02g080130.2SL2.50ch02: 44439349..44443883 (+)Chaperone dnaj-like protein
solyc02g080140.2SL2.50ch02: 44444670..44447584 (-)cysteine-rich PDZ-binding protein
solyc02g080150.1SL2.50ch02: 44458406..44458810 (+)uncharacterized LOC101262168
solyc02g080160.2SL2.50ch02: 44460578..44462486 (-)probable xyloglucan endotransglucosylase/hydrolase protein 8
solyc02g080170.1SL2.50ch02: 44471643..44473397 (+)pentatricopeptide repeat-containing protein At4g21170
solyc02g080180.1SL2.50ch02: 44474353..44475381 (+)Probable dolichyl-diphosphooligosaccharide—protein glycosyltransferase subunit 3B
solyc02g080190.2SL2.50ch02: 44477570..44478612 (+)Nuclear transport factor 2
solyc02g080200.2SL2.50ch02: 44478656..44480593 (-)pectinesterase-like
a Genes were identified based on the tomato model (ITAG release 2.40, SL2.50) in SGN (https://solgenomics.net/) (Access on 21 June 2014).
Table 4. Markers used for mapping of EI gene.
Primer NameForward Primer (5′-3′)Reverse primer (5′-3′)TypeEnzyme
D55AATGACTTACCTACTGGAAAGCGATTGATCACCCTTTGGATAInDel
D57GAGACATCACTTTGCCTTTCAAAAGTCTCTCCGCCTATGTInDel
D64TTGTTACCGCTTACTTTGGTCACAGCTGTTGATTTCTTCAInDel
CAPS4GCATTGCAACCTATTCTCACTCTGTAGTTTCCGTCTTCTTCAPSHaeIII
D66CGTTGTCTAGGTCAATAGCCAGGTGTTACACTTTCTACGTCTInDel
CAPS16AGAGAAGGAGGATTCGGGTTATAGGGGCATTATCAAAAGGCAPSBsrDI
CAPS17TAAGTTAGCCATATAAAACAAATGACACAGCGAGACACAPSMboII
CAPS27GAGAAAATTATTTGGGATACATTAAAACTTTGATGCCTACCAPSMfeI
InDel6ACAATCCCAGTTTATGTGATATATTTGGTGTTTTCTGTTTInDel
HP2501CTTTTCACAAAACTAACACAGGTGACAATATAAGCATTTGTCGCInDel
HP707TCCGATGTAACATCACGCAAGTTGATCACCTTCAGACAGCInDel
D67AGCTTTTATAGCACGTACCGCCATACTCTACTTATGCTGCAAInDel
HP2509ACCTCGACACTGGTTCACTCGTGACTCATATACACCCTTACCTAInDel
HP445GAGAACATCTGTACCAGCCTCAAGTATCTATATGCCTGACAACInDel

