Transcriptomic Profiling for the Autophagy Pathway in Colorectal Cancer


1
Department of Genetics, Wroclaw Medical University, Marcinkowskiego 1, 50-368 Wroclaw, Poland
2
Laboratory of Genomics & Bioinformatics, Institute of Immunology and Experimental Therapy, Polish Academy of Sciences, 53-114 Wroclaw, Poland
*
Author to whom correspondence should be addressed.
Int. J. Mol. Sci. 2020, 21(19), 7101; https://doi.org/10.3390/ijms21197101
Submission received: 21 August 2020
/
Revised: 22 September 2020
/
Accepted: 24 September 2020
/
Published: 26 September 2020
(This article belongs to the Special Issue Apoptosis and Autophagy: The Double Edge in Cancer Development and Progression and in Other Human Diseases 2.0)
Abstract
:The role of autophagy in colorectal cancer (CRC) pathogenesis appears to be crucial. Autophagy acts both as a tumor suppressor, by removing redundant cellular material, and a tumor-promoting factor, by providing access to components necessary for growth, metabolism, and proliferation. To date, little is known about the expression of genes that play a basal role in the autophagy in CRC. In this study, we aimed to compare the expression levels of 46 genes involved in the autophagy pathway between tumor-adjacent and tumor tissue, employing large RNA sequencing (RNA-seq) and microarray datasets. Additionally, we verified our results using data on 38 CRC cell lines. Gene set enrichment analysis revealed a significant deregulation of autophagy-related gene sets in CRC. The unsupervised clustering of tumors using the mRNA levels of autophagy-related genes revealed the existence of two major clusters: microsatellite instability (MSI)-enriched and -depleted. In cluster 1 (MSI-depleted), ATG9B and LAMP1 genes were the most prominently expressed, whereas cluster 2 (MSI-enriched) was characterized by DRAM1 upregulation. CRC cell lines were also clustered according to MSI-enriched/-depleted subgroups. The moderate deregulation of autophagy-related genes in cancer tissue, as compared to adjacent tissue, suggests a prominent field cancerization or early disruption of autophagy. Genes differentiating these clusters are promising candidates for CRC targeting therapy worthy of further investigation.
1. Introduction
Colorectal cancer (CRC) is among the most frequent cancers (3rd) and is one of the major causes of cancer-related deaths (4th) worldwide [1,2]. In analyses of the time period from 2000 to 2010, it has been shown that age-standardized cancer mortality rates (ASMRs) decreased in most countries, especially in the USA [3,4]. However, in many countries, despite great progress in both cancer screening (e.g., capsule endoscopy and/or fecal occult blood testing) and early cancer diagnosis, racial and socioeconomic disparity remains, leading to late cancer diagnosis and hence to a low level of 5-year survival [1]. Interestingly, the past two decades have shown that CRC incidence among younger populations (less than 50 years of age) has increased, especially in well-developed, highly industrialized countries [5,6]. The majority of CRC cases (more than 70%) are sporadic; therefore, the combination of an individual’s genetic makeup, exposure to environmental factors, and personal habits modulate the risk of colorectal cancer development [7].
The classification of cancer subtypes based on gene expression is widely accepted as an important component of disease taxonomy [8,9,10,11]. Integrated genome-wide studies have revealed that the single-tissue cancer type may be divided into several molecular subtypes. Definitions of cancer subtypes are undoubtedly required for the implementation of individual effective therapy [8,9,10,11]. Recently, an international consortium consisting of expert groups divided CRCs into four consensus molecular subtypes (CMS1–CMS4), each of which presents with distinct biological features and specific gene expression patterns. This taxonomy implements self-contained prognostic information that transcends tumor stages and tissue of origin. Further studies may provide new pathway-based insights with directions for treatment optimization [8,12].
In this aspect, macroautophagy (henceforth referred to as autophagy) appears to be a promising process for seeking new biomarkers and thus may serve to enhance our knowledge of potential therapeutic molecular targets in CRC treatment. Autophagy is a highly evolutionary conserved housekeeping process that relies on the degradation of cellular components (e.g., organelles, protein aggregates) in autophagosomes. Altered activity in this pathway (compared to normal conditions) is associated with numerous human diseases, including cancer [13,14]. Autophagy has a multifaceted nature, and its role in cancerogenesis from the initiation of tumor formation to metastasis may have opposite consequences in a context-dependent manner [15,16]. On the one hand, enhanced autophagy allows the elimination of cells susceptible to becoming malignant (by the elimination of potentially tumor prone factors) because of its “repair” function and thus inhibits cancer development and acts as a tumor suppressor. This view is supported by the observation of monoallelic deletion of the BECN1 gene that has been found to be common in various human cancers such as breast, prostate, or ovarian [17,18]. Consequently, insufficient autophagy may contribute to the accumulation of genomic defects, leading to cancer development [14]. On the other hand, in developed tumor cells that are often exposed to unfavorable conditions such as hypoxia, starvation, or stress induced by treatment (chemo-/radiotherapy), enhanced autophagy may help these cells to survive (as supplier of recycled molecules crucial for survival); hence, it acts as a tumor promoter [19]. Therefore, elucidating the autophagy process in cancer development remains a great challenge also in the context of anticancer treatment. In the therapy aspect, there are two suggested approaches: in the first one, autophagy is targeted by well-known inhibitors such as hydroxychloroquine (to stop a supportive influence of autophagy by promoting apoptosis); in the second one, autophagy is induced (to enhance the antitumor therapy by the induction of autophagy-dependent cell death, a cytotoxic role) by, for instance everolimus or perifosine [20,21,22]. Hitherto, many clinical trials have been carried out with promising results. The above-mentioned agents were usually well tolerated along with standard treatment, but further studies are needed to clarify the role of autophagy and its modulation in cancer treatment.
As a result of the complex and unclear role of autophagy in CRC, we performed an analysis of transcriptomic data of chosen autophagy genes. Our goal was to define the contribution of autophagy (in terms of gene expression) in colorectal cancer samples in comparison to adjacent tissue and to investigate a potential specific pattern to identify a new molecular CRC subtype that might be helpful in the molecular classification and/or in the development of future treatment approaches.
2. Results
2.1. Ensemble of Gene Set Enrichment Analysis (EGSEA)
To evaluate the involvement of autophagy in the process of CRC carcinogenesis, we preformed gene set enrichment analysis in a CRC RNA sequencing (RNA-seq) dataset by comparing 2055 gene sets in cancerous vs. normal tissue using the Ensemble of Gene Set Enrichment Analysis (EGSEA) approach. Results are provided in Supplementary Table S1. Five out of six autophagy-related gene sets were significantly deregulated (up or downregulated) in colorectal cancer when compared to normal tumor-adjacent tissues. However, autophagy-related gene sets were relatively low ranked when compared to other gene sets. For example, “Late endosomal microautophagy” reached the highest ranking among autophagy gene sets and was ranked 1305/2055. The other significantly deregulated autophagy-related gene sets were ranked as follows 1413, 1493, 1815, and 1854 (see Supplementary Table S1).
2.2. Unsupervised Clustering of Colorectal Tumor Samples and Cell Lines
Next, we posed a question of whether there are subgroups of CRC differing in terms of the expression of selected autophagy genes (genes are listed in Supplementary Table S2). In all three studied datasets (CRC RNA-seq, CRC array, and CRC cell lines), samples were separated into two clusters (optimal k = 2) based on the expression of autophagy genes (defined as clusters 1 and 2). Table 1 and Table 2 provide characteristics of resultant CRC clusters. In the RNA-seq tumor dataset, 46% of samples belonged to cluster 1 and 54% belonged to cluster 2. In the Affymetrix tumor dataset, 41% of samples belonged to cluster 1 and 59% belonged to cluster 2. In the CRC cell line dataset, 31% of samples belonged to cluster 1, and 69% belonged to cluster 2 (data not shown). In general, we found cluster 1 to be depleted in (MSI) samples, whereas, in comparison, cluster 2 was significantly enriched in MSI samples.
2.3. Molecular Characteristics of Autophagy Clusters (RNA-seq Data)
Table 1 provides detailed molecular characteristics of resultant CRC clusters in RNA-seq data. Cluster 1 was associated with a higher aneuploidy score, homologous recombination defects, and a higher frequency of APC and TP53 mutations (all p-values < 0.001), whereas cluster 2 was associated with a higher frequency of microsatellite instability, proximal tumor location, BRAF mutations, single nucleotide variant neoantigens, indel neoantigens, and non-synonymous mutations (all p-values < 0.001). We observed differences in the distribution of CMS subtypes and stages across two autophagy clusters. Higher frequencies of CMS1 (25 vs. 9%) and CMS3 (24 vs. 10%) were noted in cluster 2, whereas cluster 1 was significantly enriched in CMS2 (52 vs. 14%). A slightly greater number of stage 1 tumors were noted in cluster 2 than in cluster 1 (12 vs. 21%, respectively). Stage 4 tumors were observed more frequently in cluster 1 than in cluster 2 (20 vs. 12%, respectively). No significant differences between clusters were detected for overall survival (p-value = 0.55, data not shown), age, gender, or mutation frequency of KRAS, NRAS, and PIK3CA.
2.4. Molecular Characteristics of Autophagy Clusters (Affymetrix Data)
Table 2 provides the molecular characteristics of resultant CRC clusters in array data. Cluster 2 was associated with a higher frequency of microsatellite instability and a higher age of morbidity. We observed differences in the distribution of CMS subtypes and stages across two autophagy clusters. Higher frequencies of CMS1 (25 vs. 7%) and CMS4 (40 vs. 25%) were noted in cluster 2, whereas cluster 1 was significantly enriched in CMS2 (50 vs. 16%). No significant differences were noted between autophagy clusters in terms of overall survival (p-value = 0.35, data not shown) or stage and gender distribution.
2.5. Selection of the Autophagy Genes that Best Define Autophagy Clusters
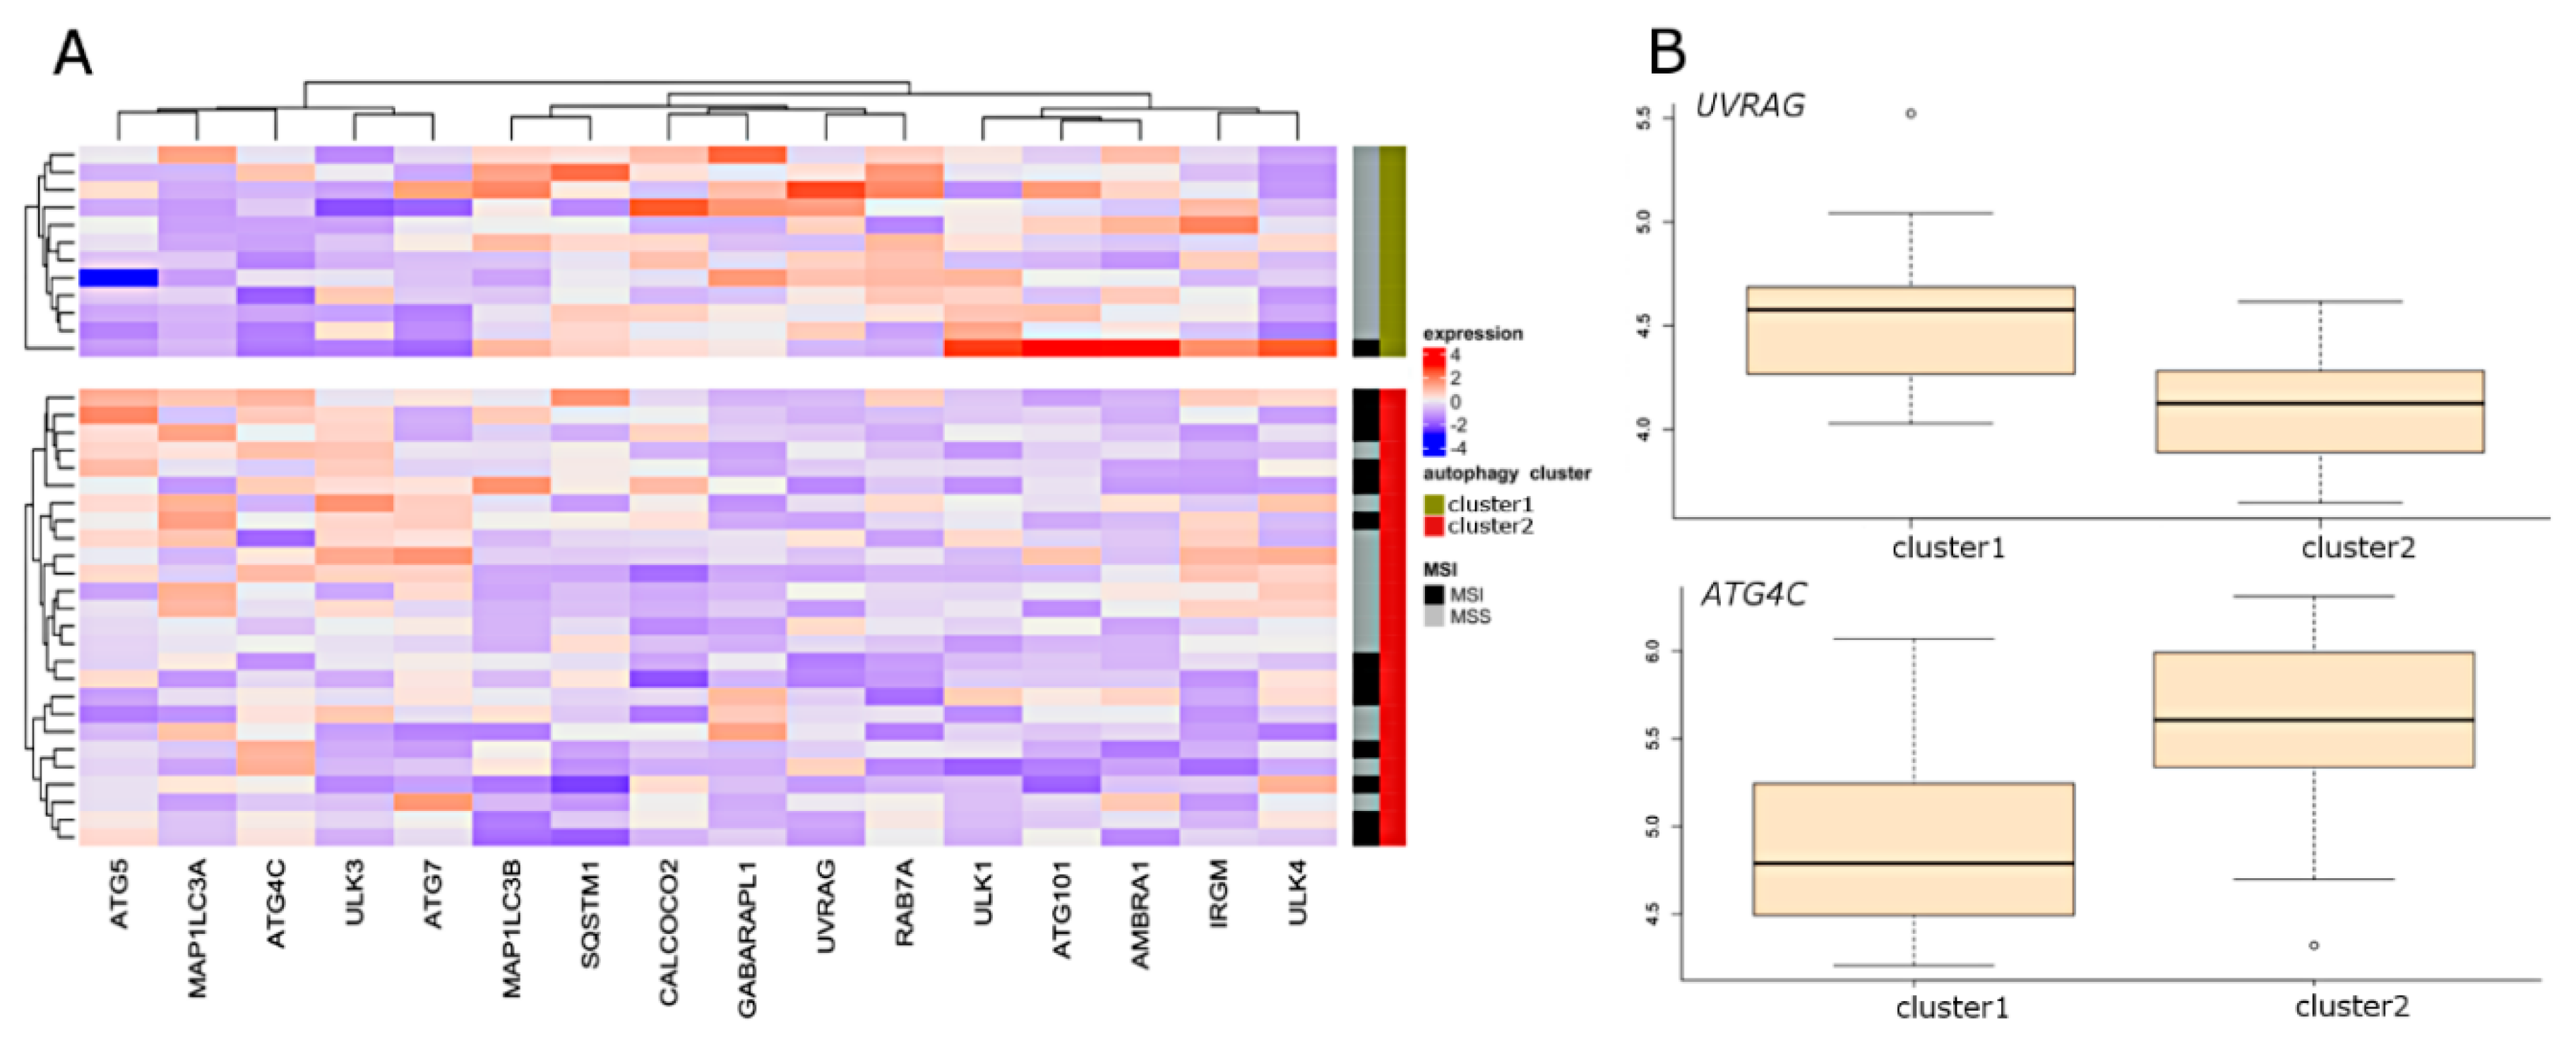
With the use of sparse partial last squares discriminant analysis PLS (sPLS-DA), we attempted to define which of the autophagy genes best differentiate CRC samples between two autophagy clusters. Results from three datasets are presented in Figure 1 and Figure 2. Sixteen genes were selected in the array dataset (Figure 1A), and nine genes were selected based on RNA-seq analysis (Figure 1B). Four genes (ATG16L2, ATG9B, DRAM1, and LAMP1) were found to be common to both datasets. The most highly ranked genes in terms of separation of clusters were ATG9B, and DRAM1 (Figure 1C,D). ATG9B and LAMP1 were characterized by the highest expression level in cluster 1, while DRAM1 was characterized by the highest expression level in cluster 2. In the CRC cell lines dataset, 16 genes were selected by sPLS-DA (Figure 2A). The most highly ranked genes in terms of separation of clusters were UVRAG and ATG4C (Figure 2B).
2.6. Differential Expression (DE) of Autophagy Genes
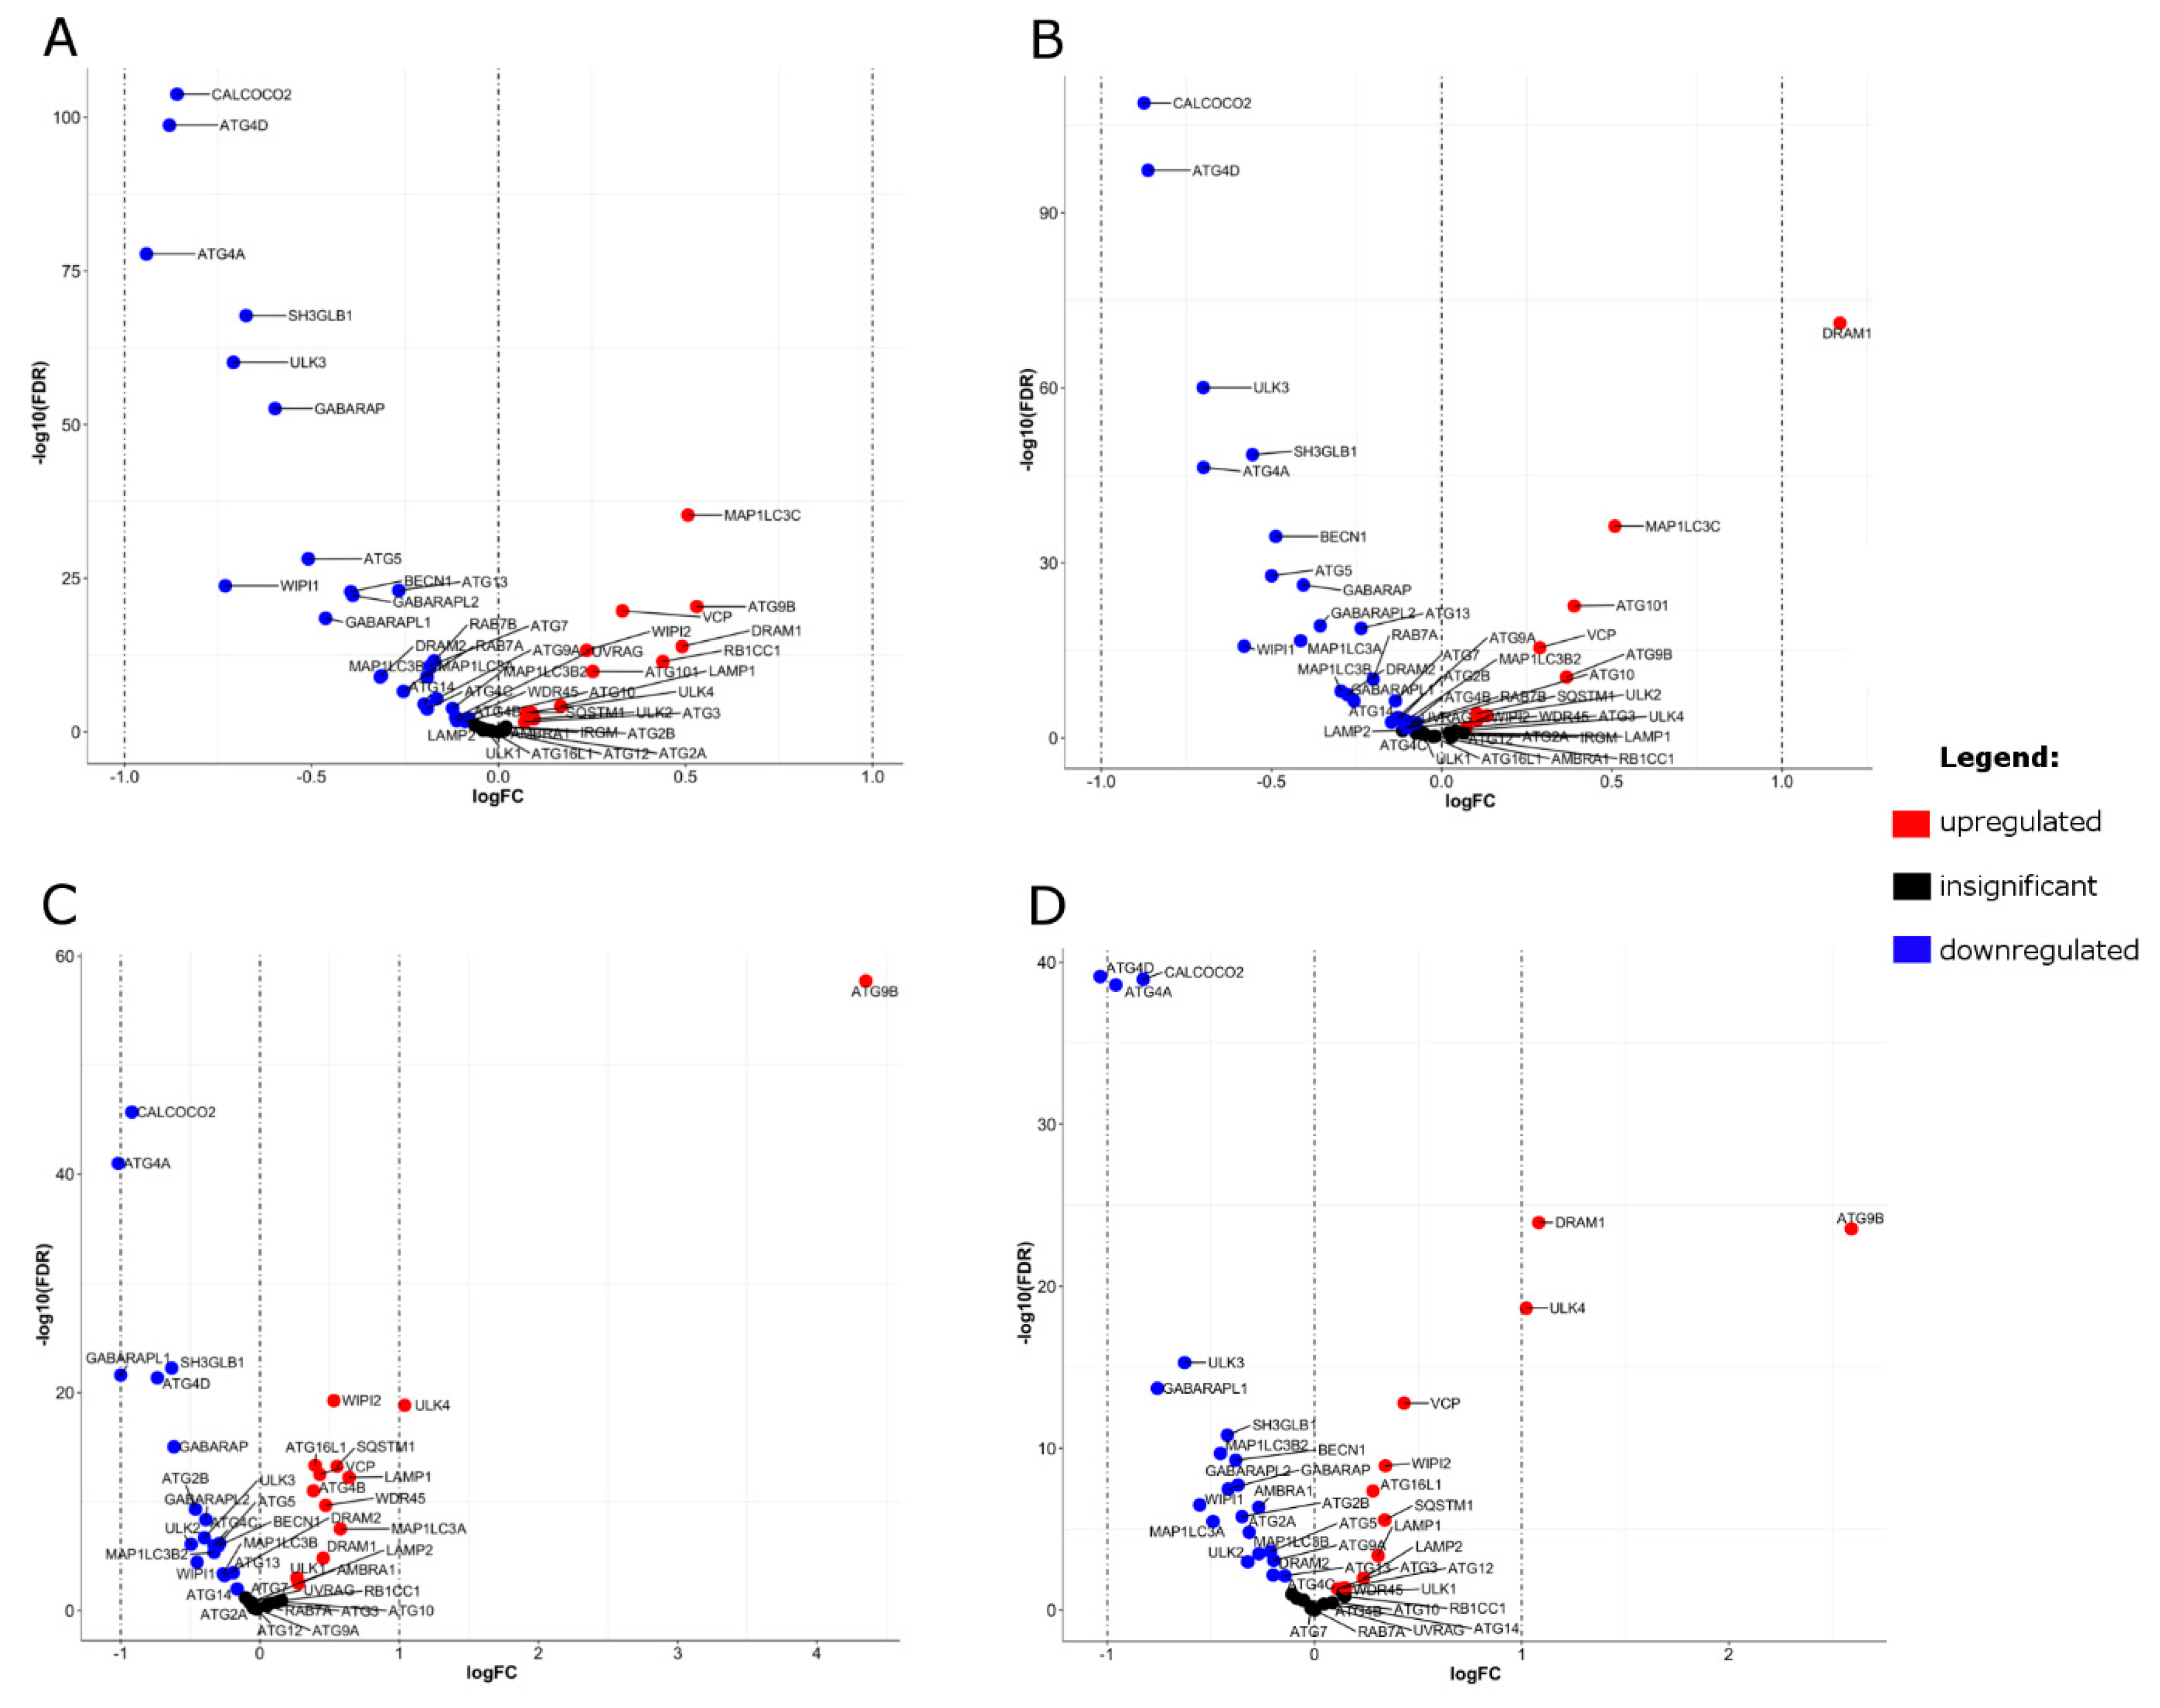
To illustrate differences in the expression of autophagy genes in resultant autophagy clusters, we performed differential expression analysis by comparing the transcriptome of each cluster with normal-adjacent tissues. This has been done in CRC RNA-seq and CRC array datasets. The results of DE analysis are presented in Figure 3, and lists of genes with important parameters are provided in Supplementary Table S3. In general, the detected effects in two CRC clusters were relatively small, not exceeding absolute log fold change (logFC) = 1, with the exception of ATG4A, ATG4D, ATG9B, DRAM1, GABARAPL1, and ULK4. For these genes, absolute logFC values were above 1; however, it was not consistent across datasets and/or clusters except for DRAM1, for which logFC > 1 was noted in cluster 2 in both datasets. Clusters 1 and 2 were similar in terms of the direction of gene expression. Fifteen genes in both clusters and both datasets were downregulated: ATG4D, ATG4A, CALCOCO2, GABARAPL1, ULK3, WIPI1, MAP1LC3B2, SH3GLB1, GABARAP, BECN1, GABARAPL2, MAP1LC3B, ATG5, DRAM2, and ATG13. Six genes exhibited upregulation in both clusters and both datasets: LAMP1, SQSTM1, WIPI2, VCP, DRAM1, and ATG9B. As for cluster-specific deregulation, ATG4C displayed cluster-1-specific downregulation, whereas no gene was specifically downregulated in cluster 2. Furthermore, none of the genes showed cluster-specific upregulation.
3. Discussion
Currently, the molecular characteristics of highly heterogeneous CRC constitute a medical standard for the prognosis, prediction, and selection of the most effective treatment approach [23]. As the survival ratio of CRC patients remains unsatisfactory (especially in groups of patients at advanced stages), new biomarkers may enable the implementation of novel anticancer strategies that target pathways other than the classic apoptosis–death. Recently, autophagy has been extensively studied in different types of cancer in order to obtain a better understanding of its involvement in both the molecular process of carcinogenesis and treatment resistance. It is postulated that the modulation (induction and inhibition) of autophagy may be essential for the improvement of anticancer adjuvant therapy [24,25].
EGSEA analysis preformed in this study revealed the significant deregulation of autophagy-related pathways in CRC. In general, autophagy gene sets were lowly ranked in EGSEA analysis, which was possibly due to the moderate gene expression changes that we observed in DE analysis. This explains why autophagy has been often overlooked in gene set enrichment results provided for CRC or CRC clusters [8]. However, moderate gene expression changes may still represent a biologically meaningful factor [26]. Our study, based on the expression pattern of autophagy-related genes in colon tumors vs. tumor-adjacent normal tissue, using two large RNA-seq and microarray datasets, revealed the existence of two separate clusters. In terms of clinical and molecular characteristics, the two clusters differ significantly, suggesting the existence of two groups of CRCs: cluster 1, presenting with prominent chromosomal instability, distal tumor localization, and high TP53 and APC mutation rates, and cluster 2, with a high mutation rate, proximal tumor localization, and microsatellite instability. This result has been confirmed in the CRC cell lines dataset with respect to MSI status.
Interestingly, in the aspect of widely accepted CMS clustering, our study showed that cluster 1 covers the majority of CMS2 and CMS4, while cluster 2 covers the majority of CMS1 and CMS3. These results are in agreement with the biological nature of CMSs and may be used as an additional biomarker for CRC subtyping and selecting therapeutic approaches. As revealed by differential expression analysis, the two clusters were similar in terms of the direction of expression changes of significantly deregulated genes. Importantly, most expression changes were of little magnitude. This result may indicate that changes in the expression of autophagy genes in adjacent normal tissue are relatively numerous, suggesting a prominent field defect or the early disruption of autophagy in CRC. Similarly, a recent study by Aran et al. has demonstrated major gene expression changes in tissues adjacent to tumors [27]. Therefore, we suggest that future studies on changes in gene expression in autophagy-related genes should employ normal colon tissue dissected from individuals free of cancer.
The machine learning approach (sPLS-DA) indicated that the two clusters in tumor samples differ with respect to the expression levels of several autophagy-associated genes: cluster 1, with the prominent expression of ATG9B along with LAMP1, and cluster 2, with high levels of DRAM1. Intriguingly, the genes differentiating these two clusters are closely associated with lysosomal degradation.
LAMP1 (lysosomal associated membrane protein 1) is a highly glycosylated protein associated with the regulation of lysosome mobility and its fusion with the autophagosome membrane [28]. LAMP1 is expressed on (apart from the lysosomal membrane) the cell surface of many different human cells [29]. The overexpression of LAMP1 has been linked to high-grade breast tumors capable of metastasis; hence, its high expression appears to be associated with malignant attributes [30]. Recent studies have shown LAMP1 overexpression of both mRNA and protein levels in high-grade glioblastoma multiforme (GBM) [31]. Moreover, high expression levels of LAMP1 in the plasma membrane were observed, inter alia, in colorectal neoplasm tissues, advanced prostate cancer (PCa), and castration-resistant prostate cancer (CRPC) [29,32]. Recently, Takeda et al. demonstrated that the number of autophagy genes including LAMP1 is effectively downregulated by mefloquine hydrochloride (an antimalarial drug) in colorectal cell lines and PDX models, and it has a strong negative effect on cancer cells [33].
Another highly expressed gene in cluster 1 was ATG9B, encoding the multi-spanning transmembrane protein that plays a key role in the biogenesis of autophagosome membranes [34]. Kang et al. have shown a high rate of ATG9B mutations in human high-MSI gastric and colorectal cancers. It has been postulated that the deregulation of ATG9B may contribute to promotion of the development of stomach and colorectal cancers [34].
In the second cluster, DRAM1 (DNA damage regulated autophagy modulator 1) is the most expressed gene. DRAM1 is a lysosomal membrane protein that participates in the process of autophagosome–lysosome fusion [35], and thus, its expression promotes autophagosome formation. It has been shown that in response to adverse genotoxic stimuli, TP53, a major tumor-suppressing gene responsible for apoptotic cell death, induces autophagy via the transcriptional activation of DRAM1 [36]. Crighton et al. have demonstrated that DRAM1 is part of the network of cell death pathways dependent on TP53, which simultaneously activates DRAM1 and other unknown proapoptotic gene/genes, which in turn contribute together to the cell-death response. It is also possible that the autophagic and apoptotic potential of DRAM1 is separable and acts in parallel [36].
Since DRAM1 is a target gene for TP53, it is critical in TP53-induced apoptosis. DRAM1 influences apoptosis via lysosomes thorough the proapoptotic BAX gene. DRAM1 improves the translocation of BAX to lysosomes to initiate lysosome-dependent apoptotic death [37]. Therefore, it is suggested that DRAM1 may connect the autophagy and apoptosis pathways. The induction of autophagy by TP53 via DRAM1 contributes to apoptotic cell death, which appears to be crucial for the development of novel standards of anticancer treatment.
Recently, many research groups have been searching for new candidate genes related to autophagy (as a prognostic and/or prediction biomarkers) in CRC using available datasets [38,39]. We emphasize that our study differs especially with respect to the level of gene selection. In databases, in the section of autophagy-related genes, different genes that participate in autophagy solely are included along with genes from other important pathways that overlap with the autophagy pathway under certain conditions. We claim that naming VEGFA, NRG1, or CDKN2A as autophagy-related genes is at least misleading, because their major role does not involve the autophagy pathway [38]. Hence, to avoid ambiguous results, the genes chosen for this study include those that are highly engaged in the autophagy pathway.
In the current study, we were unable to demonstrate the intersection between tumor and cell lines in relation to deregulated autophagy genes. This may reflect differences between tumor samples and cell lines. In the latter, an intact immune system and stroma are lacking, and specific lineage subtypes are overrepresented. Indeed, Koustas et al. and Folkerts et al. recently discussed the close interplay between autophagy, tumor environment, and immune response [40,41], thus demonstrating the limitations of cell lines as a model of autophagy in CRC. Nevertheless, our study clearly showed that the expression of autophagy-related genes in CRC displays two distinctive patterns for two different subgroups, i.e., MSI-enriched and MSI-depleted. Given that MSI-enriched CRCs display strong infiltration of the tumor microenvironment with immune cells, the differences observed in this study may be linked to autophagic processes in the tumor microenvironment rather than to the epithelial fraction of the tumors. This may be supported by the notion that autophagy is a key factor in various immune responses against tumors, including antigen presentation and T-cell activation [42].
4. Study Limitations
There are potential limitations to this study that should be considered. A relatively small control group is available in databases (normal tissues or adjacent normal tissues). The most convenient setting for statistical analysis is when the sample size is comparable in terms of gender and age. Hence, more population/epidemiological data on RNA profiles (transcriptome) are required. To our best knowledge, there is a lack of access to proteomic data concerning autophagy in colorectal cancer. This situation impeded a comprehensive analysis of protein levels that undoubtedly would raise the power of this analysis. Further studies on protein levels are needed as well as accessible protein databases.
The goal of the current study was not to determine if autophagy plays a suppressing or promoting function in CRC because of its context-dependent manner. This study is descriptive, and unfortunately, we are a long way from this definition being made.
5. Materials and Methods
5.1. Data Acquisition
RNA-seq data (raw counts) for colon and rectal adenocarcinoma (CRC, 620 samples) were obtained along with tumor-adjacent tissue (53 samples) from compiled RNA-Sequencing TCGA data published by Rahman et al. under accession number GSE62944 in Gene Expression Omnibus (GEO) [43].
Raw CEL (.cel) files (Affymetrix U133 Plus 2.0 microarray expression)(Affymetrix, Santa Clara, CA, USA) were collected from 15 studies that included 1597 tumor and 125 normal colon samples (Gene Expression Omnibus accession numbers: GSE69657, GSE8671, GSE9254, GSE13067, GSE13294, GSE14333, GSE17536, GSE17537, GSE18105, GSE19860, GSE28702, GSE33113, GSE35896, GSE37364, and GSE39582 [44,45,46,47,48,49,50,51,52,53,54,55,56]).
Non-synonymous mutation data (TCGA dataset only) were obtained from Genomic Data Commons. Clinical and molecular data, including overall survival and microsatellite instability status, were obtained from accompanying phenotype files specific to each study. Other variables, including single nucleotide variants and non-silent mutation and aneuploidy scores, were obtained from Thorsson et al. [57].
Raw CRC files (.crc) of cell lines (Affymetrix U133 Plus 2.0 microarray expression) were downloaded from Array Express (E-MTAB-3610) [58].
5.2. Consensus Molecular Subtyping
In order to assess consensus molecular subtypes (CMS) for CRC samples, we used the nearest template prediction (NTP) algorithm implemented in the CMScaller package with default settings using normalized data [59]. Samples with false discovery rate adjusted p-values > 0.05 were designated “not assigned” (NA) and removed from subsequent analysis.
5.3. Data Pre-Processing
RNAseq data for CRC and tumor-adjacent tissues data were obtained from GSE62944 [43]. Subsequently, lowly expressed genes were removed by means of filtering. Next, data were normalized using variance-stabilizing transformation and smooth quantile normalization. Outlier samples were detected and removed automatically employing PCDIST algorithm [60].
Affymetrix raw data were normalized by Robust Multi-array Average (RMA) using the “affy” package, mapped to the NCBI Entrez Gene identifiers using a custom chip definition file (Brainarray, Version 20) [61,62]. Outlier samples were detected and removed automatically using PCDIST algorithm [60]. For both datasets, we used the ComBat algorithm implemented in the “swamp” package to correct the data for batch effects [63].
5.4. Selection of Genes of Interest
We carried out extensive searches of the literature and databases (for example, Human Autophagy Database: http://autophagy.lu/clustering/index.html) in order to select important genes involved in the autophagy pathway. We attempted at selecting genes with roles non-overlapping with other pathways. Our final list comprises 46 genes involved in autophagy (Supplementary Table S2).
5.5. Ensemble of Gene Set Enrichment Analysis
The RNA-seq dataset was used to analyze gene set enrichment. In brief, we applied the Ensemble of Gene Set Enrichment Analyses (EGSEA) method for gene set testing in the RNA-seq dataset by comparing tumor versus tumor-adjacent tissue [64]. We utilized the analysis of four prominent GSE algorithms: camera, fry, ora, and z-score to calculate the collective significance scores for each gene set (we used 2055 Human Reactome definitions from January 2020) [65]. Gene sets were ordered by median ranking (median across the ranks assigned by four selected methods).
5.6. Unsupervised Clustering of Autophagy Genes
We used the (COMMUNAL—Combined Mapping of Multiple clUsteriNg ALgorithms) approach to provide robust clusters based on the expression of selected autophagy genes [66]. The optimal number of clusters was deduced based on integrative analysis of three clustering algorithms and nine cluster validity metrics across increasing autophagy gene subsets: 12, 24, and 36.
5.7. Selection of the Autophagy Genes that Best Define Autophagy Clusters
We applied sparse partial least squares discriminant analysis (sPLS-DA) to obtain the most relevant autophagy genes differentiating between autophagy clusters. Each dataset (RNAseq and Affymetrix) was analyzed separately with the use of a sPLS-DA classifier that had been trained and evaluated using 10-fold cross-validation repeated 100 times. The genes selected most frequently by the sPLS-DA classifier (frequency ≥ 0.9) were selected for the drawing of heat maps in the Complex Heatmap package.
5.8. Differential Expression (DE) Analysis
For array-based data, differential expression between study groups was assessed by applying a moderated t-test implemented in the “limma” package. For the RNAseq data, differential expression between study groups was assessed by applying the voom method.
p-values were adjusted using overall comparisons employing the Benjamini–Hochberg (BH) method. Gene expression with a p-value ≤ 0.05 after the BH correction was considered significantly deregulated. All available genes were included in this analysis.
5.9. Comparison of Expression of Selected Autophagy-Related Genes in CRC Cell Lines
Differences in gene expression between cell line clusters were assessed by applying a t-test (for normal distribution) or non-parametric Kruskal–Wallis test (for non-normal distribution). All reported p-values were corrected for multiple testing using the BH method.
5.10. Molecular Characteristics of Clusters
Differences between clusters in terms of categorical variables were assessed using a chi-squared test. Continuous variables were assessed for distribution (normal, non-normal) using the Shapiro–Wilk test. Subsequently, we assessed differences between subtypes using a t-test (for normal distribution) or non-parametric Kruskal–Wallis test (for non-normal distribution). All reported p-values were corrected for multiple testing using the BH method. The workflow of the current study is summarized in Supplementary Table S4.
6. Conclusions
We found a moderate deregulation of autophagy-related genes in CRC compared to adjacent tissue. This may indicate that changes in the expression of autophagy genes in adjacent tissue are relatively high, thus suggesting a prominent premalignant field defect or early disruption of autophagy. This implies that future studies on changes in the expression of autophagy-related genes should employ normal colon tissue dissected from individuals free of cancer. Moreover, our study identified two autophagy sets of genes (modules) in CRC: MSI-enriched and MSI-depleted. Genes that differ between clusters are connected to the lysosomal degradation pathway and may constitute candidates for CRC targeting therapy.
Supplementary Materials
The following are available online at https://www.mdpi.com/1422-0067/21/19/7101/s1; Table S1: Results of gene set enrichment analysis in a CRC RNA-seq dataset by comparing 2055 gene sets in tumor vs. adjacent normal tissue; Table S2: List of 46 selected autophagy genes; Table S3: Results of differential expression analysis (autophagy clusters vs. normal adjacent tissue; Table S4: Statistical procedures utilized in this study.
Author Contributions
Conceptualization, J.G. and P.K.; analyzed the data, P.K.; writing—original draft preparation, J.G.; writing—review and editing, J.G, P.K. and M.M.S.; supervision, M.M.S. All authors have read and agreed to the published version of the manuscript.
Funding
This research received no external funding.
Conflicts of Interest
The authors declare no conflict of interest.
Abbreviations
| BH | Benjamini–Hochberg p-value correction for multiple testing |
| CMS | consensus molecular subtype |
| COMMUNAL | Combined Mapping of Multiple Clustering Algorithms |
| CRC | colorectal cancer |
| DE | differential expression |
| EGSEA | Ensemble of Gene Set Enrichment Analyses |
| FDR | False Discovery Rate |
| logFC | log fold change |
| MSI | microsatellite instability; microsatellite instable |
| MSS | microsatellite stability; microsatellite stable |
| NTP | nearest template prediction |
| RNA-seq | RNA sequencing |
| sPLS-DA | Sparse Partial Least Squares Discriminant Analysis |
| TCGA | The Cancer Genome Atlas |
References
- Siegel, R.L.; Miller, K.D.; Fedewa, S.A.; Ahnen, D.J.; Meester, R.G.S.; Barzi, A.; Jemal, A. Colorectal cancer statistics, 2017. CA Cancer J. Clin. 2017, 67, 177–193. [Google Scholar] [CrossRef] [PubMed]
- Arnold, M.; Sierra, M.S.; Laversanne, M.; Soerjomataram, I.; Jemal, A.; Bray, F. Global patterns and trends in colorectal cancer incidence and mortality. Gut 2017, 66, 683–691. [Google Scholar] [CrossRef] [PubMed] [Green Version]
- Hashim, D.; Boffetta, P.; La Vecchia, C.; Rota, M.; Bertuccio, P.; Malvezzi, M.; Negri, E. The global decrease in cancer mortality: Trends and disparities. Ann. Oncol. 2016, 27, 926–933. [Google Scholar] [CrossRef] [PubMed]
- Welch, H.G.; Robertson, D.J. Colorectal Cancer on the Decline--Why Screening Can’t Explain It All. N. Engl. J. Med. 2016, 374, 1605–1607. [Google Scholar] [CrossRef] [PubMed]
- Gandhi, J.; Davidson, C.; Hall, C.; Pearson, J.; Eglinton, T.; Wakeman, C.; Frizelle, F. Population-based study demonstrating an increase in colorectal cancer in young patients. Br. J. Surg. 2017, 104, 1063–1068. [Google Scholar] [CrossRef]
- Young, J.P.; Win, A.K.; Rosty, C.; Flight, I.; Roder, D.; Young, G.P.; Frank, O.; Suthers, G.K.; Hewett, P.J.; Ruszkiewicz, A.; et al. Rising incidence of early-onset colorectal cancer in Australia over two decades: Report and review. J. Gastroenterol. Hepatol. 2015, 30, 6–13. [Google Scholar] [CrossRef] [PubMed]
- Gil, J.; Stembalska, A.; Łaczmańska, I.; Sąsiadek, M. Sporadic colorectal cancer—Factors modulating individual susceptibility to cancer. Współczesna Onkol. 2010, 3, 123–128. [Google Scholar] [CrossRef]
- Guinney, J.; Dienstmann, R.; Wang, X.; de Reyniès, A.; Schlicker, A.; Soneson, C.; Marisa, L.; Roepman, P.; Nyamundanda, G.; Angelino, P.; et al. The consensus molecular subtypes of colorectal cancer. Nat. Med. 2015, 21, 1350–1356. [Google Scholar] [CrossRef]
- Linnekamp, J.F.; van Hooff, S.R.; Prasetyanti, P.R.; Kandimalla, R.; Buikhuisen, J.Y.; Fessler, E.; Ramesh, P.; Lee, K.A.S.T.; Bochove, G.G.W.; de Jong, J.H.; et al. Consensus molecular subtypes of colorectal cancer are recapitulated in in vitro and in vivo models. Cell Death Differ. 2018, 25, 616–633. [Google Scholar] [CrossRef]
- Sveen, A.; Bruun, J.; Eide, P.W.; Eilertsen, I.A.; Ramirez, L.; Murumagi, A.; Arjama, M.; Danielsen, S.A.; Kryeziu, K.; Elez, E.; et al. Colorectal cancer consensus molecular subtypes translated to preclinical models uncover potentially targetable cancer cell dependencies. Clin. Cancer Res. 2018, 24, 794–806. [Google Scholar] [CrossRef] [Green Version]
- Okita, A.; Takahashi, S.; Ouchi, K.; Inoue, M.; Watanabe, M.; Endo, M.; Honda, H.; Yamada, Y.; Ishioka, C. Consensus molecular subtypes classification of colorectal cancer as a predictive factor for chemotherapeutic efficacy against metastatic colorectal cancer. Oncotarget 2018, 9, 18698–18711. [Google Scholar] [CrossRef] [PubMed]
- Hoadley, K.A.; Yau, C.; Wolf, D.M.; Cherniack, A.D.; Tamborero, D.; Ng, S.; Leiserson, M.D.M.; Niu, B.; McLellan, M.D.; Uzunangelov, V.; et al. Multiplatform Analysis of 12 Cancer Types Reveals Molecular Classification within and across Tissues of Origin. Cell 2014, 158, 929–944. [Google Scholar] [CrossRef]
- Amaravadi, R.; Kimmelman, A.C.; White, E. Recent insights into the function of autophagy in cancer. Genes Dev. 2016, 30, 1913–1930. [Google Scholar] [CrossRef] [PubMed]
- Gil, J.; Pesz, K.A.; Sąsiadek, M.M. May autophagy be a novel biomarker and antitumor target in colorectal cancer? Biomark. Med. 2016, 10, 1081–1094. [Google Scholar] [CrossRef] [PubMed]
- Galluzzi, L.; Pietrocola, F.; Bravo-San Pedro, J.M.; Amaravadi, R.K.; Baehrecke, E.H.; Cecconi, F.; Codogno, P.; Debnath, J.; Gewirtz, D.A.; Karantza, V.; et al. Autophagy in malignant transformation and cancer progression. EMBO J. 2015, 34, 856–880. [Google Scholar] [CrossRef] [PubMed]
- Devenport, S.N.; Shah, Y.M. Functions and Implications of Autophagy in Colon Cancer. Cells 2019, 8, 1349. [Google Scholar] [CrossRef] [Green Version]
- Liang, X.H.; Jackson, S.; Seaman, M.; Brown, K.; Kempkes, B.; Hibshoosh, H.; Levine, B. Induction of autophagy and inhibition of tumorigenesis by beclin 1. Nature 1999, 402, 672–676. [Google Scholar] [CrossRef]
- Qu, X.; Yu, J.; Bhagat, G.; Furuya, N.; Hibshoosh, H.; Troxel, A.; Rosen, J.; Eskelinen, E.L.; Mizushima, N.; Ohsumi, Y.; et al. Promotion of tumorigenesis by heterozygous disruption of the beclin 1 autophagy gene. J. Clin. Investig. 2003, 112, 1809–1820. [Google Scholar] [CrossRef] [Green Version]
- Yang, X.; Yu, D.D.; Yan, F.; Jing, Y.Y.; Han, Z.P.; Sun, K.; Liang, L.; Hou, J.; Wei, L.X. The role of autophagy induced by tumor microenvironment in different cells and stages of cancer. Cell Biosci. 2015, 5, 14. [Google Scholar] [CrossRef] [Green Version]
- Gewirtz, D.A. The Four Faces of Autophagy: Implications for Cancer Therapy. Cancer Res. 2014, 74, 647–651. [Google Scholar] [CrossRef] [Green Version]
- Weldon Gilcrease, G.; Stenehjem, D.D.; Wade, M.L.; Weis, J.; McGregor, K.; Whisenant, J.; Boucher, K.M.; Thorne, K.; Orgain, N.; Garrido-Laguna, I.; et al. Phase I/II study of everolimus combined with mFOLFOX-6 and bevacizumab for first–line treatment of metastatic colorectal cancer. Investig. New Drugs 2019, 37, 482–489. [Google Scholar] [CrossRef] [PubMed]
- Bendell, J.C.; Ervin, T.J.; Senzer, N.N.; Richards, D.A.; Firdaus, I.; Lockhart, A.C.; Cohn, A.L.; Saleh, M.N.; Gardner, L.R.; Sportelli, P.; et al. Results of the X-PECT study: A phase III randomized double-blind, placebo-controlled study of perifosine plus capecitabine (P-CAP) versus placebo plus capecitabine (CAP) in patients (pts) with refractory metastatic colorectal cancer (mCRC). J. Clin. Oncol. 2012, 30, LBA3501. [Google Scholar] [CrossRef]
- Nikolouzakis, T.K.; Vassilopoulou, L.; Fragkiadaki, P.; Sapsakos, T.M.; Papadakis, G.Z.; Spandidos, D.A.; Tsatsakis, A.M.; Tsiaoussis, J. Improving diagnosis, prognosis and prediction by using biomarkers in CRC patients (Review). Oncol. Rep. 2018, 39, 2455–2472. [Google Scholar] [CrossRef] [PubMed] [Green Version]
- Maes, H.; Rubio, N.; Garg, A.D.; Agostinis, P. Autophagy: Shaping the tumor microenvironment and therapeutic response. Trends Mol. Med. 2013, 19, 428–446. [Google Scholar] [CrossRef] [PubMed]
- Yun, C.W.; Lee, S.H. The Roles of Autophagy in Cancer. Int. J. Mol. Sci. 2018, 19, 3466. [Google Scholar] [CrossRef] [Green Version]
- Mieczkowski, J.; Swiatek-Machado, K.; Kaminska, B. Identification of pathway deregulation—Gene expression based analysis of consistent signal transduction. PLoS ONE 2012, 7, e41541. [Google Scholar] [CrossRef] [PubMed]
- Aran, D.; Camarda, R.; Odegaard, J.; Paik, H.; Oskotsky, B.; Krings, G.; Goga, A.; Sirota, M.; Butte, A.J. Comprehensive analysis of normal adjacent to tumor transcriptomes. Nat. Commun. 2017, 8, 1–14. [Google Scholar] [CrossRef] [Green Version]
- Alessandrini, F.; Pezzè, L.; Ciribilli, Y. LAMPs: Shedding light on cancer biology. Semin. Oncol. 2017, 44, 239–253. [Google Scholar] [CrossRef] [PubMed]
- Furuta, K.; Ikeda, M.; Nakayama, Y.; Nakamura, K.; Tanaka, M.; Hamasaki, N.; Himeno, M.; Hamilton, S.R.; August, J.T. Expression of lysosome-associated membrane proteins in human colorectal neoplasms and inflammatory diseases. Am. J. Pathol. 2001, 159, 449–455. [Google Scholar] [CrossRef] [Green Version]
- Wang, Q.; Yao, J.; Jin, Q.; Wang, X.; Zhu, H.; Huang, F.; Wang, W.; Qiang, J.; Ni, Q. LAMP1 expression is associated with poor prognosis in breast cancer. Oncol. Lett. 2017, 14, 4729–4735. [Google Scholar] [CrossRef] [Green Version]
- Sarafian, V.S.; Koev, I.; Mehterov, N.; Kazakova, M.; Dangalov, K. LAMP-1 gene is overexpressed in high grade glioma. APMIS 2018, 126, 657–662. [Google Scholar] [CrossRef] [PubMed]
- Okato, A.; Goto, Y.; Kurozumi, A.; Kato, M.; Kojima, S.; Matsushita, R.; Yonemori, M.; Miyamoto, K.; Ichikawa, T.; Seki, N. Direct regulation of LAMP1 by tumor-suppressive microRNA-320a in prostate cancer. Int. J. Oncol. 2016, 49, 111–122. [Google Scholar] [CrossRef] [PubMed] [Green Version]
- Takeda, M.; Koseki, J.; Takahashi, H.; Miyoshi, N.; Nishida, N.; Nishimura, J.; Hata, T.; Matsuda, C.; Mizushima, T.; Yamamoto, H.; et al. Disruption of endolysosomal Rab5/7 efficiently eliminates colorectal cancer stem cells. Cancer Res. 2019, 79, 1426–1437. [Google Scholar] [CrossRef] [PubMed] [Green Version]
- Kang, M.R.; Kim, M.S.; Oh, J.E.; Kim, Y.R.; Song, S.Y.; Kim, S.S.; Ahn, C.H.; Yoo, N.J.; Lee, S.H. Frameshift mutations of autophagy-related genes ATG2B, ATG5, ATG9B and ATG12 in gastric and colorectal cancers with microsatellite instability. J. Pathol. 2009, 217, 702–706. [Google Scholar] [CrossRef] [PubMed]
- Mah, L.Y.; O’Prey, J.; Baudot, A.D.; Hoekstra, A.; Ryan, K.M. DRAM-1 encodes multiple isoforms that regulate autophagy. Autophagy 2012, 8, 18–28. [Google Scholar] [CrossRef] [Green Version]
- Crighton, D.; Wilkinson, S.; O’Prey, J.; Syed, N.; Smith, P.; Harrison, P.R.; Gasco, M.; Garrone, O.; Crook, T.; Ryan, K.M. DRAM, a p53-Induced Modulator of Autophagy, Is Critical for Apoptosis. Cell 2006, 126, 121–134. [Google Scholar] [CrossRef] [Green Version]
- Guan, J.-J.; Zhang, X.-D.; Sun, W.; Qi, L.; Wu, J.-C.; Qin, Z.-H. DRAM1 regulates apoptosis through increasing protein levels and lysosomal localization of BAX. Cell Death Dis. 2015, 6, e1624. [Google Scholar] [CrossRef]
- Huang, Z.; Liu, J.; Luo, L.; Sheng, P.; Wang, B.; Zhang, J.; Peng, S. Genome-Wide Identification of a Novel Autophagy-Related Signature for Colorectal Cancer. Dose Response 2019, 17, 155932581989417. [Google Scholar] [CrossRef] [Green Version]
- Zhou, Z.; Mo, S.; Dai, W.; Ying, Z.; Zhang, L.; Xiang, W.; Han, L.; Wang, Z.; Li, Q.; Wang, R.; et al. Development and Validation of an Autophagy Score Signature for the Prediction of Post-operative Survival in Colorectal Cancer. Front. Oncol. 2019, 9, 878. [Google Scholar] [CrossRef] [Green Version]
- Koustas, E.; Sarantis, P.; Kyriakopoulou, G.; Papavassiliou, A.G.; Karamouzis, M. V The Interplay of Autophagy and Tumor Microenvironment in Colorectal Cancer-Ways of Enhancing Immunotherapy Action. Cancers 2019, 11, 533. [Google Scholar] [CrossRef] [Green Version]
- Folkerts, H.; Hilgendorf, S.; Vellenga, E.; Bremer, E.; Wiersma, V.R. The multifaceted role of autophagy in cancer and the microenvironment. Med. Res. Rev. 2019, 39, 517–560. [Google Scholar] [CrossRef] [PubMed]
- Keller, C.W.; Loi, M.; Ligeon, L.-A.; Gannagé, M.; Lünemann, J.D.; Münz, C. Endocytosis regulation by autophagy proteins in MHC restricted antigen presentation. Curr. Opin. Immunol. 2018, 52, 68–73. [Google Scholar] [CrossRef] [PubMed]
- Rahman, M.; Jackson, L.K.; Johnson, W.E.; Li, D.Y.; Bild, A.H.; Piccolo, S.R. Alternative preprocessing of RNA-Sequencing data in The Cancer Genome Atlas leads to improved analysis results. Bioinformatics 2015, 31, 3666–3672. [Google Scholar] [CrossRef] [PubMed]
- Freeman, T.J.; Smith, J.J.; Chen, X.; Washington, M.K.; Roland, J.T.; Means, A.L.; Eschrich, S.A.; Yeatman, T.J.; Deane, N.G.; Beauchamp, R.D. Smad4-mediated signaling inhibits intestinal neoplasia by inhibiting expression of β-catenin. Gastroenterology 2012, 142, 562–571.e2. [Google Scholar] [CrossRef] [PubMed] [Green Version]
- Jorissen, R.N.; Gibbs, P.; Christie, M.; Prakash, S.; Lipton, L.; Desai, J.; Kerr, D.; Aaltonen, L.A.; Arango, D.; Kruhøffer, M.; et al. Metastasis-Associated Gene Expression Changes Predict Poor Outcomes in Patients with Dukes Stage B and C Colorectal Cancer. Clin. Cancer Res. 2009, 15, 7642–7651. [Google Scholar] [CrossRef] [Green Version]
- Jorissen, R.N.; Lipton, L.; Gibbs, P.; Chapman, M.; Desai, J.; Jones, I.T.; Yeatman, T.J.; East, P.; Tomlinson, I.P.M.; Verspaget, H.; et al. DNA copy-number alterations underlie gene expression differences between microsatellite stable and unstable colorectal cancers. Clin. Cancer Res. 2008, 14, 8061–8069. [Google Scholar] [CrossRef] [Green Version]
- Kemper, K.; Versloot, M.; Cameron, K.; Colak, S.; de Sousa e Melo, F.; de Jong, J.H.; Bleackley, J.; Vermeulen, L.; Versteeg, R.; Koster, J.; et al. Mutations in the Ras-Raf Axis underlie the prognostic value of CD133 in colorectal cancer. Clin. Cancer Res. 2012, 18, 3132–3141. [Google Scholar] [CrossRef] [Green Version]
- LaPointe, L.C.; Dunne, R.; Brown, G.S.; Worthley, D.L.; Molloy, P.L.; Wattchow, D.; Young, G.P. Map of differential transcript expression in the normal human large intestine. Physiol. Genomics 2008, 33, 50–64. [Google Scholar] [CrossRef]
- Li, S.; Lu, X.; Chi, P.; Pan, J. Identification of HOXB8 and KLK11 expression levels as potential biomarkers to predict the effects of FOLFOX4 chemotherapy. Futur. Oncol. 2013, 9, 727–736. [Google Scholar] [CrossRef]
- Marisa, L.; de Reyniès, A.; Duval, A.; Selves, J.; Gaub, M.P.; Vescovo, L.; Etienne-Grimaldi, M.-C.; Schiappa, R.; Guenot, D.; Ayadi, M.; et al. Gene expression classification of colon cancer into molecular subtypes: Characterization, validation, and prognostic value. PLoS Med. 2013, 10, e1001453. [Google Scholar] [CrossRef] [Green Version]
- Matsuyama, T.; Ishikawa, T.; Mogushi, K.; Yoshida, T.; Iida, S.; Uetake, H.; Mizushima, H.; Tanaka, H.; Sugihara, K. MUC12 mRNA expression is an independent marker of prognosis in stage II and stage III colorectal cancer. Int. J. Cancer 2010, 127, 2292–2299. [Google Scholar] [CrossRef] [PubMed]
- Molnár, B.; Galamb, O.; Péterfia, B.; Wichmann, B.; Csabai, I.; Bodor, A.; Kalmár, A.; Szigeti, K.A.; Barták, B.K.; Nagy, Z.B.; et al. Gene promoter and exon DNA methylation changes in colon cancer development—mRNA expression and tumor mutation alterations. BMC Cancer 2018, 18, 695. [Google Scholar] [CrossRef] [PubMed] [Green Version]
- Sabates-Bellver, J.; van der Flier, L.G.; De Palo, M.; Cattaneo, E.; Maake, C.; Rehrauer, H.; Laczko, E.; Kurowski, M.A.; Bujnicki, J.M.; Menigatti, M.; et al. Transcriptome profile of human colorectal adenomas. Mol. Cancer Res. 2007, 5, 1263–1275. [Google Scholar] [CrossRef] [PubMed] [Green Version]
- Schlicker, A.; Beran, G.; Chresta, C.M.; McWalter, G.; Pritchard, A.; Weston, S.; Runswick, S.; Davenport, S.; Heathcote, K.; Castro, D.A.; et al. Subtypes of primary colorectal tumors correlate with response to targeted treatment in colorectal cell lines. BMC Med. Genomics 2012, 5, 66. [Google Scholar] [CrossRef]
- Tsuji, S.; Midorikawa, Y.; Takahashi, T.; Yagi, K.; Takayama, T.; Yoshida, K.; Sugiyama, Y.; Aburatani, H. Potential responders to FOLFOX therapy for colorectal cancer by Random Forests analysis. Br. J. Cancer 2012, 106, 126–132. [Google Scholar] [CrossRef] [Green Version]
- Valcz, G.; Patai, A.V.; Kalmár, A.; Péterfia, B.; Fűri, I.; Wichmann, B.; Műzes, G.; Sipos, F.; Krenács, T.; Mihály, E.; et al. Myofibroblast-derived SFRP1 as potential inhibitor of colorectal carcinoma field effect. PLoS ONE 2014, 9, e106143. [Google Scholar] [CrossRef] [Green Version]
- Thorsson, V.; Gibbs, D.L.; Brown, S.D.; Wolf, D.; Bortone, D.S.; Ou Yang, T.H.; Porta-Pardo, E.; Gao, G.F.; Plaisier, C.L.; Eddy, J.A.; et al. The Immune Landscape of Cancer. Immunity 2018, 48, 812–830.e14. [Google Scholar] [CrossRef] [Green Version]
- Iorio, F.; Knijnenburg, T.A.; Vis, D.J.; Bignell, G.R.; Menden, M.P.; Schubert, M.; Aben, N.; Gonçalves, E.; Barthorpe, S.; Lightfoot, H.; et al. A Landscape of Pharmacogenomic Interactions in Cancer. Cell 2016, 166, 740–754. [Google Scholar] [CrossRef] [Green Version]
- Eide, P.W.; Bruun, J.; Lothe, R.A.; Sveen, A. CMScaller: An R package for consensus molecular subtyping of colorectal cancer pre-clinical models. Sci. Rep. 2017, 7, 16618. [Google Scholar] [CrossRef] [Green Version]
- Filzmoser, P.; Todorov, V. Robust tools for the imperfect world. Inf. Sci. 2013, 245, 4–20. [Google Scholar] [CrossRef]
- Dai, M.; Wang, P.; Boyd, A.D.; Kostov, G.; Athey, B.; Jones, E.G.; Bunney, W.E.; Myers, R.M.; Speed, T.P.; Akil, H.; et al. Evolving gene/transcript definitions significantly alter the interpretation of GeneChip data. Nucleic Acids Res. 2005, 33, e175. [Google Scholar] [CrossRef] [PubMed] [Green Version]
- Sandberg, R.; Larsson, O. Improved precision and accuracy for microarrays using updated probe set definitions. BMC Bioinform. 2007, 8, 48. [Google Scholar] [CrossRef] [PubMed] [Green Version]
- Johnson, W.E.; Li, C.; Rabinovic, A. Adjusting batch effects in microarray expression data using empirical Bayes methods. Biostatistics 2007, 8, 118–127. [Google Scholar] [CrossRef] [PubMed]
- Alhamdoosh, M.; Ng, M.; Wilson, N.J.; Sheridan, J.M.; Huynh, H.; Wilson, M.J.; Ritchie, M.E. Combining multiple tools outperforms individual methods in gene set enrichment analyses. Bioinformatics 2017, 33, 414–424. [Google Scholar] [CrossRef] [PubMed]
- Rodchenkov, I.; Babur, O.; Luna, A.; Aksoy, B.A.; Wong, J.V.; Fong, D.; Franz, M.; Siper, M.C.; Cheung, M.; Wrana, M.; et al. Pathway Commons 2019 Update: Integration, analysis and exploration of pathway data. Nucleic Acids Res. 2020, 48, D489–D497. [Google Scholar] [CrossRef] [PubMed] [Green Version]
- Sweeney, T.E.; Chen, A.C.; Gevaert, O. Combined Mapping of Multiple clUsteriNg ALgorithms (COMMUNAL): A Robust Method for Selection of Cluster Number, K. Sci. Rep. 2015, 5, 1–10. [Google Scholar] [CrossRef] [PubMed] [Green Version]
Figure 1.
Results of unsupervised clustering and partial last squares discriminant analysis PLS (sPLS-DA) of colorectal cancer (CRC) datasets (RNA-seq and array) using selected autophagy-related genes. Samples were separated based on unsupervised clustering, and visualized genes were selected according to sPLS-DA [(A)—CRC array; (B)—CRC RNA-seq]. The corresponding box plots illustrate the expression distribution of the most highly ranked genes in terms of separation of clusters. [(C)—CRC array; (D)—CRC RNA-seq]. MSI: microsatellite instability; MSS: microsatellite stability.
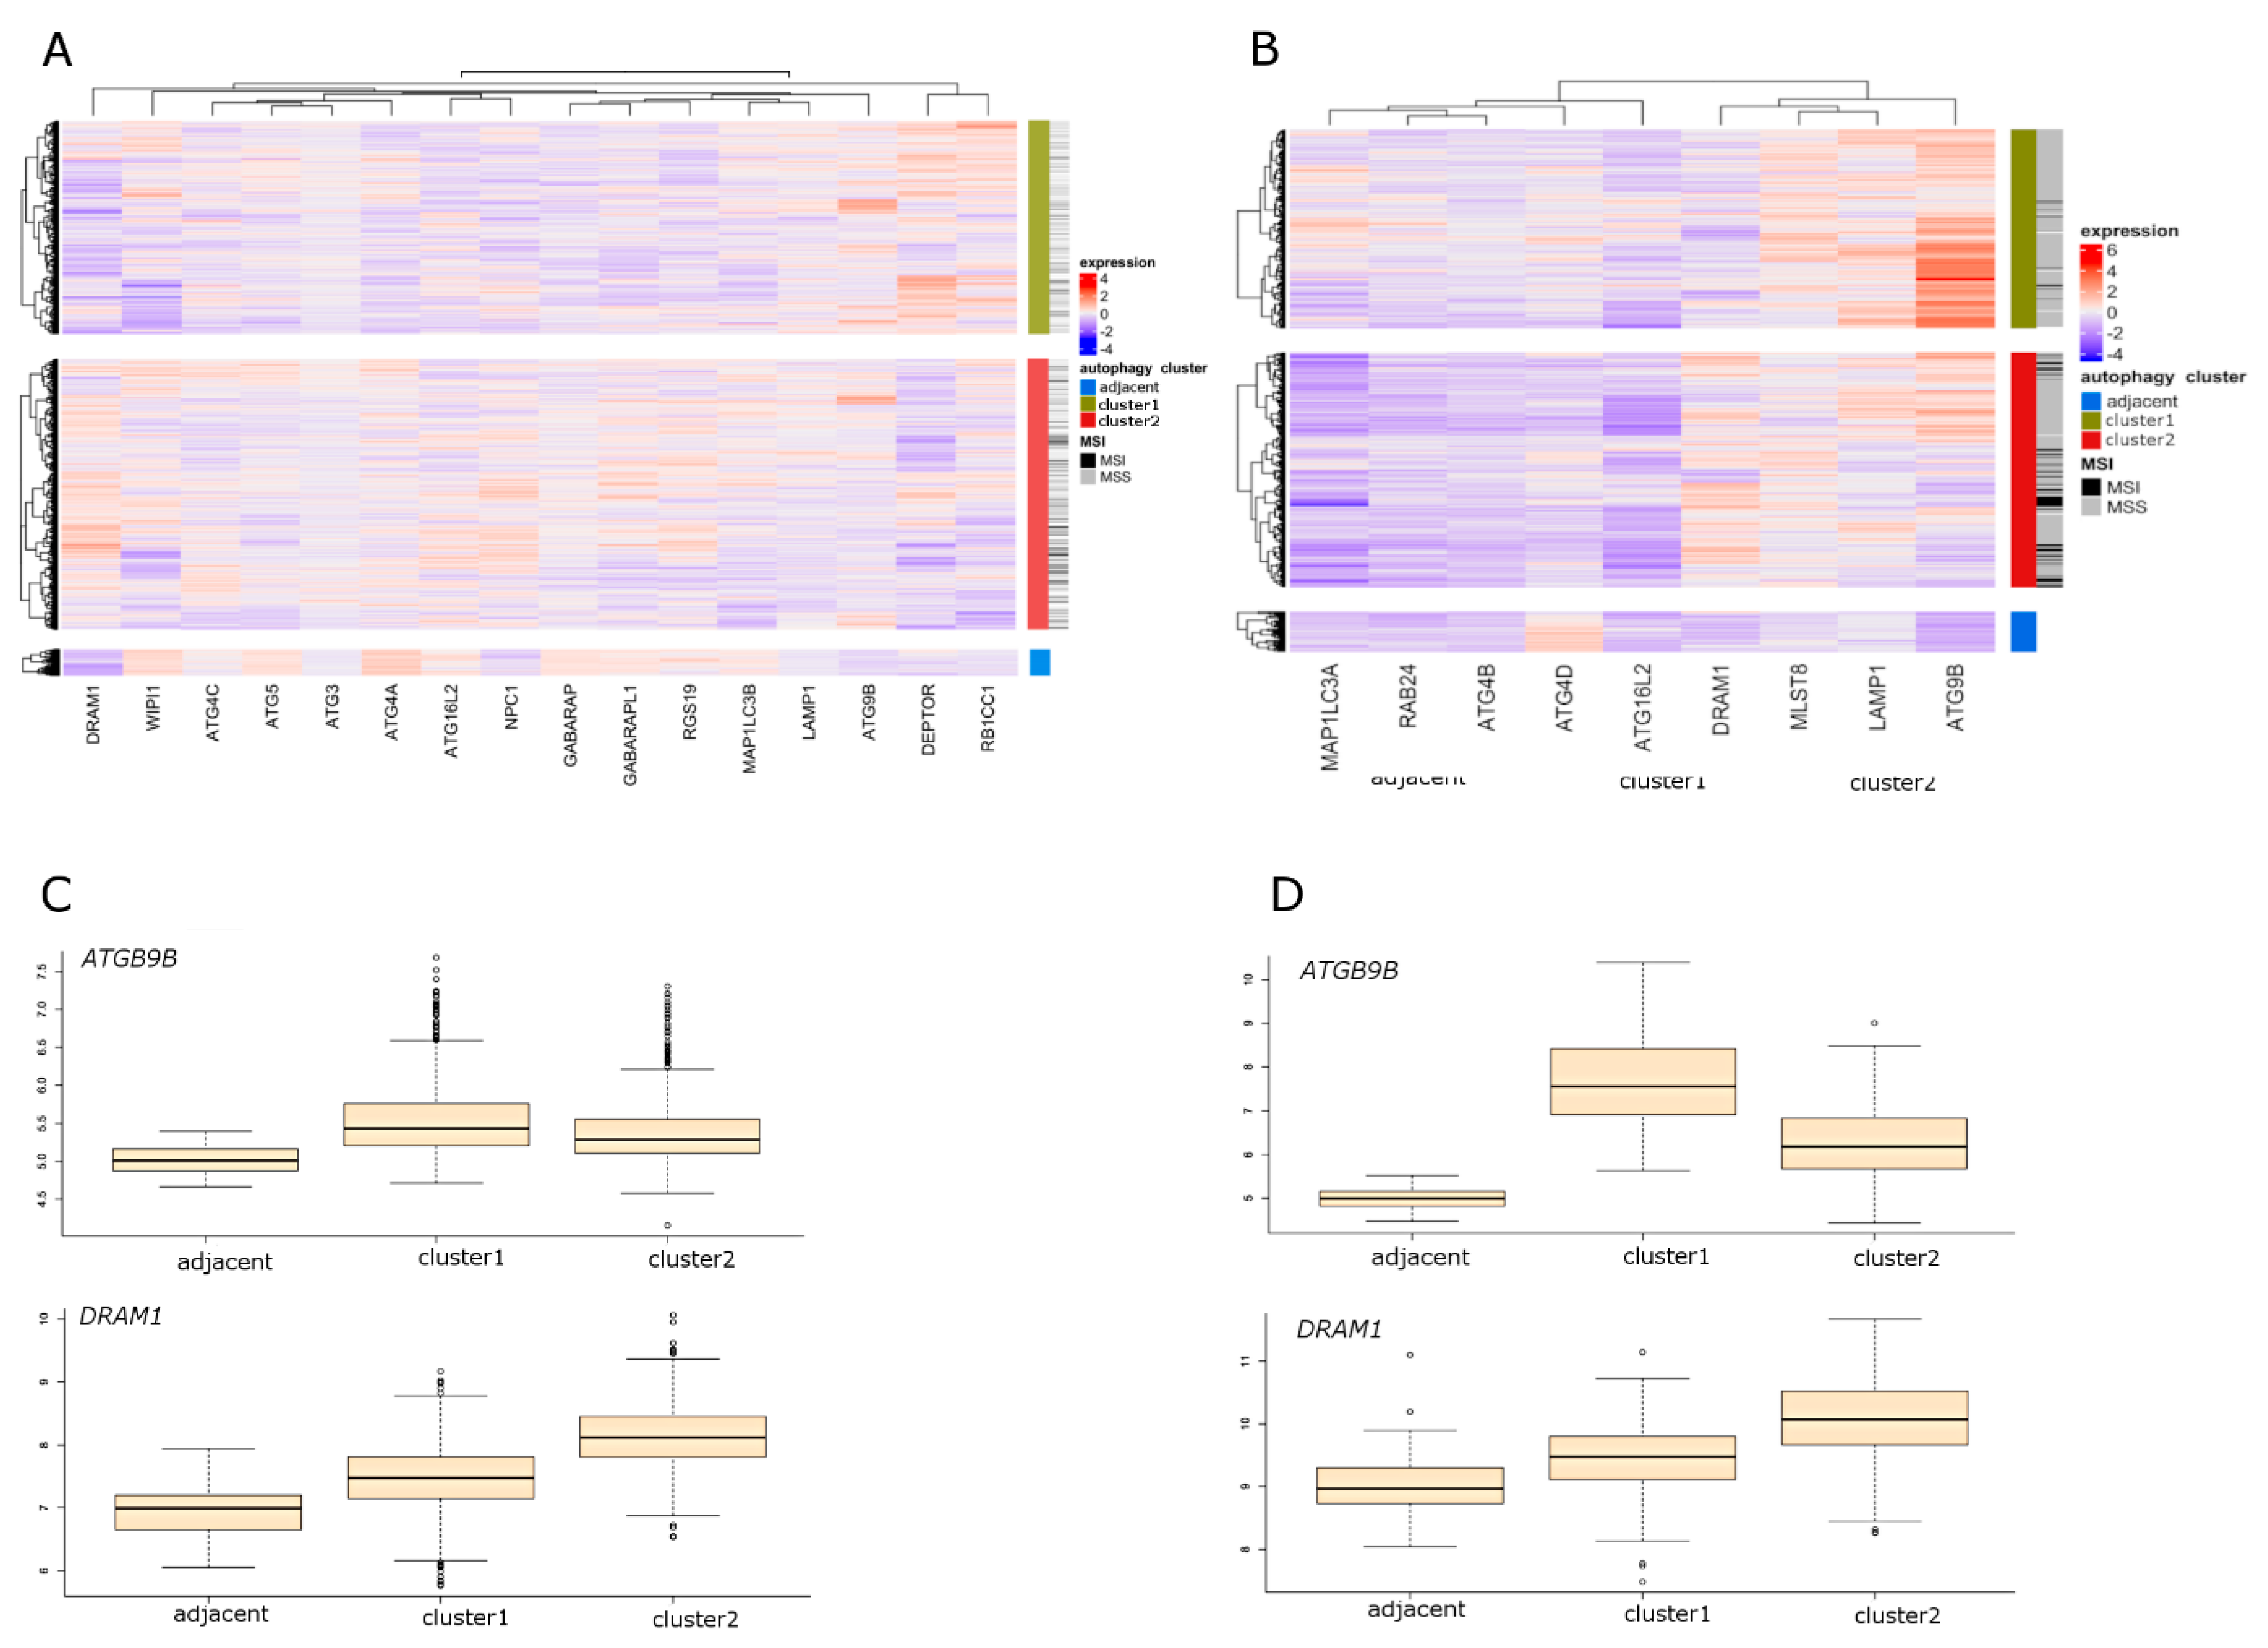
Figure 2.
Results of unsupervised clustering and sPLS-DA in cell line dataset using selected autophagy-related genes. (A) Samples were separated based on unsupervised clustering and visualized genes were selected according to sPLS-DA. (B) The corresponding box plots illustrate the most highly ranked genes in terms of separation of clusters. MSI: microsatellite instability; MSS: microsatellite stability.
Figure 3.
Differential expression (DE) analysis between autophagy-based clusters and normal adjacent tissues. (A,B) depict volcano plots based on DE analysis in the ‘limma’ package in CRC array dataset (A—cluster 1 vs. normal; B—cluster 2 vs. normal). (C,D) depicts volcano plots based on DE analysis in the limma package (RNA-seq datasets). (C—cluster 1 vs. normal; D—cluster 2 vs. normal). The vertical lines correspond to 1.0-fold up and down, respectively. The blue dot in the plot represents the gene with a False Discovery Rate (FDR) ≤ 0.05 and logFC < −1, whereas the red dot represents the gene with a FDR ≤ 0.05 and logFC > 1. Black dots indicate insignificant changes in gene expression. Data used to build volcano plots are included in Supplementary Table S3.

Table 1.
Molecular characteristics of autophagy clusters (The Cancer Genome Atlas (TCGA) RNA-seq data).
Table 1.
Molecular characteristics of autophagy clusters (The Cancer Genome Atlas (TCGA) RNA-seq data).
| Clinicopathological Characteristics | [ALL] | Cluster 1 | Cluster 2 | adj. p-Value * | N ** |
|---|---|---|---|---|---|
| N = 502 | N = 232 | N = 270 | |||
| MSI: | <0.001 | 497 | |||
| MSI | 71 (14.3%) | 11 (4.8%) | 60 (22.2%) | ||
| MSS | 426 (85.7%) | 216 (95.2%) | 210 (77.8%) | ||
| CMScaller: | <0.001 | 457 | |||
| CMS1 | 83 (18.2%) | 18 (9.0%) | 65 (25.4%) | ||
| CMS2 | 141 (30.9%) | 104 (51.7%) | 37 (14.5%) | ||
| CMS3 | 82 (17.9%) | 21 (10.4%) | 61 (23.8%) | ||
| CMS4 | 151 (33.0%) | 58 (28.9%) | 93 (36.3%) | ||
| age | 68.0 [58.0; 76.0] | 68.0 [59.0; 75.0] | 68.0 [57.0; 77.0] | 0.828 | 502 |
| location: | <0.001 | 487 | |||
| distal | 273 (56.1%) | 149 (66.2%) | 124 (47.3%) | ||
| proximal | 214 (43.9%) | 76 (33.8%) | 138 (52.7%) | ||
| stage: | 0.003 | 486 | |||
| I | 84 (17.3%) | 27 (12.1%) | 57 (21.8%) | ||
| II | 189 (38.9%) | 84 (37.5%) | 105 (40.1%) | ||
| III | 138 (28.4%) | 67 (29.9%) | 71 (27.1%) | ||
| IV | 75 (15.4%) | 46 (20.5%) | 29 (11.1%) | ||
| gender: | 0.941 | 502 | |||
| female | 227 (45.2%) | 104 (44.8%) | 123 (45.6%) | ||
| male | 275 (54.8%) | 128 (55.2%) | 147 (54.4%) | ||
| Single nucleotide variants | 54.0 [41.0; 80.0] | 51.0 [37.0; 66.0] | 60.0 [41.0; 303.5] | <0.001 | 389 |
| Non-silent mutation rate | 2.7 [2.1; 3.8] | 2.6 [1.9; 3.3] | 2.9 [2.2; 5.0] | <0.001 | 382 |
| Aneuploidy score | 10.0 [4.0; 16.0] | 11.0 [7.0; 16.0] | 8.0 [2.0; 16.0] | <0.001 | 469 |
| APCmut: | <0.001 | 422 | |||
| 0 | 96 (22.7%) | 24 (13.0%) | 72 (30.4%) | ||
| 1 | 326 (77.3%) | 161 (87.0%) | 165 (69.6%) | ||
| TP53mut: | <0.001 | 422 | |||
| 0 | 172 (40.8%) | 45 (24.3%) | 127 (53.6%) | ||
| 1 | 250 (59.2%) | 140 (75.7%) | 110 (46.4%) | ||
| KRASmut: | 0.837 | 422 | |||
| 0 | 252 (59.7%) | 112 (60.5%) | 140 (59.1%) | ||
| 1 | 170 (40.3%) | 73 (39.5%) | 97 (40.9%) | ||
| BRAFmut: | <0.001 | 422 | |||
| 0 | 365 (86.5%) | 175 (94.6%) | 190 (80.2%) | ||
| 1 | 57 (13.5%) | 10 (5.4%) | 47 (19.8%) |
* p-values adjusted using overall comparisons employing the Benjamini–Hochberg. ** samples with available data. MSI: microsatellite instability; MSS: microsatellite stability.
Table 2.
Data of colorectal cancer patients (Affymetrix array data).
| Clinicopathological Characteristics | [ALL] | Cluster 1 | Cluster 2 | adj. p-Value * | N ** |
|---|---|---|---|---|---|
| N = 1229 | N = 505 | N = 724 | |||
| age | 69.0 [60.0; 77.0] | 68.0 [59.0; 75.0] | 70.0 [60.0; 78.0] | 0.022 | 566 |
| gender: | 0.302 | 703 | |||
| female | 304 (43.2%) | 135 (41.0%) | 169 (45.2%) | ||
| male | 399 (56.8%) | 194 (59.0%) | 205 (54.8%) | ||
| stage: | 0.081 | 603 | |||
| I | 70 (11.6%) | 31 (10.9%) | 39 (12.3%) | ||
| II | 265 (43.9%) | 119 (41.8%) | 146 (45.9%) | ||
| III | 189 (31.3%) | 87 (30.5%) | 102 (32.1%) | ||
| IV | 79 (13.1%) | 48 (16.8%) | 31 (9.7%) | ||
| MSI_native: | <0.001 | 685 | |||
| MSI | 162 (23.6%) | 32 (10.4%) | 130 (34.6%) | ||
| MSS | 523 (76.4%) | 277 (89.6%) | 246 (65.4%) | ||
| CMScaller: | <0.001 | 1229 | |||
| CMS1 | 218 (17.7%) | 37 (7.3%) | 181 (25.0%) | ||
| CMS2 | 373 (30.3%) | 254 (50.3%) | 119 (16.4%) | ||
| CMS3 | 215 (17.5%) | 87 (17.2%) | 128 (17.7%) | ||
| CMS4 | 423 (34.4%) | 127 (25.1%) | 296 (40.9%) |
* p-values adjusted using overall comparisons employing the Benjamini–Hochberg. ** Samples with available data. MSI: microsatellite instability.
© 2020 by the authors. Licensee MDPI, Basel, Switzerland. This article is an open access article distributed under the terms and conditions of the Creative Commons Attribution (CC BY) license (http://creativecommons.org/licenses/by/4.0/).
Share and Cite
MDPI and ACS Style
Gil, J.; Karpiński, P.; Sąsiadek, M.M. Transcriptomic Profiling for the Autophagy Pathway in Colorectal Cancer. Int. J. Mol. Sci. 2020, 21, 7101. https://doi.org/10.3390/ijms21197101
AMA Style
Gil J, Karpiński P, Sąsiadek MM. Transcriptomic Profiling for the Autophagy Pathway in Colorectal Cancer. International Journal of Molecular Sciences. 2020; 21(19):7101. https://doi.org/10.3390/ijms21197101
Chicago/Turabian StyleGil, Justyna, Paweł Karpiński, and Maria M. Sąsiadek. 2020. "Transcriptomic Profiling for the Autophagy Pathway in Colorectal Cancer" International Journal of Molecular Sciences 21, no. 19: 7101. https://doi.org/10.3390/ijms21197101
Note that from the first issue of 2016, this journal uses article numbers instead of page numbers. See further details here.