Article

GAGA Regulates Border Cell Migration in Drosophila

by
Anna A. Ogienko
1,*,†,
Lyubov A. Yarinich
1,2,†,
Elena V. Fedorova
3,
Natalya V. Dorogova
3,
Sergey I. Bayborodin
3,
Elina M. Baricheva
3 and
Alexey V. Pindyurin
1,*
1
Department of the Regulation of Genetic Processes, Institute of Molecular and Cellular Biology of the Siberian Branch of the Russian Academy of Sciences, 630090 Novosibirsk, Russia
2
Faculty of Natural Sciences, Novosibirsk State University, 630090 Novosibirsk, Russia
3
Department of Cell Biology, Institute of Cytology and Genetics of the Siberian Branch of the Russian Academy of Sciences, 630090 Novosibirsk, Russia
*
Authors to whom correspondence should be addressed.
These authors contributed equally.
Int. J. Mol. Sci. 2020, 21(20), 7468; https://doi.org/10.3390/ijms21207468
Submission received: 30 August 2020 / Revised: 30 September 2020 / Accepted: 7 October 2020 / Published: 10 October 2020
(This article belongs to the Special Issue Cell Adhesion and Migration in Health and Diseases)

Abstract

:
Collective cell migration is a complex process that happens during normal development of many multicellular organisms, as well as during oncological transformations. In Drosophila oogenesis, a small set of follicle cells originally located at the anterior tip of each egg chamber become motile and migrate as a cluster through nurse cells toward the oocyte. These specialized cells are referred to as border cells (BCs) and provide a simple and convenient model system to study collective cell migration. The process is known to be complexly regulated at different levels and the product of the slow border cells (slbo) gene, the C/EBP transcription factor, is one of the key elements in this process. However, little is known about the regulation of slbo expression. On the other hand, the ubiquitously expressed transcription factor GAGA, which is encoded by the Trithorax-like (Trl) gene was previously demonstrated to be important for Drosophila oogenesis. Here, we found that Trl mutations cause substantial defects in BC migration. Partially, these defects are explained by the reduced level of slbo expression in BCs. Additionally, a strong genetic interaction between Trl and slbo mutants, along with the presence of putative GAGA binding sites within the slbo promoter and enhancer, suggests the direct regulation of this gene by GAGA. This idea is supported by the reduction in the slbo-Gal4-driven GFP expression within BC clusters in Trl mutant background. However, the inability of slbo overexpression to compensate defects in BC migration caused by Trl mutations suggests that there are other GAGA target genes contributing to this process. Taken together, the results define GAGA as another important regulator of BC migration in Drosophila oogenesis.

1. Introduction

Collective cell migration was found in many different organisms during embryonic development and wound healing, as well as in some metastatic cancers. In Drosophila oogenesis, a small set of follicle cells (FCs) originally located at the anterior tip of each egg chamber become motile and migrate as a cluster through nurse cells toward the oocyte. These specialized cells are referred to as border cells (BCs) and provide a simple and convenient model system to study the mechanisms that control collective cell migration in vivo [1,2,3,4]. More specifically, BCs arise within an epithelium consisting of more than a thousand FCs that encircle a cluster of 16 germline cells to form an egg chamber [5]. At early stage of oogenesis, two specialized FCs, referred to as polar cells, differentiate both at the anterior and posterior tips of the egg chamber [6,7,8]. The anterior polar cells recruit several (from 4 to 8) additional neighboring FCs, and the cluster becomes motile, invades the group of nurse cells and moves toward the oocyte [9].
A number of genes are known to be necessary for the conversion of BCs from stationary epithelial cells into motile, invasive cells. The specification and movement of BCs are controlled by different signaling pathways, ecdysone steroid hormone, receptor tyrosine kinases as well as by multiple transcription factors [10]. The polar cells secrete cytokines, which bind to a transmembrane receptor of neighboring FCs to trigger activation of Janus Kinase (JAK) [11,12,13,14,15]. JAK phosphorylates Signal Transduction and Activator of Transcription (STAT), which then translocates to the nucleus, where it activates transcription of a number of target genes [16,17,18]. Among those is the slow border cells (slbo) gene, which encodes a C/EBP transcription factor (hereafter Slbo), that determines BC fate [9]. Slbo is responsible for regulation of expression of numerous factors implicated in the cell migration process, such as cytoskeletal regulators and adhesion molecules. Eventually, sufficient amount of the Slbo protein must be present in BCs for their movement [19,20].
Only a few factors are known that regulate the slbo gene expression at the transcriptional level. Namely, STAT, Traffic jam and Notch via Su(H) were found to be necessary for activation of the slbo gene transcription [13,21,22,23,24], whereas Apontic, Bunched, Cut, Hindsight and Slbo itself were demonstrated to downregulate slbo activity [21,23,25,26,27,28]. However, studies on the interactions between these transcription factors and their putative binding sites within slbo regulatory sequences are limited and were performed solely by using in vitro assays [21,26]. To simplify the analysis of BC behavior, the slbo-Gal4 driver construct was previously constructed, in which Gal4 expression was placed under the control of a minimal promoter element and a 2.6-kb slbo enhancer [29]. This construct was integrated at different genomic sites and currently a number of slbo-Gal4 driver lines are available (e.g., chic6458, Novo11, Novo16 and Novo22) that express Gal4 in a pattern indistinguishable from that of the endogenous Slbo [29,30].
Previously, we reported that the ubiquitously expressed product of the Trithorax-like (Trl) gene, the transcription factor GAGA (also known as GAGA factor or GAF), is required for normal Drosophila oogenesis [31,32,33]. GAGA is well known for regulation of transcriptional activity of many genes through local modifications of chromatin structure at their regulatory elements [34,35,36,37,38]. In developing egg chambers, GAGA is present in the nucleus of all cells and the decrease in the protein level results in defects in actin cytoskeleton organization, the disruption of oogenesis and reduced female fertility [31,32,33,39].
Here, we found that Trl mutations cause substantial defects in BC migration, which can be partially explained by the direct regulation of slbo transcriptional activity by GAGA. The results obtained also suggest that there are other GAGA target genes contributing to the cell migration process. Altogether, GAGA can be defined as an important regulator of BC migration in Drosophila oogenesis.

2. Results

2.1. Molecular Characterization of Chromosomes Carrying Trl362 and Trl3609 Mutations

First, we verified fly stocks with Trl mutations chosen for the study, Trl362, Trl3609, Trl13C and TrlR85, by genotyping PCR with allele-specific primers (Table S1). In addition, since according to our previous experience, transgenic Drosophila lines frequently bear extra uncharacterized transposon constructs, sometimes even within genes relevant to the studied process [30], we checked the Trl mutant lines for the presence of additional P element sequences by quantitative PCR. Indeed, this analysis demonstrated that chromosomes carrying Trl362 and Trl3609 mutations carry extra P element transgenes, one in each case (Figure S1A). The subsequent inverse-PCR mapping of P element insertion sites in Trl362 and Trl3609 lines revealed previously unknown additional transgenic constructs located within the alan shepard (shep) and couch potato (cpo) genes, respectively (Figure S1B). The transposon inserted in the intron/promoter of the shep gene (3L: 5,248,444–5,248,451; here and afterwards, coordinates are from Release 6 of the Drosophila melanogaster genome assembly [40]) consists almost exclusively of P element end sequences and has a total length of 913 bp. The transgene inserted in the intron/promoter of the cpo gene (3R: 17,944,070–17,944,077) is much longer (about 9 kb) and its internal composition (DNA sequence between P element ends) was not investigated. The presence of these novel transgenes in Trl362 and Trl3609 lines was confirmed by PCR with primers specific to the P element ends and the sequences flanking the insertion sites (Figure S1B, Table S1).

2.2. Decrease in Trl Expression Delays BC Migration

We examined whether the GAGA protein is important for BC migration. For that, we studied this process in hypomorphic Trl mutants, TrlR85/Trl362 and Trl3609/Trl13C. A significant delay in BC migration was observed in both mutant combinations compared to the control (Figure 1A). Particularly, the migration and completion indexes, parameters that characterize the distance covered by BCs by the end of stage 10 [41], were much lower in TrlR85/Trl362 and Trl3609/Trl13C mutants than in Trl+/Trl+ flies (Figure 1B). These defects were almost completely rescued by ubiquitous overexpression of GAGA by the means of the hsp83: GAGA-519 transgene [42] in the TrlR85/Trl362 and Trl3609/Trl13C mutant backgrounds (Figure 1B) pointing to the necessity of this transcription factor for BC migration. Notably, the overexpression of GAGA per se had very little effect on migration of BCs (Figure 1B). To assess the input of BC-specific expression of the Trl gene in the observed phenomenon, we induced RNA interference (RNAi) of this gene using the slbo-Gal4 driver, which is exclusively active in BCs, posterior and centripetal FCs [29,30]. This resulted in BC migration defects similar to those observed in TrlR85/Trl362 and Trl3609/Trl13C mutants (Figure 1B). Thus, we concluded that proper migration of BCs depends on the level of the GAGA protein.

2.3. GAGA Regulates Transcriptional Activity of the slbo Gene during Migration of BCs

Next, we wondered whether the GAGA protein is expressed in BCs along their migration to the nurse cell–oocyte boundary. To assess that, we used the slbo1 allele caused by the insertion of LacZ reporter gene within the promoter region of the slbo gene [9]; this mutation is also known as slbo-LacZ. It was previously demonstrated that the β-galactosidase expression pattern driven by slbo1 is matching that of the endogenous Slbo protein. Importantly, heterozygous slbo1 egg chambers develop normally and morphologically are indistinguishable from the wild-type counterparts [9]. Immunostaining of slbo1/+ stage 9 and stage 10 egg chambers with anti-β-galactosidase and anti-GAGA antibodies revealed that these proteins colocalize in the BC nuclei along the entire process of cell migration; while GAGA was also detected in all FCs (Figure 2A,B). Furthermore, the reduction in the GAGA protein level in slbo1/+; TrlR85/Trl362 mutants led to a pronounced decrease in β-galactosidase staining at both analyzed stages of egg chamber development, suggesting the regulation of the slbo gene activity by GAGA (Figure 2C,D).
To check this hypothesis, we used RT-qPCR to measure the abundance of slbo and Trl transcripts in ovaries of different genotypes (Figure 2E). Indeed, a strong reduction in slbo transcripts (down to ~20%) was detected in TrlR85/Trl362 ovaries. At the same time, slbo transcript levels were much less affected in hypomorphic slbo1/slbo1 and slbo1/slboe7b mutants. In addition, overexpression of GAGA had no obvious effect on the slbo gene transcription (Figure 2E). Taken together, the slbo gene expression in migrating BCs appears to be regulated by the GAGA protein.

2.4. Genetic Interaction between Trl and slbo Genes

To further study the possible regulation of the slbo gene expression by GAGA, we employed the genetic approach. Specifically, we compared BC migration defects observed in hypomorphic slbo mutants with those demonstrated by hypomorphic slbo and Trl double mutants. Analysis of stage 10 egg chambers from slbo1/slbo1 and slbo1/slbo1; TrlR85/Trl362 flies showed that BC migration was completely blocked in 36% and 42% of cases, respectively (Figure 2F). Similarly, the frequency of such strong defects observed in slbo1/slbory7 and slbo1/slboe7b egg chambers increased, respectively, from 21% to 85% and from 59% to 75% in TrlR85/Trl362 mutant background (Figure 2F). On the contrary, the addition of one copy of the hsp83: GAGA-519 transgene slightly rescued the complete blockage of BC migration observed in slbo mutants; the defect was observed in 12%, 8% and 44% of slbo1, hsp83:GAGA-519/slbo1, slbo1, hsp83:GAGA-519/slbory7 and slbo1, hsp83:GAGA-519/slboe7b egg chambers, respectively (Figure 2F). Overall, the results indicate that BC migration defects observed in slbo mutants are severely enhanced by mutations in the Trl gene, whereas GAGA overexpression slightly diminishes these defects.

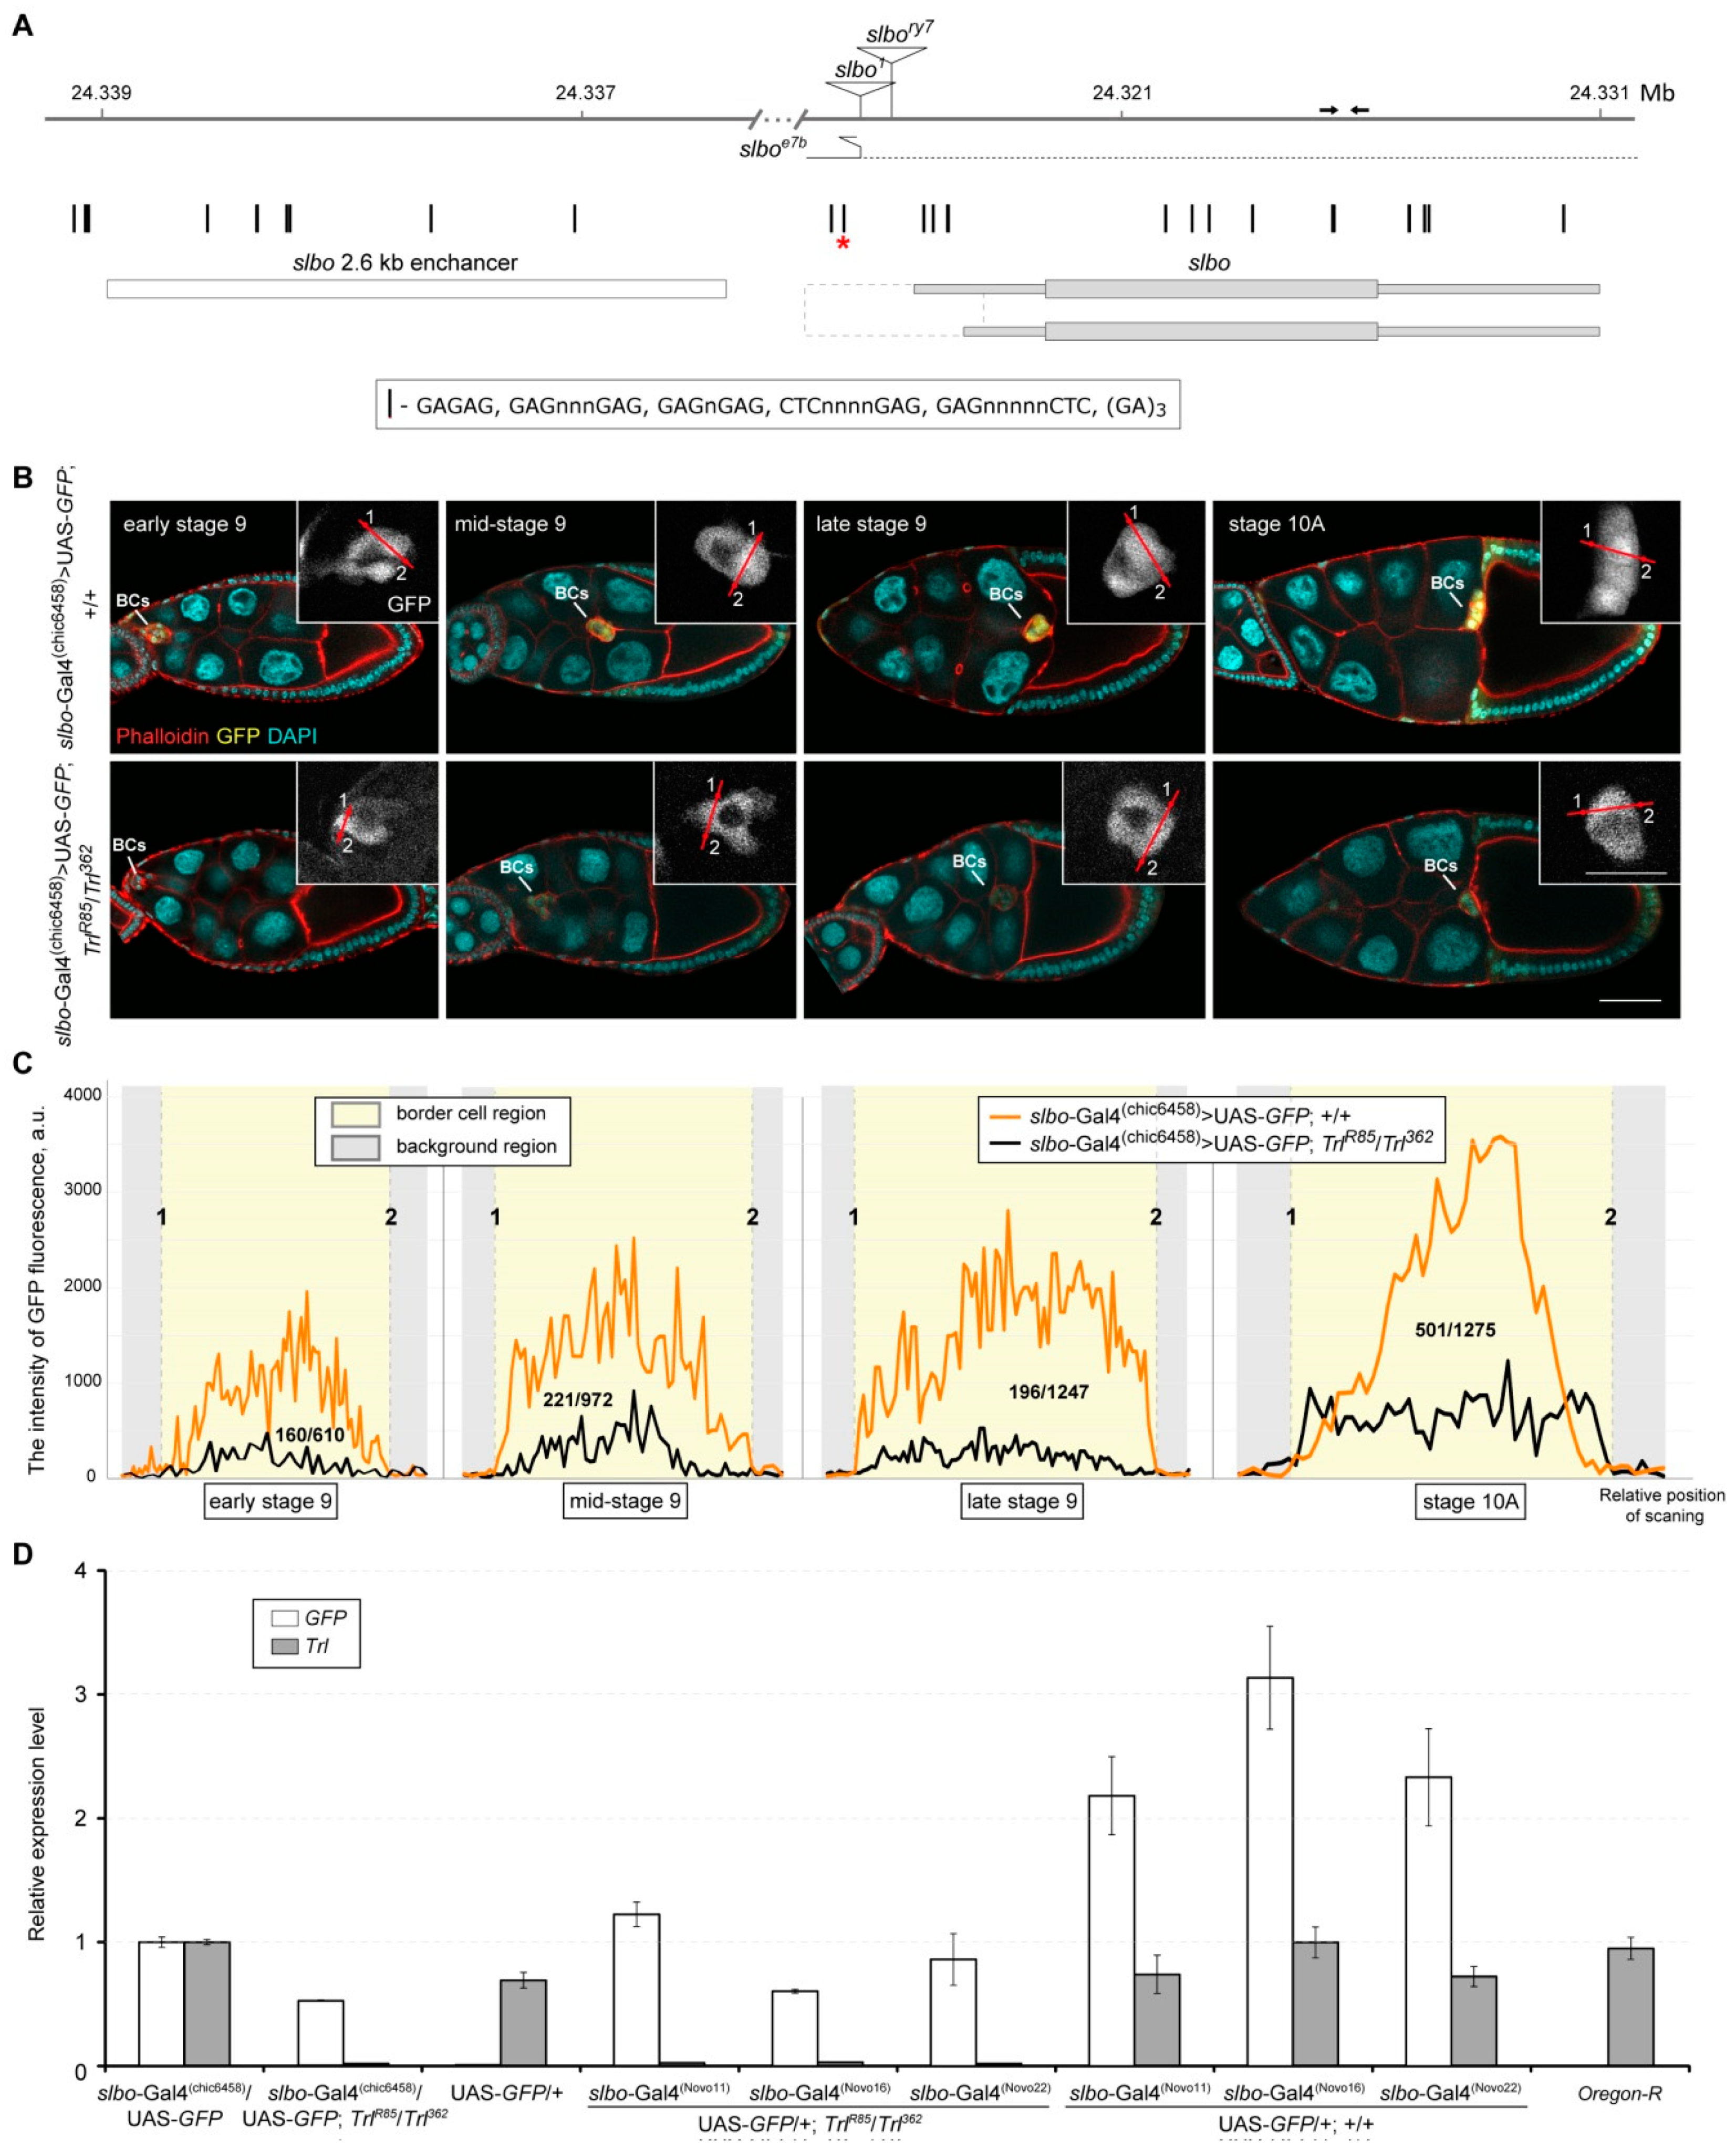
2.5. Transcriptional Activity of the slbo-Gal4 Drivers Depends on the GAGA Protein Level

As GAGA is a sequence-specific transcription factor, the most straightforward mechanism of its involvement in the regulation of the slbo gene expression would be the direct protein binding to its recognition site(s) within the target gene regulatory elements followed by local chromatin remodeling [35]. Therefore, we searched for the potential GAGA binding sites (the GAGAG, GAGnnnGAG, GAGnGAG, CTCnnnGAG, GAGnnnnnCTC and (GA)3 motifs [43]) within the slbo gene locus. Several GAGA motifs were found within the slbo promoter region as well as within the previously described 2.6-kb enhancer element (Figure 3A), which is present in slbo-Gal4 drivers chic6458, Novo11, Novo16 and Novo22 [29,30]. Due to availability of the drivers, we decided to check whether their functioning depends on the amount of the GAGA protein. To this end, we first compared the intensities of the slbo-Gal4-driven GFP signals within BC clusters of stages 9 and 10 egg chambers in the wild-type and TrlR85/Trl362 mutant backgrounds (Figure 3B,C). This analysis demonstrated that, on average, the GFP fluorescence intensity was about 4.4 times lower in Trl mutants than in the control. In addition, results of RT-qPCR revealed that the GFP expression driven by different slbo-Gal4 drivers was reduced from 1.8- to 5.2-fold in Trl mutant background (Figure 3D). Thus, we concluded that GAGA appears to regulate the transcriptional activity of the slbo-Gal4 drivers containing the 2.6-kb enhancer element.

2.6. Increase in the slbo Expression Level in Trl Mutants Enhances BC Migration Defects

Since slbo seems to be a target gene for GAGA, we wondered whether slbo overexpression can rescue BC migration defects observed in Trl mutants. To check this, we overexpressed exogenous copy of the slbo coding sequence (UAS-slbo) in BCs using the slbo-Gal4(Novo16) driver. In a wild-type background, this led to about 10.5-fold increase in slbo mRNA level and resulted only in a minimal disruption of the collective cell migration process (Figure 4), which is principally consistent with earlier observations [25]. In Trl362/TrlR85 mutants, slbo-Gal4(Novo16)-driven slbo overexpression increased the expression level of the gene only about 2.0-fold (Figure 4A). Surprisingly, this was accompanied by stronger defects of BC migration than in Trl362/TrlR85 mutants alone (Figure 4B). The same effect was observed when slbo-Gal4(Novo22) driver was used (Figure 4B). Taken together, these results suggest that the decrease in the slbo expression in Trl mutants is not the only reason for the observed defects in BC migration. Most likely, there are some other GAGA target genes, which expression levels are crucial for the studied process.

2.7. Trl Expression Does Not Depend on Slbo

Considering strong genetic interaction between slbo and Trl genes and the fact that Slbo is also a sequence-specific transcription factor [9,26], we asked whether the Trl gene could be a target of Slbo. To answer this question, we measured the Trl gene expression in slbo mutant ovaries by two different approaches. First, RT-qPCR measurements showed that the Trl expression was not substantially affected in slbo1/slbo1 and slbo1/slboe7b mutant ovaries (Figure 2E). However, this result is not very informative since the slbo gene is known to be active only in a minor fraction of Drosophila ovarian cells [29,30]. Second, we immunostained slbo1/slboe7b egg chambers, in which slbo expression is decreased by 2.2-fold (Figure 2E), with anti-GAGA antibodies to estimate the amount of this protein. This assay also did not detect any obvious change in the amount of the GAGA protein in BCs and in other cell types of slbo1/slboe7b mutants at stage 9 (Figure 5A) or at stage 10 (Figure 5B) compared to the appropriate controls (Figure 2A–D).

3. Discussion

Collective cell migration plays significant roles in normal development and tumorigenesis [44,45,46,47]. Therefore, thorough understanding of regulation of this process is very important. In this study, we found that along with reduced female fecundity due to egg chamber apoptosis prior to oocyte maturation [32], Trl mutants also demonstrate strong defects in BC migration. Particularly, different Trl allele combinations lead to defects in 35–49% of stage 10 egg chambers. The presence of additional P element insertions in the chromosomes carrying Trl362 and Trl3609 mutations, which were revealed in this study, most likely does not substantially influence the BC migration process due to the following two reasons. First, the rescue experiments with the hsp83:GAGA-519 transgene clearly show that it is the lowered amount of GAGA that is responsible for BC migration defects observed in Trl mutants. Second, shep and cpo affected by the additional transposon insertions have not been so far identified as BC- or ovary-specific genes. However, the additional molecular features of the Trl362- and Trl3609-bearing chromosomes should be taken into account in experiments on cells/tissues expressing these genes, such as neurons and/or glial cells in the central nervous system (CNS) [48,49,50,51].
Considering the importance of Slbo [9] as one of the main regulators of BC migration, it was interesting to assess whether Slbo and GAGA may have a functional relationship during this process. Indeed, the decrease in GAGA level in BCs results in substantial decrease in slbo activity, but not vice versa. At the same time, overexpression of GAGA has no effect on slbo mRNA level indicating that GAGA regulates slbo expression only positively. A strong genetic interaction between Trl and slbo mutants, along with the presence of putative GAGA binding sites within the slbo promoter and enhancer sequences, suggests the direct regulation of this gene by GAGA. The reduction in the slbo-Gal4-driven GFP expression within BC clusters in Trl mutant background supports this idea. It is worth noting that no putative GAGA binding sites were found within the minimal hsp70 promoter element present in the slbo-Gal4 construct. The inability of slbo overexpression to compensate defects in BC migration caused by Trl mutations indicates that there are other GAGA target genes contributing to this process. Alternatively, Slbo could require GAGA and/or some other co-factor(s), which are downregulated in Trl mutants, to properly activate transcription of its target genes. Taken together, the results of this study define GAGA as another important regulator of BC migration in Drosophila oogenesis.

4. Materials and Methods

4.1. Fly Stocks

Flies were maintained on standard fly food and crossed at 25 °C except for the RNAi experiments that were performed at 29 °C according to [52]. The following lines from the Bloomington Drosophila Stock Center (BDSC; Bloomington, IN, USA; https://bdsc.indiana.edu) were used: #6458 (w*; P{w+mC = Gal4-slbo.2.6}1206 P{w+mC = UAS-GFP.S65T}Myo31DFT2) as the source of the slbo-Gal4-chic6458 driver [29,30] (here referred to as slbo-Gal4(chic6458)); #76363 (w*; P{w+mC = Gal4-slbo.2.6}16, P{y+t7.7 w+mC = 10 × UAS-IVS-mCD8::GFP}attP40) as the source of the slbo-Gal4(Novo16), UAS-GFP transgene combination [30]; #32186 (w*; P{y+t7.7 w+mC = 10 × UAS-IVS-mCD8::GFP}attP40) as the source of the UAS-GFP reporter construct; #58473 (w1; Trl13C/TM6B, Sb1 Tb1) as the source of the Trl13C mutation [34]; #64190 (y1 w*; P{w+mC = lacW}Trl362/TM3, Sb1, Ser1, y+) as the source of the Trl362 mutation [31]; #10740 (P{ry+t7.2 = ry11}slbory7 cn1/CyO; ry506) as the source of the slbory7 mutation [9]; #12227 (P{ry+t7.2 = PZ}slbo01310 cn1/CyO; ry506) as the source of the slbo1 mutation, which is also known as slbo-LacZ [9]; #58686 (slboe7b/CyO; ry506) as the source of the slboe7b deletion covering the entire slbo coding region [26]; #41582 (y1v1; P{y+t7.7 v+t1.8 = TRiP.GL00699}attP2) as the source of the RNAi construct against the Trl gene; #24650 (w1118; P{w+mC = UAS-Dcr-2.D}2) as the source of the UAS-Dicer2 transgene; #24482 (y1 M{vas-int.Dm}ZH-2A w*; M{3xP3-RFP.attP’}ZH-51C) as the source of the PhiC31 integrase and the attP landing site 51C [53]; #25211 (Oregon-R-modENCODE) as the wild-type (“Oregon-R”) control. Fly strains with TrlR85 and TrlEP3609 (here referred to as Trl3609) mutations [34,54], the hsp83: GAGA-519 transgene [42], the slbo-Gal4(Novo11) and slbo-Gal4(Novo22) drivers [30] as well as yw (the “wild-type” control) and yw; KrIf-1/CyO; TM6, Tb/Sb stocks were taken from our laboratory collection.

4.2. Identification and Verification of P Element Transgene Insertion Sites

Genomic DNA was isolated from 50 flies according to the protocol described previously [55]. Determination of copy number of P element end sequences, mapping and verification of P element-based transgene insertion sites were performed according to [30] with the following modifications. Only primers specific for P element 5′ end and the reference Vps36 gene were used for quantitative real-time PCR. Templates for inverse PCR were prepared using MspI (SibEnzyme, Novosibirsk, Russia) and Kzo9I (SibEnzyme) restriction enzymes. Sequences of primers used to verify P element insertion sites by PCR are listed in Table S1.

4.3. Generation of UAS-slbo Transgenic Flies

To make pUASTattB-slbo construct for ectopic expression of the Slbo protein, we first PCR-amplified the full-length slbo coding sequence with primers 5ʹ-AAAGAATTCCAAAATGCTGAACATGGAGTCGC-3ʹ and 5ʹ-AAATCTAGACTACAGCGAGTGTTCGTTGG-3ʹ using genomic DNA isolated from yw flies as a template. Next, the amplified DNA fragment was cloned into the pUASTattB plasmid vector [53] by using the unique EcoRI and XbaI sites (underlined in the primer sequences). The pUASTattB-slbo construct was verified by Sanger sequencing that revealed several synonymous nucleotide substitutions within the slbo coding sequence. The plasmid was injected at the concentration of 250 ng/µl into embryos of the BDSC line #24482 as described in [56].

4.4. Immunofluorescent Staining

Dissected ovaries were mounted on glass slides in mounting medium (50% glycerol, 0.82 mM KH2PO4, 2.6 mM NaH2PO4, 75 mM NaCl). Immunostainings were performed as described previously [57]. The primary antibodies were mouse anti-Fasciclin III (anti-Fas III; 5 µg/mL; #7G10; Developmental Studies Hybridoma Bank (DSHB), Iowa City, IA, USA), mouse anti-beta-galactosidase (anti-β-gal; 5 µg/mL; #40-1a; DSHB) and rabbit anti-GAGA (1:500; kindly provided by Prof. Vincenzo Pirrotta). The secondary antibodies were goat anti-mouse conjugated to Alexa Fluor 488 (1:500; #A-11001; Invitrogen, Carlsbad, CA, USA), goat anti-mouse Alexa Fluor 568 (1:500; #A-11031; Invitrogen) and goat anti-rabbit Alexa Fluor 488 (1:500; #A-11034; Invitrogen). TRITC-labeled phalloidin (1:100; #P1951; Sigma-Aldrich, Saint Louis, MO, USA) was used to visualize F-actin as described previously [58]. DAPI was used at 0.4 µg/mL to stain nuclei. Samples were imaged using an Axio Observer Z1 (Carl Zeiss, Oberkochen, Germany) and confocal microscope LSM 710 (Carl Zeiss). Optical sections were combined using the LSM Image Browser version 4.2 software (Carl Zeiss).

4.5. Quantitative Measurement of GFP Signal Intensity

The GFP signals were detected using confocal microscope LSM 710 (Carl Zeiss). Fluorescence intensity quantification was performed for individual confocal images acquired at the same settings using the ZEN 2012 software v 8.1. Experiments were performed in three biological replicates for each genotype and stage of egg chamber development.

4.6. Detection of BCs and Quantitative Analysis of Their Migration

BCs were identified either by the slbo-Gal4-driven GFP expression or by immunostaining with anti-Fas III antibodies (that reveal polar but not outer BCs [6]) or by X-gal (5-bromo-4-chloro-3-indolyl-β-D-galactopyranoside; #A1007.0001; BioChemica, AppliChem, Germany) staining of slbo1 (slbo-LacZ) mutants. The latter procedure was performed as follows. Drosophila ovaries were dissected in 1×PBS (1.7 mM KH2PO4, 5.2 mM Na2HPO4, 150 mM NaCl; pH 7.4) and then fixed in 0.75% glutaraldehyde (#G5882; Merck, Darmstadt, Germany) in 100 mM sodium cacodylate buffer (pH 7.0) (#A2140; PanReac AppliChem, Chicago, IL, USA) for 20 min at room temperature. Next, the ovaries were incubated in a staining solution (10 mM sodium phosphate (pH 7.2), 3.1 mM K4[Fe(CN)6], 3.1 mM K3[Fe(CN)6], 150 mM NaCl, 1.0 mM MgCl2, 0.2% X-gal, 0.3% Triton X-100) for 1 h at 37 °C. The migration and completion indexes characterizing BC migration process were calculated as described previously [30].

4.7. Total RNA Extraction, cDNA Synthesis and Quantitative Real-Time PCR

For each genotype, three replicates of 50 ovaries from 1–2-day-old flies were dissected in 1×PBS, preserved in 100 µL of RNAlater solution (#AM7020; Thermo Fisher Scientific, Waltham, MA, USA) and stored at 4 °C. Subsequent isolation of total RNA, reverse transcription and quantitative PCR (RT-qPCR) were carried out as reported previously [30] with primer pairs specific for A. vinelandii GFP coding sequence and Drosophila slbo, Trl, RpL32 and Rap2l genes (for primer sequences, see Table 1). The latter two genes were used as reference genes. The mean Cq values obtained from independent biological replicates are reported in Table S2.

Supplementary Materials

Supplementary materials can be found at https://www.mdpi.com/1422-0067/21/20/7468/s1. Figure S1. Molecular characterization of chromosomes carrying Trl362 and Trl3609 mutations. Table S1. Primers used for PCR verification of the Trl mutations and additional transposon constructs identified within the alan shepard (shep) and couch potato (cpo) genes. Table S2. RT-qPCR data: mean Cq values obtained and expression values calculated from independent biological replicates.

Author Contributions

Conceived and designed the experiments: A.A.O., E.M.B., A.V.P.; performed experiments: A.A.O., L.A.Y., E.V.F., N.V.D., S.I.B.; analyzed the data: A.A.O., L.A.Y., A.V.P.; wrote the paper: A.A.O., A.V.P. All authors have read and agreed to the final version of the manuscript.

Funding

Funding for this work was provided by the Russian Science Foundation grant no. 16-14-10288 and by the ICG SB RAS budget project no. 0324-2019-0042 (in part of the confocal microscopy analysis).

Acknowledgments

We thank Vincenzo Pirrotta for anti-GAGA antibodies. DNA sequencing and qPCR analysis were performed using resources provided by the Molecular and Cellular Biology core facility of the Institute of Molecular and Cellular Biology SB RAS. Confocal microscopy was performed at the core facility of the Institute of Cytology and Genetics SB.

Conflicts of Interest

The authors declare no conflict of interest.

References

  1. Rørth, P. Initiating and Guiding Migration: Lessons from Border Cells. Trends Cell Biol. 2002, 12, 325–331. [Google Scholar] [CrossRef]
  2. Montell, D.J. Border-Cell Migration: The Race Is on. Nat. Rev. Mol. Cell Biol. 2003, 4, 13–24. [Google Scholar] [CrossRef] [PubMed]
  3. Rørth, P. Collective Cell Migration. Annu. Rev. Cell Dev. Biol. 2009, 25, 407–429. [Google Scholar] [CrossRef] [PubMed] [Green Version]
  4. Montell, D.J.; Yoon, W.H.; Starz-Gaiano, M. Group Choreography: Mechanisms Orchestrating the Collective Movement of Border Cells. Nat. Rev. Mol. Cell Biol. 2012, 13, 631–645. [Google Scholar] [CrossRef] [Green Version]
  5. Spradling, A.C. Germline Cysts: Communes That Work. Cell 1993, 72, 649–651. [Google Scholar] [CrossRef]
  6. Ruohola, H.; Bremer, K.A.; Baker, D.; Swedlow, J.R.; Jan, L.Y.; Jan, Y.N. Role of Neurogenic Genes in Establishment of Follicle Cell Fate and Oocyte Polarity during Oogenesis in Drosophila. Cell 1991, 66, 433–449. [Google Scholar] [CrossRef]
  7. Margolis, J.; Spradling, A. Identification and Behavior of Epithelial Stem Cells in the Drosophila Ovary. Development 1995, 121, 3797–3807. [Google Scholar]
  8. Tworoger, M.; Larkin, M.K.; Bryant, Z.; Ruohola-Baker, H. Mosaic Analysis in the Drosophila Ovary Reveals a Common Hedgehog-Inducible Precursor Stage for Stalk and Polar Cells. Genetics 1999, 151, 739–748. [Google Scholar]
  9. Montell, D.J.; Rorth, P.; Spradling, A.C. Slow Border Cells, a Locus Required for a Developmentally Regulated Cell Migration during Oogenesis, Encodes Drosophila C/EBP. Cell 1992, 71, 51–62. [Google Scholar] [CrossRef]
  10. Saadin, A.; Starz-Gaiano, M. Circuitous Genetic Regulation Governs a Straightforward Cell Migration. Trends Genet. 2016, 32, 660–673. [Google Scholar] [CrossRef]
  11. Silver, D.L.; Montell, D.J. Paracrine Signaling through the JAK/STAT Pathway Activates Invasive Behavior of Ovarian Epithelial Cells in Drosophila. Cell 2001, 107, 831–841. [Google Scholar] [CrossRef] [Green Version]
  12. Ghiglione, C.; Devergne, O.; Georgenthum, E.; Carballès, F.; Médioni, C.; Cerezo, D.; Noselli, S. The Drosophila Cytokine Receptor Domeless Controls Border Cell Migration and Epithelial Polarization during Oogenesis. Development 2002, 129, 5437–5447. [Google Scholar] [CrossRef] [PubMed] [Green Version]
  13. Beccari, S.; Teixeira, L.; Rørth, P. The JAK/STAT Pathway Is Required for Border Cell Migration during Drosophila Oogenesis. Mech. Dev. 2002, 111, 115–123. [Google Scholar] [CrossRef]
  14. Xi, R.; McGregor, J.R.; Harrison, D.A. A Gradient of JAK Pathway Activity Patterns the Anterior-Posterior Axis of the Follicular Epithelium. Dev. Cell 2003, 4, 167–177. [Google Scholar] [CrossRef] [Green Version]
  15. Wang, L.; Sexton, T.R.; Venard, C.; Giedt, M.; Guo, Q.; Chen, Q.; Harrison, D.A. Pleiotropy of the Drosophila JAK Pathway Cytokine Unpaired 3 in Development and Aging. Dev. Biol. 2014, 395, 218–231. [Google Scholar] [CrossRef] [PubMed]
  16. Arbouzova, N.I.; Zeidler, M.P. JAK/STAT Signalling in Drosophila: Insights into Conserved Regulatory and Cellular Functions. Development 2006, 133, 2605–2616. [Google Scholar] [CrossRef] [Green Version]
  17. Amoyel, M.; Anderson, A.M.; Bach, E.A. JAK/STAT Pathway Dysregulation in Tumors: A Drosophila Perspective. Semin. Cell Dev. Biol. 2014, 28, 96–103. [Google Scholar] [CrossRef] [Green Version]
  18. Silver, D.L.; Geisbrecht, E.R.; Montell, D.J. Requirement for JAK/STAT Signaling Throughout Border Cell Migration in Drosophila. Development 2005, 132, 3483–3492. [Google Scholar] [CrossRef] [Green Version]
  19. Borghese, L.; Fletcher, G.; Mathieu, J.; Atzberger, A.; Eades, W.C.; Cagan, R.L.; Rørth, P. Systematic Analysis of the Transcriptional Switch Inducing Migration of Border Cells. Dev. Cell 2006, 10, 497–508. [Google Scholar] [CrossRef] [Green Version]
  20. Wang, X.; Bo, J.; Bridges, T.; Dugan, K.D.; Pan, T.-C.; Chodosh, L.A.; Montell, D.J. Analysis of Cell Migration Using Whole-Genome Expression Profiling of Migratory Cells in the Drosophila Ovary. Dev. Cell 2006, 10, 483–495. [Google Scholar] [CrossRef] [Green Version]
  21. Starz-Gaiano, M.; Melani, M.; Wang, X.; Meinhardt, H.; Montell, D.J. Feedback Inhibition of JAK/STAT Signaling by Apontic Is Required to Limit an Invasive Cell Population. Dev. Cell 2008, 14, 726–738. [Google Scholar] [CrossRef] [PubMed] [Green Version]
  22. González-Reyes, A.; St Johnston, D. Patterning of the Follicle Cell Epithelium along the Anterior-Posterior Axis during Drosophila Oogenesis. Development 1998, 125, 2837–2846. [Google Scholar] [PubMed]
  23. Levine, B.; Jean-Francois, M.; Bernardi, F.; Gargiulo, G.; Dobens, L. Notch Signaling Links Interactions Between the C/EBP Homolog Slow Border Cells and the GILZ Homolog Bunched During Cell Migration. Dev. Biol. 2007, 305, 217–231. [Google Scholar] [CrossRef] [PubMed] [Green Version]
  24. Gunawan, F.; Arandjelovic, M.; Godt, D. The Maf Factor Traffic Jam Both Enables and Inhibits Collective Cell Migration in Drosophila Oogenesis. Development 2013, 140, 2808–2817. [Google Scholar] [CrossRef] [Green Version]
  25. Rørth, P.; Szabo, K.; Texido, G. The Level of C/EBP Protein Is Critical for Cell Migration During Drosophila Oogenesis and Is Tightly Controlled by Regulated Degradation. Mol. Cell 2000, 6, 23–30. [Google Scholar] [CrossRef]
  26. Rørth, P.; Montell, D.J. Drosophila C/EBP: A Tissue-Specific DNA-Binding Protein Required for Embryonic Development. Genes Dev. 1992, 6, 2299–2311. [Google Scholar] [CrossRef]
  27. Levine, B.; Hackney, J.F.; Bergen, A.; Dobens III, L.; Truesdale, A.; Dobens, L. Opposing Interactions Between Drosophila Cut and the C/EBP Encoded by Slow Border Cells Direct Apical Constriction and Epithelial Invagination. Dev. Biol. 2010, 344, 196–209. [Google Scholar] [CrossRef] [Green Version]
  28. Melani, M.; Simpson, K.J.; Brugge, J.S.; Montell, D.J. Regulation of Cell Adhesion and Collective Cell Migration by Hindsight and Its Human Homolog RREB1. Curr. Biol. 2008, 18, 532–537. [Google Scholar] [CrossRef] [Green Version]
  29. Rørth, P.; Szabo, K.; Bailey, A.; Laverty, T.; Rehm, J.; Rubin, G.M.; Weigmann, K.; Milán, M.; Benes, V.; Ansorge, W.; et al. Systematic Gain-of-Function Genetics in Drosophila. Development 1998, 125, 1049–1057. [Google Scholar]
  30. Ogienko, A.A.; Yarinich, L.A.; Fedorova, E.V.; Lebedev, M.O.; Andreyeva, E.N.; Pindyurin, A.V.; Baricheva, E.M. New Slbo-Gal4 Driver Lines for the Analysis of Border Cell Migration during Drosophila Oogenesis. Chromosoma 2018, 127, 475–487. [Google Scholar] [CrossRef]
  31. Ogienko, A.A.; Karagodin, D.A.; Fedorova, S.A.; Fedorova, E.V.; Lashina, V.V.; Baricheva, E.M. Analysis of a Novel Hypomorphic Mutation in Trithorax-Like Gene Affecting Drosophila Melanogaster Oogenesis. Russ. J. Dev. Biol. 2006, 37, 173–181. [Google Scholar] [CrossRef]
  32. Ogienko, A.A.; Karagodin, D.A.; Pavlova, N.V.; Fedorova, S.A.; Voloshina, M.V.; Baricheva, E.M. Molecular and Genetic Description of a New Hypomorphic Mutation of Trithorax-Like Gene and Analysis of Its Effect on Drosophila Melanogaster Oogenesis. Russ. J. Dev. Biol. 2008, 39, 108–115. [Google Scholar] [CrossRef]
  33. Fedorova, E.V.; Dorogova, N.V.; Bolobolova, E.U.; Fedorova, S.A.; Karagodin, D.A.; Ogienko, A.A.; Khruscheva, A.S.; Baricheva, E.M. GAGA Protein Is Required for Multiple Aspects of Drosophila Oogenesis and Female Fertility. Genesis 2018, 57, e23269. [Google Scholar] [CrossRef] [PubMed]
  34. Farkas, G.; Gausz, J.; Galloni, M.; Reuter, G.; Gyurkovics, H.; Karch, F. The Trithorax-Like Gene Encodes the Drosophila GAGA Factor. Nature 1994, 371, 806–808. [Google Scholar] [CrossRef]
  35. Granok, H.; Leibovitch, B.A.; Shaffer, C.D.; Elgin, S.C.R. Chromatin: Ga-Ga over GAGA Factor. Curr. Biol. 1995, 5, 238–241. [Google Scholar] [CrossRef] [Green Version]
  36. Berger, N.; Dubreucq, B. Evolution Goes GAGA: GAGA Binding Proteins across Kingdoms. Biochim. et Biophys. Acta (BBA)—Gene Regul. Mech. 2012, 1819, 863–868. [Google Scholar] [CrossRef]
  37. Tsukiyama, T.; Becker, P.B.; Wu, C. ATP-Dependent Nucleosome Disruption at a Heat-Shock Promoter Mediated by Binding of GAGA Transcription Factor. Nature 1994, 367, 525–532. [Google Scholar] [CrossRef] [Green Version]
  38. Wilkins, R.C.; Lis, J.T. DNA Distortion and Multimerization: Novel Functions of the Glutamine-Rich Domain of GAGA Factor. J. Mol. Biol. 1999, 285, 515–525. [Google Scholar] [CrossRef]
  39. Bhat, K.M.; Farkas, G.; Karch, F.; Gyurkovics, H.; Gausz, J.; Schedl, P. The GAGA Factor Is Required in the Early Drosophila Embryo Not Only for Transcriptional Regulation But Also for Nuclear Division. Development 1996, 122, 1113–1124. [Google Scholar]
  40. Hoskins, R.A.; Carlson, J.W.; Wan, K.H.; Park, S.; Mendez, I.; Galle, S.E.; Booth, B.W.; Pfeiffer, B.D.; George, R.A.; Svirskas, R.; et al. The Release 6 Reference Sequence of the Drosophila Melanogaster genome. Genome Res. 2015, 25, 445–458. [Google Scholar] [CrossRef] [Green Version]
  41. Assaker, G.; Ramel, D.; Wculek, S.K.; González-Gaitán, M.; Emery, G. Spatial Restriction of Receptor Tyrosine Kinase Activity through a Polarized Endocytic Cycle Controls Border Cell Migration. Proc. Natl. Acad. Sci. USA 2010, 107, 22558–22563. [Google Scholar] [CrossRef] [PubMed] [Green Version]
  42. Greenberg, A.J.; Schedl, P. GAGA Factor Isoforms Have Distinct But Overlapping Functions In Vivo. Mol. Cell. Biol. 2001, 21, 8565–8574. [Google Scholar] [CrossRef] [PubMed] [Green Version]
  43. Omelina, E.S.; Baricheva, E.M.; Oshchepkov, D.Y.; Merkulova, T.I. Analysis and Recognition of the GAGA Transcription Factor Binding Sites in Drosophila Genes. Comput. Biol. Chem. 2011, 35, 363–370. [Google Scholar] [CrossRef] [PubMed]
  44. Kraemer, R. Regulation of Cell Migration in Atherosclerosis. Curr. Atheroscler. Rep. 2000, 2, 445–452. [Google Scholar] [CrossRef]
  45. Mehlen, P.; Puisieux, A. Metastasis: A Question of Life or Death. Nat. Rev. Cancer 2006, 6, 449–458. [Google Scholar] [CrossRef]
  46. Friedl, P.; Gilmour, D. Collective Cell Migration in Morphogenesis, Regeneration and Cancer. Nat. Rev. Mol. Cell Biol. 2009, 10, 445–457. [Google Scholar] [CrossRef]
  47. Friedl, P.; Locker, J.; Sahai, E.; Segall, J.E. Classifying Collective Cancer Cell Invasion. Nat. Cell Biol. 2012, 14, 777–783. [Google Scholar] [CrossRef]
  48. Chen, D.; Dale, R.K.; Lei, E.P. Shep Regulates Drosophila neuronal Remodeling by Controlling Transcription of Its Chromatin Targets. Development 2018, 145, dev154047. [Google Scholar] [CrossRef] [Green Version]
  49. Matzat, L.H.; Dale, R.K.; Moshkovich, N.; Lei, E.P. Tissue-Specific Regulation of Chromatin Insulator Function. PLoS Genet. 2012, 8, e1003069. [Google Scholar] [CrossRef] [Green Version]
  50. Bellen, H.J.; Kooyer, S.; D’Evelyn, D.; Pearlman, J. The Drosophila Couch Potato Protein Is Expressed in Nuclei of Peripheral Neuronal Precursors and Shows Homology to RNA-Binding Proteins. Genes Dev. 1992, 6, 2125–2136. [Google Scholar] [CrossRef] [Green Version]
  51. Bellen, H.J.; Vaessin, H.; Bier, E.; Kolodkin, A.; D’Evelyn, D.; Kooyer, S.; Jan, Y.N. The Drosophila Couch Potato Gene: An Essential Gene Required for Normal Adult Behavior. Genetics 1992, 131, 365–375. [Google Scholar] [PubMed]
  52. Luo, J.; Zuo, J.; Wu, J.; Wan, P.; Kang, D.; Xiang, C.; Zhu, H.; Chen, J. In Vivo RNAi Screen Identifies Candidate Signaling Genes Required for Collective Cell Migration in Drosophila Ovary. Sci. China Life Sci. 2015, 58, 379–389. [Google Scholar] [CrossRef] [PubMed] [Green Version]
  53. Bischof, J.; Maeda, R.K.; Hediger, M.; Karch, F.; Basler, K. An Optimized Transgenesis System for Drosophila Using Germ-Line-Specific phiC31 Integrases. Proc. Natl. Acad. Sci. USA 2007, 104, 3312–3317. [Google Scholar] [CrossRef] [PubMed] [Green Version]
  54. Karagodin, D.A.; Battulina, N.V.; Merkulova, T.I.; Baricheva, E.M. The Reasons of Trithorax-Like Expression Disturbance in Trl (3609) Allele of Drosophila Melanogaster. Dokl. Biochem. Biophys. 2016, 471, 443–446. [Google Scholar] [CrossRef]
  55. Pindyurin, A.V. Genome-Wide Cell Type-Specific Mapping of In Vivo Chromatin Protein Binding Using an FLP-Inducible DamID System in Drosophila. Methods Mol. Biol. 2017, 1654, 99–124. [Google Scholar]
  56. Ringrose, L. Transgenesis in Drosophila Melanogaster. Methods Mol. Biol. 2009, 561, 3–19. [Google Scholar]
  57. Xue, F.; Cooley, L. Kelch Encodes a Component of Intercellular Bridges in Drosophila Egg Chambers. Cell 1993, 72, 681–693. [Google Scholar] [CrossRef]
  58. Guild, G.M.; Connelly, P.S.; Shaw, M.K.; Tilney, L.G. Actin Filament Cables in Drosophila Nurse Cells Are Composed of Modules That Slide Passively Past One Another During Dumping. J. Cell Biol. 1997, 138, 783–797. [Google Scholar] [CrossRef] [Green Version]
  59. Yang, X.; Mao, F.; Lv, X.; Zhang, Z.; Fu, L.; Lu, Y.; Wu, W.; Zhou, Z.; Zhang, L.; Zhao, Y. Drosophila Vps36 Regulates Smo Trafficking in Hedgehog Signaling. J. Cell Sci. 2013, 126, 4230–4238. [Google Scholar] [CrossRef] [Green Version]
Figure 1. Border cell (BC) migration is delayed in Trithorax-like (Trl) mutant egg chambers. (A) Stage 10 egg chambers from Trl mutant and Trl+/+ flies labelled with slbo-Gal4 > UAS-GFP (yellow), Phalloidin (red) and DAPI (cyan). Note that in the shown examples of Trl mutant egg chambers, BCs had not reached the nurse cell–oocyte boundary. Scale bar is 100 µm. (B) Quantification of the BC migration phenotypes in stage 10 egg chambers of the indicated genotypes. The combination of the slbo-Gal4(Novo16) driver [30] with the UAS-GFP reporter construct or immunostaining with anti-Fasciclin III antibody (α-Fas III Ab) was used to mark BCs. UAS-Dicer2 was used to increase efficiency of RNAi. “+” indicates wild-type second or third chromosome(s) depending on the genotype. For quantitation, the nurse cell region of egg chambers was divided into 6 groups according to the percentage of the total distance travelled by BCs: 0% (black), 1–25% (dark red), 26–50% (light green), 51–75% (violet), 76–99% (blue) and 100% (brown) [30]. M.I., C.I. and N denote the migration index, the completion index and the number of egg chambers examined, respectively.
Ijms 21 07468 g001
Figure 2. Downregulation of GAGA decreases the activity of the slow border cells (slbo) gene in migrating BCs. (AD) Colocalization of β-galactosidase driven by the slbo-LacZ reporter (slbo1 enhancer trap mutation) and the GAGA protein in BCs. Anti-GAGA (cyan) and anti-β-galactosidase (red) immunostaining of slbo1/+ (A,B) and slbo1/+; TrlR85/Trl362 (C,D) egg chambers at stages 9 (A,C) and 10 (B,D). Note the reduction in GAGA and β-galactosidase signals in BCs of Trl mutants. The regions of BCs are marked by dotted frames and are enlarged in A′A‴, B′B‴, C′C‴ and D′D‴, in which single cyan (A′, B′, C′ and D′) and red (A″, B″, C″ and D″) channel images, as well as merge images (A‴, B‴, C‴ and D‴), are shown. All egg chambers were imaged at the same settings. Scale bar is 50 µm and 10 µm for A, C, B, D and the enlargements, respectively. (E) Comparison of the slbo and Trl mRNA levels (determined by RT-qPCR) in ovaries of the indicated genotypes. Error bars represent standard error of the mean. GAGA-519 denotes hsp83:GAGA-519. (F) Downregulation of GAGA enhances BC migration defects observed in slbo mutants. “homo” indicates homozygous state. Quantification of the BC migration phenotypes in stage 10 egg chambers of the indicated genotypes. X-gal staining was used to visualize BCs in all samples except the yw control, which was immunostained with anti-Fasciclin III antibody (α-Fas III Ab). For quantitation, the nurse cell region of egg chambers was divided into 6 groups according to the percentage of the total distance travelled by BCs: 0% (black), 1–25% (dark red), 26–50% (light green), 51–75% (violet), 76–99% (blue) and 100% (brown) [30]. M.I., C.I. and N denote the migration index, the completion index and the number of egg chambers examined, respectively.
Ijms 21 07468 g002
Figure 3. slbo-Gal4-driven GFP expression is dependent on GAGA. (A) A schematic map of the slbo locus on chromosome 2R. The gene is shown on the plus strand for convenience; its coding sequence and UTRs are represented by wide and narrow grey bars, respectively. The 2.6-kb enhancer element is depicted as white box. Predicted GAGA binding sites are shown by vertical sticks. Red asterisk marks the site, for which GAGA binding was previously demonstrated in in vitro experiments [43]. Putative promoter region is depicted by dashed rectangle. Localization of P element insertions causing the slbo1 and slbory7 mutations are shown by triangles (not drawn to scale). The position of the slboe7b deletion (in which a fragment of P element is retained) is indicated by the dotted horizontal line. Arrows depict the position of primer pairs used for measurements of mRNA abundance with RT-qPCR. (B) Representative confocal images of egg chambers at four consecutive stages of development (early, mid and late stage 9, and stage 10A) from slbo-Gal4(chic6458) > UAS-GFP and slbo-Gal4(chic6458) > UAS-GFP; Trl362/TrlR85 flies. Mutations in the Trl gene lead to significant decrease in GFP signal in BCs at all analyzed stages. All egg chambers were imaged at the same settings, scale bar is 50 µm. Insets show enlarged overexposed fragments to highlight BC cluster boundaries, scale bar is 25 µm; lines with dots 1 and 2 indicate sections used for the quantification of the GFP signal intensity. (C) The GFP fluorescence intensity profiles obtained for sections through BCs shown in (B). For each developmental stage, the ratio of average intensity of the GFP signal in the Trl mutant to that in the control is shown as a fractional number. (D) Effects of GAGA downregulation on slbo-Gal4-driven GFP expression (measured by RT-qPCR) in ovaries of the indicated genotypes. Error bars represent standard error of the mean. Note that in Trl mutant background, GFP expression was substantially decreased for all tested slbo-Gal4 drivers (chic6458, Novo11, Novo16 and Novo22).
Ijms 21 07468 g003
Figure 4. Overexpression of Slbo does not rescue impaired BC migration in Trl mutants. (A) Comparison of the slbo and Trl mRNA levels (determined by RT-qPCR) in ovaries of the indicated genotypes. The data for the Oregon-R control are the same as in Figure 2E. Error bars represent standard error of the mean. (B) Quantification of the BC migration phenotypes in stage 10 egg chambers of the indicated genotypes. The combination of the slbo-Gal4(Novo16) or slbo-Gal4(Novo22) driver [30] with the UAS-GFP reporter construct was used to mark BCs. For quantitation, the nurse cell region of egg chambers was divided into 6 groups according to the percentage of the total distance travelled by BCs: 0% (black), 1–25% (dark red), 26–50% (light green), 51–75% (violet), 76–99% (blue) and 100% (brown) [30]. M.I., C.I. and N denote the migration index, the completion index and the number of egg chambers examined, respectively.
Ijms 21 07468 g004
Figure 5. Expression of GAGA is not affected in slbo mutant egg chambers. Immunodetection of β-galactosidase (red) driven by the slbo-LacZ reporter (slbo1 enhancer trap mutation) and the GAGA protein (cyan) in slbo1/slboe7b mutant egg chambers at stages 9 (A) and 10 (B). The regions of BCs are marked by dotted frames and are enlarged in A′A‴ and B′B‴, in which single cyan (A′ and B′) and red (A″ and B″) channel images as well as merge images (A‴ and B‴) are shown. Scale bar is 50 µm and 10 µm for A, B, and the enlargements, respectively. As can be seen in (A′) and (B′), the amount of GAGA in slbo mutant BCs is not decreased compared to the adjacent follicular cells (marked with arrowheads).
Ijms 21 07468 g005
Table 1. qPCR primers.
Target GenePrimer Sequence (5′->3′)ReferenceAmplicon Size, bpPrimer Efficiency, %
GFPAGATCATATGAAACGGCATGACT[30]124100.5
ACCTTCAAACTTGACTTCAGCAC
slboGACAAGGGCACGGATGAGTAThis study198100.0
CTGCATGTAGATCTGCTTGTGT
TrlTTTCCCGCCCACAAGATAGTThis study11897.0
CCAGATCGTTCGCATTGACG
RpL32CTAAGCTGTCGCACAAATGG[59]14899.6
AGGAACTTCTTGAATCCGGTG
Rap2lTCTTGGAAATATTGGACACCGC[30]197102.0
TTTGTTCGCGACTAGTAGGATG

