
Neuroprotective Metabolites of Hericium erinaceus Promote Neuro-Healthy Aging


 , , ,
, , ,  and
and
Abstract
:1. Introduction
2. Results
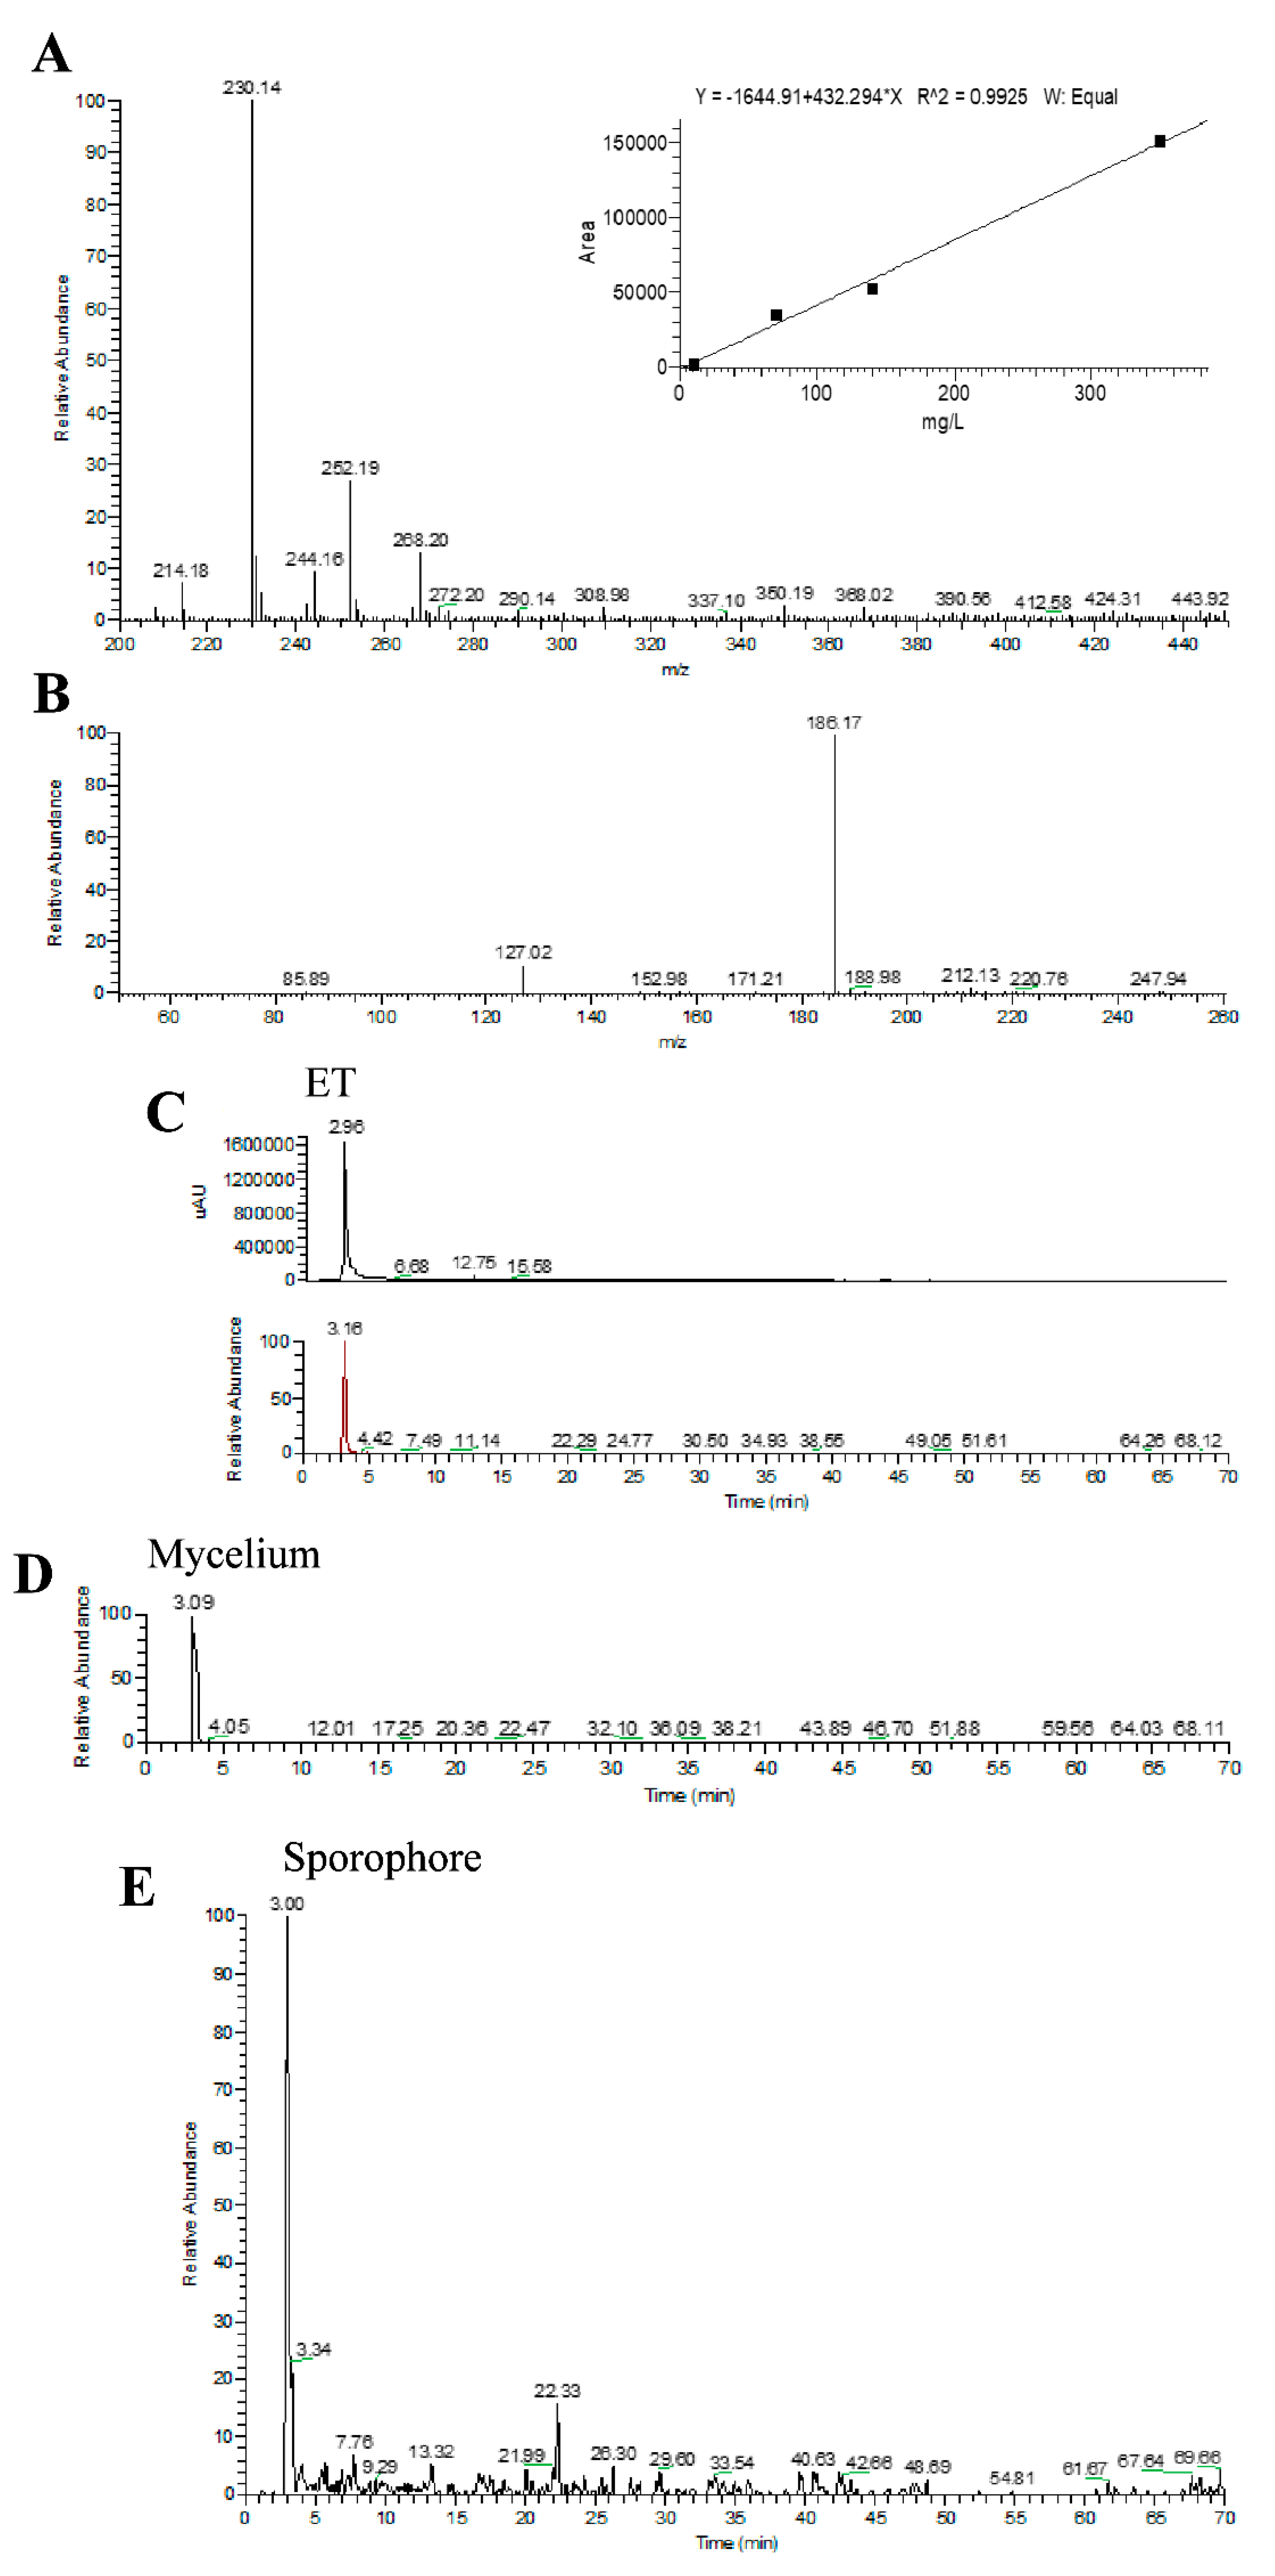
2.1. Array of Metabolites in Hericium erinaceus Extract
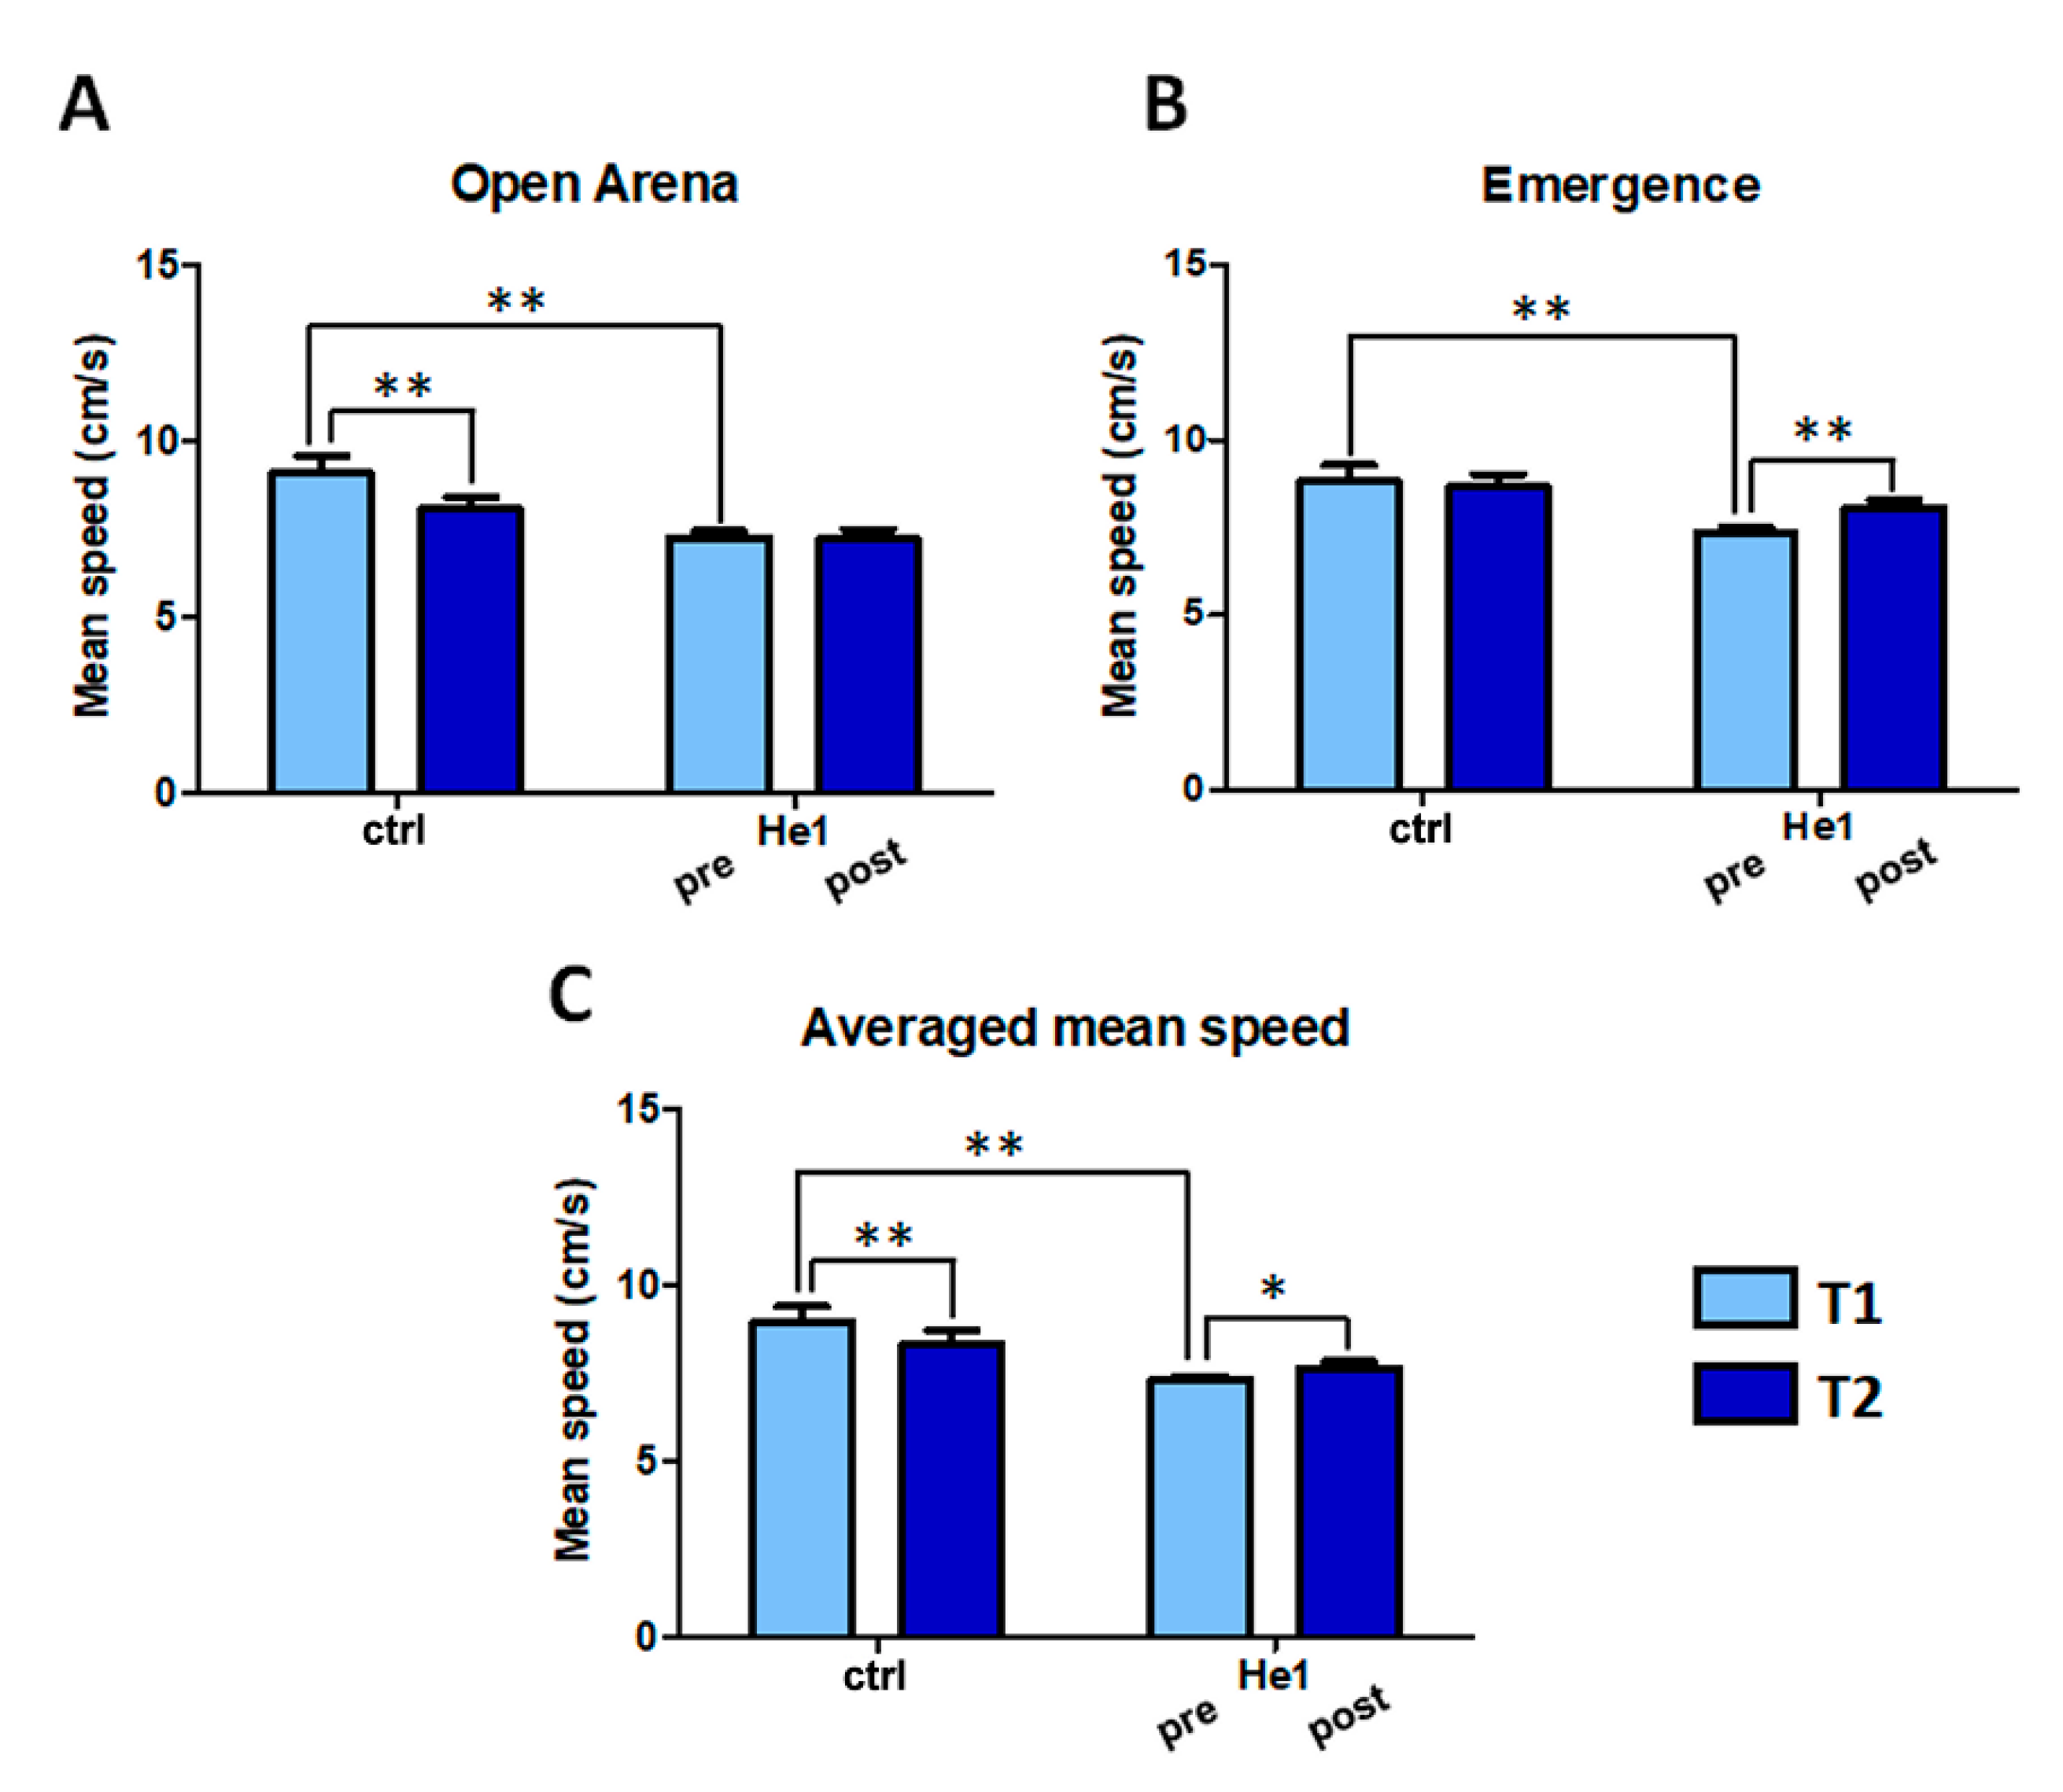
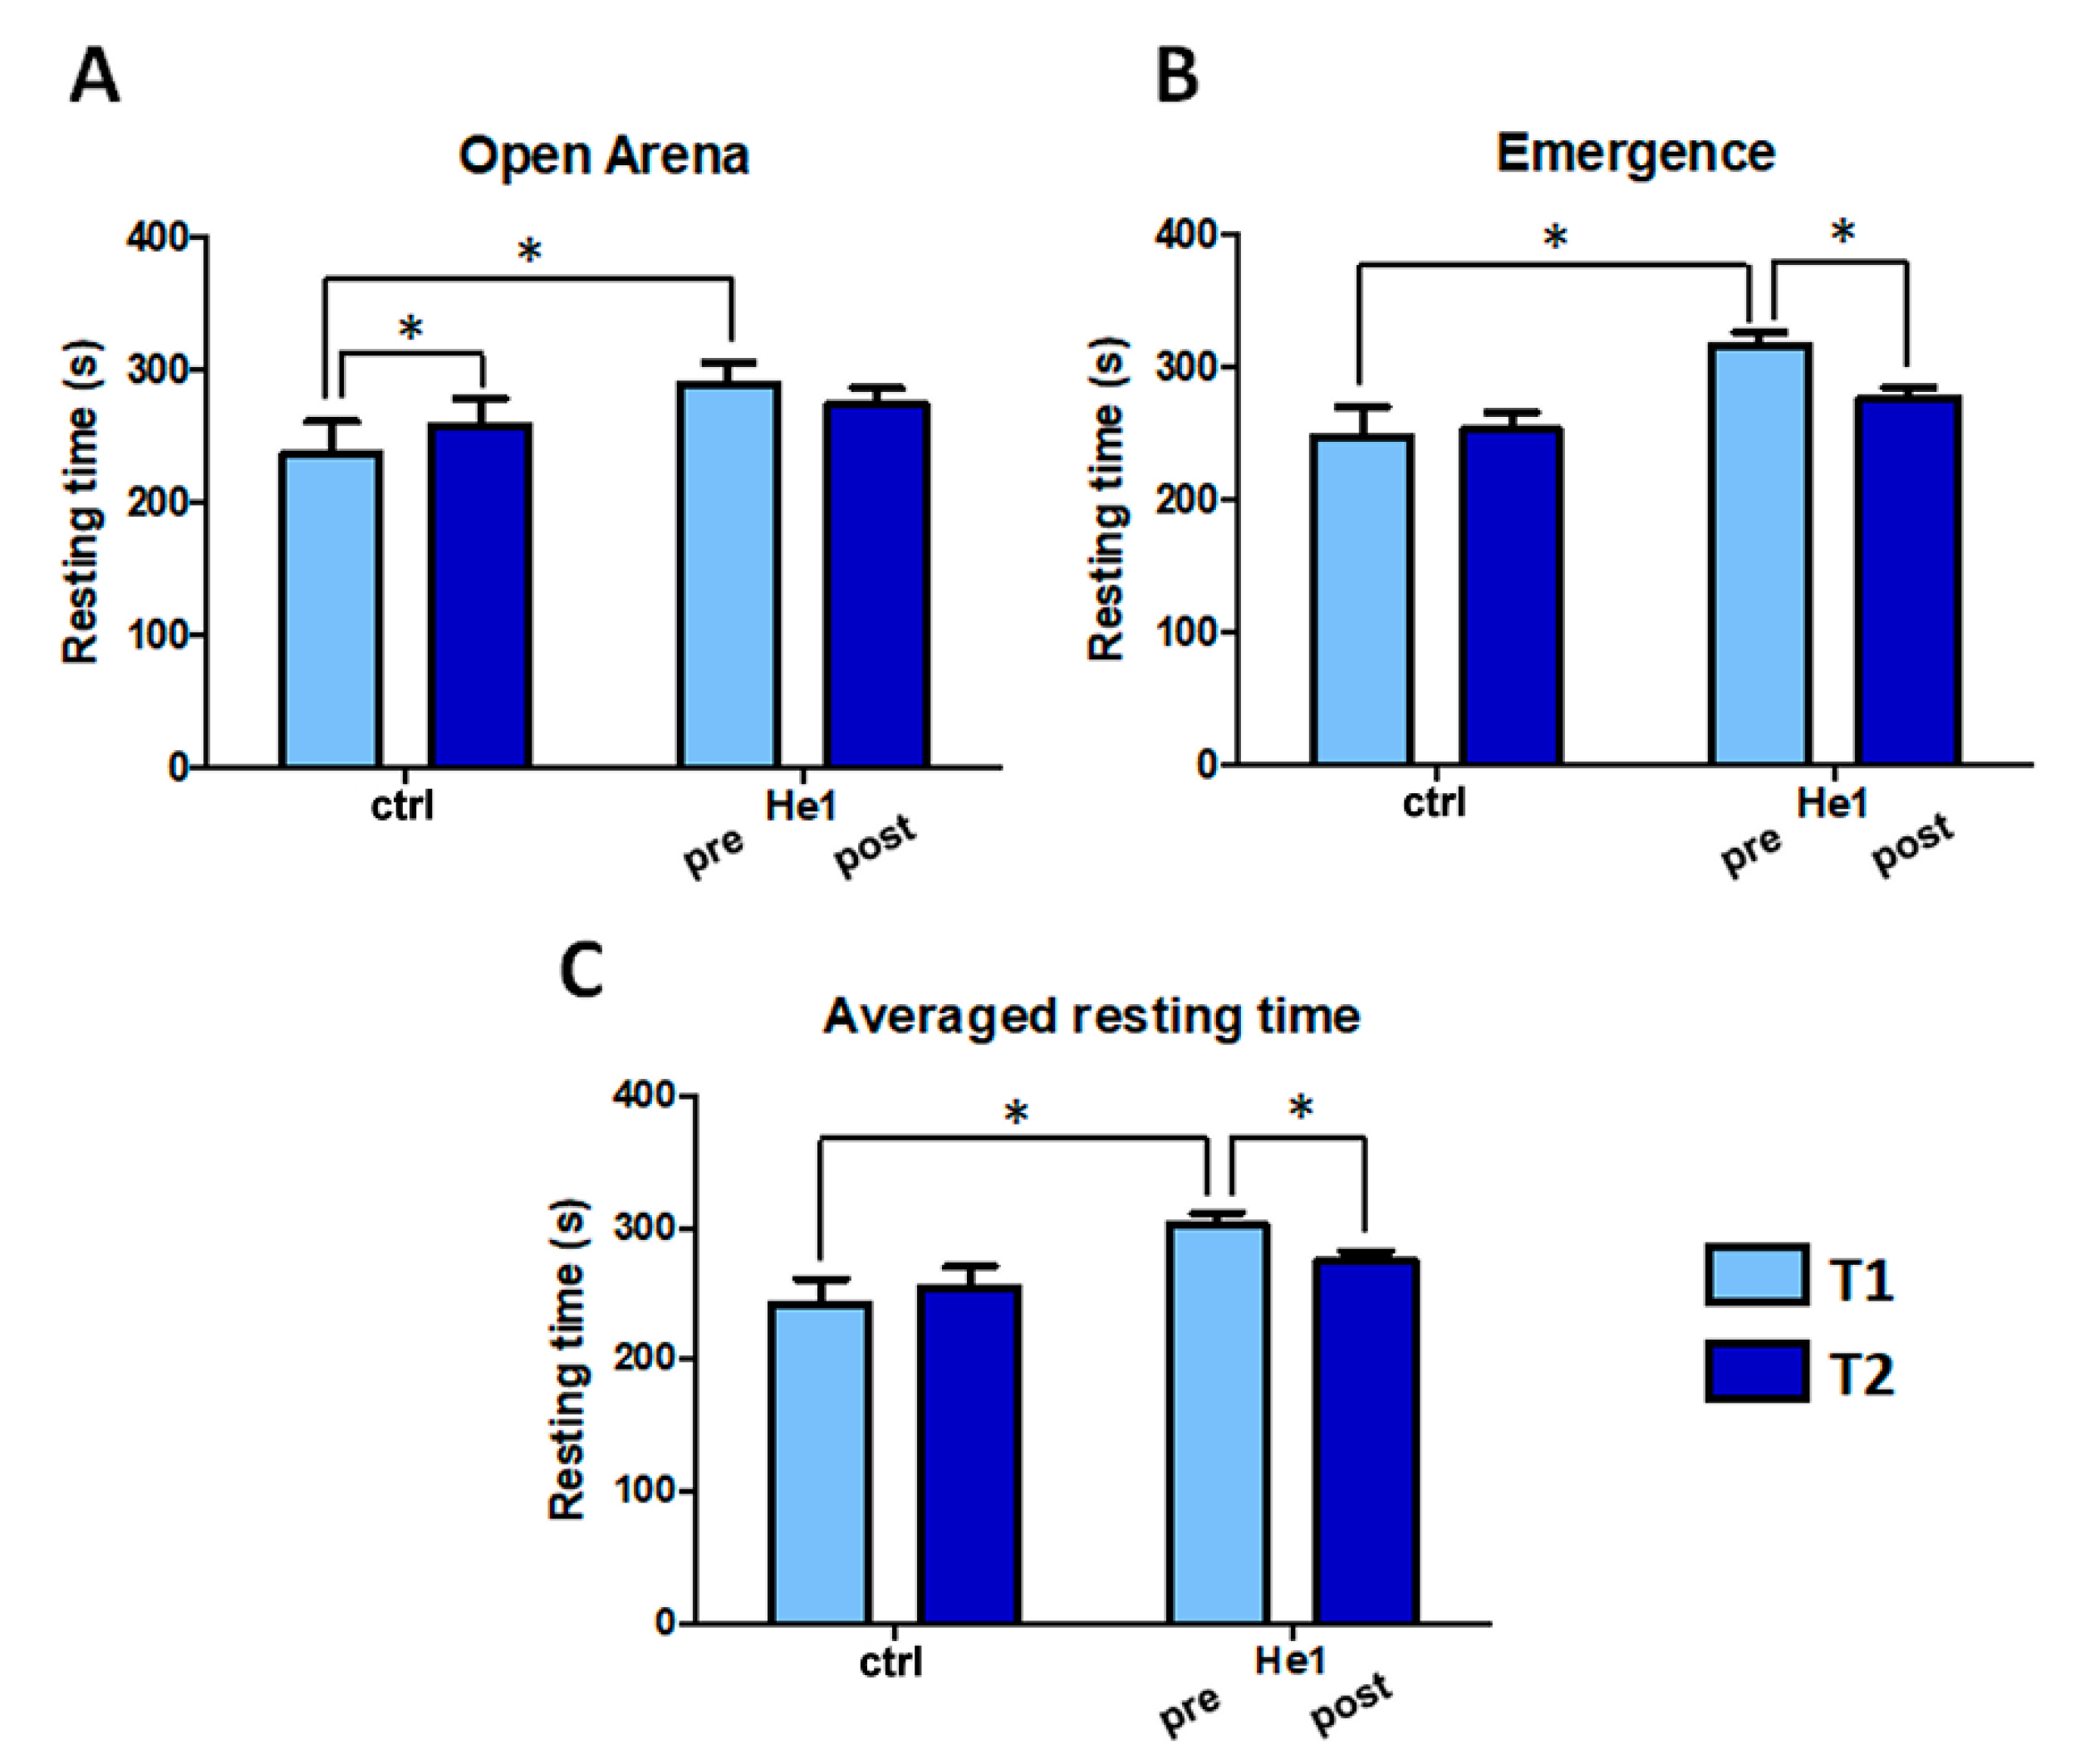
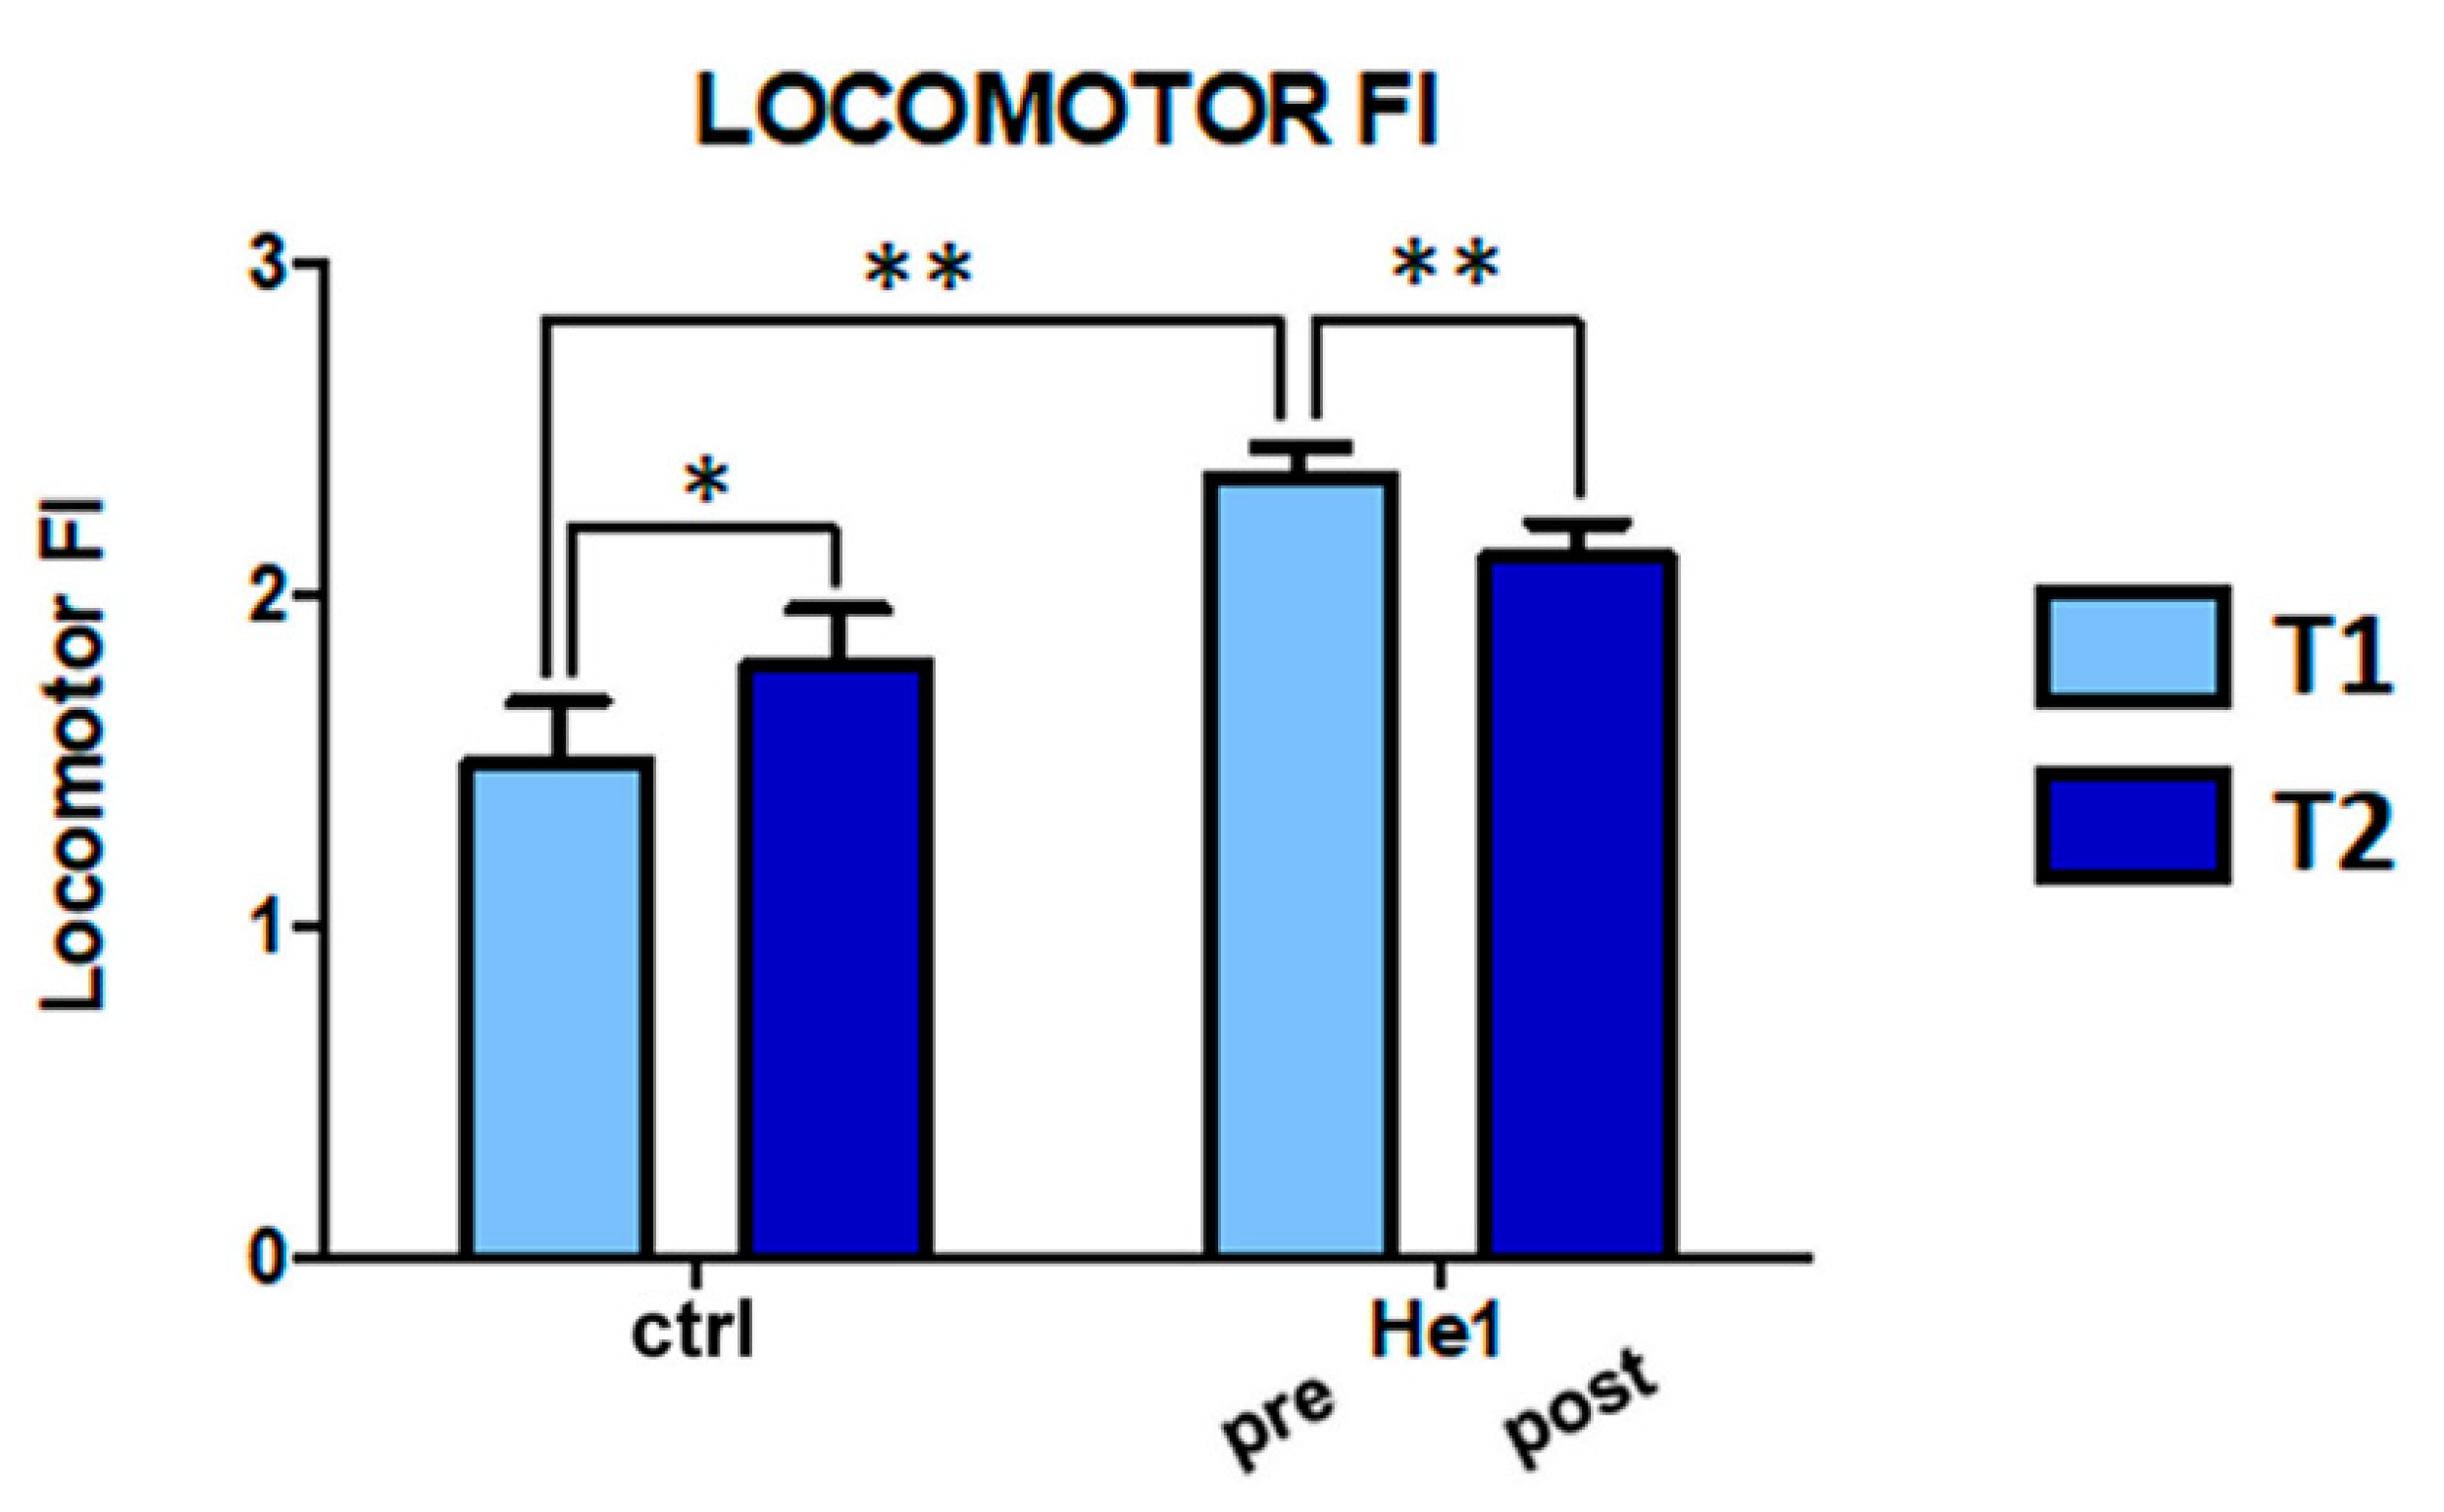
2.2. H. erinaceus Reverted the Locomotor Decline during Senescence in Wild-Type Mice
2.3. H. erinaceus Effect on Cerebellar Cytoarchitecture, Neuroinflammation and Oxidative Stress Pathway
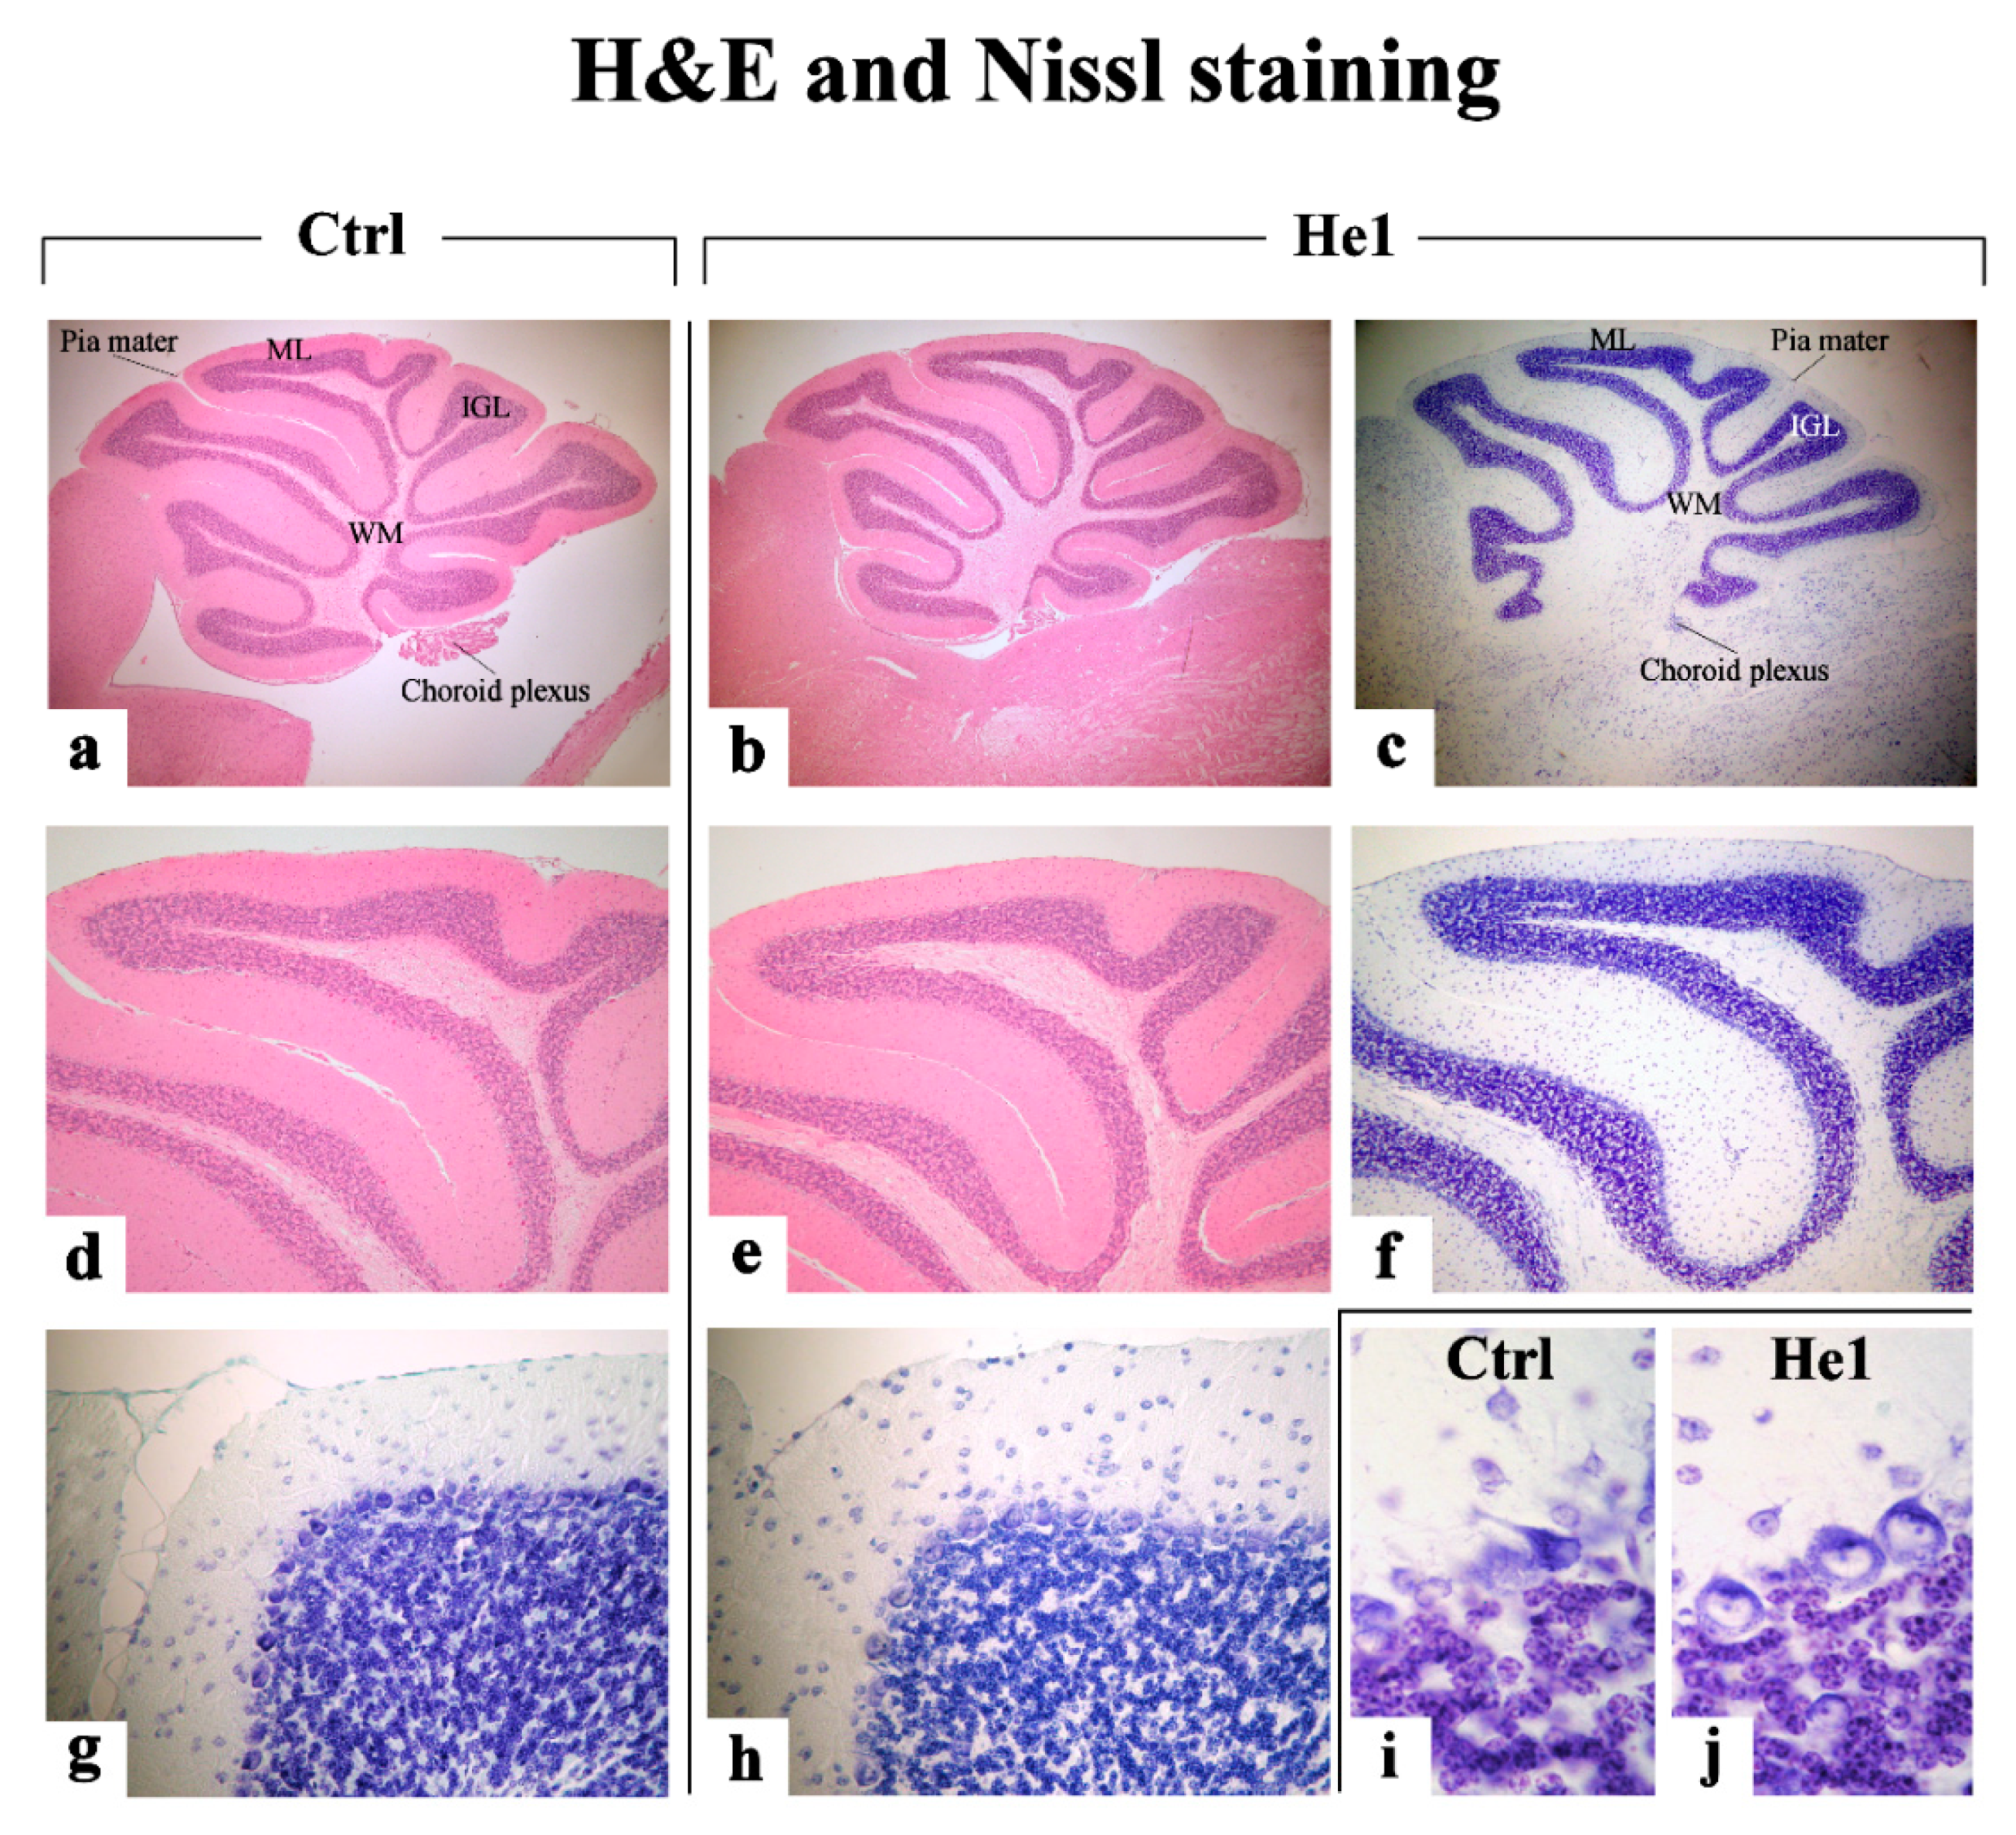
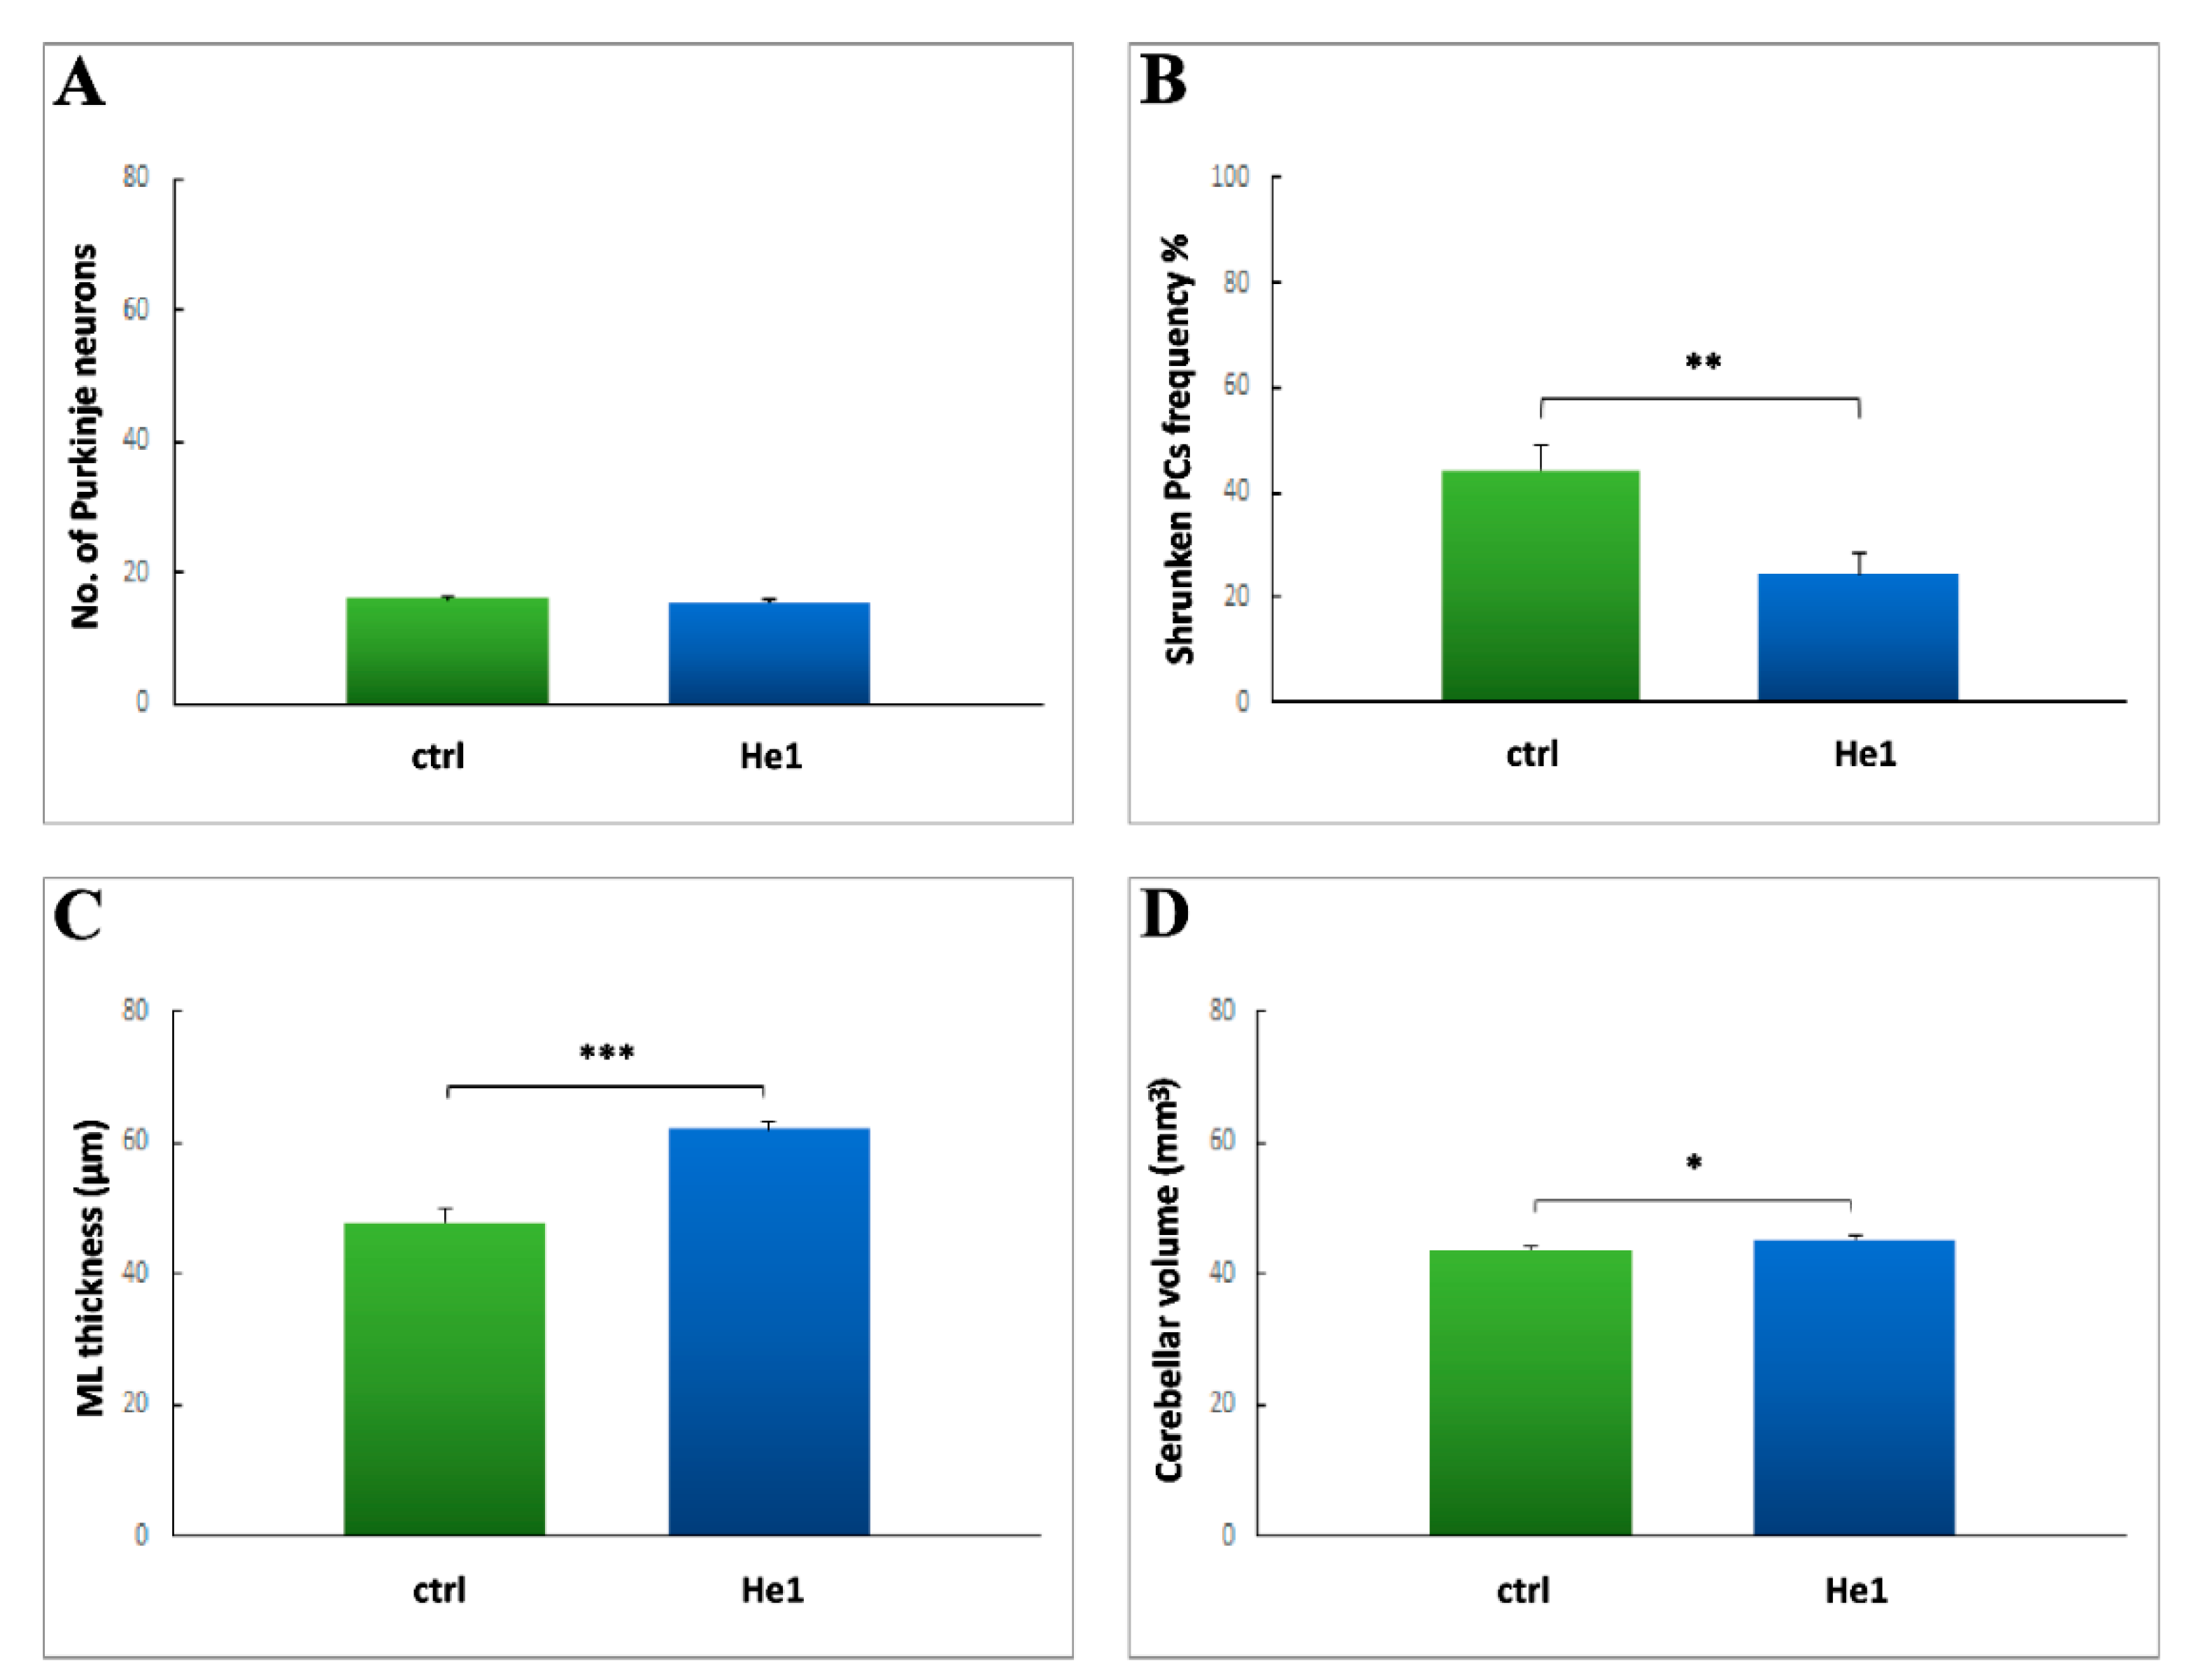
2.3.1. H&E and Nissl Staining
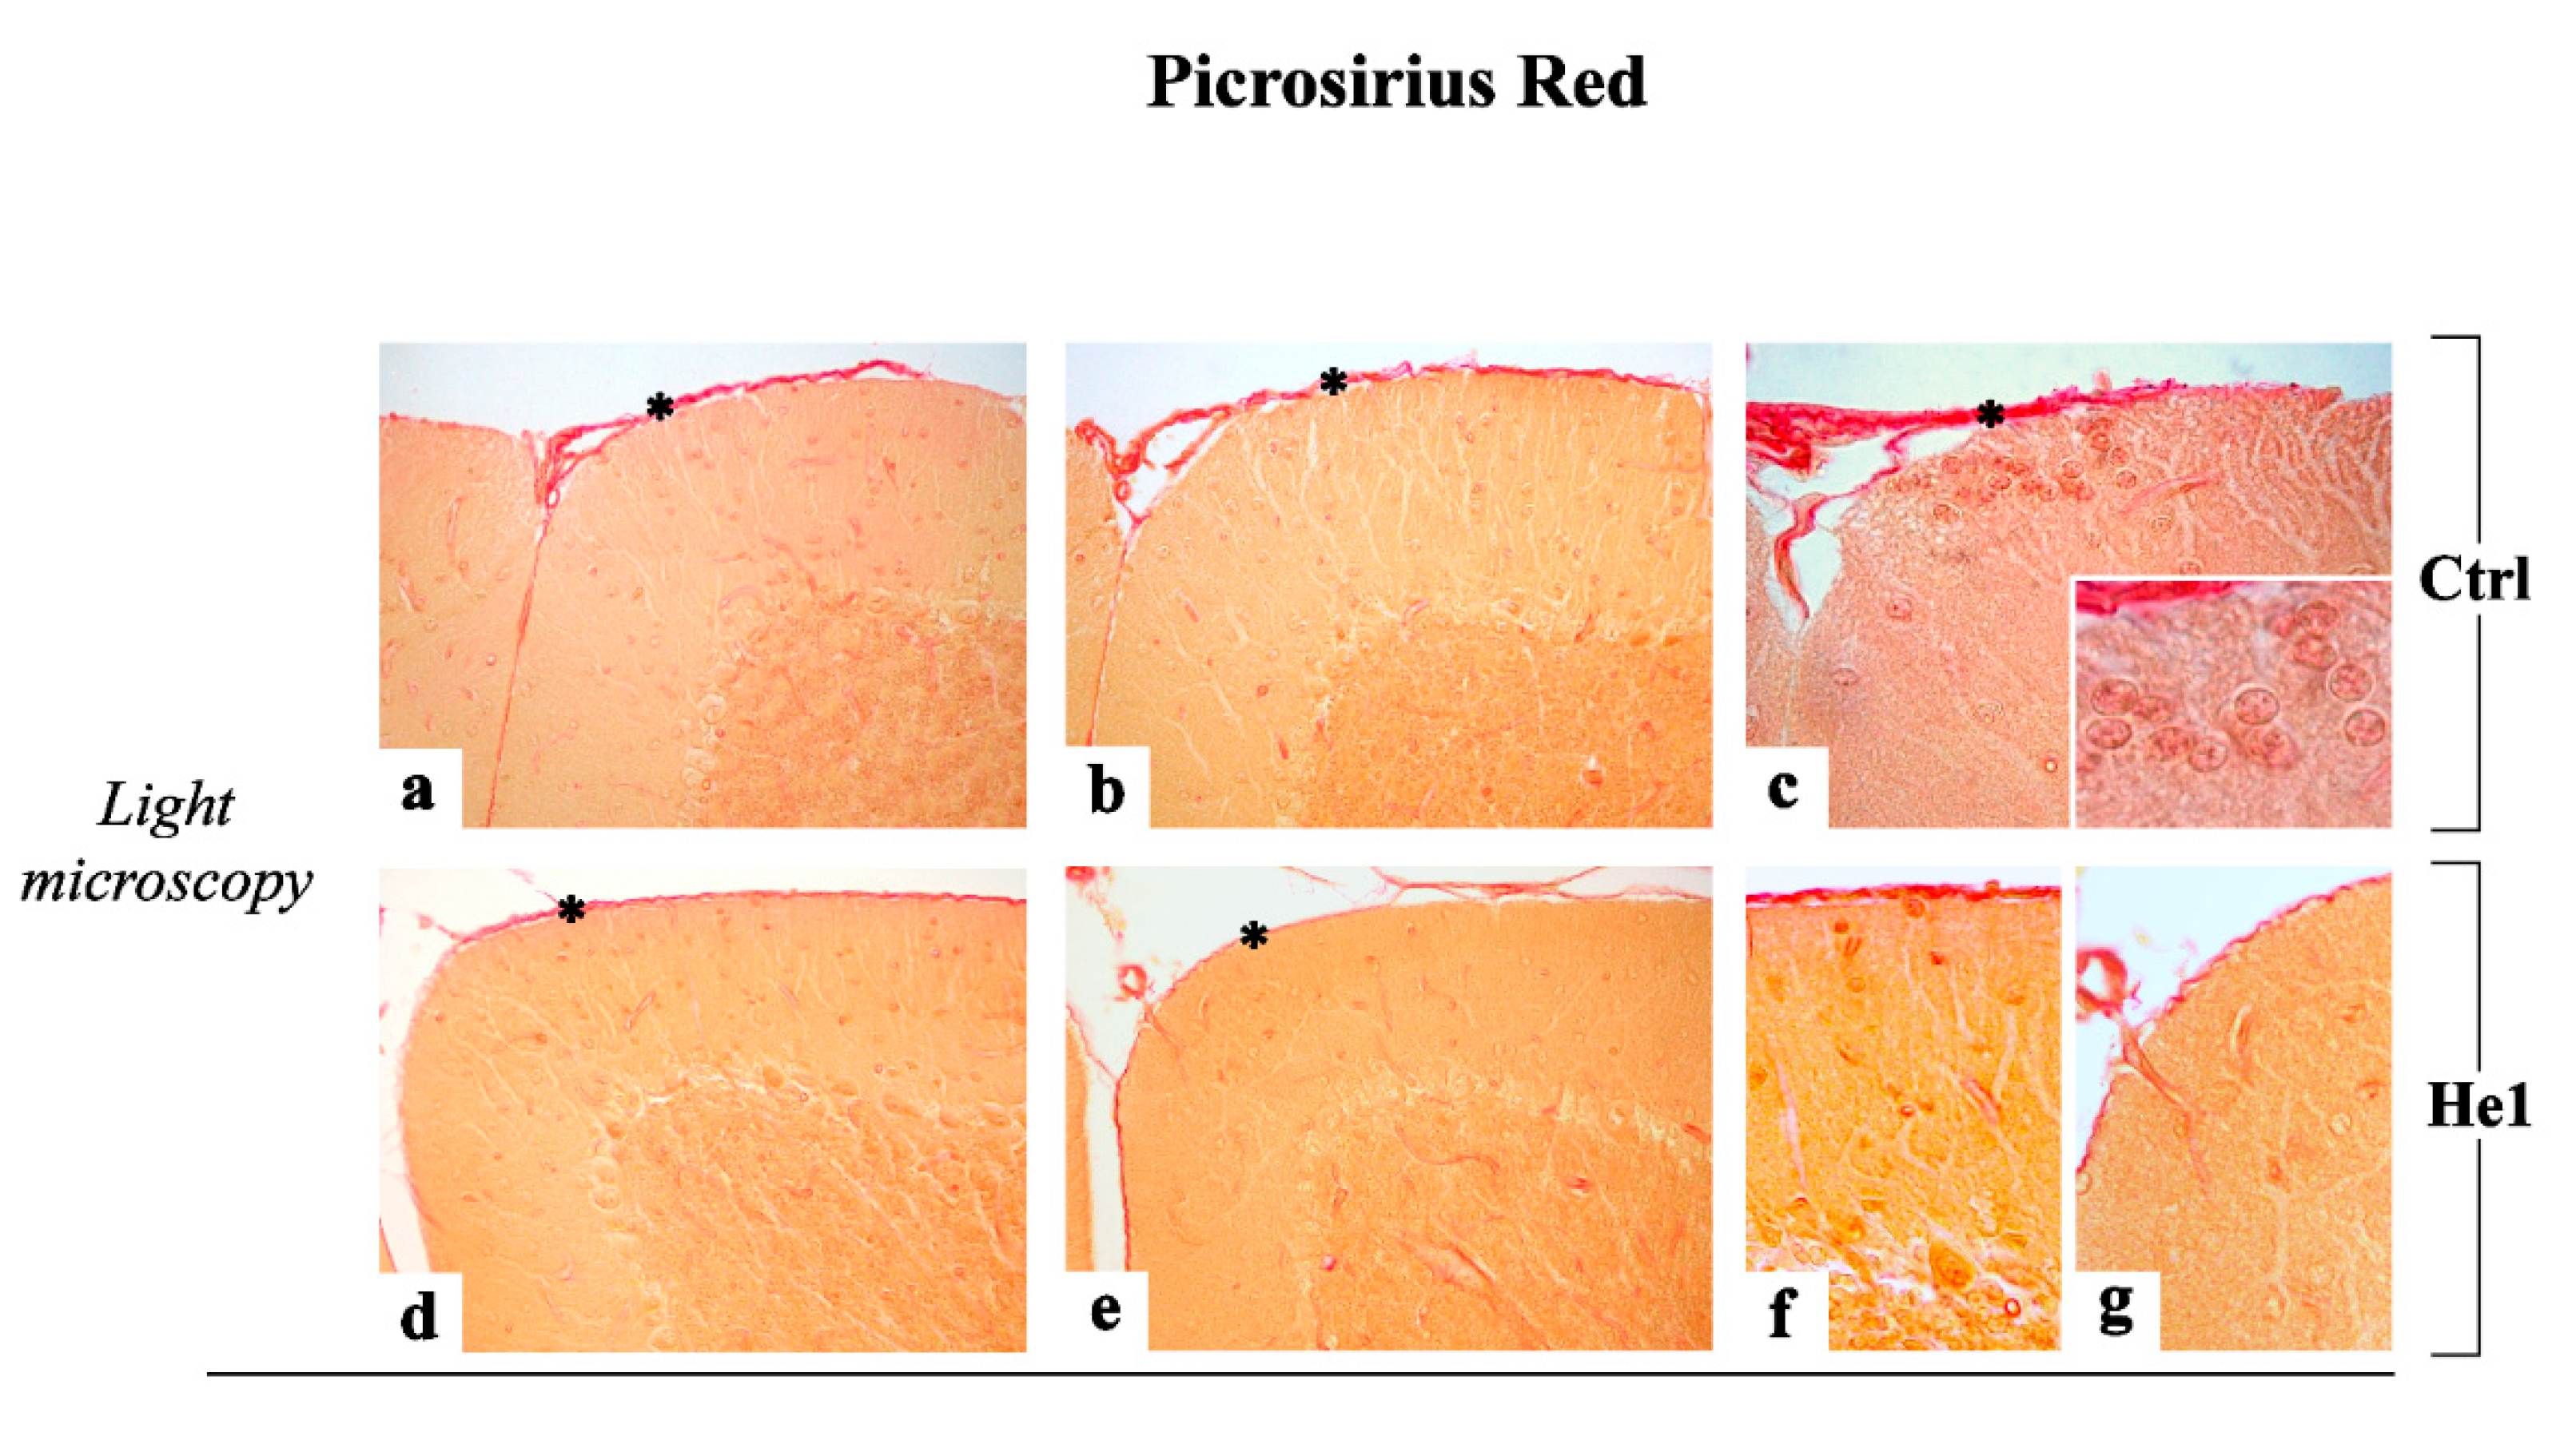
2.3.2. Picrosirius Red Staining: Fibrillar Collagen Networks Evaluation
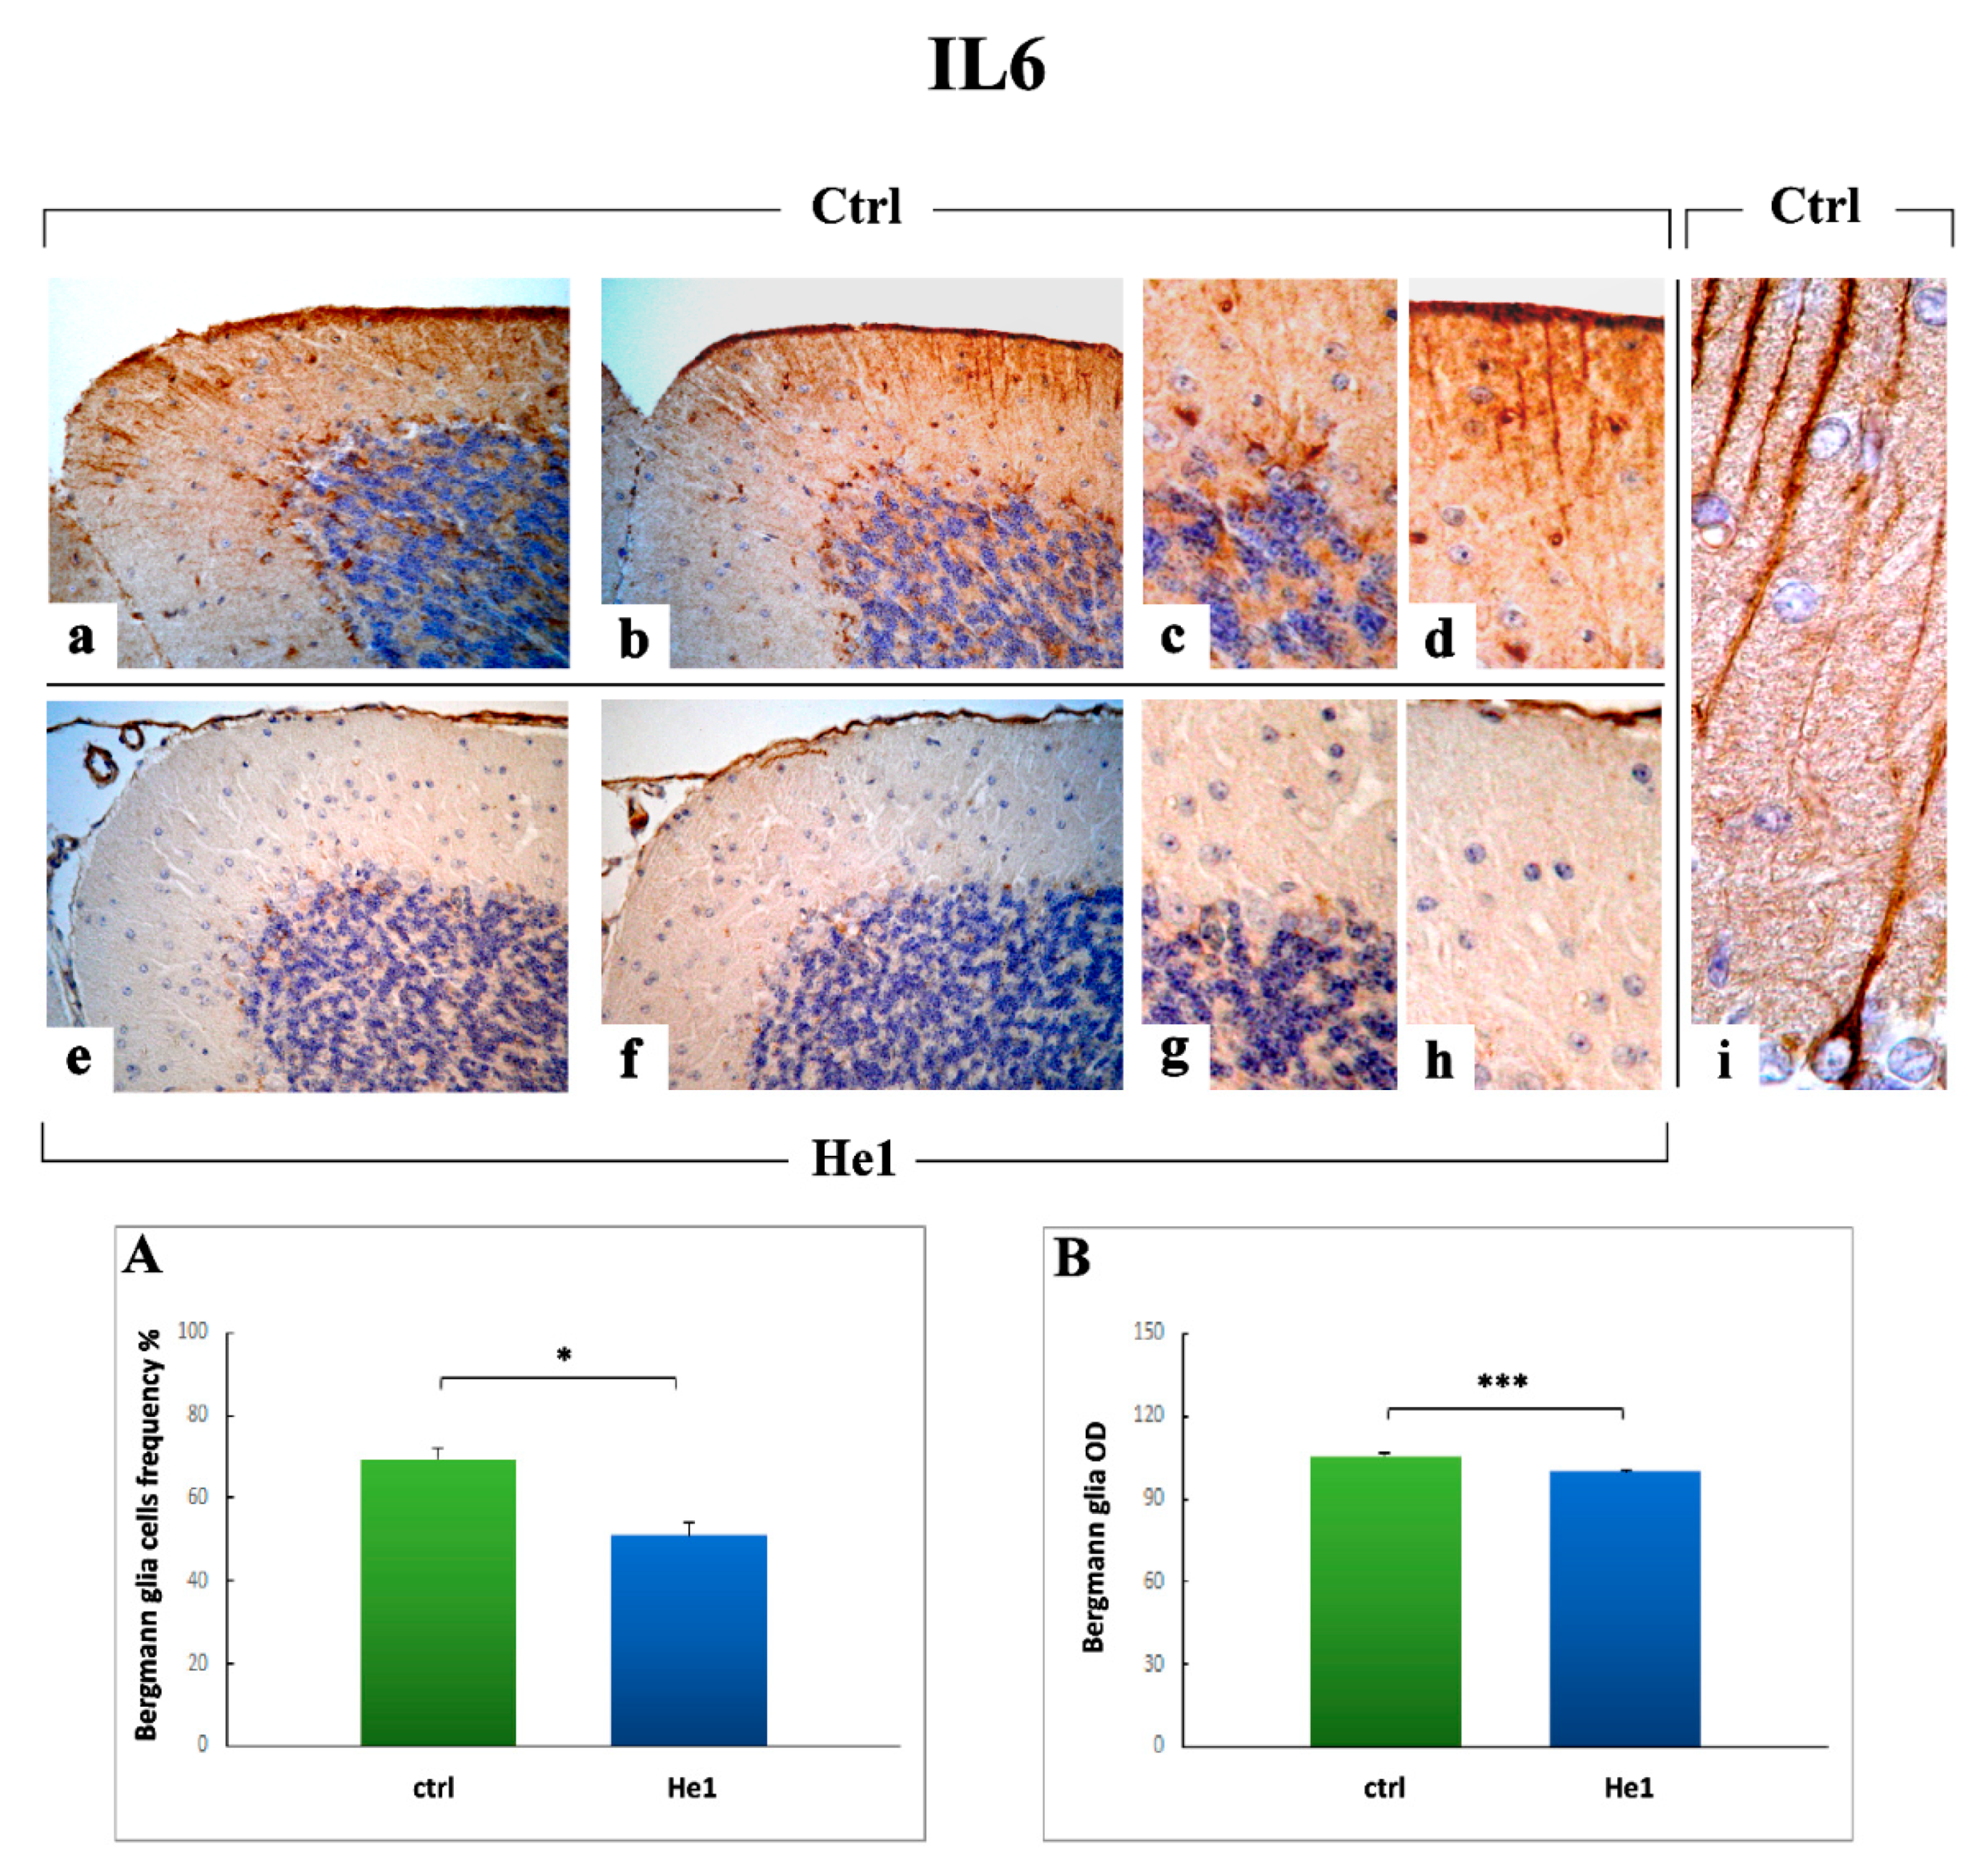
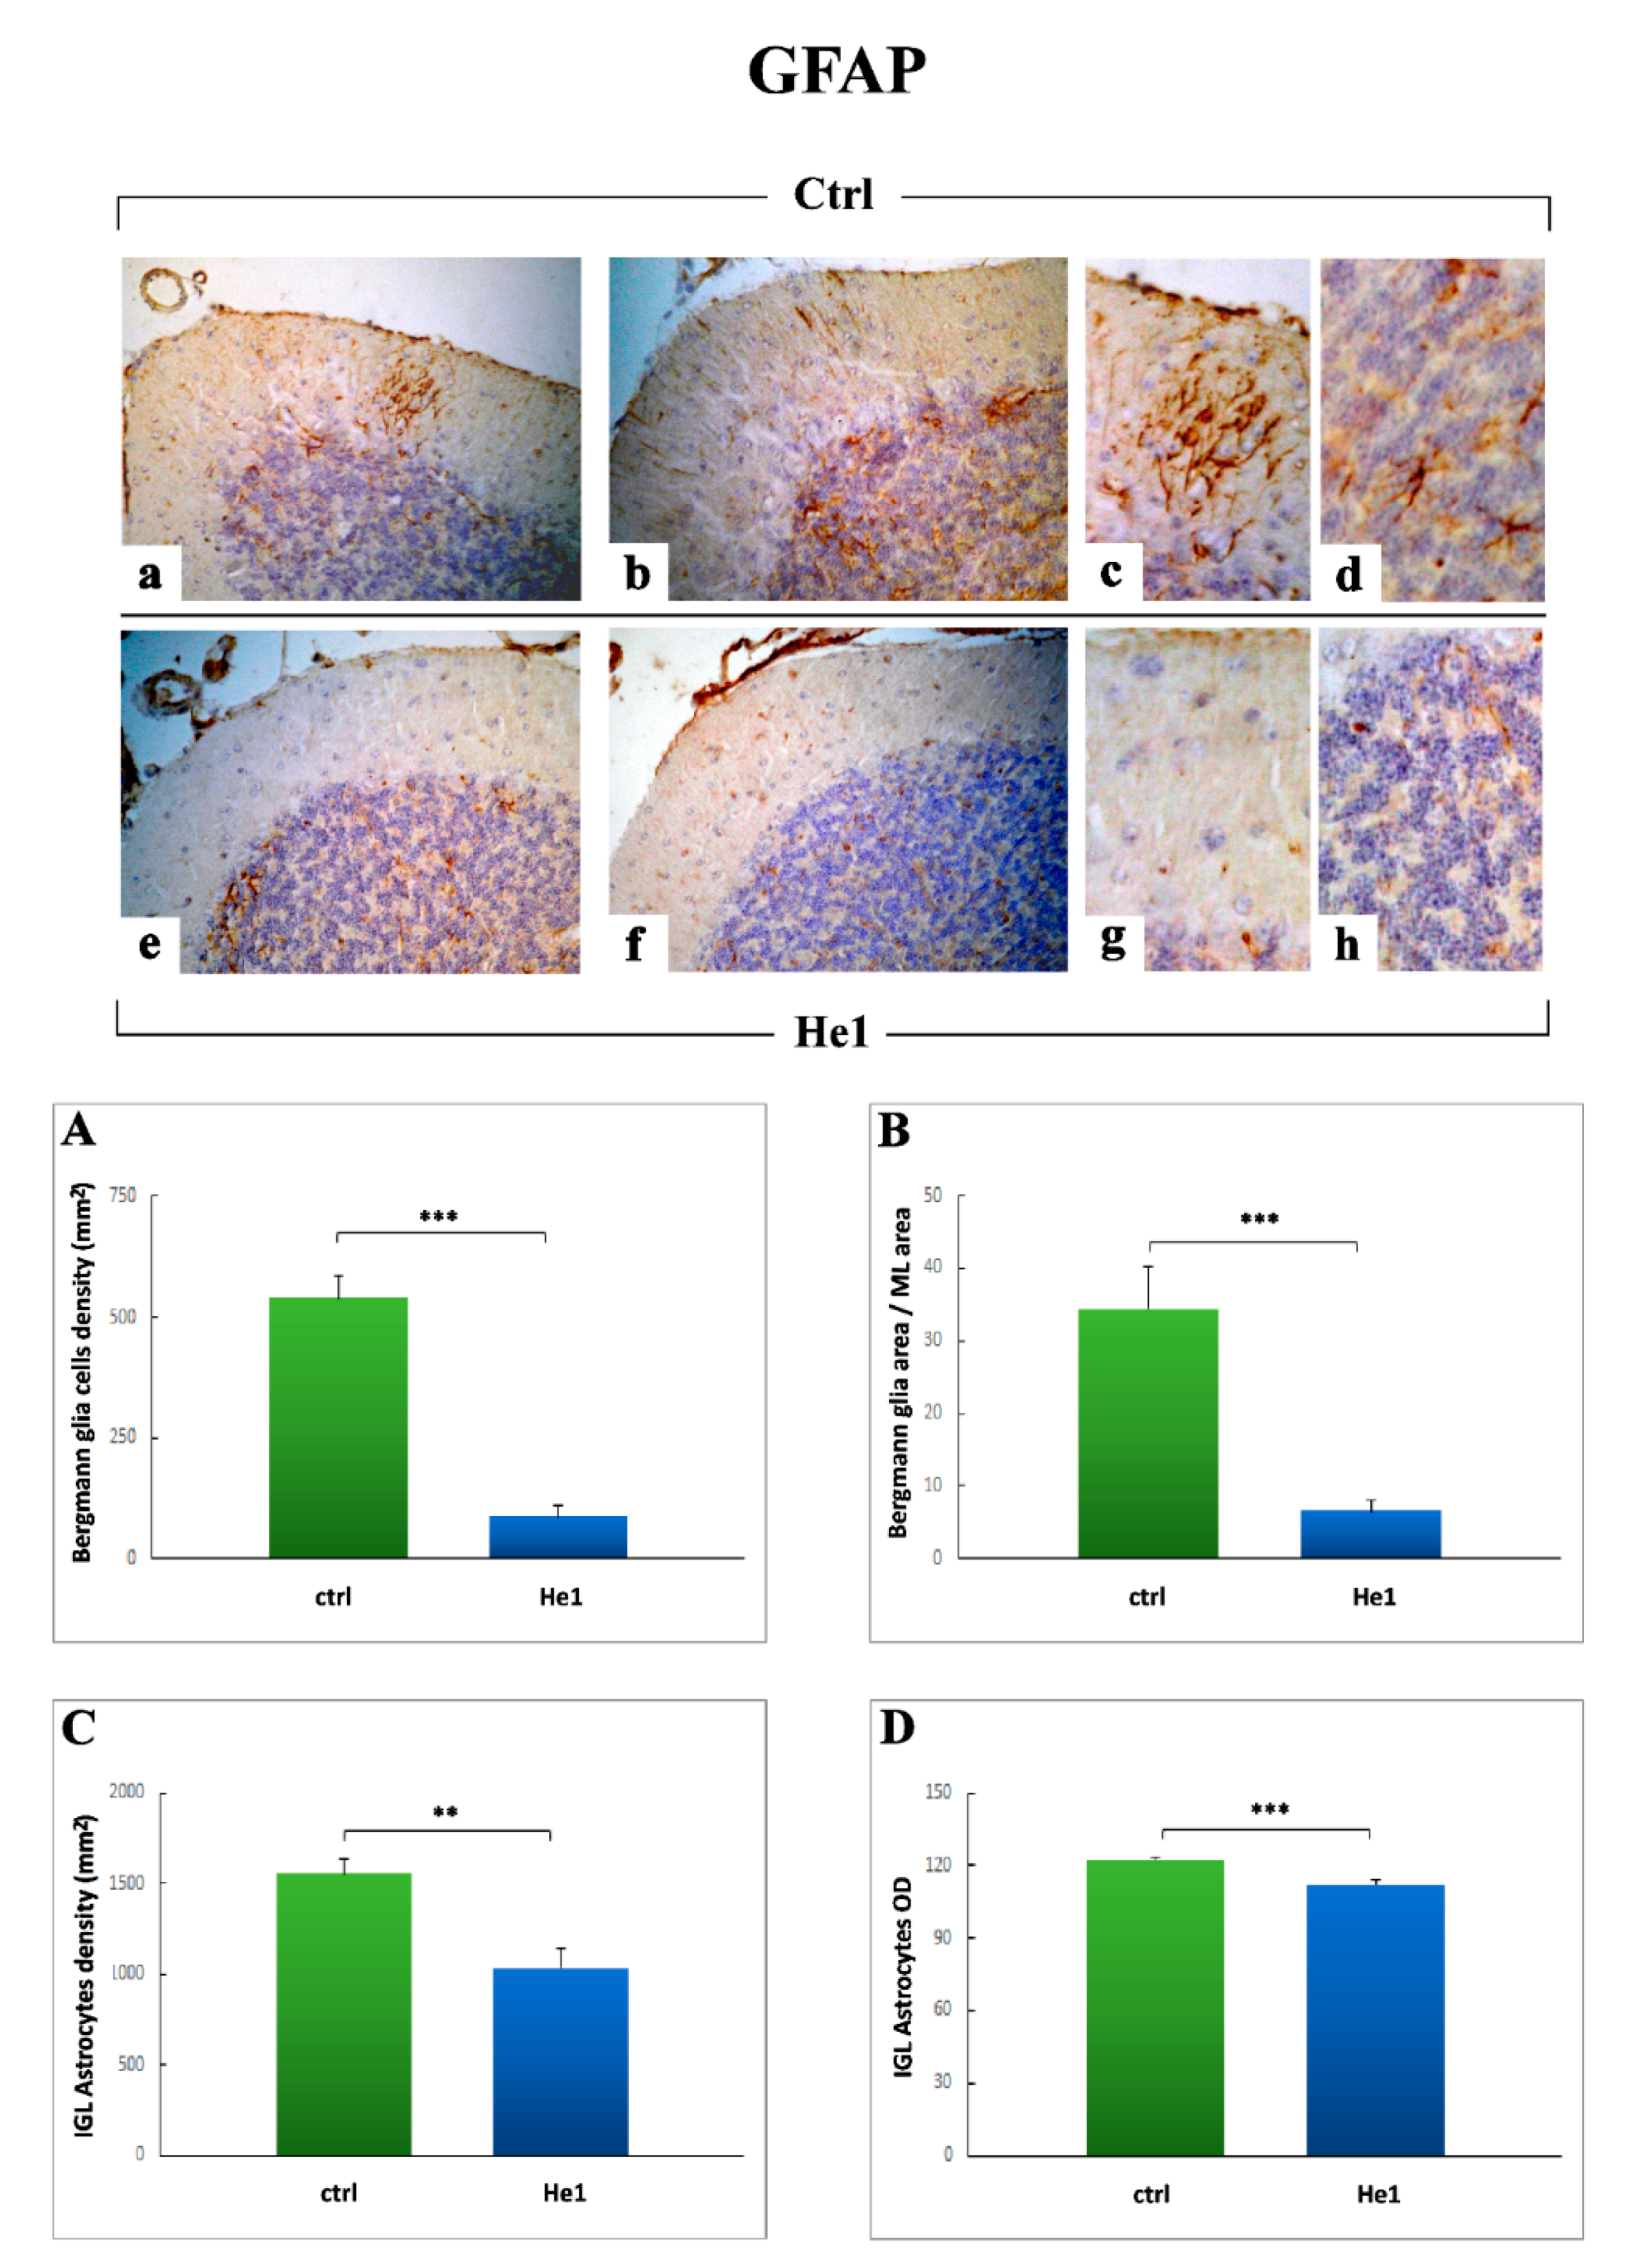
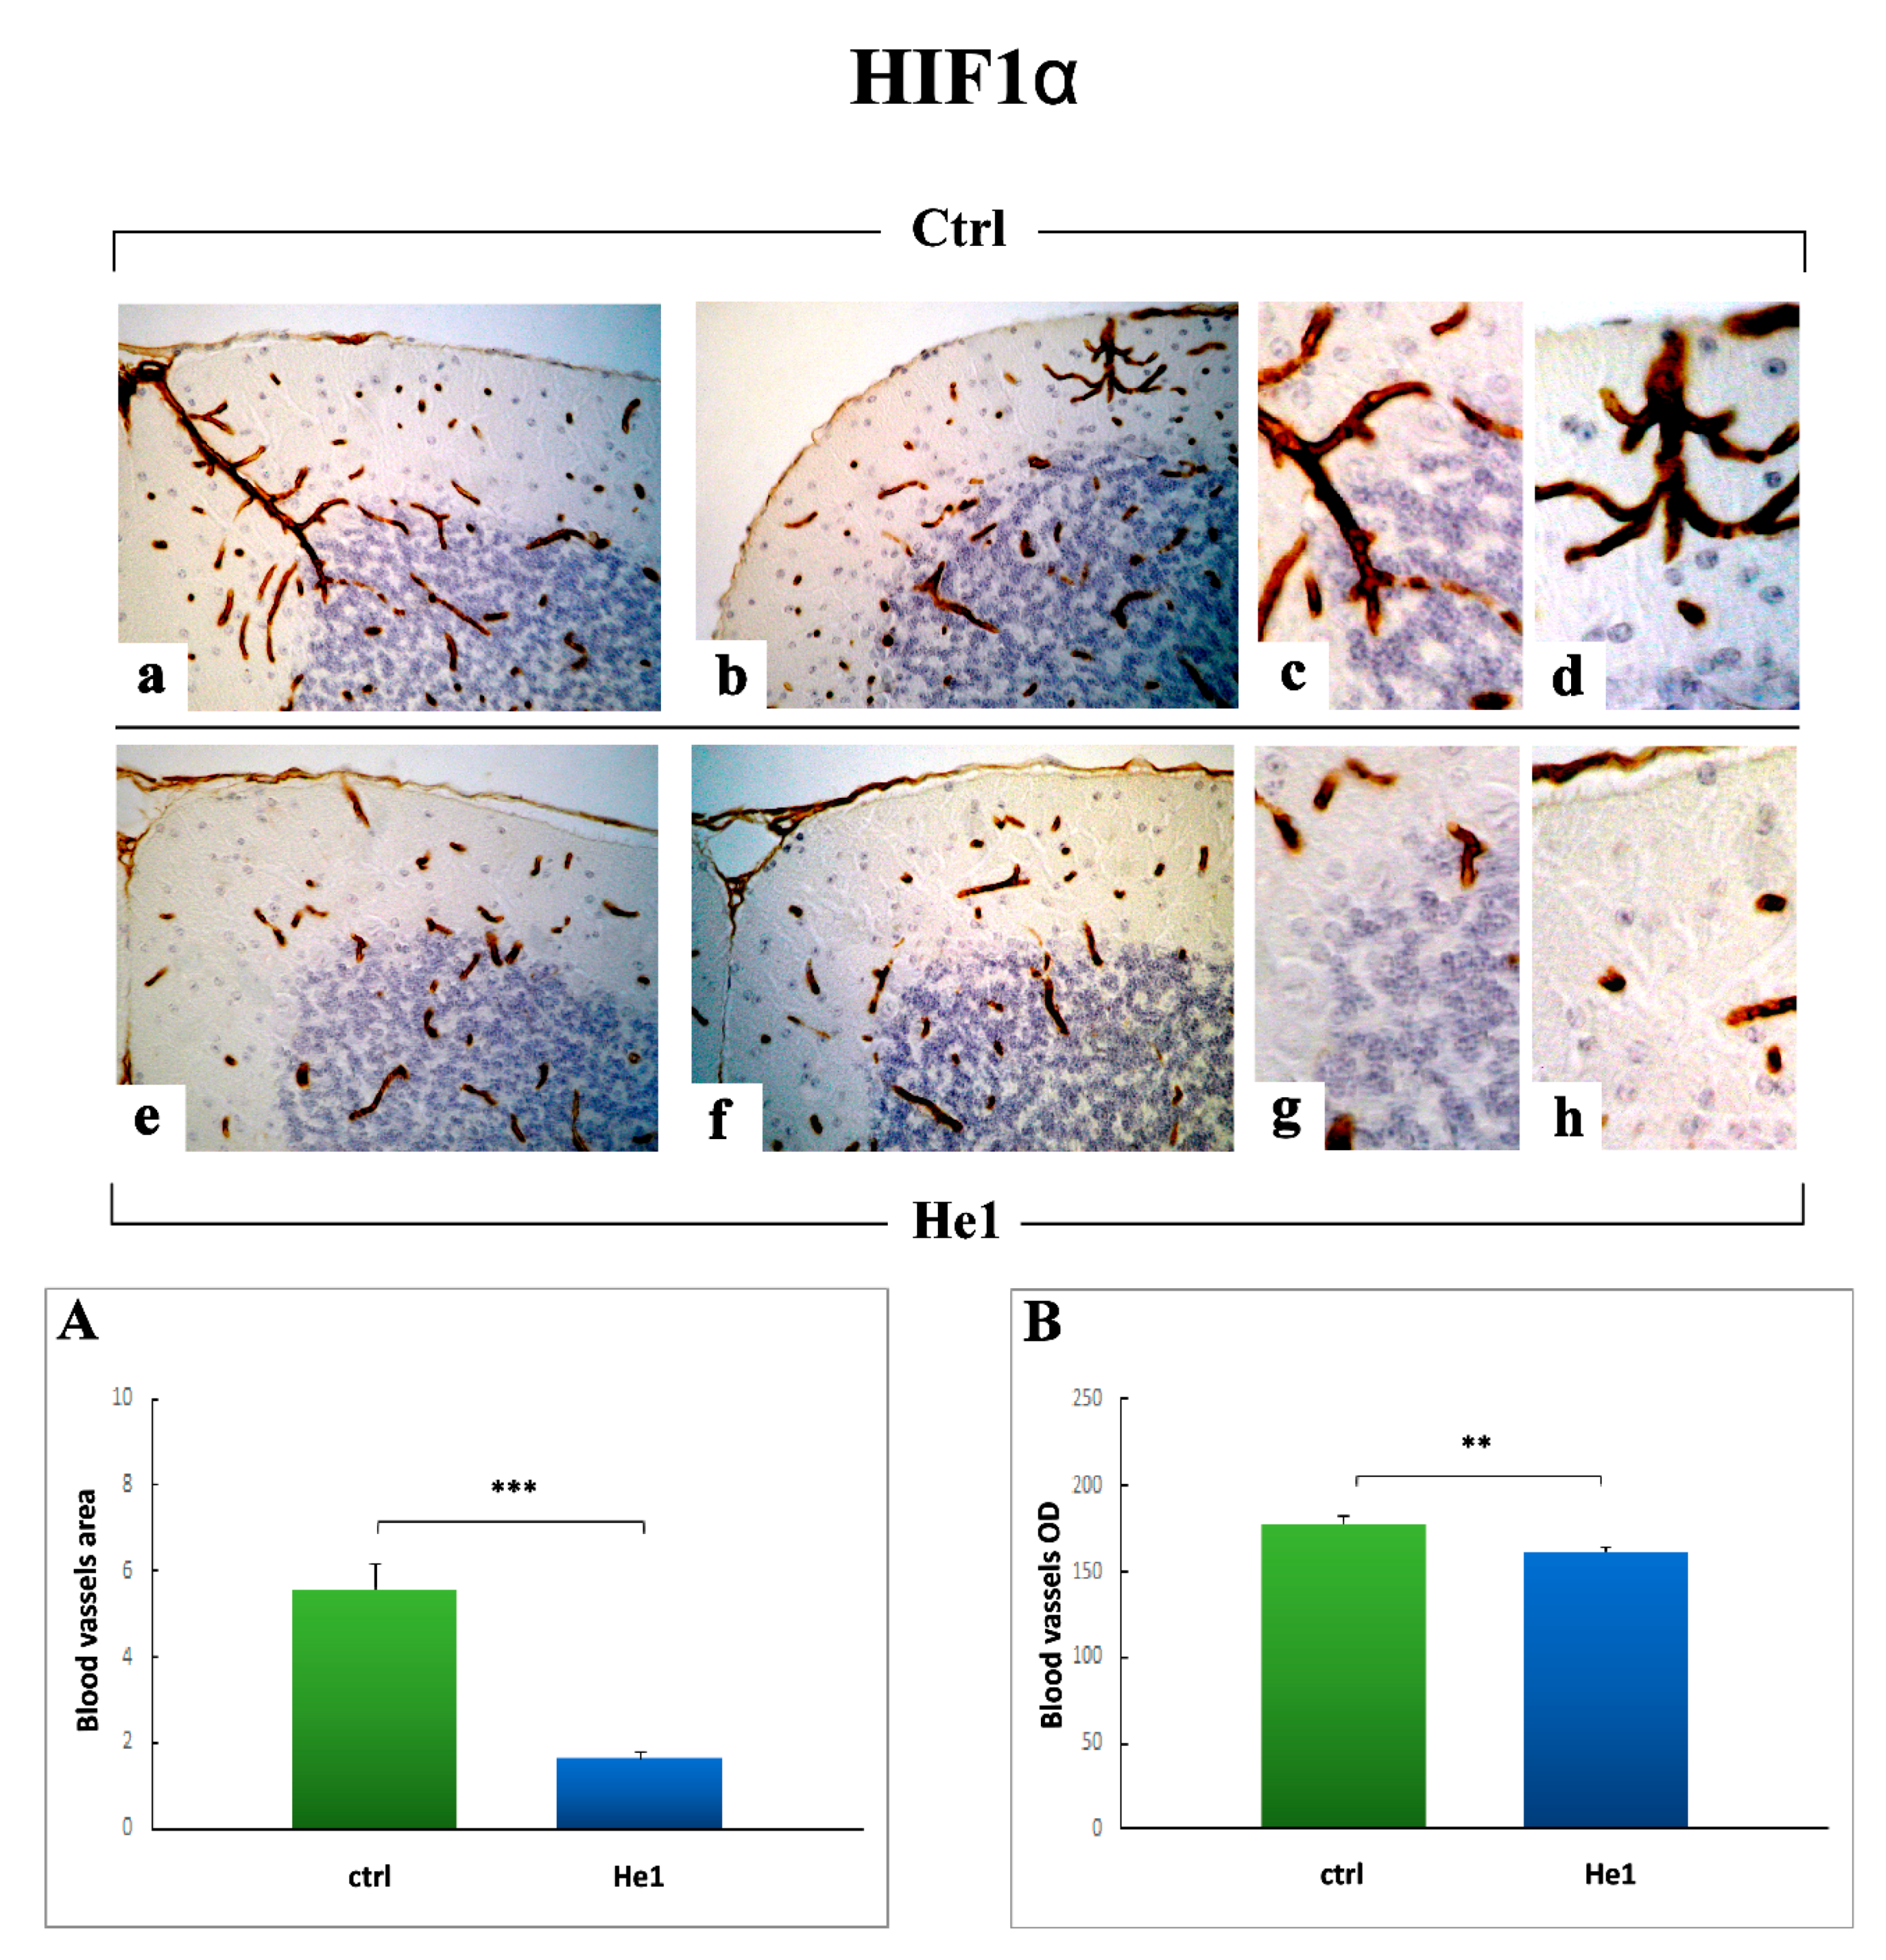
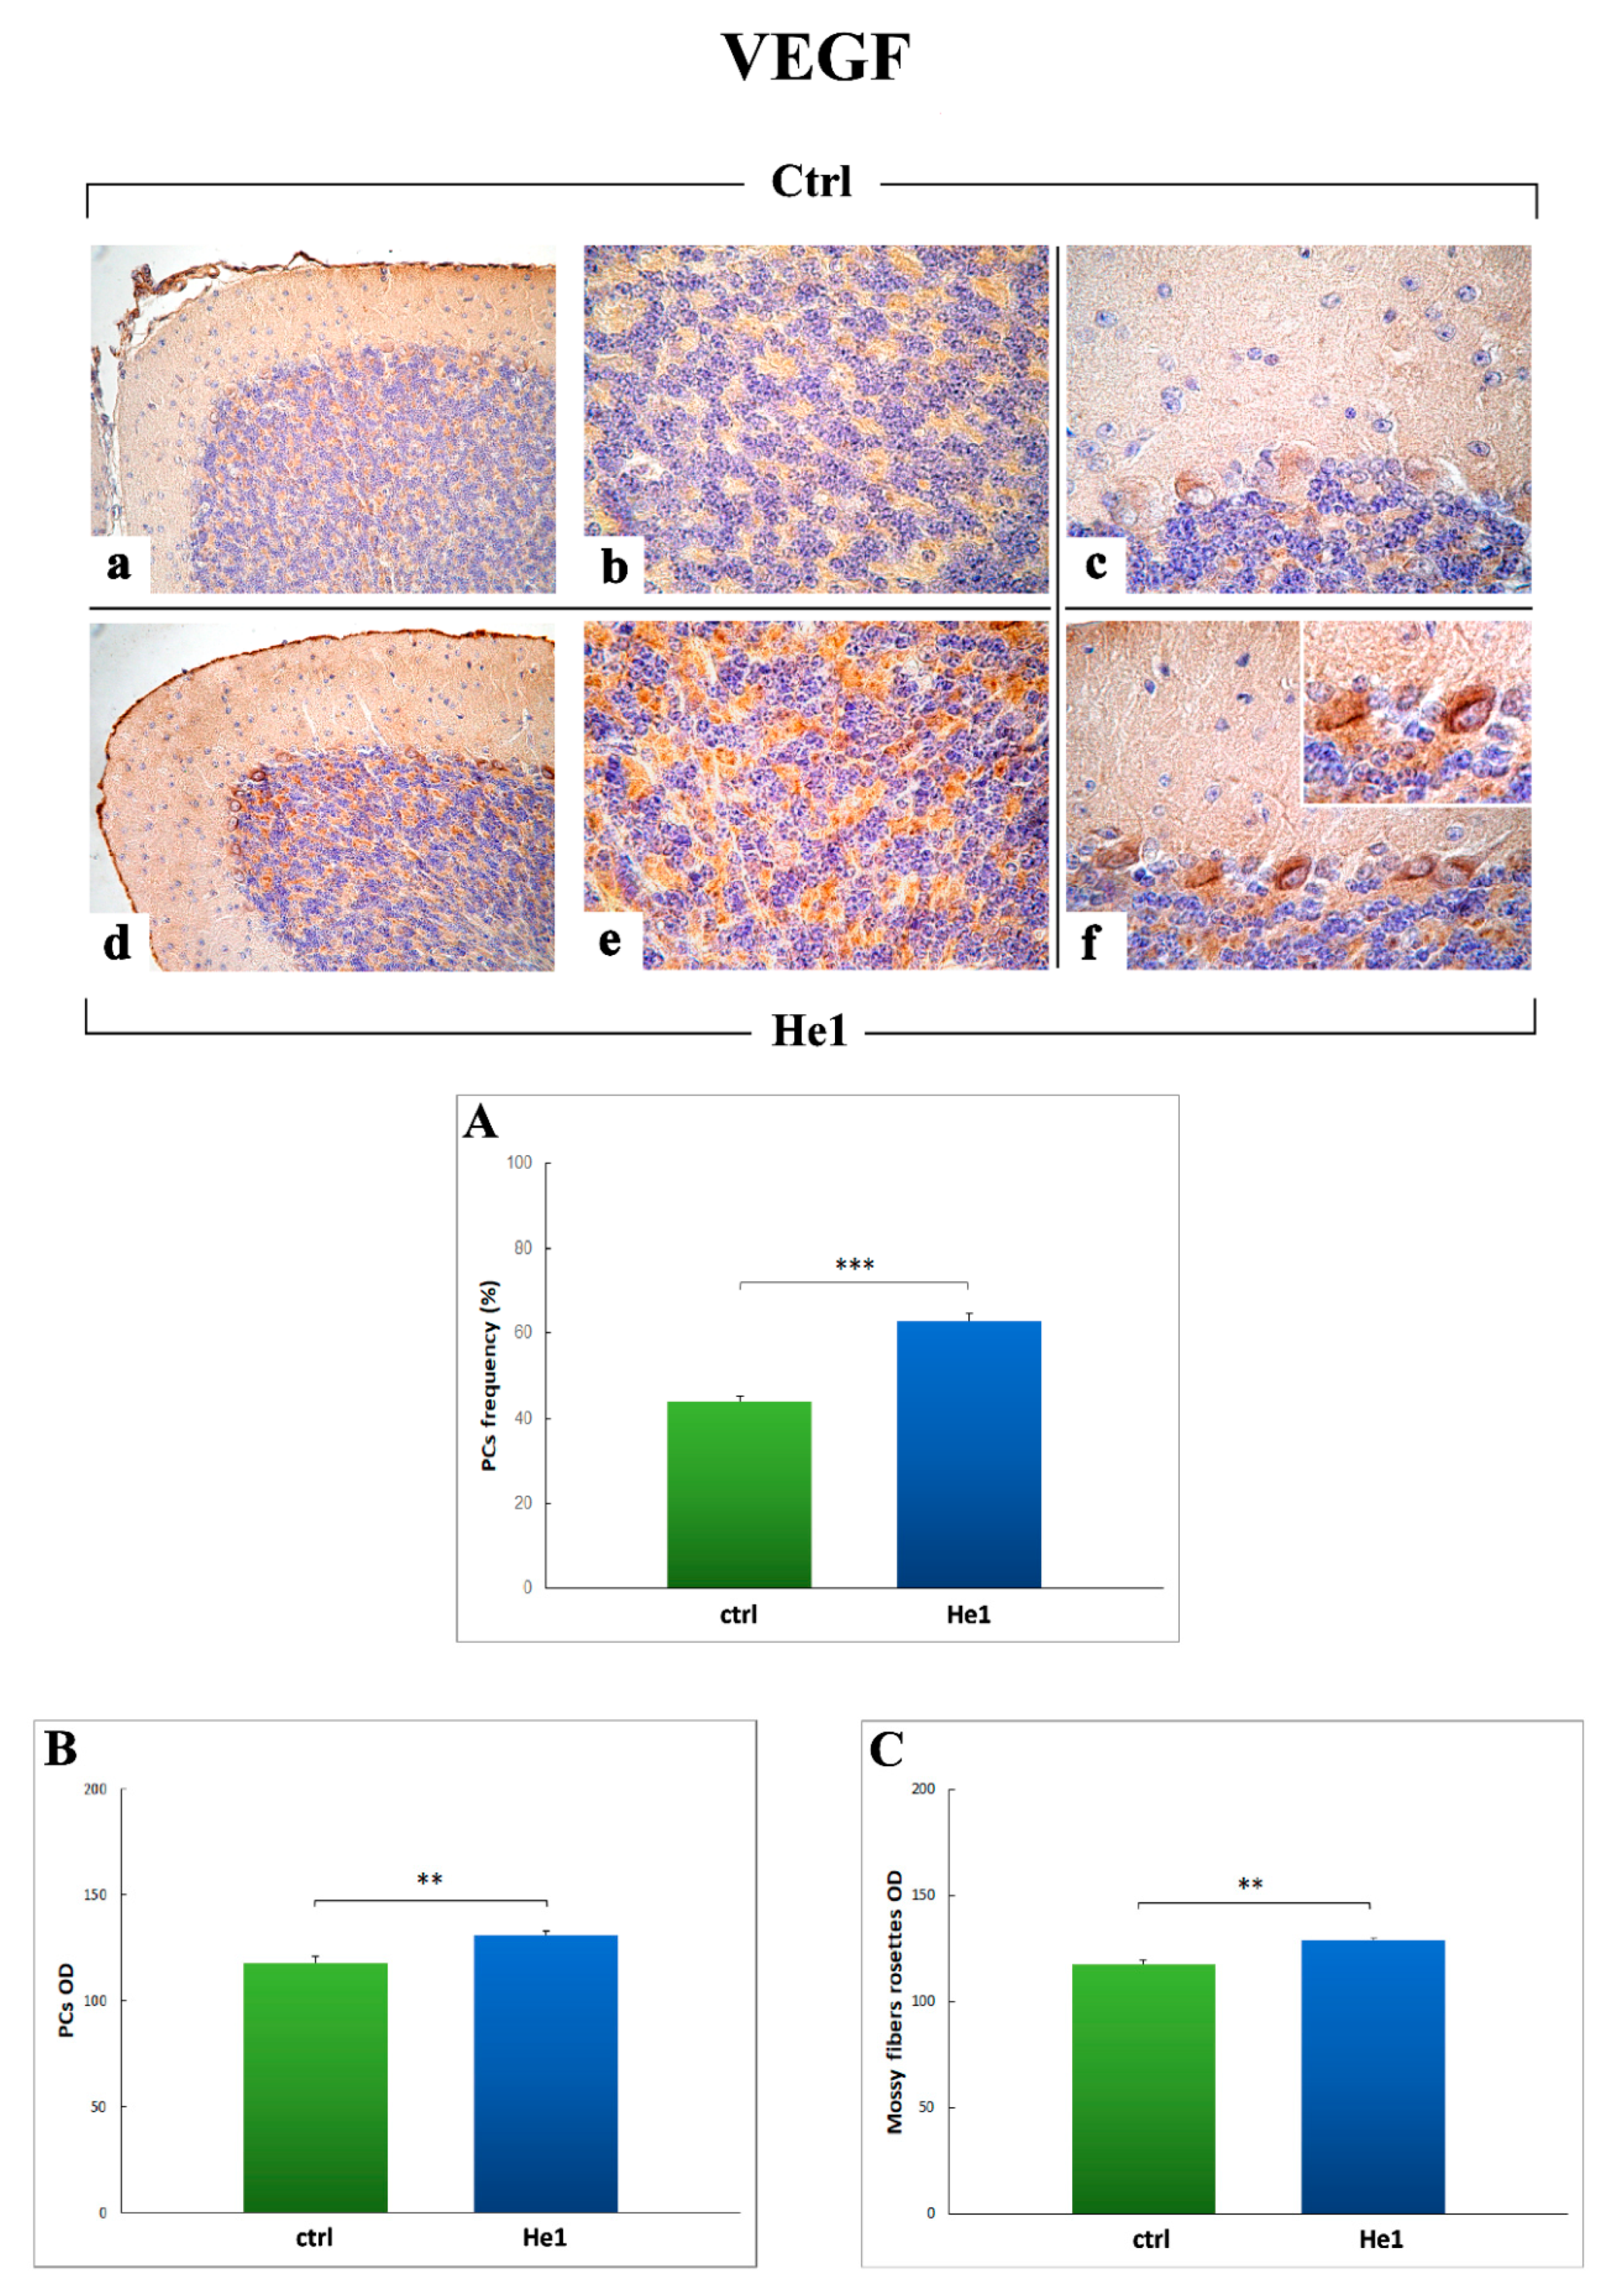
2.3.3. Inflammatory Pathway (IL6, GFAP) and HIF1α Assessment
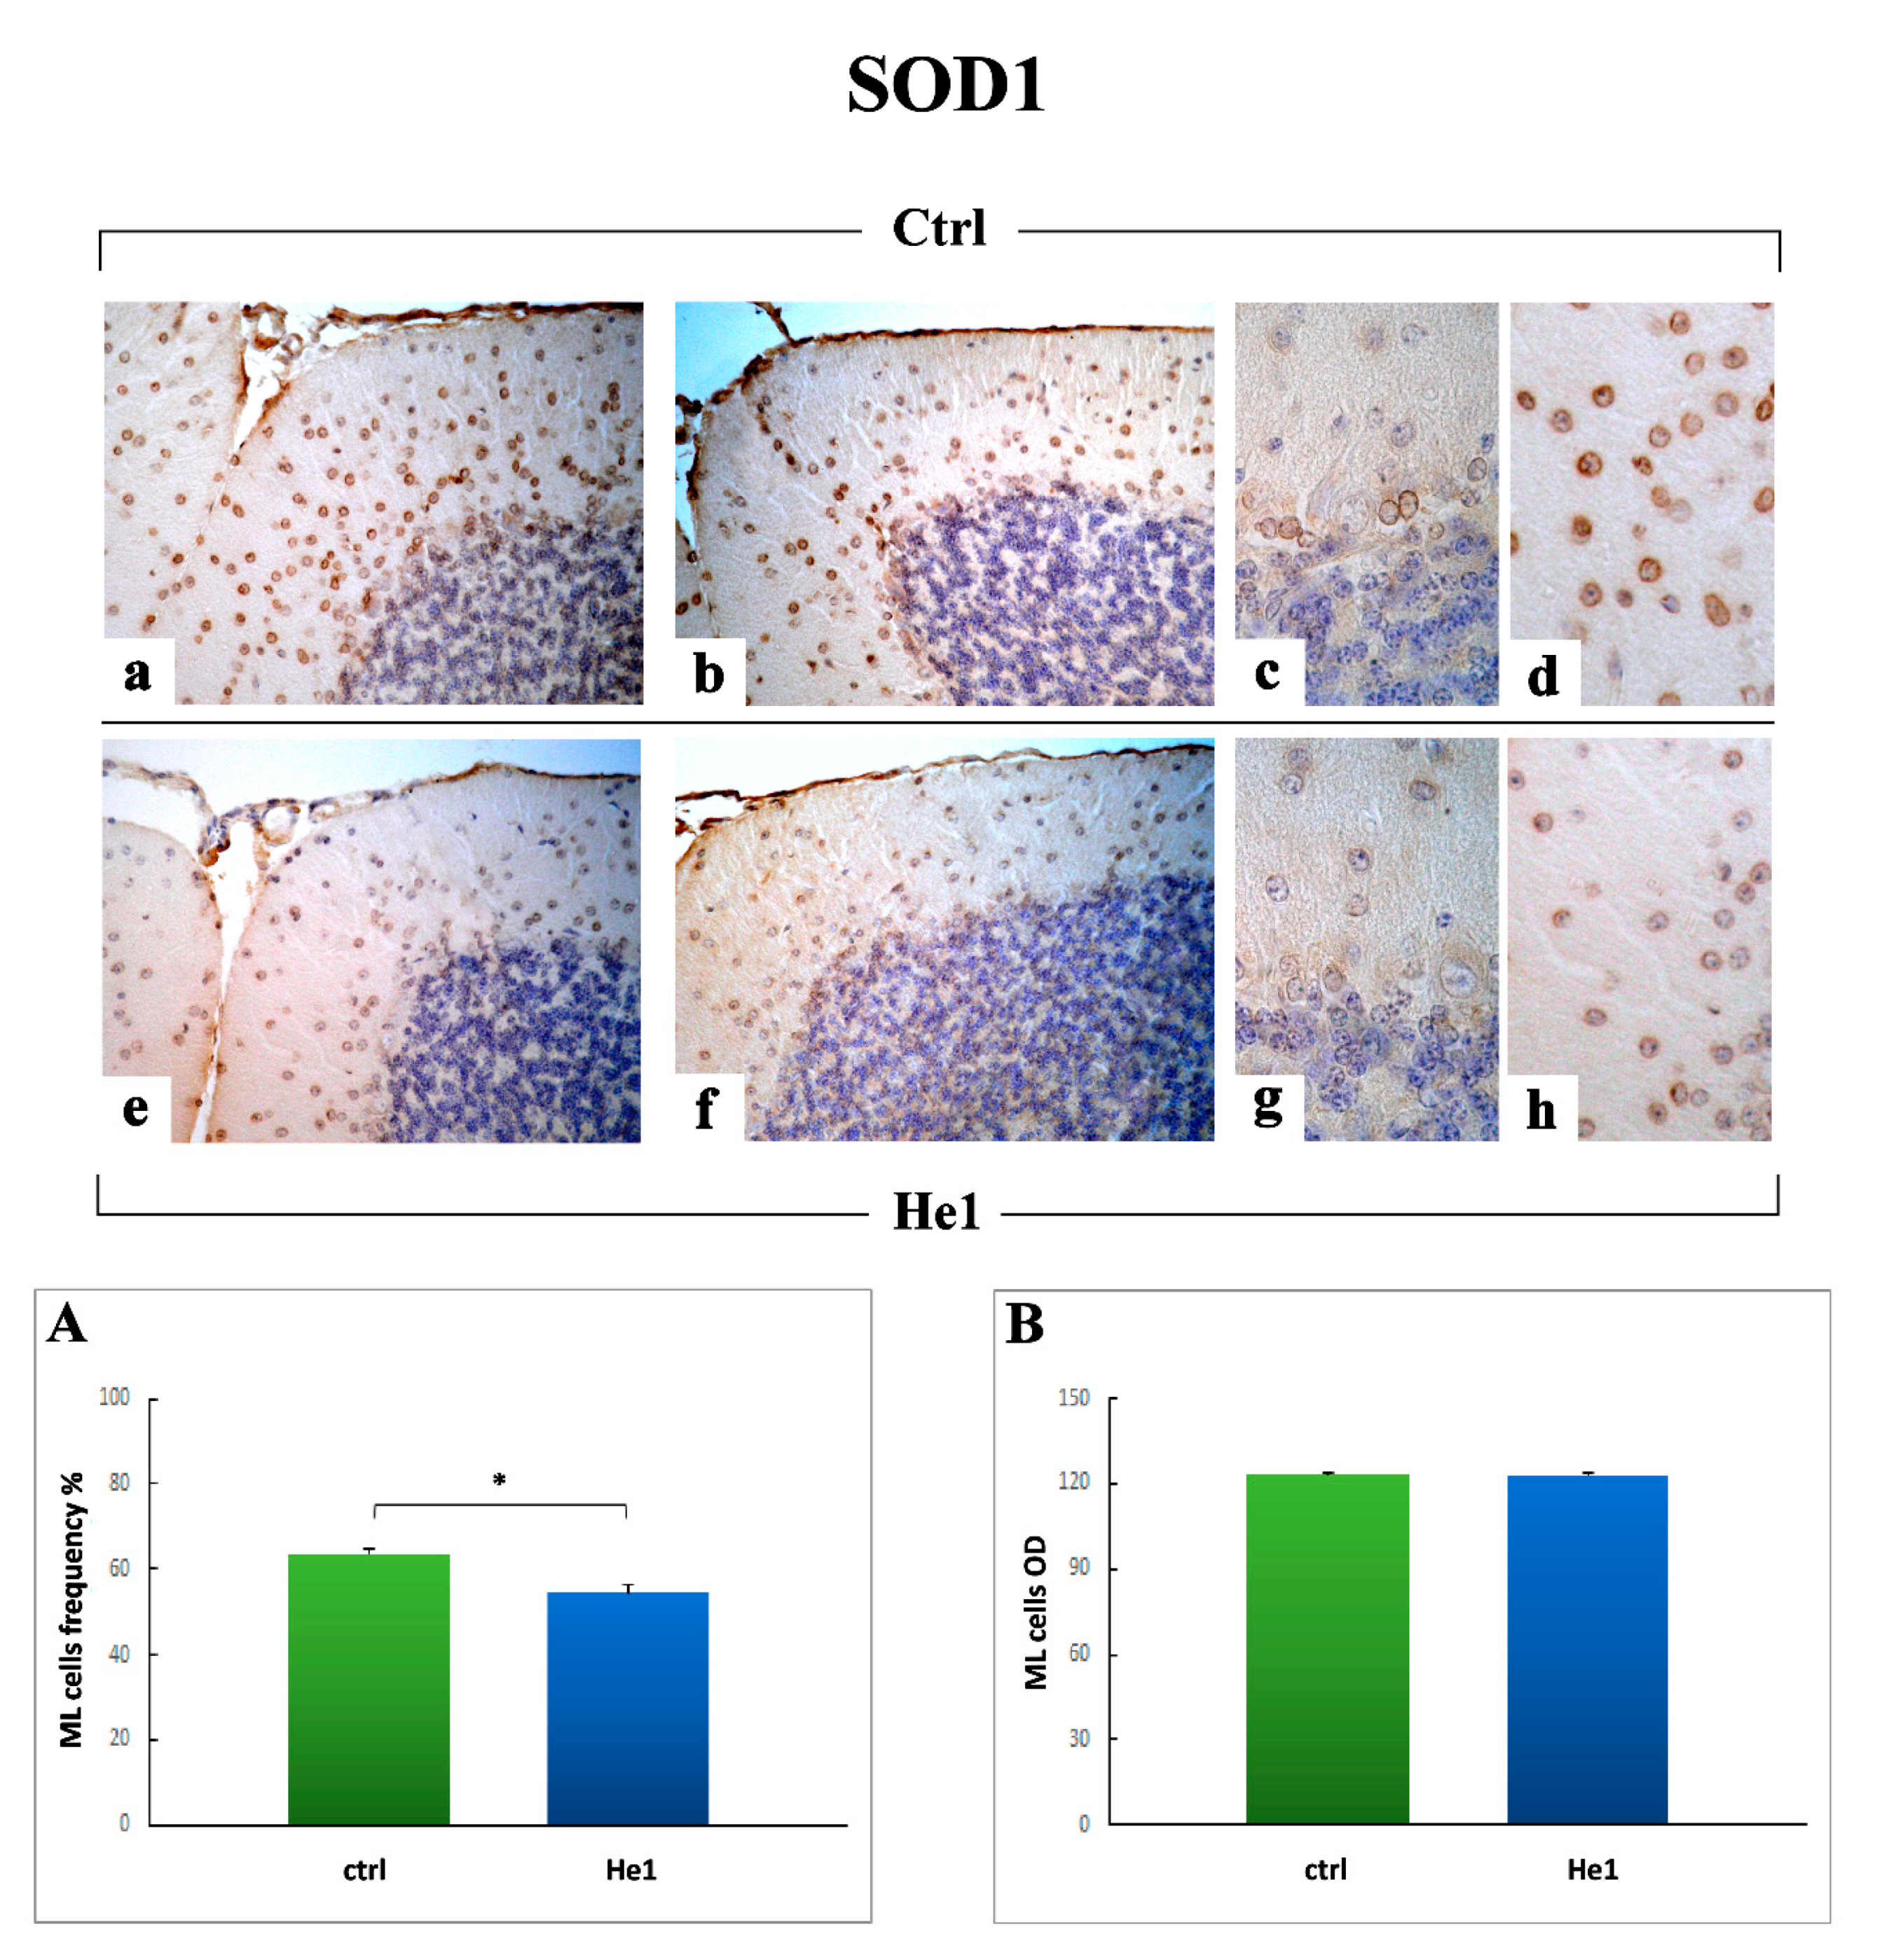
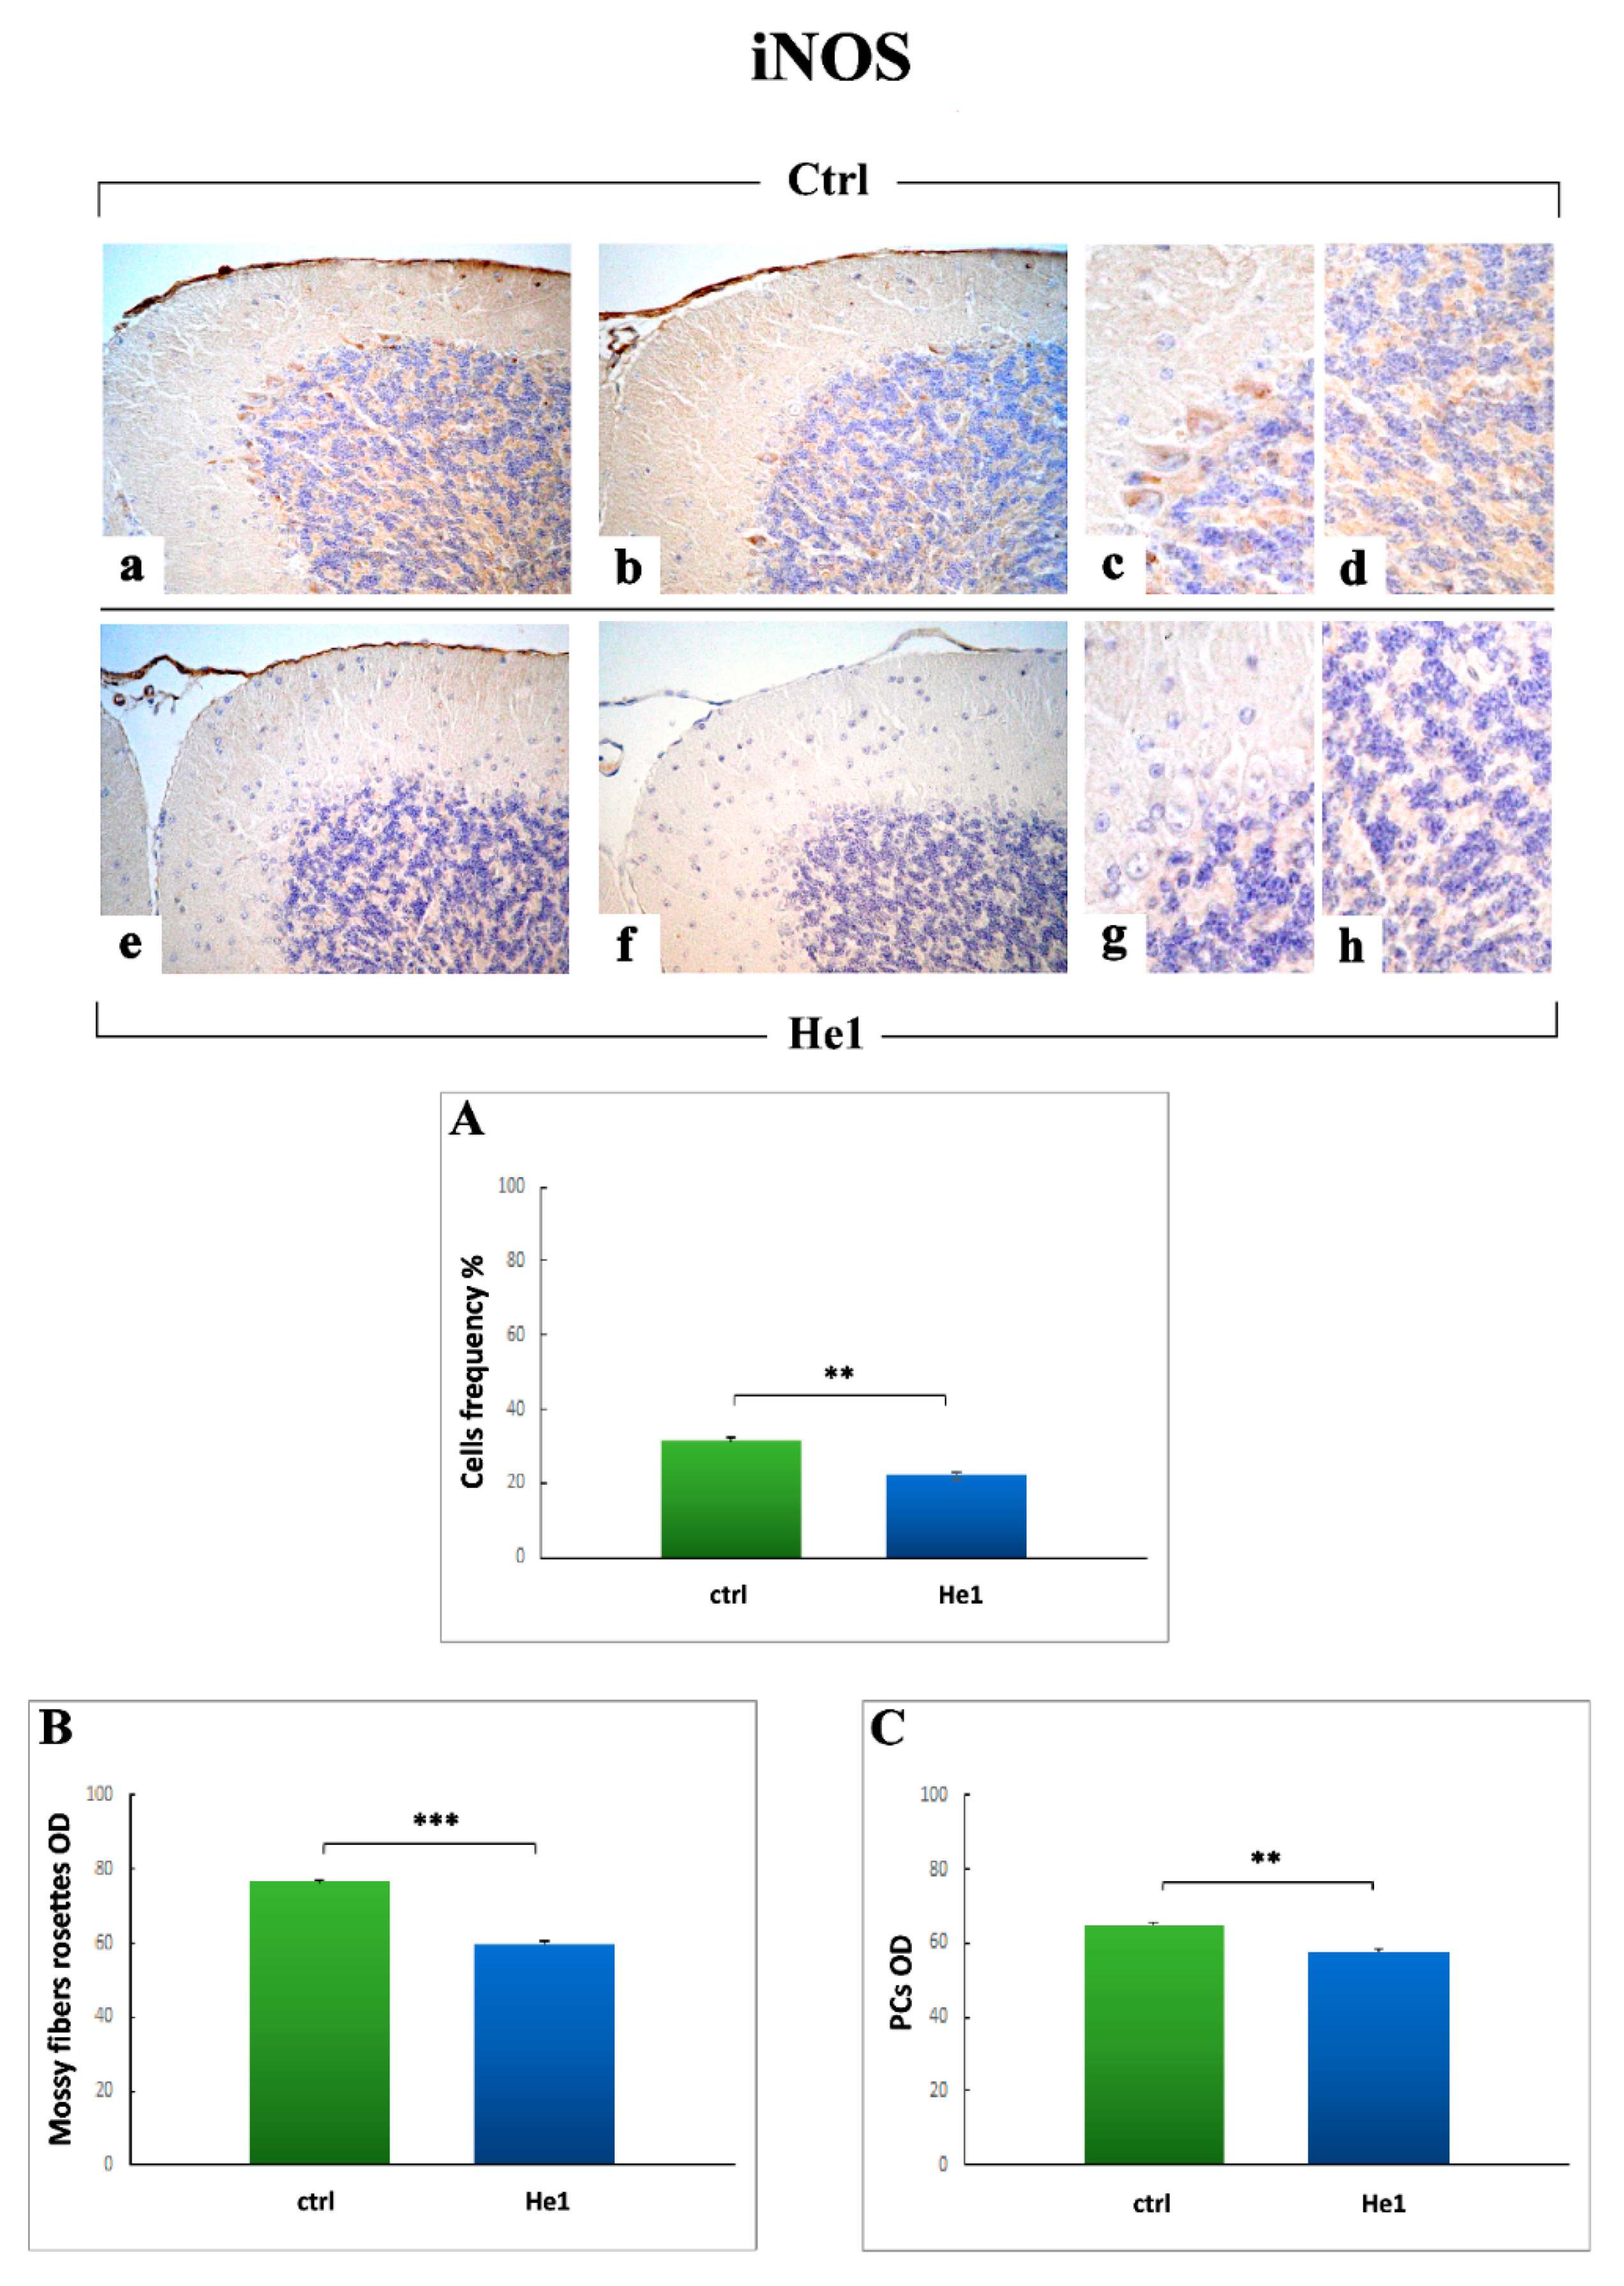
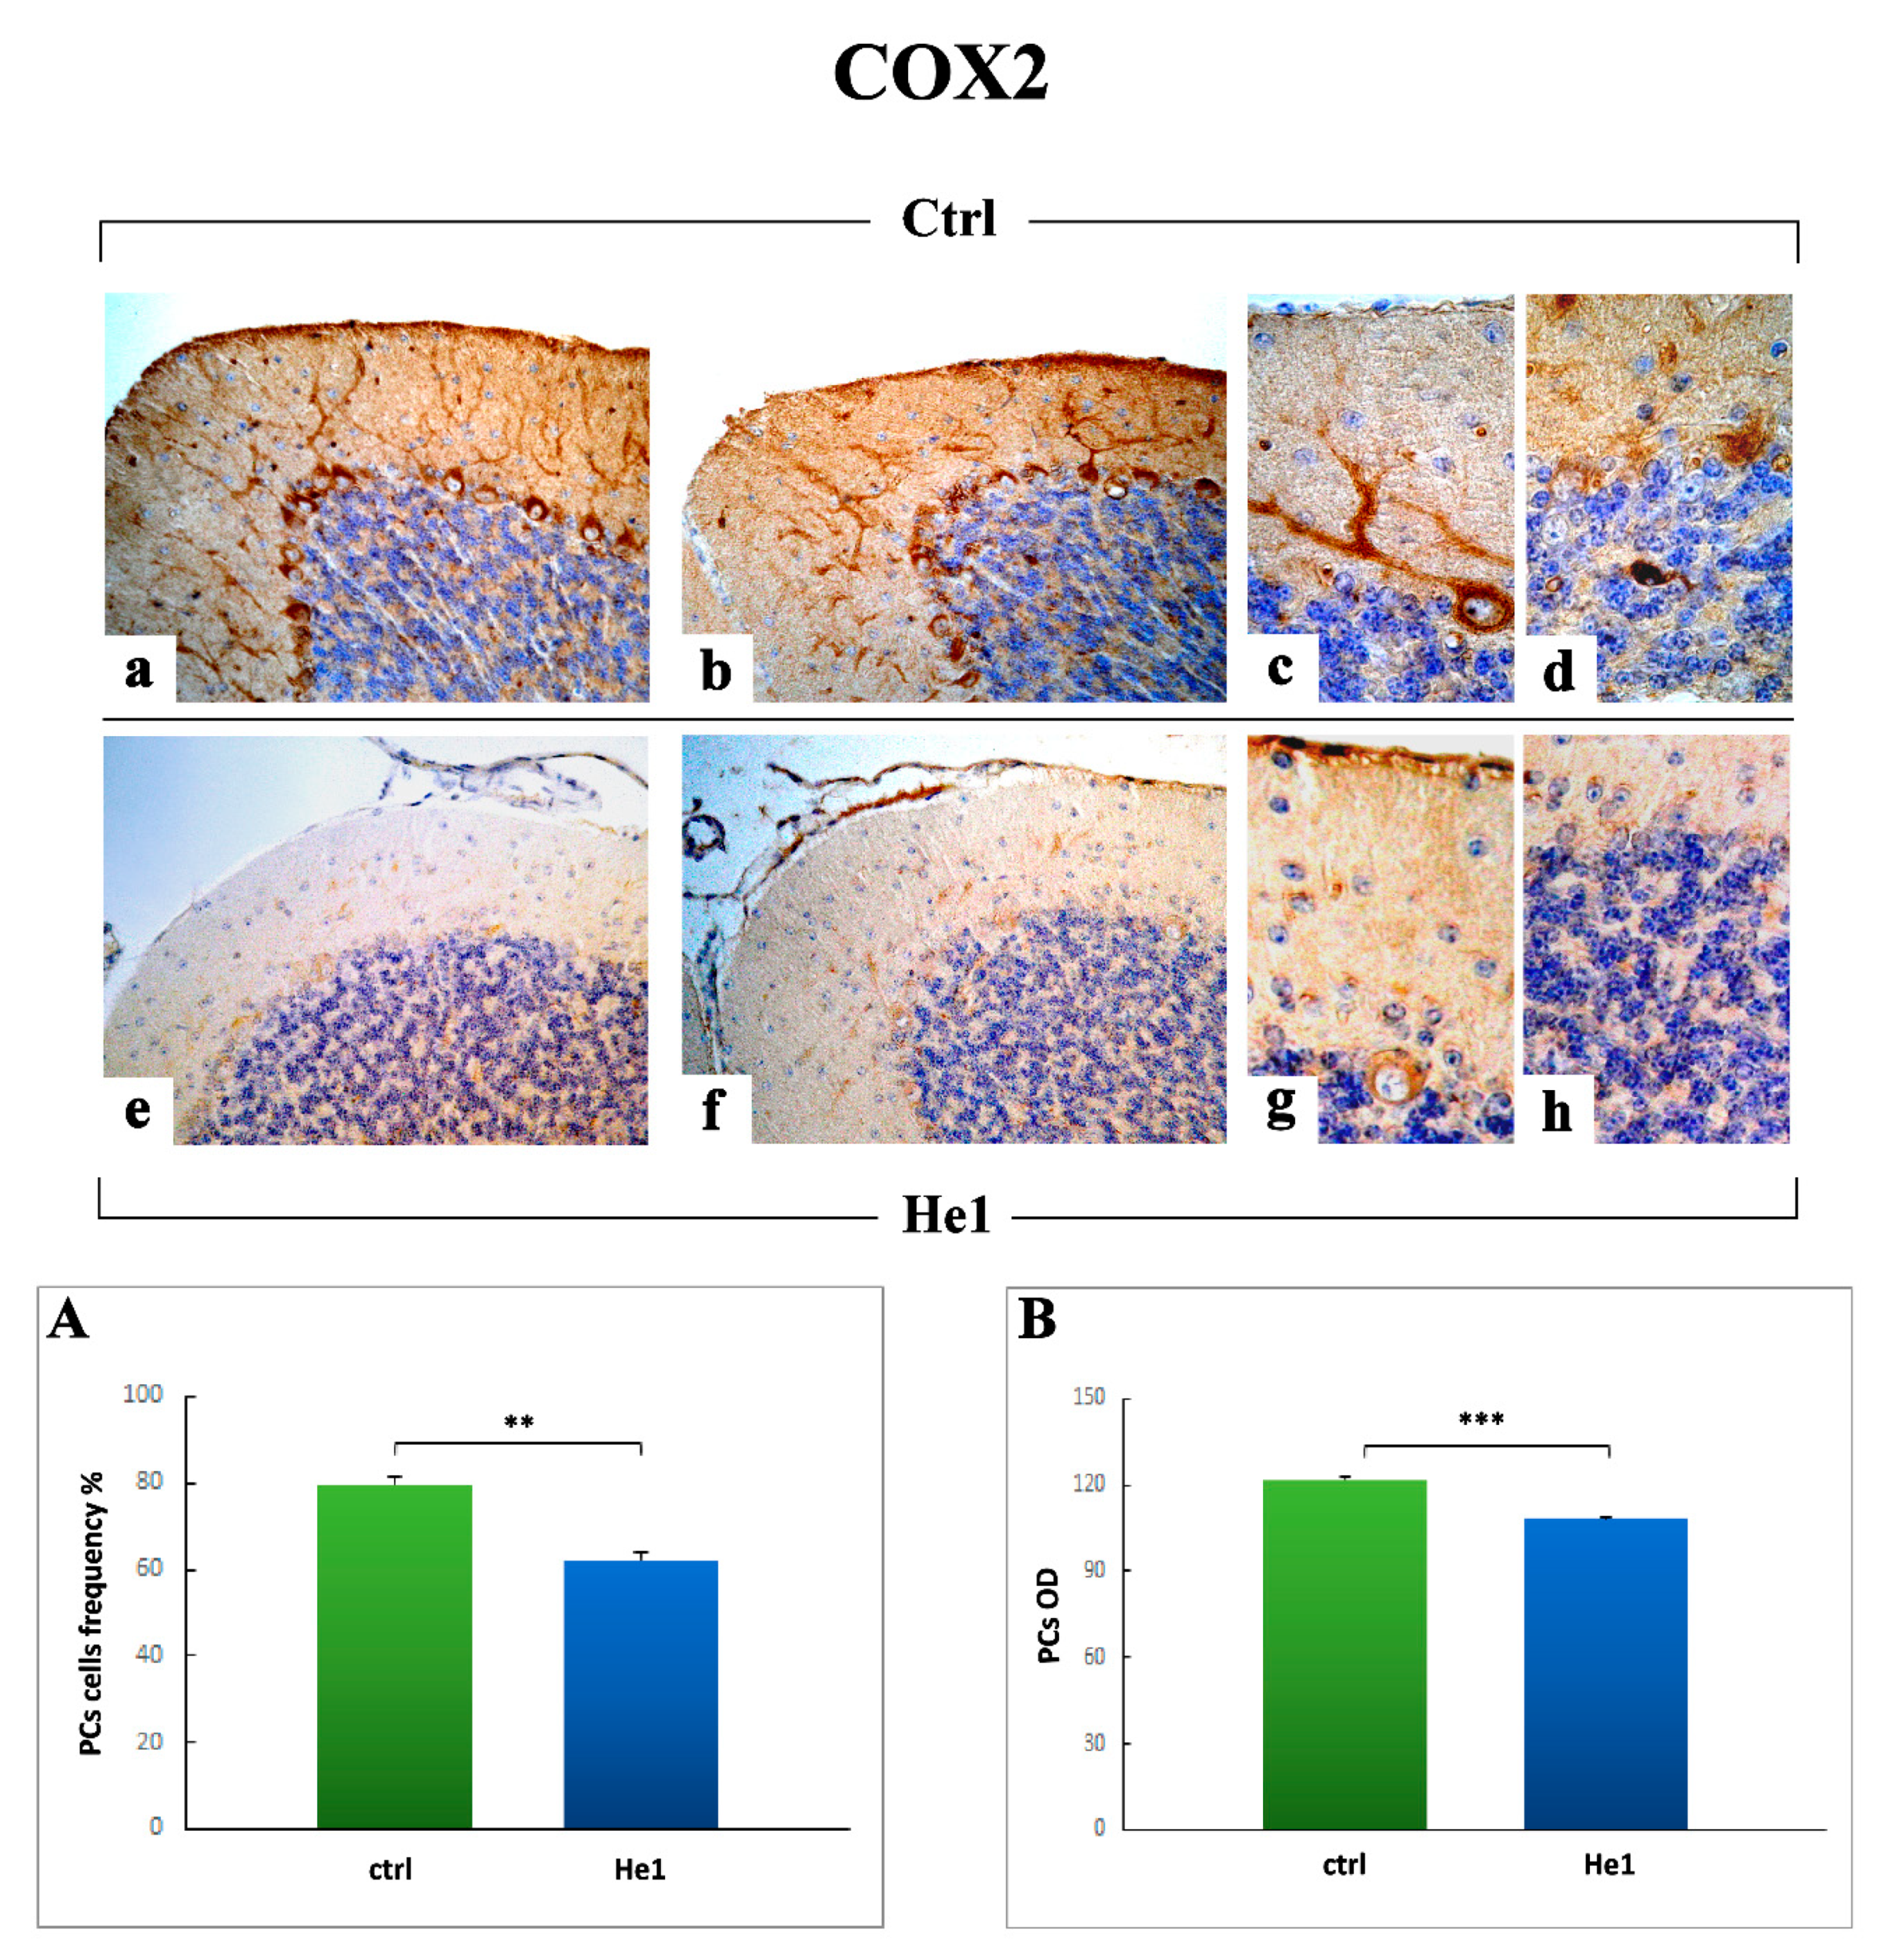
2.3.4. Oxidative Stress Pathway: SOD1, NOS2 and COX2 Immunohistochemical Assessment
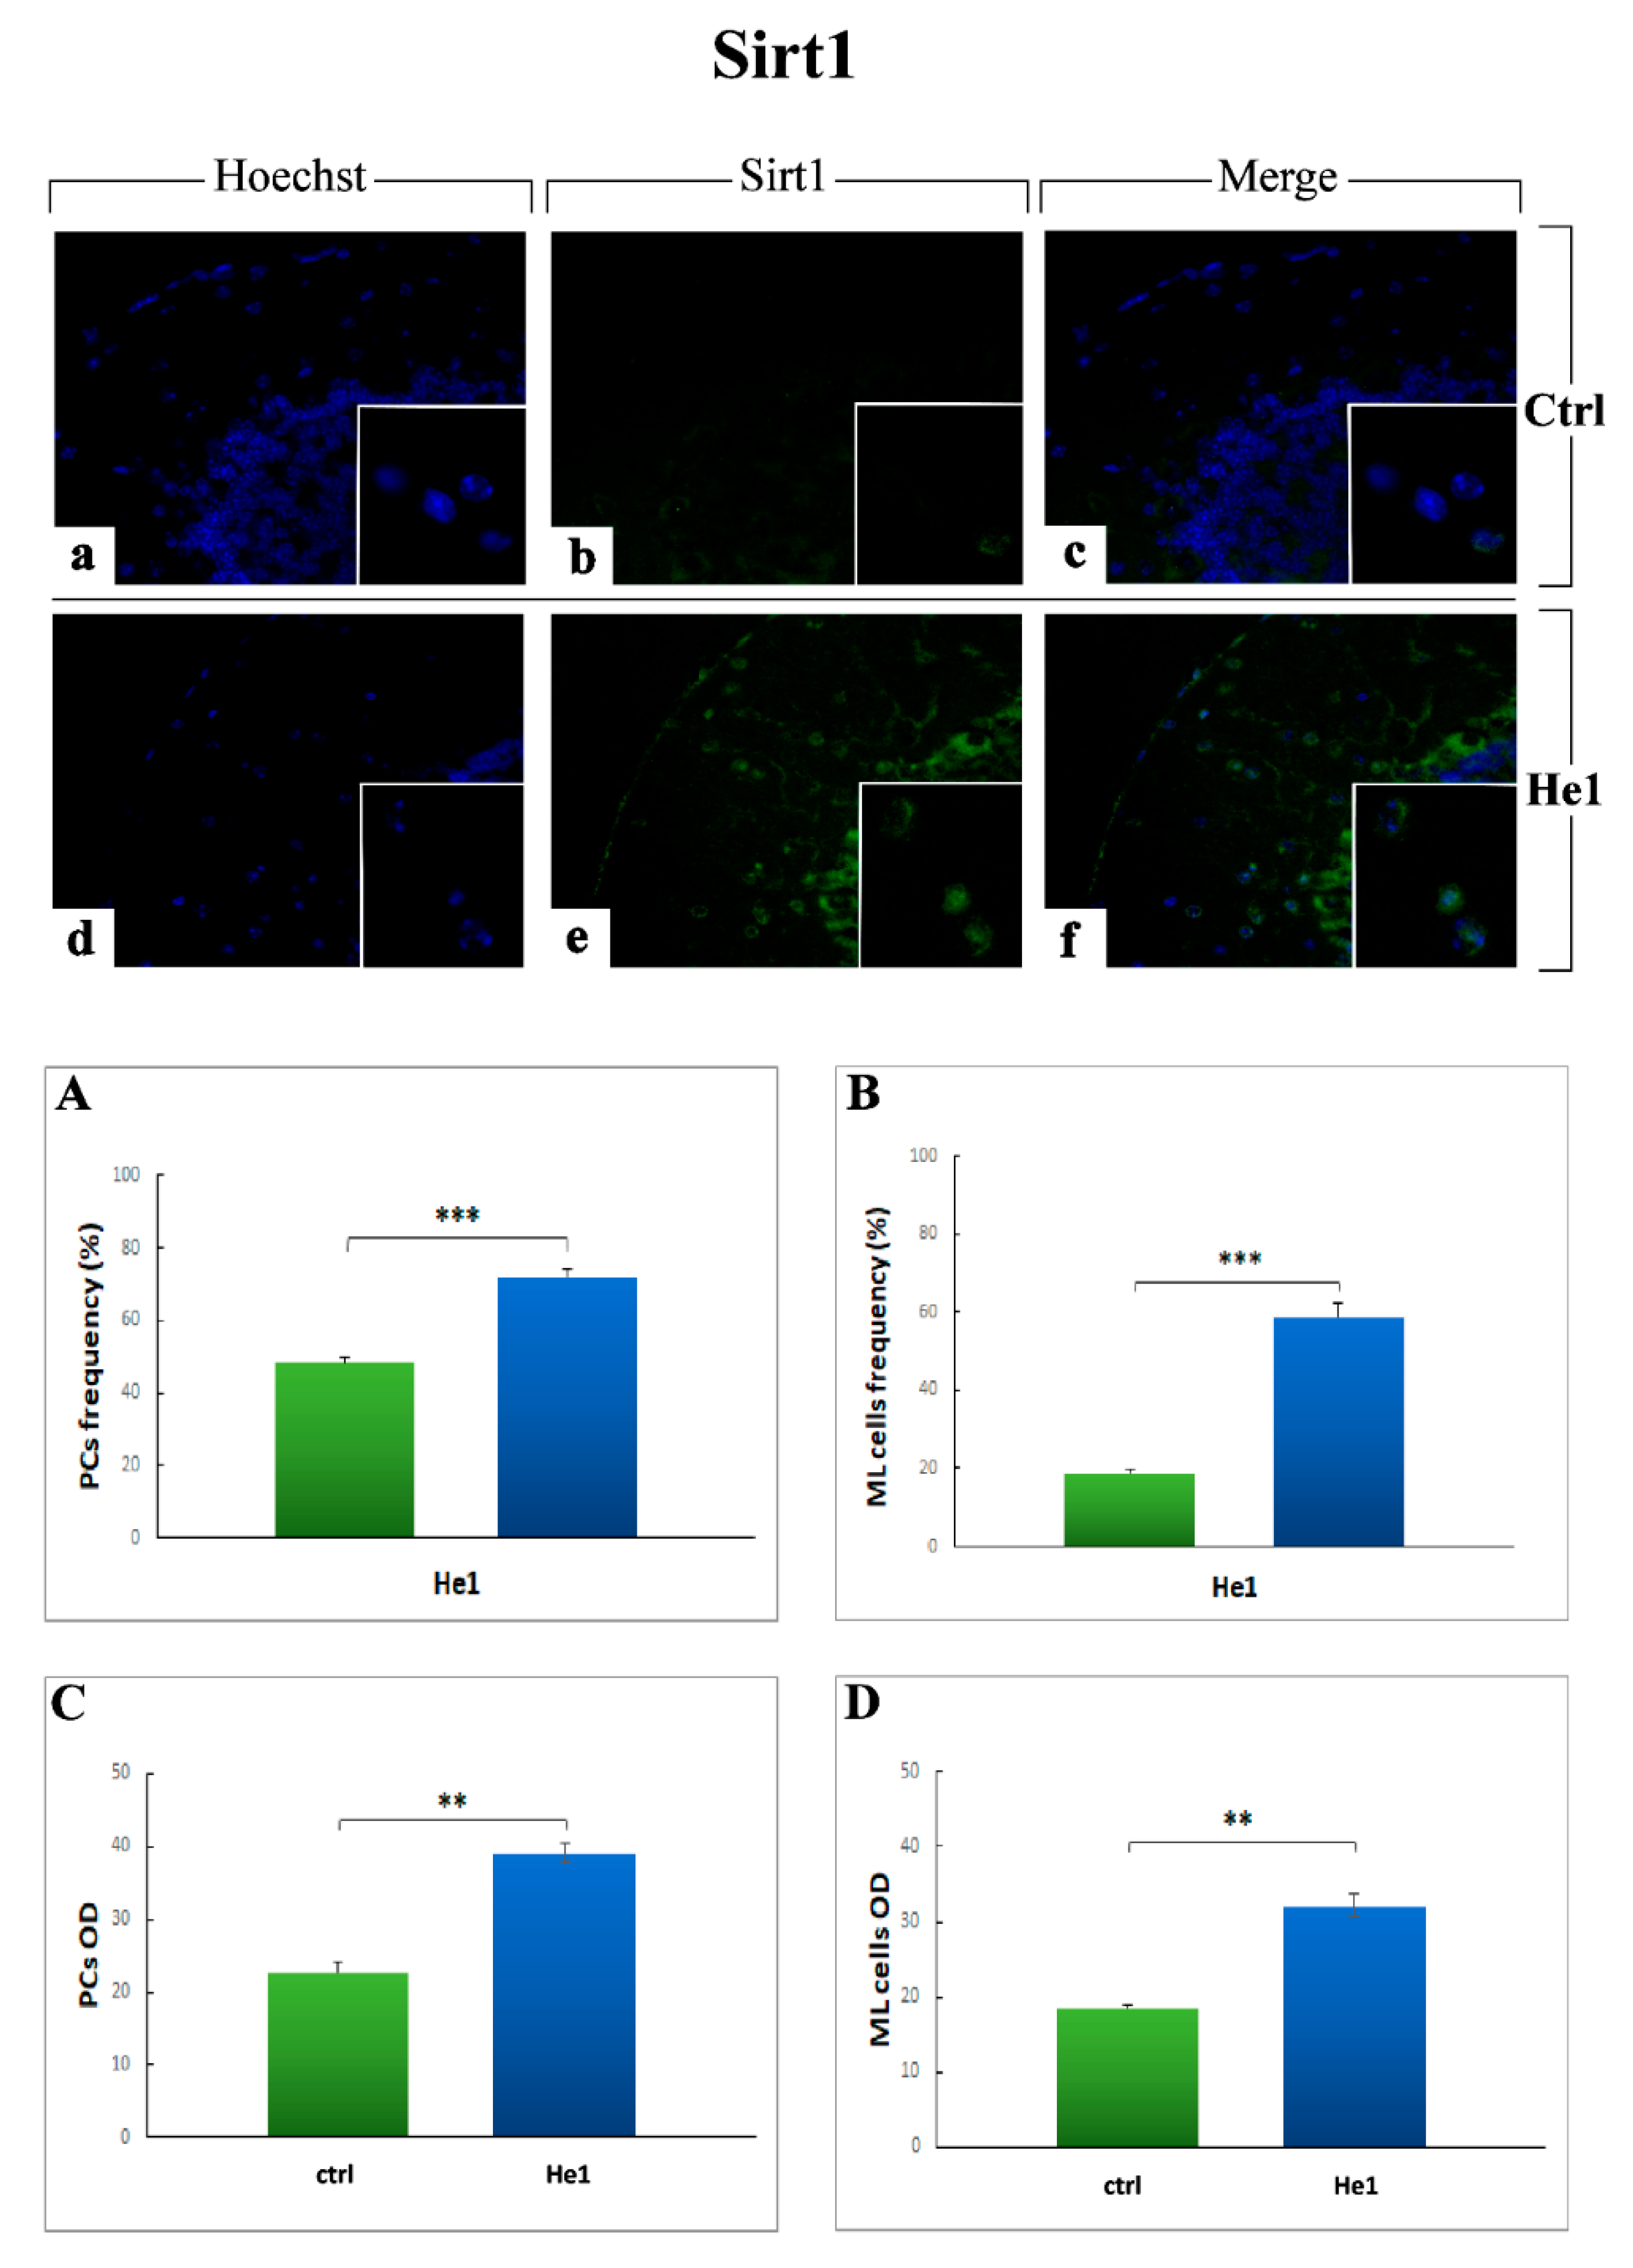
2.3.5. Key Longevity Regulator: SIRT1
3. Discussion
4. Materials and Methods
4.1. Animals and Treatments
4.2. Behavioral Tests and Locomotor Frailty Index
4.3. H. erinaceus
4.3.1. Extraction Procedures
4.3.2. HPLC-UV-ESI/MS Method
4.4. Tissue Sampling, Histology, Immunohistochemical and Immunofluorescence Evaluations
4.4.1. Cerebellar Specimens Preparation
4.4.2. Post-Embedding Cerebellar Volume Estimation
4.4.3. H&E and Nissl Staining
4.4.4. Picrosirius Red (PSR) Staining
4.4.5. Immunohistochemistry: Light and Fluorescence Microscopy Assessment
4.4.6. Histochemical, Immunohistochemical and Immunofluorescence Evaluations
4.5. Statistical Analysis
5. Conclusions
Author Contributions
Funding
Institutional Review Board Statement
Informed Consent Statement
Data Availability Statement
Acknowledgments
Conflicts of Interest
References
- Hamezah, H.S.; Durani, L.W.; Ibrahim, N.F.; Yanagisawa, D.; Kato, T.; Shiino, A.; Tanaka, S.; Damanhuri, H.A.; Ngah, W.Z.W.; Tooyama, I. Volumetric changes in the aging rat brain and its impact on cognitive and locomotor functions. Exp. Gerontol. 2017, 99, 69–79. [Google Scholar] [CrossRef]
- Cesari, M.; Prince, M.; Thiyagarajan, J.A.; De Carvalho, I.A.; Bernabei, R.; Chan, P.; Gutierrez-Robledo, L.M.; Michel, J.-P.; Morley, J.E.; Ong, P.; et al. Frailty: An Emerging Public Health Priority. J. Am. Med. Dir. Assoc. 2016, 17, 188–192. [Google Scholar] [CrossRef]
- Leng, S.; Chen, X.; Mao, G. Frailty syndrome: An overview. Clin. Interv. Aging 2014, 9, 433–441. [Google Scholar] [CrossRef] [Green Version]
- Pansarasa, O.; Pistono, C.; Davin, A.; Bordoni, M.; Mimmi, M.C.; Guaita, A.; Cereda, C. Altered immune system in frailty: Genetics and diet may influence inflammation. Ageing Res. Rev. 2019, 54, 100935. [Google Scholar] [CrossRef] [PubMed]
- Franceschi, C.; Capri, M.; Monti, D.; Giunta, S.; Olivieri, F.; Sevini, F.; Panourgia, M.P.; Invidia, L.; Celani, L.; Scurti, M.; et al. Inflammaging and anti-inflammaging: A systemic perspective on aging and longevity emerged from studies in humans. Mech. Ageing Dev. 2007, 128, 92–105. [Google Scholar] [CrossRef] [PubMed]
- Hubbard, R.E.; O’Mahony, M.S.; Savva, G.; Calver, B.L.; Woodhouse, K.W. Inflammation and frailty measures in older people. J. Cell. Mol. Med. 2009, 13, 3103–3109. [Google Scholar] [CrossRef] [Green Version]
- Ferrucci, L.; Fabbri, E. Inflammageing: Chronic inflammation in ageing, cardiovascular disease, and frailty. Nat. Rev. Cardiol. 2018, 15, 505–522. [Google Scholar] [CrossRef]
- Hodes, R.J.; Sierra, F.; Austad, S.N.; Epel, E.; Neigh, G.N.; Erlandson, K.M.; Schafer, M.J.; LeBrasseur, N.; Wiley, C.; Campisi, J.; et al. Disease drivers of aging. Ann. N. Y. Acad. Sci. 2016, 1386, 45–68. [Google Scholar] [CrossRef] [Green Version]
- Aranda, M.P.; Ray, L.A.; Al Snih, S.; Ottenbacher, K.J.; Markides, K.S. The Protective Effect of Neighborhood Composition on Increasing Frailty among Older Mexican Americans. J. Aging Health 2011, 23, 1189–1217. [Google Scholar] [CrossRef] [Green Version]
- Doba, N.; Tokuda, Y.; Goldstein, N.E.; Kushiro, T.; Hinohara, S. A pilot trial to predict frailty syndrome: The Japanese Health Research Volunteer Study. Exp. Gerontol. 2012, 47, 638–643. [Google Scholar] [CrossRef] [PubMed] [Green Version]
- Raji, M.A.; Al Snih, S.; Ostir, G.V.; Markides, K.S.; Ottenbacher, K.J. Cognitive Status and Future Risk of Frailty in Older Mexican Americans. J. Gerontol. Ser. A Boil. Sci. Med. Sci. 2010, 65, 1228–1234. [Google Scholar] [CrossRef]
- Chen, W.-T.; Chou, K.-H.; Liu, L.-K.; Lee, P.-L.; Lee, W.-J.; Chen, L.-K.; Wang, P.-N.; Lin, C.-P. Reduced cerebellar gray matter is a neural signature of physical frailty. Hum. Brain Mapp. 2015, 36, 3666–3676. [Google Scholar] [CrossRef]
- Samper-Ternent, R.; Al Snih, S.; Raji, M.A.; Markides, K.S.; Ottenbacher, K.J. Relationship between Frailty and Cognitive Decline in Older Mexican Americans. J. Am. Geriatr. Soc. 2008, 56, 1845–1852. [Google Scholar] [CrossRef] [PubMed]
- Ratto, D.; Corana, F.; Mannucci, B.; Priori, E.C.; Cobelli, F.; Roda, E.; Ferrari, B.; Occhinegro, A.; Di Iorio, C.; De Luca, F.; et al. Hericium erinaceus Improves Recognition Memory and Induces Hippocampal and Cerebellar Neurogenesis in Frail Mice during Aging. Nutrients 2019, 11, 715. [Google Scholar] [CrossRef] [PubMed] [Green Version]
- Liguori, I.; Russo, G.; Curcio, F.; Bulli, G.; Aran, L.; DELLA Morte, D.; Gargiulo, G.; Testa, G.; Cacciatore, F.; Bonaduce, D.; et al. Oxidative stress, aging, and diseases. Clin. Interv. Aging 2018, 13, 757–772. [Google Scholar] [CrossRef] [Green Version]
- Uchmanowicz, I. Oxidative Stress, Frailty and Cardiovascular Diseases: Current Evidence. Adv. Exp. Med. Biol. 2020, 1216, 65–77. [Google Scholar] [CrossRef] [PubMed]
- Cui, L.; Hofer, T.; Rani, A.; Leeuwenburgh, C.; Foster, T.C. Comparison of lifelong and late life exercise on oxidative stress in the cerebellum. Neurobiol. Aging 2009, 30, 903–909. [Google Scholar] [CrossRef] [Green Version]
- Nadkarni, N.K.; Nunley, K.A.; Aizenstein, H.; Harris, T.B.; Yaffe, K.; Satterfield, S.; Newman, A.B.; Rosano, C.; Health ABC Study. Association Between Cerebellar Gray Matter Volumes, Gait Speed, and Information-Processing Ability in Older Adults Enrolled in the Health ABC Study. J. Gerontol. Ser. A Boil. Sci. Med. Sci. 2014, 69, 996–1003. [Google Scholar] [CrossRef]
- Zhang, C.; Zhu, Q.; Hua, T. Aging of cerebellar Purkinje cells. Cell Tissue Res. 2010, 341, 341–347. [Google Scholar] [CrossRef]
- Jiang, S.; Wang, S.; Sun, Y.; Zhang, Q. Medicinal properties of Hericium erinaceus and its potential to formulate novel mushroom-based pharmaceuticals. Appl. Microbiol. Biotechnol. 2014, 98, 7661–7670. [Google Scholar] [CrossRef]
- Friedman, M. Chemistry, Nutrition, and Health-Promoting Properties of Hericium erinaceus (Lion’s Mane) Mushroom Fruiting Bodies and Mycelia and Their Bioactive Compounds. J. Agric. Food Chem. 2015, 63, 7108–7123. [Google Scholar] [CrossRef]
- Liu, J.-H.; Li, L.; Shang, X.-D.; Zhang, J.-L.; Tan, Q. Anti- Helicobacter pylori activity of bioactive components isolated from Hericium erinaceus. J. Ethnopharmacol. 2016, 183, 54–58. [Google Scholar] [CrossRef] [PubMed]
- Kim, S.P.; Moon, E.; Nam, S.H.; Friedman, M. Hericium erinaceus Mushroom Extracts Protect Infected Mice against Salmonella Typhimurium-Induced Liver Damage and Mortality by Stimulation of Innate Immune Cells. J. Agric. Food Chem. 2012, 60, 5590–5596. [Google Scholar] [CrossRef]
- Li, G.; Yu, K.; Li, F.; Xu, K.; Li, J.; He, S.; Cao, S.; Tan, G. Anticancer potential of Hericium erinaceus extracts against human gastrointestinal cancers. J. Ethnopharmacol. 2014, 153, 521–530. [Google Scholar] [CrossRef]
- Li, W.; Zhou, W.; Kim, E.-J.; Shim, S.H.; Kang, H.K.; Kim, Y.H. Isolation and identification of aromatic compounds in Lion’s Mane Mushroom and their anticancer activities. Food Chem. 2015, 170, 336–342. [Google Scholar] [CrossRef]
- Wu, T.; Xu, B. Antidiabetic and antioxidant activities of eight medicinal mushroom species from China. Int. J. Med. Mushrooms 2015, 17, 129–140. [Google Scholar] [CrossRef] [PubMed]
- Wang, X.-Y.; Yin, J.-Y.; Zhao, M.-M.; Liu, S.-Y.; Nie, S.-P.; Xie, M.-Y. Gastroprotective activity of polysaccharide from Hericium erinaceus against ethanol-induced gastric mucosal lesion and pylorus ligation-induced gastric ulcer, and its antioxidant activities. Carbohydr. Polym. 2018, 186, 100–109. [Google Scholar] [CrossRef] [PubMed]
- Liu, J.; Du, C.; Wang, Y.; Yu, Z. Anti-fatigue activities of polysaccharides extracted from Hericium erinaceus. Exp. Ther. Med. 2015, 9, 483–487. [Google Scholar] [CrossRef] [Green Version]
- Noh, H.J.; Yang, H.H.; Kim, G.S.; Lee, S.E.; Lee, D.Y.; Choi, J.H.; Kim, S.Y.; Lee, E.S.; Ji, S.H.; Kang, K.S.; et al. Chemical constituents of Hericium erinaceum associated with the inhibitory activity against cellular senescence in human umbilical vascular endothelial cells. J. Enzym. Inhib. Med. Chem. 2015, 30, 934–940. [Google Scholar] [CrossRef]
- Mori, K.; Inatomi, S.; Ouchi, K.; Azumi, Y.; Tuchida, T. Improving effects of the mushroom Yamabushitake (Hericium erinaceus) on mild cognitive impairment: A double-blind placebo-controlled clinical trial. Phytother. Res. 2009, 23, 367–372. [Google Scholar] [CrossRef]
- Tsai-Teng, T.; Chin-Chu, C.; Li-Ya, L.; Wan-Ping, C.; Chung-Kuang, L.; Chien-Chang, S.; Chi-Ying, H.F.; Chien-Chih, C.; Shiao, Y.-J. Erinacine A-enriched Hericium erinaceus mycelium ameliorates Alzheimer’s disease-related pathologies in APPswe/PS1dE9 transgenic mice. J. Biomed. Sci. 2016, 23, 49. [Google Scholar] [CrossRef] [Green Version]
- Zhang, J.; An, S.; Hu, W.; Teng, M.; Wang, X.; Qu, Y.; Liu, Y.; Yuan, Y.; Wang, D. The Neuroprotective Properties of Hericium erinaceus in Glutamate-Damaged Differentiated PC12 Cells and an Alzheimer’s Disease Mouse Model. Int. J. Mol. Sci. 2016, 17, 1810. [Google Scholar] [CrossRef] [PubMed]
- Nagano, M.; Shimizu, K.; Kondo, R.; Hayashi, C.; Sato, D.; Kitagawa, K.; Ohnuki, K. Reduction of depression and anxiety by 4 weeks Hericium erinaceus intake. Biomed. Res. 2010, 31, 231–237. [Google Scholar] [CrossRef] [Green Version]
- Vigna, L.; Morelli, F.; Agnelli, G.M.; Napolitano, F.; Ratto, D.; Occhinegro, A.; Di Iorio, C.; Savino, E.; Girometta, C.; Brandalise, F.; et al. Hericium erinaceus Improves Mood and Sleep Disorders in Patients Affected by Overweight or Obesity: Could Circulating Pro-BDNF and BDNF Be Potential Biomarkers? Evid.-Based Complement. Altern. Med. 2019, 2019, 7861297. [Google Scholar] [CrossRef] [Green Version]
- Cohen, N.; Cohen, J.; Asatiani, M.D.; Varshney, V.K.; Yu, H.-T.; Yang, Y.-C.; Li, Y.-H.; Mau, J.-L.; Wasser, S.P. Chemical Composition and Nutritional and Medicinal Value of Fruit Bodies and Submerged Cultured Mycelia of Culinary-Medicinal Higher Basidiomycetes Mushrooms. Int. J. Med. Mushrooms 2014, 16, 273–291. [Google Scholar] [CrossRef] [PubMed]
- Halliwell, B.; Cheah, I.K.; Tang, R.M.Y. Ergothioneine—A diet-derived antioxidant with therapeutic potential. FEBS Lett. 2018, 592, 3357–3366. [Google Scholar] [CrossRef] [Green Version]
- Tang, R.M.Y.; Cheah, I.K.-M.; Yew, T.S.K.; Halliwell, B. Distribution and accumulation of dietary ergothioneine and its metabolites in mouse tissues. Sci. Rep. 2018, 8, 1601. [Google Scholar] [CrossRef] [PubMed]
- Kerley, R.N.; McCarthy, C.; Kell, D.B.; Kenny, L.C. The potential therapeutic effects of ergothioneine in pre-eclampsia. Free. Radic. Biol. Med. 2018, 117, 145–157. [Google Scholar] [CrossRef] [PubMed]
- Williamson, R.D.; McCarthy, F.P.; Manna, S.; Groarke, E.; Kell, D.B.; Kenny, L.C.; McCarthy, C.M. L-(+)-Ergothioneine Significantly Improves the Clinical Characteristics of Preeclampsia in the Reduced Uterine Perfusion Pressure Rat Model. Hypertension 2020, 75, 561–568. [Google Scholar] [CrossRef]
- Song, T.-Y.; Lin, H.-C.; Chen, C.-L.; Wu, J.-H.; Liao, J.-W.; Hu, M.-L. Ergothioneine and melatonin attenuate oxidative stress and protect against learning and memory deficits in C57BL/6J mice treated with D-galactose. Free. Radic. Res. 2014, 48, 1049–1060. [Google Scholar] [CrossRef]
- Song, T.-Y.; Chen, C.-L.; Liao, J.-W.; Ou, H.-C.; Tsai, M. Ergothioneine protects against neuronal injury induced by cisplatin both in vitro and in vivo. Food Chem. Toxicol. 2010, 48, 3492–3499. [Google Scholar] [CrossRef]
- Moncaster, J.; Walsh, D.T.; Gentleman, S.M.; Jen, L.-S.; Aruoma, O.I. Ergothioneine treatment protects neurons against N-methyl-d-aspartate excitotoxicity in an in vivo rat retinal model. Neurosci. Lett. 2002, 328, 55–59. [Google Scholar] [CrossRef]
- Yang, N.-C.; Lin, H.-C.; Wu, J.-H.; Ou, H.-C.; Chai, Y.-C.; Tseng, C.-Y.; Liao, J.-W.; Song, T.-Y. Ergothioneine protects against neuronal injury induced by β-amyloid in mice. Food Chem. Toxicol. 2012, 50, 3902–3911. [Google Scholar] [CrossRef]
- Smith, E.; Ottosson, F.; Hellstrand, S.; Ericson, U.; Orho-Melander, M.; Fernandez, C.; Melander, O. Ergothioneine is associated with reduced mortality and decreased risk of cardiovascular disease. Heart 2019, 106, 691–697. [Google Scholar] [CrossRef] [PubMed] [Green Version]
- Servillo, L.; D’Onofrio, N.; Balestrieri, M.L. Ergothioneine Antioxidant Function: From Chemistry to Cardiovascular Therapeutic Potential. J. Cardiovasc. Pharmacol. 2017, 69, 183–191. [Google Scholar] [CrossRef]
- Gökçe, G.; Arun, M.Z.; Ertuna, E. Ergothioneine prevents endothelial dysfunction induced by mercury chloride. Exp. Ther. Med. 2018, 15, 4697–4702. [Google Scholar] [CrossRef]
- Koh, S.S.; Ooi, S.C.-Y.; Lui, N.M.-Y.; Qiong, C.; Ho, L.T.-Y.; Cheah, I.K.-M.; Halliwell, B.; Herr, D.R.; Ong, W.-Y. Effect of Ergothioneine on 7-Ketocholesterol-Induced Endothelial Injury. Neuromol. Med. 2021, 23, 184–198. [Google Scholar] [CrossRef] [PubMed]
- D’Onofrio, N.; Servillo, L.; Giovane, A.; Casale, R.; Vitiello, M.; Marfella, R.; Paolisso, G.; Balestrieri, M.L. Ergothioneine oxidation in the protection against high-glucose induced endothelial senescence: Involvement of SIRT1 and SIRT6. Free. Radic. Biol. Med. 2016, 96, 211–222. [Google Scholar] [CrossRef] [PubMed]
- Wasser, S. Medicinal mushroom science: Current perspectives, advances, evidences, and challenges. Biomed. J. 2014, 37, 345–356. [Google Scholar] [CrossRef] [PubMed]
- Rossi, P.; Cesaroni, V.; Brandalise, F.; Occhinegro, A.; Ratto, D.; Perrucci, F.; Lanaia, V.; Girometta, C.; Orru, G.; Savino, E. Dietary Supplementation of Lion’s Mane Medicinal Mushroom, Hericium erinaceus (Agaricomycetes), and Spatial Memory in Wild-Type Mice. Int. J. Med. Mushrooms 2018, 20, 485–494. [Google Scholar] [CrossRef]
- Brandalise, F.; Cesaroni, V.; Gregori, A.; Repetti, M.; Romano, C.; Orrù, G.; Botta, L.; Girometta, C.; Guglielminetti, M.L.; Savino, E.; et al. Dietary Supplementation ofHericium erinaceusIncreases Mossy Fiber-CA3 Hippocampal Neurotransmission and Recognition Memory in Wild-Type Mice. Evid.-Based Complement. Altern. Med. 2017, 2017, 3864340. [Google Scholar] [CrossRef] [PubMed] [Green Version]
- Corana, F.; Cesaroni, V.; Mannucci, B.; Baiguera, R.M.; Picco, A.M.; Savino, E.; Ratto, D.; Perini, C.; Kawagishi, H.; Girometta, C.E.; et al. Array of Metabolites in Italian Hericium erinaceus Mycelium, Primordium, and Sporophore. Molecules 2019, 24, 3511. [Google Scholar] [CrossRef] [Green Version]
- Chen, S.-Y.; Ho, K.-J.; Hsieh, Y.-J.; Wang, L.-T.; Mau, J.-L. Contents of lovastatin, γ-aminobutyric acid and ergothioneine in mushroom fruiting bodies and mycelia. LWT Food Sci. Technol. 2012, 47, 274–278. [Google Scholar] [CrossRef]
- Lee, W.Y.; Park, E.-J.; Ahn, J.K.; Ka, K.-H. Ergothioneine Contents in Fruiting Bodies and Their Enhancement in Mycelial Cultures by the Addition of Methionine. Mycobiology 2009, 37, 43–47. [Google Scholar] [CrossRef] [Green Version]
- Kalaras, M.D.; Richie, J.P.; Calcagnotto, A.; Beelman, R.B. Mushrooms: A rich source of the antioxidants ergothioneine and glutathione. Food Chem. 2017, 233, 429–433. [Google Scholar] [CrossRef] [PubMed]
- Raz, N.; Torres, I.J.; Spencer, W.D.; White, K.; Acker, J.D. Age-Related Regional Differences in Cerebellar Vermis Observed In Vivo. Arch. Neurol. 1992, 49, 412–416. [Google Scholar] [CrossRef]
- Raz, N.; Dupuis, J.H.; Briggs, S.D.; McGavran, C.; Acker, J.D. Differential Effects of Age and Sex on the Cerebellar Hemi-spheres and the Vermis: A Prospective MR Study. AJNR Am. J. Neuroradiol. 1998, 19, 65–71. [Google Scholar] [PubMed]
- Miller, T.D.; Ferguson, K.J.; Reid, L.M.; Wardlaw, J.M.; Starr, J.M.; Seckl, J.R.; Deary, I.J.; MacLullich, A.M.J. Cerebellar Vermis Size and Cognitive Ability in Community-Dwelling Elderly Men. Cerebellum 2012, 12, 68–73. [Google Scholar] [CrossRef]
- Paul, R.; Grieve, S.M.; Chaudary, B.; Gordon, N.; Lawrence, J.; Cooper, N.; Clark, C.R.; Kukla, M.; Mulligan, R.; Gordon, E. Relative contributions of the cerebellar vermis and prefrontal lobe volumes on cognitive function across the adult lifespan. Neurobiol. Aging 2009, 30, 457–465. [Google Scholar] [CrossRef]
- Chiang, C.-S.; Stalder, A.; Samimi, A.; Campbell, I.L. Reactive Gliosis as a Consequence of Interleukin-6 Expression in the Brain: Studies in Transgenic Mice. Dev. Neurosci. 1994, 16, 212–221. [Google Scholar] [CrossRef]
- Rothaug, M.; Becker-Pauly, C.; Rose-John, S. The role of interleukin-6 signaling in nervous tissue. Biochim. Biophys. Acta (BBA) Bioenerg. 2016, 1863, 1218–1227. [Google Scholar] [CrossRef]
- Imtiyaz, H.Z.; Simon, M.C. Hypoxia-Inducible Factors as Essential Regulators of Inflammation. Curr. Top. Microbiol. Immunol. 2010, 345, 105–120. [Google Scholar] [CrossRef] [Green Version]
- Yeo, E.-J. Hypoxia and aging. Exp. Mol. Med. 2019, 51, 1–15. [Google Scholar] [CrossRef]
- Alique, M.; Sánchez-López, E.; Bodega, G.; Giannarelli, C.; Carracedo, J.; Ramírez, R. Hypoxia-Inducible Factor-1α: The Master Regulator of Endothelial Cell Senescence in Vascular Aging. Cells 2020, 9, 195. [Google Scholar] [CrossRef] [Green Version]
- Gehmeyr, J.; Maghnouj, A.; Tjaden, J.; Vorgerd, M.; Hahn, S.; Matschke, V.; Theis, V.; Theiss, C. Disabling VEGF-Response of Purkinje Cells by Downregulation of KDR via miRNA-204-5p. Int. J. Mol. Sci. 2021, 22, 2173. [Google Scholar] [CrossRef]
- Castelli, V.; Benedetti, E.; Antonosante, A.; Catanesi, M.; Pitari, G.; Ippoliti, R.; Cimini, A.; D’Angelo, M. Neuronal Cells Rearrangement During Aging and Neurodegenerative Disease: Metabolism, Oxidative Stress and Organelles Dynamic. Front. Mol. Neurosci. 2019, 12, 132. [Google Scholar] [CrossRef] [PubMed] [Green Version]
- Bernard, J.A.; Seidler, R. Moving forward: Age effects on the cerebellum underlie cognitive and motor declines. Neurosci. Biobehav. Rev. 2014, 42, 193–207. [Google Scholar] [CrossRef] [PubMed] [Green Version]
- MacLullich, A.M.; Edmond, C.L.; Ferguson, K.J.; Wardlaw, J.M.; Starr, J.M.; Seckl, J.R.; Deary, I.J. Size of the neocerebellar vermis is associated with cognition in healthy elderly men. Brain Cogn. 2004, 56, 344–348. [Google Scholar] [CrossRef] [PubMed]
- Hulst, T.; van der Geest, J.N.; Thürling, M.; Goericke, S.; Frens, M.A.; Timmann, D.; Donchin, O. Ageing shows a pattern of cerebellar degeneration analogous, but not equal, to that in patients suffering from cerebellar degenerative disease. NeuroImage 2015, 116, 196–206. [Google Scholar] [CrossRef] [PubMed]
- Dimitrova, A.; Gerwig, M.; Brol, B.; Gizewski, E.R.; Forsting, M.; Beck, A.; Aurich, V.; Kolb, F.P.; Timmann, D. Correlation of cerebellar volume with eyeblink conditioning in healthy subjects and in patients with cerebellar cortical degeneration. Brain Res. 2008, 1198, 73–84. [Google Scholar] [CrossRef]
- Rogers, J.; Zornetzer, S.F.; Bloom, F.E.; Mervis, R.E. Senescent microstructural changes in rat cerebellum. Brain Res. 1984, 292, 23–32. [Google Scholar] [CrossRef]
- Yu, T.; Korgaonkar, M.S.; Grieve, S.M. Gray Matter Atrophy in the Cerebellum—Evidence of Increased Vulnerability of the Crus and Vermis with Advancing Age. Cerebellum 2016, 16, 388–397. [Google Scholar] [CrossRef] [PubMed]
- Raz, N. Aging of the Brain and Its Impact on Cognitive Performance: Integration of Structural and Functional Findings. In The Handbook of Aging and Cognition; Craik, F.I.M., Salthouse, T.A., Eds.; Lawrence Erlbaum Associates: Mahwah, NJ, USA, 2000; pp. 1–90. [Google Scholar]
- Murshed, K.A.; Ziylan, T.; Seker, M.; Cicekcibasi, A.E.; Acikgozoglu, S. Morphometric Assessment of Brain Stem and Cere-bellar Vermis with Midsagittal MRI: The Gender Differences and Effects of Age. Neuroanatomy 2003, 2, 35–38. [Google Scholar]
- Taman, F.D.; Kervancioglu, P.; Kervancioglu, A.S.; Turhan, B. The importance of volume and area fractions of cerebellar volume and vermian subregion areas: A stereological study on MR images. Childs Nerv. Syst. 2019, 36, 165–171. [Google Scholar] [CrossRef] [PubMed]
- Aniszewska, A.; Chłodzińska, N.; Bartkowska, K.; Winnicka, M.; Turlejski, K.; Djavadian, R. The expression of interleukin-6 and its receptor in various brain regions and their roles in exploratory behavior and stress responses. J. Neuroimmunol. 2015, 284, 1–9. [Google Scholar] [CrossRef] [PubMed]
- Belozor, O.S.; Yakovleva, D.A.; Potapenko, I.V.; Shuvaev, A.N.; Smolnikova, M.V.; Vasilev, A.; Pozhilenkova, E.A. Extracellular S100β Disrupts Bergman Glia Morphology and Synaptic Transmission in Cerebellar Purkinje Cells. Brain Sci. 2019, 9, 80. [Google Scholar] [CrossRef] [PubMed] [Green Version]
- Verkhratsky, A.; Zorec, R.; Rodriguez-Arellano, J.J.; Parpura, V. Neuroglia in Ageing. Adv. Exp. Med. Biol. 2019, 1175, 181–197. [Google Scholar] [CrossRef]
- Di Benedetto, S.; Müller, L. Aging, Immunity, and Neuroinflammation: The Modulatory Potential of Nutrition. Nutr. Immun. 2019, 301–322. [Google Scholar] [CrossRef]
- Cragnolini, A.B.; Montenegro, G.; Friedman, W.J.; Mascó, D.H. Brain-region specific responses of astrocytes to an in vitro injury and neurotrophins. Mol. Cell. Neurosci. 2018, 88, 240–248. [Google Scholar] [CrossRef]
- Matias, I.; Morgado, J.; Gomes, F.C.A. Astrocyte Heterogeneity: Impact to Brain Aging and Disease. Front. Aging Neurosci. 2019, 11, 59. [Google Scholar] [CrossRef] [Green Version]
- Trovato, A.; Siracusa, R.; Di Paola, R.; Scuto, M.; Fronte, V.; Koverech, G.; Luca, M.; Serra, A.; Toscano, M.; Petralia, A.; et al. Redox modulation of cellular stress response and lipoxin A4 expression by Coriolus versicolor in rat brain: Relevance to Alzheimer’s disease pathogenesis. Neurotoxicology 2016, 53, 350–358. [Google Scholar] [CrossRef] [PubMed]
- Trovato, A.; Siracusa, R.; Di Paola, R.; Scuto, M.; Ontario, M.L.; Bua, O.; Di Mauro, P.; Toscano, M.A.; Petralia, C.C.T.; Maiolino, L.; et al. Redox modulation of cellular stress response and lipoxin A4 expression by Hericium Erinaceus in rat brain: Relevance to Alzheimer’s disease pathogenesis. Immun. Ageing 2016, 13, 23. [Google Scholar] [CrossRef] [PubMed] [Green Version]
- Zhang, W.; Huang, Q.; Zeng, Z.; Wu, J.; Zhang, Y.; Chen, Z. Sirt1 Inhibits Oxidative Stress in Vascular Endothelial Cells. Oxidative Med. Cell. Longev. 2017, 2017, 7543973. [Google Scholar] [CrossRef] [Green Version]
- Choi, Y.J.; Kim, H.S.; Lee, J.; Chung, J.; Lee, J.S.; Choi, J.S.; Yoon, T.R.; Kim, H.K.; Chung, H.Y. Down-regulation of oxidative stress and COX-2 and iNOS expressions by dimethyl lithospermate in aged rat kidney. Arch. Pharmacal Res. 2014, 37, 1032–1038. [Google Scholar] [CrossRef] [PubMed]
- Frenkel-Denkberg, G.; Gershon, D.; Levy, A.P. The function of hypoxia-inducible factor 1 (HIF-1) is impaired in senescent mice. FEBS Lett. 1999, 462, 341–344. [Google Scholar] [CrossRef] [Green Version]
- Leiser, S.F.; Kaeberlein, M. The hypoxia-inducible factor HIF-1 functions as both a positive and negative modulator of aging. Biol. Chem. 2010, 391, 1131–1137. [Google Scholar] [CrossRef] [PubMed] [Green Version]
- Cvetanovic, M.; Patel, J.M.; Marti, H.; Kini, A.R.; Opal, P. Vascular endothelial growth factor ameliorates the ataxic phenotype in a mouse model of spinocerebellar ataxia type 1. Nat. Med. 2011, 17, 1445–1447. [Google Scholar] [CrossRef]
- Mahoney, E.R.; Dumitrescu, L.; Moore, A.M.; Cambronero, F.E.; De Jager, P.L.; Koran, M.E.I.; Petyuk, V.A.; Robinson, R.A.S.; Goyal, S.; Schneider, J.A.; et al. Brain expression of the vascular endothelial growth factor gene family in cognitive aging and alzheimer’s disease. Mol. Psychiatry 2021, 26, 888–896. [Google Scholar] [CrossRef] [Green Version]
- Lee, S.-H.; Lee, J.-H.; Lee, H.-Y.; Min, A.K.-J. Sirtuin signaling in cellular senescence and aging. BMB Rep. 2019, 52, 24–34. [Google Scholar] [CrossRef] [Green Version]
- Xu, C.; Wang, L.; Fozouni, P.; Evjen, G.; Chandra, V.; Jiang, J.; Lu, C.; Nicastri, M.; Bretz, C.; Winkler, J.D.; et al. SIRT1 is downregulated by autophagy in senescence and ageing. Nat. Cell Biol. 2020, 22, 1170–1179. [Google Scholar] [CrossRef]
- Chen, C.; Zhou, M.; Ge, Y.; Wang, X. SIRT1 and aging related signaling pathways. Mech. Ageing Dev. 2020, 187, 111215. [Google Scholar] [CrossRef]
- Satoh, A.; Brace, C.S.; Rensing, N.; Cliften, P.; Wozniak, D.F.; Herzog, E.; Yamada, K.A.; Imai, S.-I. Sirt1 Extends Life Span and Delays Aging in Mice through the Regulation of Nk2 Homeobox 1 in the DMH and LH. Cell Metab. 2013, 18, 416–430. [Google Scholar] [CrossRef] [Green Version]
- Li, I.-C.; Lee, L.-Y.; Tzeng, T.-T.; Chen, W.-P.; Chen, Y.-P.; Shiao, Y.-J.; Chen, C.-C. Neurohealth Properties of Hericium erinaceus Mycelia Enriched with Erinacines. Behav. Neurol. 2018, 2018, 5802634. [Google Scholar] [CrossRef] [PubMed] [Green Version]
- Li, I.-C.; Chang, H.-H.; Lin, C.-H.; Chen, W.-P.; Lu, T.-H.; Lee, L.-Y.; Chen, Y.-W.; Chen, Y.-P.; Chen, C.-C.; Lin, D.P.-C. Prevention of Early Alzheimer’s Disease by Erinacine A-Enriched Hericium erinaceus Mycelia Pilot Double-Blind Placebo-Controlled Study. Front. Aging Neurosci. 2020, 12, 155. [Google Scholar] [CrossRef]
- Ryu, S.; Kim, H.G.; Kim, J.Y.; Kim, S.Y.; Cho, K.-O. Hericium erinaceus Extract Reduces Anxiety and Depressive Behaviors by Promoting Hippocampal Neurogenesis in the Adult Mouse Brain. J. Med. Food 2018, 21, 174–180. [Google Scholar] [CrossRef] [PubMed]
- Cesaroni, V.; Brusoni, M.; Cusaro, C.M.; Girometta, C.; Perini, C.; Picco, A.M.; Rossi, P.; Salerni, E.; Savino, E. Phylogenetic Comparison between Italian and Worldwide Hericium Species (Agaricomycetes). Int. J. Med. Mushrooms 2019, 21, 943–954. [Google Scholar] [CrossRef] [PubMed]
- Bao, H.N.D.; Ushio, H.; Ohshima, T. Antioxidative Activity and Antidiscoloration Efficacy of Ergothioneine in Mushroom (Flammulina velutipes) Extract Added to Beef and Fish Meats. J. Agric. Food Chem. 2008, 56, 10032–10040. [Google Scholar] [CrossRef] [PubMed]
- Lee, D.G.; Kang, H.-W.; Park, C.-G.; Ahn, Y.-S.; Shin, Y. Isolation and identification of phytochemicals and biological activities of Hericium ernaceus and their contents in Hericium strains using HPLC/UV analysis. J. Ethnopharmacol. 2016, 184, 219–225. [Google Scholar] [CrossRef]
- Gregori, B.G.A.; Gerbec, E.T.B. Solid State Cultivation of Hericium erinaceus Biomass and Erinacine: A Production. J. Bioprocess. Biotech. 2015, 5, 1–5. [Google Scholar] [CrossRef] [Green Version]
- D’Angelo, E.U.; Rossi, P.; Taglietti, V. Voltage-dependent Kinetics of N-Methyl-d-aspartate Synaptic Currents in Rat Cerebellar Granule Cells. Eur. J. Neurosci. 1994, 6, 640–645. [Google Scholar] [CrossRef]
- Gyengesi, E.; Rangel, A.; Ullah, F.; Liang, H.; Niedermayer, G.; Asgarov, R.; Venigalla, M.; Gunawardena, D.; Karl, T.; Münch, G. Chronic Microglial Activation in the GFAP-IL6 Mouse Contributes to Age-Dependent Cerebellar Volume Loss and Impairment in Motor Function. Front. Neurosci. 2019, 13, 303. [Google Scholar] [CrossRef] [PubMed] [Green Version]
- Avwioro, G. Histochemical Uses of Haematoxylin-A Review. JPCS 2011, 1, 24–34. [Google Scholar]
- Kádár, A.; Wittmann, G.; Liposits, Z.; Fekete, C. Improved method for combination of immunocytochemistry and Nissl staining. J. Neurosci. Methods 2009, 184, 115–118. [Google Scholar] [CrossRef] [PubMed] [Green Version]
- Roda, E.; Barni, S.; Milzani, A.; Dalle-Donne, I.; Colombo, G.; Coccini, T. Single Silver Nanoparticle Instillation Induced Early and Persisting Moderate Cortical Damage in Rat Kidneys. Int. J. Mol. Sci. 2017, 18, 2115. [Google Scholar] [CrossRef] [Green Version]
- Junqueira, L.C.U.; Bignolas, G.; Brentani, R.R. Picrosirius staining plus polarization microscopy, a specific method for collagen detection in tissue sections. J. Mol. Histol. 1979, 11, 447–455. [Google Scholar] [CrossRef]
- Lattouf, R.; Younes, R.; Lutomski, D.; Naaman, N.; Godeau, G.; Senni, K.; Changotade, S. Picrosirius Red Staining. J. Histochem. Cytochem. 2014, 62, 751–758. [Google Scholar] [CrossRef] [PubMed] [Green Version]
- O’Callaghan, J.P. Neurotypic and gliotypic proteins as biochemical markers of neurotoxicity. Neurotoxicol. Teratol. 1988, 10, 445–452. [Google Scholar] [CrossRef]
- Tykhomyrov, A.A.; Pavlova, A.S.; Nedzvetsky, V.S. Glial Fibrillary Acidic Protein (GFAP): On the 45th Anniversary of Its Discovery. Neurophysiology 2016, 48, 54–71. [Google Scholar] [CrossRef]
- Tanaka, T.; Narazaki, M.; Kishimoto, T. IL-6 in Inflammation, Immunity, and Disease. Cold Spring Harb. Perspect. Biol. 2014, 6, a016295. [Google Scholar] [CrossRef] [PubMed]
- Di Stefano, A.; Coccini, T.; Roda, E.; Signorini, C.; Balbi, B.; Brunetti, G.; Ceriana, P. Blood MCP-1 levels are increased in chronic obstructive pulmonary disease patients with prevalent emphysema. Int. J. Chronic Obstr. Pulm. Dis. 2018, 13, 1691–1700. [Google Scholar] [CrossRef] [Green Version]
- Hua, X.; Chi, W.; Su, L.; Li, J.; Zhang, Z.; Yuan, X. ROS-induced Oxidative Injury involved in Pathogenesis of Fungal Keratitis via p38 MAPK Activation. Sci. Rep. 2017, 7, 10421. [Google Scholar] [CrossRef] [PubMed]
- Kobylarek, D.; Iwanowski, P.; Lewandowska, Z.; Limphaibool, N.; Szafranek, S.; Labrzycka, A.; Kozubski, W. Advances in the Potential Biomarkers of Epilepsy. Front. Neurol. 2019, 10, 685. [Google Scholar] [CrossRef] [PubMed]
- Abramson, S.B. Nitric oxide in inflammation and pain associated with osteoarthritis. Arthritis Res. Ther. 2008, 10, S2. [Google Scholar] [CrossRef] [PubMed] [Green Version]
- Kasapoglu, M.; Özben, T. Alterations of antioxidant enzymes and oxidative stress markers in aging. Exp. Gerontol. 2001, 36, 209–220. [Google Scholar] [CrossRef]
- Rodgers, J.T.; Lerin, C.; Gerhart-Hines, Z.; Puigserver, P. Metabolic adaptations through the PGC-1α and SIRT1 pathways. FEBS Lett. 2007, 582, 46–53. [Google Scholar] [CrossRef] [Green Version]


| Molecular Formula | Molecular Weight (g/moL) | Chemical Structure | ESI/MS Characteristic Ions (m/z) | ESI-MS/MS Fragment Ions (m/z) | Content (mg/g) |
|---|---|---|---|---|---|
| C9H15N3O2S | 229.3 | 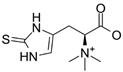 | 230 [M+H]+ 252 [M+Na]+ 268 [M+K]+ | 186 [M+H-CO2]+ 127 [M+H-CO2-(CH3)3N]+ | 0.58 (mycelium) 0.34 (sporophore) |
| Antigen | Immunogen | Manufacturer, Species, Mono-Polyclonal, Catalogue or Lot No., RRID | Diluted Used | |
|---|---|---|---|---|
| Primary antibodies | Anti-Interleukin-6 (M-19) | Purified antibody raised against a peptide mapping at the C-terminus of murine IL6 | Santa Cruz Biotechnology (Santa Cruz, CA, USA), Goat polyclonal IgG, Cat# sc-1265, RRID: AB_2127470 | 1:100 |
| Anti-Glial fibrillary acidic protein (C-19) | Purified antibody raised against a peptide mapping at the C-terminus of GFAP of human origin | Santa Cruz Biotechnology (Santa Cruz, CA, USA), Goat polyclonal IgG, Cat# sc-6170, RRID: AB_641021 | 1:100 | |
| Anti-Hypoxia-inducible factors-1α (H1α 67) | Purified antibody raised against amino acids 432–528 of HIF-1α of human origin | Santa Cruz Biotechnology (Santa Cruz, CA, USA), Mouse monoclonal IgG, Cat# sc- 53546, RRID: AB_629639 | 1:100 | |
| Anti-Superoxide Dismutase-1 (FL-154) | Purified antibody raised against amino acids 1–154 representing full-length human SOD-1 | Santa Cruz Biotechnology (Santa Cruz, CA, USA), Rabbit polyclonal IgG, Cat# sc-11407, RRID: AB_2193779 | 1:100 | |
| Anti-Nitric Oxide Synthases-2 (M19) | Purified antibody raised against a peptide mapping at the C-terminus of murine NOS-2 | Santa Cruz Biotechnology (Santa Cruz, CA, USA), Rabbit polyclonal IgG, Cat# sc-650, RRID: AB_631831 | 1:100 | |
| Anti-Cyclooxygenase-2 (M-19) | Purified antibody raised against a peptide mapping at the C-terminus of murine COX-2 | Santa Cruz Biotechnology (Santa Cruz, CA, USA), Goat polyclonal IgG, Cat# sc-1747, RRID: AB_2084976 | 1:100 | |
| Anti-Sirtuin1 | Purified antibody raised against amino acids 722–737 of murine SIRT1 with a C-terminal added lysine | Abcam (Cambridge, MA, USA), Rabbit polyclonal IgG, Cat# ab12193, RRID: AB_298923 | 1:100 | |
| Anti-VEGF | Purified antibody raised against a peptide corresponding to aa 1–140 of VEGF of human origin. | Santa Cruz Biotechnology (Santa Cruz, CA, USA), Rabbit polyclonal IgG, Cat# sc-507, RRID: AB_2212666 | 1:100 | |
| Secondary antibodies | Biotinylated goat anti-rabbit IgG | Gamma immunoglobulins | Vector Laboratories (Burlingame, CA, USA), Goat, lot# PK-6101, RRID: AB_2336820 | 1:200 |
| Biotinylated rabbit anti-goat IgG | Gamma immunoglobulins | Vector Laboratories (Burlingame, CA, USA), Rabbit, Cat# PK-6105, RRID: AB_2336824 | 1:200 | |
| Goat anti-Rabbit IgG (H+L) Cross-Adsorbed Secondary Antibody, Alexa Fluor 488 | Gamma Immunoglobulins (Heavy and Light chains) | Thermo Fisher scientific, Invitrogen (Waltham, MA USA), Cat# A-11008, RRID: AB_143165 | 1:100 |
Publisher’s Note: MDPI stays neutral with regard to jurisdictional claims in published maps and institutional affiliations. |
© 2021 by the authors. Licensee MDPI, Basel, Switzerland. This article is an open access article distributed under the terms and conditions of the Creative Commons Attribution (CC BY) license (https://creativecommons.org/licenses/by/4.0/).
Share and Cite
Roda, E.; Priori, E.C.; Ratto, D.; De Luca, F.; Di Iorio, C.; Angelone, P.; Locatelli, C.A.; Desiderio, A.; Goppa, L.; Savino, E.; et al. Neuroprotective Metabolites of Hericium erinaceus Promote Neuro-Healthy Aging. Int. J. Mol. Sci. 2021, 22, 6379. https://doi.org/10.3390/ijms22126379
Roda E, Priori EC, Ratto D, De Luca F, Di Iorio C, Angelone P, Locatelli CA, Desiderio A, Goppa L, Savino E, et al. Neuroprotective Metabolites of Hericium erinaceus Promote Neuro-Healthy Aging. International Journal of Molecular Sciences. 2021; 22(12):6379. https://doi.org/10.3390/ijms22126379
Chicago/Turabian StyleRoda, Elisa, Erica Cecilia Priori, Daniela Ratto, Fabrizio De Luca, Carmine Di Iorio, Paola Angelone, Carlo Alessandro Locatelli, Anthea Desiderio, Lorenzo Goppa, Elena Savino, and et al. 2021. "Neuroprotective Metabolites of Hericium erinaceus Promote Neuro-Healthy Aging" International Journal of Molecular Sciences 22, no. 12: 6379. https://doi.org/10.3390/ijms22126379