
Proteomics of Homeobox7 Enhanced Salt Tolerance in Mesembryanthemum crystallinum
by
 , , ,
, , ,
Xuemei Zhang
1,2 ,
,
Bowen Tan
2 ,
,
Dan Zhu
2,3,
Daniel Dufresne
4,
Tingbo Jiang
1,* and
Sixue Chen
2,5,6,* 1
State Key Laboratory of Tree Genetics and Breeding, Northeast Forestry University, Harbin 150040, China
2
Department of Biology, Genetics Institute, University of Florida, Gainesville, FL 32610, USA
3
College of Life Sciences, Qingdao Agricultural University, Qingdao 266109, China
4
Department of Chemistry, Florida Atlantic University, Boca Raton, FL 33431, USA
5
Plant Molecular and Cellular Biology Program, University of Florida, Gainesville, FL 32610, USA
6
Proteomics and Mass Spectrometry, Interdisciplinary Center for Biotechnology Research, University of Florida, Gainesville, FL 32610, USA
*
Authors to whom correspondence should be addressed.
Int. J. Mol. Sci. 2021, 22(12), 6390; https://doi.org/10.3390/ijms22126390
Submission received: 14 May 2021
/
Revised: 11 June 2021
/
Accepted: 13 June 2021
/
Published: 15 June 2021
(This article belongs to the Special Issue Plant Proteomic Research 4.0)
Abstract
:Mesembryanthemum crystallinum (common ice plant) is a halophyte species that has adapted to extreme conditions. In this study, we cloned a McHB7 transcription factor gene from the ice plant. The expression of McHB7 was significantly induced by 500 mM NaCl and it reached the peak under salt treatment for 7 days. The McHB7 protein was targeted to the nucleus. McHB7-overexpressing in ice plant leaves through Agrobacterium-mediated transformation led to 25 times more McHB7 transcripts than the non-transformed wild type (WT). After 500 mM NaCl treatment for 7 days, the activities of superoxide dismutase (SOD) and peroxidase (POD) and water content of the transgenic plants were higher than the WT, while malondialdehyde (MDA) was decreased in the transgenic plants. A total of 1082 and 1072 proteins were profiled by proteomics under control and salt treatment, respectively, with 22 and 11 proteins uniquely identified under control and salt stress, respectively. Among the 11 proteins, 7 were increased and 4 were decreased after salt treatment. Most of the proteins whose expression increased in the McHB7 overexpression (OE) ice plants under high salinity were involved in transport regulation, catalytic activities, biosynthesis of secondary metabolites, and response to stimulus. The results demonstrate that the McHB7 transcription factor plays a positive role in improving plant salt tolerance.
1. Introduction
Mesembryanthemum crystallinum (common ice plant) is a well-known halophyte plant native to Africa, southern Europe, and widely naturalized elsewhere [1]. It has been used as a health-promoting vegetable against diabetes [2]. Also, ice plant has been increasingly used as a model for studying abiotic stress responses [1] because it can shift from C3 photosynthesis to crassulacean acid metabolism (CAM) [3]. Halophytes, such as ice plants, tolerate high salinity by accumulating osmolytes in specific locations and balancing ion homeostasis, thereby maintaining osmolarity [4]. In ice plants, the special epidermal bladder cells (EBCs) on the leaf surface help to sequester salt [5]. The mesophyll cells and diurnal regulation of stomatal guard cells also improve water use efficiency of the ice plants [6].
Recent studies have revealed changes in ice plants at transcriptomic [7,8], intracellular ion [9], metabolite [10], and protein levels [11] in response to salt stress, with many candidate genes, proteins and metabolites of relevance having been identified. For example, McSnRK1 encodes a SNF1-related protein kinase, which functions as transcriptional modulator to control metabolic adaption, regulate Na+ flux and maintain Na/K homeostasis under salt stress [12]. Transgenic tobacco co-expressing an ice plant inositol methyl transferase gene, McIMT1, and a wild halophytic rice gene, PcINO1, accumulated high levels of inositol and methylated inositol. These metabolites may help to improve plant tolerance to high degrees of salt stress [13]. A sodium transporter, McHKT2, was reported to participate in plasma membrane Na+ transport and induce significant salt tolerance in transgenic Arabidopsis thaliana (A. thaliana) seedlings [14]. In addition, Kong et al. found that the transition from C3 to CAM photosynthesis takes place between day 5 and day 7 after treating ice plants with 500 mM NaCl. A total of 495 transcripts were significantly changed in guard cells based on RNA-Seq data analysis [15]. Among them, 18 transcription factors (TFs) were identified, including NAC (comp21521_c0_seq1 and Mcr002150.001), GRAS (Contig16446), WRKY (Contig20720), and homeobox family TFs (Contig9771, McHB7).
Homeobox genes have been found in all eukaryotic organisms [16]. They have a highly conserved homeodomain (HD), which contains a specific 60 amino acids (aa) DNA-binding motif. The HD forms a helix-turn-helix structure that regulates the expression of target genes [17,18]. The HD is always followed by a leucine zipper motif (35–42 aa), termed as homeobox associated leucine zipper (HALZ), which functions as a dimerization motif associated with the HD [19]. Homeobox genes are master regulators of plant development [20], meristem regulation [20], hormone mediation [21], and response to various environmental stimuli—including high salinity, drought, and extreme temperature [22]. For example, STIMPY/AtWOX9 was found to be important to the growth of vegetative shoot apical meristems and the maintenance of cell division in the shoot and root apex [23]. Overexpressing a poplar WUSCHEL-related homeobox gene, PagWOX11/12a, increased plant root biomass and enhanced drought tolerance [24,25]. WOX6/HOS9 is important for low temperature response in Arabidopsis by mediating the expression of genes independent of element-binding factor pathway [26]. In upland cotton, GhWOX10_Dt, GhWOX13b_At/Dt, and GhWOX13a_At/Dt were significantly induced by salt stress, and they may play vital roles in improving salt stress response of plants [27].
In Kong et al. [15], it was reported that McHB7 in ice plant was induced by 500 mM NaCl treatment for 7 days during the transition from C3 to CAM. Here we report additional results on McHB7 functions. Although it is common to analyze gene functions by genetic transformation, transformation of ice plants to study the functions of salinity-related genes is rare. The objective of this study is to analyze the ice plant TF McHB7 and its function in salt stress tolerance. We cloned the McHB7 from ice plant leaves and examined the molecular changes in transiently transformed plants compared to WT under control and high salinity conditions.
2. Results
2.1. Bioinformatic Analysis of McHB7
As shown in Supplementary Figure S1, the cloned McHB7 gene is 804 bp and it encodes a TF of 267 amino acids. According to NCBI blast, 10 homologous proteins from other species shared high homology, i.e., XP_021748183.1 (64.1%, Chenopodium quinoa), XP_021767274.1 (64.0%, Chenopodium quinoa), XP_021846961.1 (61.1%, Spinacia oleracea), XP_010692437.1 (61.6%, Beta vulgaris subsp. vulgaris), KNA21535.1 (61.1%, Spinacia oleracea), KMT20244.1 (61.7%, Beta vulgaris subsp. vulgaris), ACZ05048.1 (54.8%, Phytolaccaacinosa), PSS26255.1 (48.4%, Actinidia chinensis var. chinensis), QEQ92614.1 (48.9%, Populusussuriensis), and XP_002320889.1 (48.9%, Populustrichocarpa). Phylogenetic analysis (Figure 1A) and sequence alignment (Figure 1B) showed that these proteins contain two highly conserved domains: homeobox and homeobox associated HALZ. The basic region homeobox at the N terminal (Figure 1C) consists of three α-helices that form a helix-turn-helix DNA-binding motif, followed by a HALZ that is markedly different from those homeobox TFs in animal systems [19].
2.2. McHB7 TF Protein Localized to the Nucleus
CELLO2GO prediction showed the localization of McHB7 protein to the nucleus (Supplementary Figure S2). To validate this predicted result, A. tumefaciens GV3101 containing an McHB7-GFP construct (Figure 2A) and the positive control pCAMBIA1302-GFP were transiently expressed in tobacco leaves. As shown in Figure 2B, GFP signal of the positive control was observed in the cytosol and nucleus of whole epidermal cell, while the GFP signal of McHB7-GFP only existed in the nucleus. This result clearly showed the nuclear localization of the McHB7 TF.
2.3. Relative Expression of McHB7 in Ice Plant Leaves after Salt Stress Treatment
To investigate the expression pattern of McHB7 under high salinity, we treated the four-week-old ice plant seedlings with 500 mM NaCl and collected leaf samples each day for 14 days. When ice plants were salt-stressed for seven or 14 days, the growth was severely inhibited and the leaves were smaller when compared to the control seedlings (Figure 3A), and fresh weight of salt-treated leaves for seven days and 14 days was 49.9% and 24.9% that of control leaves, respectively (Supplementary Figure S3). According to the RT-qPCR results in Figure 3B, the relative expression of McHB7 in ice plant leaves was significantly induced by salt stress, reached the peak at day 7, up to almost 12 times higher than untreated leaves.
2.4. Overexpressing McHB7 in Transgenic Ice Plants
To verify the OE of McHB7 in the ice plant leaves, we performed RT-qPCR with McHB7-overexpressing (OE) plants and WT leaves. As shown in Figure 4A, 7 days after infiltration, the relative expression of McHB7 in OE ice plant was significantly higher (~25 times) than WT. According to the Western blot analysis, the Flag signal only existed in the McHB7-infiltrated leaves (Figure 4B). These data clearly showed successful OE of McHB7 at both the transcriptional and translational levels. However, there was no significant difference in SOD and POD activity or water content between OE plants and WT. MDA content of OE plants was a little lower than WT, but not statistically significant (Supplementary Figure S4).
2.5. Changes in Biochemical Parameters in Ice Plants after Salt Stress Treatment
One week after infiltration, the OE ice plant seedlings and WT were treated with 500 mM NaCl solution for another week (14 days after infiltration). As shown in Figure 5A, there were no significantly differences between the McHB7-overexpressingplants and WT under control conditions. After high salinity treatment for one week, the leaves of OE plants grew better than WT, with a fresh weight 1.2 times higher (Supplementary Figure S5). To further test whether the transgene is still functional, we carried out the Western blot with transgenic leaves under control and salt-treated conditions. The results showed that the Flag signal still existed in OE leaves 14 days after infiltration (Figure 5B). The control and OE leaves were collected for physiological analyses and histochemical staining. As described in Figure 5C–F, SOD activity, POD activity, and water content in OE were 1.2 ± 0.2, 1.5 ± 0.8, and 1.1 ± 0.5 times higher than in WT, respectively. Nitrotetrazoliumblue chloride (NBT) and3, 3′-diaminobenzidine (DAB) were used to analyze the levels of superoxide anions (O2−) and hydrogen peroxide (H2O2), respectively [28]. Evans blue was used to check cell death due to plasma membrane damage [29]. The staining intensities of OE and WT leaves were similar under control conditions (Figure 5G–I). After 500 mM NaCl treatment for seven days, the staining of WT was darker than the OE plants, and the relative intensity of NBT and DAB in WT was significantly higher than that of OE (Supplementary Figure S6). The result indicates overexpressing McHB7 led to lower accumulation of reactive oxygen species (ROS) and stronger capability for ROS removal.
2.6. Proteomic Changes Attributed to McHB7 Overexpression and Salinity Treatment
Total proteins of OE and WT plant leaves were isolated and label-free quantitative proteomics was carried out using LC-MS/MS. Under control and salt stress conditions, 1082 and 1072 proteins were identified, respectively (Figure 6A,B). GO functional classifications including biological process, cellular component and molecular function were generated by Proteome Discoverer. Of the biological processes, most proteins were involved in metabolic process, transport, stimulus response or regulation (Figure 6C). Most of them were categorized to the cytoplasm, membrane, ribosome, mitochondrion, and nucleus (Figure 6D). Many proteins played a role in catalytic activity, nucleotide, and metal ion binding. Some of them were involved in protein and RNA binding (Figure 6E). Among these identified proteins, 34 proteins had phosphorylation modifications under control and salt stress conditions (Supplementary Table S2). Most of them were chlorophyll a-b binding proteins, which belong to the light-harvesting complex and could be photo-regulated through reversible phosphorylation. These were reported to mediate the distribution of excitation energy in the photosystems I and II [30].
2.7. Differentially Expressed Proteins under Control and Salt Stress Treatment
To address the molecular mechanisms underlying McHB7 function, we conducted proteomics on WT and OE plants under control and salt stress conditions. Principal component analysis (PCA) is an unsupervised multivariate statistics-based detection method to reveal the differences and relationships between samples [31]. In this study, four replicates of each sample were grouped together, but different samples were classified into distinct clusters (Figure 7A). The results showed that samples from OE and WT leaves under control and salt treatment, respectively, occupied relatively independent spaces in the distribution map, especially OES was separated and far away from WTS.
Based on the identified proteins from OE and WT leaves, differentially expressed proteins (DEPs) were analyzed. There were 55 proteins—37 increased and 18 decreased under control conditions (Figure 7B; Supplementary Figure S7A). Among these, seven proteins were experienced fold change (OEC/WTC) greater than four magnitudes. Notably, K9NCW5, a ribulose bisphosphate carboxylase/oxygenase (Rubisco) homologue was about 33 times higher in OE. Other increased proteins like A0A022RVT2, A0A1S3 × 8Z6, B9GEL5, A0A200R0A6, A0A072UU34, and M1C498 were involved in nucleotide binding that may interact with the nuclear localized McHB7. After high salinity treatment, there were 110 proteins including 60 increased and 50 decreased (Figure 7C; Supplementary Figure S7B). Among these increased proteins, six including D7KSJ9, A0A1J3DHL5, F4Y5A9, A0A1D6LMX1, A9TQU1, and A0A1Q3C6B9 were responsive to stimulus and were all involved in metabolic process. Besides, some proteins like A2TJU5 were proteins sensitive to high salinity and played a role in transport activities. W8E1S1 and A0A0F7GYT3 are photosystem II CP43 reaction center protein and photosystem II reaction center PsbP family protein, respectively. Their induction by salt may help maintain photosynthesis activity under the stress condition. A0A022RMX1, A0A1J3DHL5 and A9PAY7 were involved in regulation of biological activities, A0A022RMX1 and A0A1J3DHL5 took a part in the cell organization and biogenesis, A9PAY7 worked in cellular homeostasis. A0A0D2Q010 and M0U9P1 were involved in biosynthesis of secondary metabolites, A0A0D2Q010 played a role in citrate acid cycle, and M0U9P1was involved in glycine, serine, and threonine metabolism. A Venn Diagram shows that nine proteins were increased in McHB7-overexpressing leaves and after high salinity treatment (Figure 7D). Of these, the relative expression of K9NCW5, A0A178UQY1, A0A2P5EU89, A0A022RVT2, A0A078G853, and D7KSJ9 was 33.09, 8.04, 3.24, 2.89, 2.31, and 2.06 times higher in OE vs. WT, respectively, under control conditions. However, they were elevated to 35.65, 21.84, 6.1298, 3.62, 3.46, and 11.62 times, respectively, under high salinity. Interestingly, A0A075M528, A0A022RT96, A0A2J6MJ80, and A0A2R4KXR9 were decreased in transgenic plant leaves while being significantly increased after the salt stress treatment.
Also, we found that among the 1082 and 1072 proteins profiled under control and salt stress, 22 (2%) proteins were uniquely found under control conditions, while 11 (1%) were uniquely found after salt stress treatment (Supplementary Figure S8). Among these 11 proteins, G3XDJ4, A0A1Z1CK67, and C8CS23 were adenosine triphosphate (ATP) synthase subunits that are important for the formation of energy storage molecule ATP [32]. Besides, 7 of the 11 proteins including A0A2P5PX19, I1IJ13, A0A1Z1CK67, E9LWD6, I1INX4, and A0A1S3BNT8 were increased after salt stress treatment.
3. Discussion
In this study, we cloned a salt-stress responsive transcription factor McHB7 from an ice plant with a highly conserved HD and a variable HALZ domain. Using a popular Agrobacterium-mediated transformation method [33,34], we were able to obtain transient transgenic ice plants and confirmed OE of the transgene McHB7 by both qPCR and Western blot after infiltration for 7 and 14 days (Figure 4 and Figure 5). Western blot analysis is important to show increase of McHB7 without affecting the total protein level [35]. This work was necessary to demonstrate transformation efficiency and genetic manipulation of ice plant. The ability to test gene functions through reverse genetics in calcitrant native system is a breakthrough. Many studies have used heterologous systems—e.g., A. thaliana and Nicotiana benthamiana (N. benthamiana)—for testing gene functions [36,37,38]. While heterologous systems are useful, in vivo research is always more applicable. Interestingly, the transgene expression in the ice plant appears to be long lasting, in contrast to the N. benthamiana system that often lasts a short time [39]. Here, OE of the McHB7 gene in ice plant leaves prolonged for two weeks after infiltration (Figure 5).
Salinity is a major abiotic stress factor that can induce water deficit [40], leading to an accumulation of ROS (e.g., O2−, H2O2, and hydroxyl radical (OH−)) that damage cell membranes and essential molecules like DNA, proteins, and lipids [41,42]. With the OE ice plants, we examined the different physiological parameters including SOD, POD, MDA, and water content in the WT and OE plants under salt stress treatment. SOD is known to function as a primary O2− scavenger [43]. POD is an oxidoreductase that detoxifies H2O2 [44]. MDA is often used as an indicator of oxidative membrane lipid damage [45]. Water content is used to reflect general stress tolerance and water use efficiency [46]. The results clearly showed that OE of McHB7 effectively increased the activities of SOD and POD, which reduce ROS levels and damage under salt stress. McHB7 OE improved plant development and growth under salinity stress by maintaining ion homeostasis and water balance.
Proteomics analysis suggested that many proteins were increased or decreased in the McHB7 overexpressing plants compared to WT. For example, K9NCW5 (Rubisco), a key enzyme involved in the first step of carbon fixation in photosynthesis [47]. It was reported that the small subunit of Rubisco was coded by nuclear genes [48,49]. Here we showed that McHB7 protein was localized within the nucleus and that OE of McHB7 in ice plant increased the abundance of Rubisco, indicating that McHB7 is likely a positive regulator of carbon fixation. The abundance of Rubisco in OE plants was significantly elevated under both control and stress conditions, which showed McHB7 may function in the process of photosynthesis by mediating the expression of the proteins. More experiments are needed to uncover the relationship between McHB7 and Rubisco. D7KSJ9 is known to play an important role in response to stimulus and regulation [50]. Its protein level is two times higher in OE plants than in the WT before salt stress. After salt stress, its protein level increased about 12 times in the OE plants compared to WT. A0A0D2Q010 is an ATP-citrate synthase beta chain protein and known to participate in the citrate cycle [51]. It was also increased in OE plants after salt treatment. These results suggest that McHB7 is involved in stress response through regulating stress and energy-related proteins as a master switch.
Since the ice plant genome has not been published, we used the corresponding Arabidopsis homolog to determine potential HB7 binding sites in the 5-kb upstream promoter of AtHB7 (AT2G46680.1) by searching PlantCARE (http://bioinformatics.psb.ugent.be/webtools/plantcare/html/) (accessed on 1 May 2021). Several cis-acting elements related to light-regulation like the LAMP-element, ACE, GT1-motif, 3-AF1 binding site, Sp1, and chs-CMA1a were found (Supplementary Table S3), which could be bound by numerous proteins [52]. Among these elements GT1-motif was reported in Rubisco, which was regulated at the transcriptional level through light-responsive pathway [53]. In addition, numerous stress-responsive elements like an oxidative stress-responsive element as-1 were found in the promoter region of AtHB7. The binding activity of as-1 could be stimulated by oxidative stress [54]. However, salt stress was considered to induce osmotic stress and enhance accumulation of ROS in plant cells [55]. Surprisingly, several proteins that were related to oxidative phosphorylation like AOA078JRB4, B9HTA1, and I1J2V1 were identified in OE plants and the abundances of these proteins were increased compared to WT. This indicates McHB7 might function as a stress response TF induced by high salinity to enhance the stress tolerance of plants through regulation of oxidative-related proteins. MBS, LTR, and TC-rich repeats were also reported to respond to various abiotic stresses [56]. Some hormone-responsive cis-elements including ABRE, GARE-motif, TGACG-motif, P-box, TATC-box, and TCA-element were identified which were known to be responsive to abscisic acid, gibberellin, methyl jasmonate, or salicylic acid [56]. The results suggest that McHB7 is a signal for stresses dependent on the hormonal signaling pathway. Interestingly, according to our proteomics, we found the protein A0AOJ8BHN7 was identified under control and salt stress conditions and elevated in the OE plants. It is also involved in plant hormone signal transduction based on GO analysis.
Protein functions may be informed by their interacting networks. The homologous gene of McHB7 in Arabidopsis is AtHB7. They share 41.3% identity at the amino acid level (Supplementary Figure S9A) with high similarity in the HD and HAZL domains. According to String network analysis, four proteins—AtHB5, RD26, ABI2, and ABF3—were found to be tightly associated with AtHB7 at high confidence (confidence > 0.7) (Supplementary Figure S9B). Among them, AtHB5 acts as a positive regulator of ABA-responsiveness and mediates the inhibitory effect of ABA on growth [57]. RD26 encodes a NAC transcription factor and participates in ABA-mediated dehydration response [58]. ABI2 encodes a phosphatase 2C protein and regulates numerous ABA responses [59]. ABF3 encodes an ABA-responsive element-binding protein and can respond to stress and abscisic acid [60]. AtHB7 is also transcriptionally regulated in an ABA-dependent pathway [61]. It may interact with these ABA-related proteins and mediate the response to adverse environmental effects. In addition, it was reported that ABA-induced AtHB7 can promote leaf development, chlorophyll synthesis, and reduce stomatal conductance in mature plants [62]. Also, AtHB12 functions as a positive transcriptional regulator of PP2C genes and plays a vital role in response to water deficit [63]. The proteomics data and String network analysis provides a functional context of McHB7, which can be explored further in the future studies.
4. Materials and Methods
4.1. Plant Materials and Salt Stress Treatment
Mesembryanthemum crystallinum seeds were sowed into the moist soil in a growth chamber at 12-h (26 °C) light/12-h dark (18 °C) cycle. Seven days later, the seedlings with four leaves were transplanted to the 946 mL foam cups and watered with 50 mL 0.5× Hoagland’s solution each day. One-month-old ice plants were used for transformation and salt treatment. For high salinity stress, the plants were irrigated with 50 mL 500 mM NaCl in 0.5× Hoagland’s solution every day. The control plants were irrigated with 50 mL 0.5× Hoagland’s solution.
4.2. Cloning and Sequence Analysis of McHB7 Gene
A total of 100 mg leaf material from an individual ice plant was collected and ground in liquid nitrogen into a fine powder. Total RNA was extracted according to the instructions of a RNeasy® Plant Mini Kit (QIAGEN, Germantown, MD, USA). The RNA was then reversely transcribed into cDNA following a protocol of ProtoScript® II First Strand cDNA Synthesis Kit (New England BioLabs, Ipswich, MA, USA). Based on the sequence information obtained from RNA-Seq [15], a pair of specific primers cMcHB7 (Supplementary Table S1) were designed for PCR amplification of the McHB7 open-reading-frame (ORF). With the NCBI database, the amino acid of McHB7 was used to blast for homologous proteins. A phylogenetic tree was constructed with MEGA 7 and multi-sequence alignment was analyzed by BioEdit (Version 7.2). Pfam database (http://pfam.xfam.org, accessed on 8 May 2021) was applied for conserved motifs prediction, and online software WebLogo (https://weblogo.berkeley.edu/logo.cgi, accessed on 8 May 2021) was used for motif visualization.
4.3. Subcellular Localization of McHB7 Protein
The subcellular localization of McHB7 protein was predicted by online software CELLO2GO (http://cello.life.nctu.edu.tw/cello2go, accessed on 8 May 2021). Briefly, the amino acid sequence of McHB7 was pasted to the software in FASTA format, and blast-searched in Eukaryote (E-value 0.001). To confirm the predicted result, the ORF without stop codon of McHB7 was PCR amplified using a pair of primers gMcHB7 (Supplementary Table S1), which contains NcoI and Spe I restriction sites, respectively. Then the PCR fragment was ligated to a plant expression vector pCAMBIA1302 with a green fluorescent protein mGFP5. The recombinant plasmid called McHB7-GFP was transformed into Agrobacterium tumefaciens GV3101. McHB7-GFP and the positive control pCAMBIA1302 agrobacteria were cultured in a LB broth liquid medium containing 50 mg/mL kanamycin and 25 mg/mL rifampicin to an OD600 of 0.8–1.0. The agrobacteria were collected by centrifugation and resuspended in a MES solution containing 100 mM MES (pH 5.8), 100 mM MgCl2, and 100 µM acetosyringone (As) and used for transformation. N. benthamiana seedlings were grown in the growth chamber conditions, and two-month-old tobacco leaves were used for infiltration with blunt-end micro-syringe [33]. Each leaf was injected with 500 µL Agrobacterium, and four replicate experiments were done. Two days later, the GFP signal was observed using a confocal laser scanning microscope (Zeiss, Jena, Germany).
4.4. McHB7 Gene Expression Analysis
To investigate the relative expression of McHB7 in the leaves of ice plant under high salinity conditions, one-month-old ice plant seedlings were irrigated with 50 mL 500 mM NaCl solution each day for 14 days. The second pair of leaves were harvested and midveins discarded for RNA extraction. Each sample has four biological replicates and three technical replicates. Plasma membrane intrinsic protein 1; 2 (McPIP1; 2) was used as the internal reference. The 2× SYBR Green qPCR Master Mix kit (Bimake, Houston, TX, USA) was used for RT-qPCR using a CFX96 171 Touch™ Real-Time PCR Detection System (Bio-Rad, Hercules, CA, USA). Real-time primers are listed in Supplemental Table S1. The relative expression in different samples was calculated using the 2−ΔΔCt method [64]. Based on Student’s t-test, bars in the figures correspond to standard deviation. A star indicates p-value < 0.05, two stars indicate p-value < 0.01, and three stars indicate p-value < 0.001.
4.5. McHB7 Overexpression Vector Contruction and Plant Transient Transformation
Based on the McHB7 sequence, a pair of primers pMcHB7 contains Bam HI and Xba I, respectively, was designed (Supplementary Table S1). The reverse primer contained the sequence of 3× Flag tag. The ORF without stop codon was ligated to an Agrobacterium binary vector pCAMBIA1300, which confers kanamycin (Kan) resistance. The recombinant plasmid was transformed into Agrobacterium tumefaciens GV3101 for plant transformation and selected on LB medium with 50 mg/mL Kan. A modified Agrobacterium-mediated transformation method was used to transform the leaves of four-week-old ice plants [34]. GV3101 with the recombinant plasmid pMcHB7 was grown in 25 mL LB liquid medium containing 50 mg/mL Kan and 25 mg/mL rifampicin overnight at 28 ℃. The cells were collected by centrifugation at 10,000 rpm for 10 min at room temperature, and then resuspended into 154 mM NaCl solution with 100 µM As. The OD600 was adjusted to 0.8–1.0 for infection. The second pair of expanded leaves was injected with 500 µL of the agrobacterial cultures using a needle-less syringe. The control wild type (WT) plants were injected with the same solution without agrobacteria. Seven days later, the injected leaves were harvested for further analyses. Each sample had four replicates.
4.6. Protein Extraction and Validation of Transgenic Ice Plant
A phenol method was used for protein extraction [6]. Infiltrated ice plant leaves (1 g fresh weight) were ground into powder by motor and pestle. A total of 3 mL extraction buffer (100 mM Tris-HCl, pH 8.8, 10 mM EDTA, 0.9 M Sucrose, 20 mM 2-Mercaptoethanol, 1× protease inhibitor cocktail, and 1 mM PMSF) and 3 mL Tris-saturated phenol were added into the protein powder, and then transferred to a centrifugation tube, and vortexed at 4 °C for 1 h. The samples were centrifuged at 4 °C, 15,000× g for 15 min. The upper layer was transferred to a new tube carefully, then five times volume of 0.1 M ammonium acetate in 100% methanol was added for protein precipitation. The samples were placed in −20 °C overnight. After centrifugation at 4 °C, 15,000× g for 15 min, the supernatant was removed. The precipitate was washed, resuspended in 80% acetone, and transferred to a new 2 mL centrifuge tube, placed in −20 °C for 20 min. After centrifugation at 4 °C, 13,000 rpm for 15 min, and washing again with 100% acetone, the protein pellet was dissolved in 150 µL dissolution buffer (6 M Urea, 1 mM EDTA, 1% SDS, and 50 mM Tris-HCl, pH 8.5). Protein quantification was determined by using a Bradford assay (Thermo Scientific, San Jose, CA, USA) following manufacturer’s instructions. Equal amounts of proteins were loaded on a 10% SDS-PAGE gel. Four biological replicates were conducted for each sample.
For Western blot analysis [65,66], proteins in the SDS-PAGE gel were transferred onto a nitrocellulose immobilization membrane (PerkinElmer Life Sciences, Boston, MA, USA) at constant amperage (0.01 A overnight at 4 °C). Protein loading was assessed by Ponceau S staining. The membrane was washed several times by TBST buffer (50 mM Tris base, 150 mM NaCl, 0.1% Tween 20, pH7.4) and blocked by blocking buffer (5% non-fat milk in TBST buffer) for 1 h. Then, the membrane was incubated with a primary anti-Flag monoclonal antibody (Sigma-Aldrich, Saint Louis, MO, USA) that was diluted into 1 mL TBST buffer (at 1:5000 dilution) and 30 mg no-fat milk for 2 h. After washing the membrane five times by TBST, 5 min. each time, the membrane was incubated by a secondary anti-IgG antibody that was diluted into 1 mL TBST (at 1:10,000) for 1 h. The membrane was washed five times in TBST, then incubated with Western blot signal enhancer reagent (Thermo Scientific™ Pierce™ Western Blot Signal Enhancer, Walham, MA, USA) for 5 min and detected by chemiluminescence using an Amersham Imager 600 (GE Healthcare, Marlborough, MA 01752, USA).
4.7. Biochemical Analysis of Antioxidative System Components and ROS
Physiological parameters including superoxide SOD, POD, MDA, and water content of transgenic ice plant seedlings and WT control were measured according to previously published methods [67]. Histochemical staining is an important technique for visualizing biological structures and detection of ROS, including O2−, H2O2, hydroxyl radical (OH−), singlet oxygen, and lipid hydroperoxides [68]. In this study, DAB, NBT, and Evans blue were carried out according to published methods [69,70]. Four biological replicates were conducted for each treatment and a Student’s t-test was used for statistical analysis.
4.8. Liquid Chromatography Mass Spectrometry (LC-MS/MS) and Data Analysis
The protein samples from four biological replicates of WT control and four biological replicates of transgenic plants were digested with trypsin as previously described [6]. Liquid chromatography tandem mass spectrometry (LC−MS/MS) was carried out on an Easy-nLC 1200 system (Thermo Fisher Scientific Inc., Germering, DE, USA) coupled with a Q-Exactive HF Orbitrap mass spectrometer (Thermo FisherScientific Inc., San Jose, CA, USA). The peptides were separated by an Acclaim PepMap100 C18 column (250 mm × 75 μm; 2 μm-C18) (Thermo Fisher Scientific Inc., San Jose, CA, USA) with 3 h gradient at the flow rate of 0.35 µL/min. The LC gradient was: 0–5 min, 2% B; 140 min, 35% B; 160 min, 100% B; 165 min, 100% B; 170 min, 2% B; 180 min, 2% B, run stop. The MS was operated between MS scan and MS/MS scan automatically with a cycle time of 3 s. Eluted peptides were detected in the Orbitrap MS at a resolution of 120 K with a scan range of 350–1800 m/z, and the most abundant ions bearing 2–7 charges were selected for MS/MS analysis. Automatic gain control (AGC) for the full MS scan was set as 200,000 with maximum injection time (MIT) as 50 ms, and AGC Target of 10,000 and MIT of 35 ms were set for the MS/MS scan. The MS/MS scan used quadrupole isolation mode, high energy collision-induced dissociation (HCD) activation energy, and 35% collision energy, and Orbitrap detection. A dynamic exclusion time of 30 s was applied to prevent repeated sequencing of the most abundant peptides.
Proteome Discoverer™ 2.4 (Thermo Fisher Scientific, Bremen, Germany) was used for protein identification. The SEQUEST algorithm in the Proteome Discoverer was used to process raw data files. Spectra were searched using the TAIR10 protein database with the following parameters: 10 ppm mass tolerance for MS1 and 0.02 Retention Time tolerance as mass tolerance for MS2, two maximum missed tryptic cleavage sites, a fixed modification of carbamidomethylation (+57.021) on cysteine residues, dynamic modifications of (oxidation of methionine (+15.996) and phosphorylation (+79.966) on tyrosine, serine, and threonine. Search results were filtered at 1% false discovery rate (FDR) and peptide confidence level was set for at least two unique peptides per protein for protein identification. Relative protein abundance in the samples was measured using label-free quantification in the Proteome Discoverer 2.4. Proteins identified and quantified in all 4 out of 4 biological samples were used, and no imputation was performed. Peptides in the control and transgenic samples were quantified as area under the chromatogram peak. The data were normalized by medium and generalized logarithm transformation (Log2). The heatmap was generated using online software MetaboAnalyst 5.0 (https://www.metaboanalyst.ca, accessed on 15 April 2021). Functional categorization was built by Proteome Discoverer software and venn diagram was made by Venny 2.1.0 (https://bioinfogp.cnb.csic.es/tools/venny, accessed on 1 May 2021). Protein network analysis was conducted using String (https://string-db.org/cgi/network, accessed on 1 May 2021).
5. Conclusions
In this study, we cloned McHB7 TF gene from ice plant leaves, and successfully obtained transient McHB7 OE plants. Under salt stress, ROS and cell death tend to increase in WT. Overexpressing McHB7 helped to counteract these changes and maintain ROS homeostasis. The results of biochemical and proteomic analyses showed McHB7 TF exerts a positive effect on the response to high salinity in ice plant. This work provides a quick and effective method for testing gene functions in the native plant species. Identification of genes directly regulated by this salinity responsive TF, as well as its molecular complexes, are interesting future research directions. The findings about McHB7 may inform molecular breeding and biotechnological efforts towards enhancing crop resilience and productivity.
Supplementary Materials
The following are available online at https://www.mdpi.com/article/10.3390/ijms22126390/s1. Figure S1: Cloning McHB7 from ice plant leaves, Figure S2: Subcellular localization prediction with CELLO2GO, Figure S3: Leaf fresh weight measurement of WT and McHB7 OE plants, Figure S4: Physiological parameters in of WT and McHB7 OE plants, Figure S5: Leaf fresh weight measurement of WT and McHB7 OE plants, Figure S6: Relative quantification of levels of H2O2 and O2− in ice plant leaves based on NBT and DAB staining, Figure S7: Significantly increased proteins in transgenic ice plant leaves under control and salt stress treatment, Figure S8: Identified proteins under control and salt stress conditions, Table S1: List of primers sequences for cloning and quantitative real-time PCR, Table S2: List of phosphorylated proteins, Table S3: Cis-acting elements in the upstream promoter of AtHB7.
Author Contributions
S.C. and T.J. designed research. X.Z. conducted experiments and wrote the manuscript draft. B.T. and D.Z. performed proteomic data analysis. D.D. acquired LC-MS/MS data and analyzed the data. S.C. and T.J. finalized the manuscript for submission. All authors have read and agreed to the published version of the manuscript.
Funding
This work was supported by the University of Florida and China Scholarship Council (201906600017).
Institutional Review Board Statement
Not applicable.
Informed Consent Statement
Not applicable.
Data Availability Statement
The proteomics data have been deposited to the ProteomeXchange Consortium via the PRIDE partner repository with the data set identifier PXD025961 (userID: [email protected]; password: M1rQA2wo).
Acknowledgments
The authors thank Aneirin Lott from Plant Molecular and Cellular Biology Program at University of Florida for critical reading and editing of the manuscript.
Conflicts of Interest
The authors have no conflicts of interest to declare.
References
- Bohnert, H.J.; Cushman, J.C. The ice plant cometh: Lessons in abiotic stress tolerance. J. Plant Growth Regul. 2000, 19, 334–346. [Google Scholar] [CrossRef]
- Kim, Y.J.; Kim, H.M.; Kim, H.M.; Lee, H.R.; Jeong, B.R.; Lee, H.J.; Kim, H.J.; Hwang, S.J. Growth and phytochemicals of ice plant (Mesembryanthemum crystallinum L.) as affected by various combined ratios of red and blue LEDs in a closed-type plant production system. J. Appl. Res. Med. Aromat. Plants 2021, 20, 100267. [Google Scholar] [CrossRef]
- Kim, Y.J.; Kim, H.M.; Kim, H.M.; Jeong, B.R.; Lee, H.J.; Kim, H.J.; Hwang, S.J. Ice plant growth and phytochemical concentrations are affected by light quality and intensity of monochromatic light-emitting diodes. Hortic. Environ. Biotechnol. 2018, 59, 529–536. [Google Scholar] [CrossRef]
- Agarie, S.; Shimoda, T.; Shimizu, Y.; Baumann, K.; Sunagawa, H.; Kondo, A.; Ueno, O.; Nakahara, T.; Nose, A.; Cushman, J.C. Salt tolerance, salt accumulation, and ionic homeostasis in an epidermal bladder-cell-less mutant of the common ice plant Mesembryanthemum crystallinum. J. Exp. Bot. 2007, 58, 1957–1967. [Google Scholar] [CrossRef] [PubMed]
- Winter, K.; Holtum, J.A. The effects of salinity, crassulacean acid metabolism and plant age on the carbon isotope composition of Mesembryanthemum crystallinum L., a halophytic C3-CAM species. Planta 2005, 222, 201–209. [Google Scholar] [CrossRef] [PubMed]
- Guan, Q.; Kong, W.; Zhu, D.; Zhu, W.; Dufresne, C.; Tian, J.; Chen, S. Comparative proteomics of Mesembryanthemum crystallinum guard cells and mesophyll cells in transition from C3 to CAM. J. Proteom. 2021, 231, 104019. [Google Scholar] [CrossRef]
- Tsukagoshi, H.; Suzuki, T.; Nishikawa, K.; Agarie, S.; Ishiguro, S.; Higashiyama, T. RNA-seq analysis of the response of the halophyte, Mesembryanthemum crystallinum (ice plant) to high salinity. PLoS ONE 2015, 10, e0118339. [Google Scholar] [CrossRef]
- Oh, D.H.; Barkla, B.J.; Vera-Estrella, R.; Pantoja, O.; Lee, S.Y.; Bohnert, H.J.; Dassanayake, M. Cell type-specific responses to salinity–the epidermal bladder cell transcriptome of Mesembryanthemum crystallinum. New Phytol. 2015, 207, 627–644. [Google Scholar] [CrossRef]
- Barkla, B.J.; Vera-Estrella, R.; Raymond, C. Single-cell-type quantitative proteomic and ionomic analysis of epidermal bladder cells from the halophyte model plant Mesembryanthemum crystallinum to identify salt-responsive proteins. BMC Plant. Biol. 2016, 16, 110. [Google Scholar] [CrossRef] [Green Version]
- Barkla, B.J.; Vera-Estrella, R. Single-cell comparative metabolomics of epidermal bladder cells from the halophyte Mesembryanthemum crystallinum. Front. Plant. Sci. 2015, 6, 435. [Google Scholar] [CrossRef] [Green Version]
- Cosentino, C.; di Silvestre, D.; Fischer-Schliebs, E.; Homann, U.; de Palma, A.; Comunian, C.; Mauri, P.L.; Thiel, G. Proteomic analysis of Mesembryanthemum crystallinum leaf microsomal fractions finds an imbalance in V-ATPase stoichiometry during the salt-induced transition from C3 to CAM. Biochem. J. 2013, 450, 407–415. [Google Scholar] [CrossRef] [PubMed] [Green Version]
- Hwang, H.H.; Wang, C.H.; Huang, H.W.; Chiang, C.P.; Chi, S.F.; Huang, F.C.; Yen, H.E. Functional analysis of McSnRK1 (SNF1-related protein kinase 1) in regulating Na/K homeostasis in transgenic cultured cells and roots of halophyte Mesembryanthemum crystallinum. Plant Cell Rep. 2019, 38, 915–926. [Google Scholar] [CrossRef]
- Patra, B.; Ray, S.; Richter, A.; Majumder, A.L. Enhanced salt tolerance of transgenic tobacco plants by co-expression of PcINO1 and McIMT1 is accompanied by increased level of myo-inositol and methylated inositol. Protoplasma 2010, 245, 143–152. [Google Scholar] [CrossRef] [PubMed]
- Nishijima, T.; Furuhashi, M.; Sakaoka, S.; Morikami, A.; Tsukagoshi, H. Ectopic expression of Mesembryanthemum crystallinum sodium transporter McHKT2 provides salt stress tolerance in Arabidopsis thaliana. Biosci. Biotechnol. Biochem. 2017, 81, 2139–2144. [Google Scholar] [CrossRef] [PubMed] [Green Version]
- Kong, W.; Yoo, M.J.; Zhu, D.; Noble, J.D.; Kelley, T.M.; Kirst, M.; Assmann, S.M.; Chen, S. Molecular changes in Mesembryanthemum crystallinum guard cells underlying the C3 to CAM transition. Plant. Mol. Biol. 2020, 103, 653–667. [Google Scholar] [CrossRef]
- Mukherjee, K.; Brocchieri, L.; Bürglin, T.R. A comprehensive classification and evolutionary analysis of plant homeobox genes. Mol. Biol. Evol. 2009, 26, 2775–2794. [Google Scholar] [CrossRef] [Green Version]
- Ariel, F.D.; Manavella, P.A.; Dezar, C.A.; Chan, R.L. The true story of the HD-Zip family. Trends Plant. Sci. 2007, 12, 419–426. [Google Scholar] [CrossRef]
- Li, Y.; Zhu, Y.; Yao, J.; Zhang, S.; Wang, L.; Guo, C.; Nocker, S.; Wang, X. Genome-wide identification and expression analyses of the homeobox transcription factor family during ovule development in seedless and seeded grapes. Sci. Rep. 2017, 7, 1–16. [Google Scholar] [CrossRef] [Green Version]
- Jain, M.; Tyagi, A.K.; Khurana, J.P. Genome-wide identification, classification, evolutionary expansion and expression analyses of homeobox genes in rice. FEBS J. 2008, 275, 2845–2861. [Google Scholar] [CrossRef]
- Mittempergher, J.B.; Morelli, G.; Ruberti, I. A dynamic balance between gene activation and repression. Genes Dev. 2005, 19, 2811–2815. [Google Scholar]
- Nakamura, M.; Katsumata, H.; Abe, M.; Yabe, N.; Komeda, Y.; Yamamoto, K.T.; Takahashi, T. Characterization of the class IV homeodomain-leucine zipper gene family in Arabidopsis. Plant Physiol. 2006, 141, 1363–1375. [Google Scholar] [CrossRef] [PubMed] [Green Version]
- Shen, W.; Li, H.; Teng, R.; Wang, Y.; Wang, W.; Zhuang, J. Genomic and transcriptomic analyses of HD-Zip family transcription factors and their responses to abiotic stress in tea plant (Camellia sinensis). Genomics 2019, 111, 1142–1151. [Google Scholar] [CrossRef] [PubMed]
- Wu, X.; Dabi, T.; Weigel, D. Requirement of homeobox gene STIMPY/WOX9 for Arabidopsis meristem growth and maintenance. Curr. Biol. 2005, 15, 436–440. [Google Scholar] [CrossRef] [PubMed] [Green Version]
- Wang, L.; Li, Z.; Wen, S.; Wang, J.; Zhao, S.; Lu, M. WUSCHEL-related homeobox gene PagWOX11/12a responds to drought stress by enhancing root elongation and biomass growth in poplar. J. Exp. Bot. 2020, 71, 1503–1513. [Google Scholar] [CrossRef]
- Liu, R.; Wang, R.; Lu, M.; Wang, L. WUSCHEL-related homeobox gene PagWOX11/12a is involved in drought tolerance through modulating reactive oxygen species scavenging in poplar. Plant Signal. Behav. 2020, 16, 1866312. [Google Scholar] [CrossRef]
- Zhu, J.; Shi, H.; Lee, B.; Damsz, B.; Cheng, S.; Stirm, V.; Zhu, J.K.; Hasegawa, P.M.; Bressan, R.A. An Arabidopsis homeodomain transcription factor gene, HOS9, mediates cold tolerance through a CBF-independent pathway. Proc. Natl. Acad. Sci. USA 2004, 101, 9873–9878. [Google Scholar] [CrossRef] [PubMed] [Green Version]
- Yang, Z.; Gong, Q.; Qin, W.; Yang, Z.; Cheng, Y.; Lu, L.; Ge, X.; Zhang, C.; Wu, Z.; Li, F. Genome-wide analysis of WOX genes in upland cotton and their expression pattern under different stresses. BMC Plant Biol. 2017, 17, 1–17. [Google Scholar] [CrossRef]
- Wang, C.F.; Huang, L.L.; Buchenauer, H.; Han, Q.M.; Zhang, H.C.; Kang, Z.S. Histochemical studies on the accumulation of reactive oxygen species (O2− and H2O2) in the incompatible and compatible interaction of wheat-Puccinia striiformis f. sp. tritici. Physiol. Mol. Plant Pathol. 2007, 71, 230–239. [Google Scholar] [CrossRef]
- Cohen, J.A.; Edwards, T.N.; Liu, A.W.; Hirai, T.; Jones, M.R.; Wu, J.; Li, Y.; Zhang, S.; Ho, J.; Davis, B.M.; et al. Cutaneous TRPV1+ neurons trigger protective innate type 17 anticipatory immunity. Cell 2019, 178, 919–932.e14. [Google Scholar] [CrossRef]
- Yang, D.H.; Paulsen, H.; Andersson, B. The N-terminal domain of the light-harvesting chlorophyll a/b-binding protein complex (LHCII) is essential for its acclimative proteolysis. FEBS Lett. 2000, 466, 385–388. [Google Scholar] [CrossRef] [Green Version]
- Yang, Y.; Wang, B.; Fu, Y.; Shi, Y.; Chen, F.; Guan, H.; Liu, L.; Zhang, C.; Zhu, P.; Liu, Y.; et al. HS-GC-IMS with PCA to analyze volatile flavor compounds across different production stages of fermented soybean whey tofu. Food Chem. 2021, 346, 128880. [Google Scholar] [CrossRef] [PubMed]
- Duan, L.; He, Q.; Wang, K.; Yan, X.; Cui, Y.; Möhwald, H.; Li, J. Adenosine triphosphate biosynthesis catalyzed by FoF1 ATP synthase assembled in polymer microcapsules. Angew. Chem. 2007, 119, 7126–7130. [Google Scholar] [CrossRef]
- Wydro, M.; Kozubek, E.; Lehmann, P. Optimization of transient Agrobacterium-mediated gene expression system in leaves of Nicotiana benthamiana. Acta Biochim. Pol. 2006, 53, 289–298. [Google Scholar] [CrossRef] [PubMed]
- Hwang, H.H.; Wang, C.H.; Chen, H.H.; Ho, J.F.; Chi, S.F.; Huang, F.C.; Yen, H.E. Effective Agrobacterium-mediated transformation protocols for callus and roots of halophyte ice plant (Mesembryanthemum crystallinum). Bot. Stud. 2019, 60, 1–15. [Google Scholar] [CrossRef] [Green Version]
- Mahmood, T.; Yang, P.C. Western blot: Technique, theory, and trouble shooting. N. Am. J. Med. Sci. 2012, 4, 429. [Google Scholar]
- Zhang, T.; Chhajed, S.; Schneider, J.D.; Feng, G.; Silveira, J.A.; Song, W.; Chen, S. Proteomic characterization of MPK4 signaling network and putative substrates. Plant Mol. Biol. 2019, 101, 325–339. [Google Scholar] [CrossRef]
- Zhang, T.; Schneider, J.D.; Lin, C.; Koh, J.; Chen, S. Proteomics data of SNF1-related protein kinase 2.4 interacting proteins revealed by immunoprecipitation-mass spectrometry. Data Brief 2020, 32, 106326. [Google Scholar] [CrossRef]
- Fang, P.; Yan, H.; Chen, F.; Peng, Y. Overexpression of maize ZmHDZIV14 increases abscisic acid sensitivity and mediates drought and salt stress in Arabidopsis and tobacco. Plant Mol. Biol. Rep. 2020, 39, 275–287. [Google Scholar] [CrossRef]
- Zhang, T.; Lin, C.; Schneider, J.D.; Geng, S.; Ma, T.; Lawrence, S.R.; Dufresne, C.P.; Harmon, A.C.; Chen, S. MPK4 phosphorylation dynamics and interacting proteins in plant immunity. J. Proteome Res. 2019, 18, 826–840. [Google Scholar] [CrossRef]
- Sairam, R.K.; Srivastava, G.C. Changes in antioxidant activity in sub-cellular fractions of tolerant and susceptible wheat genotypes in response to long term salt stress. Plant Sci. 2002, 162, 897–904. [Google Scholar] [CrossRef]
- Hernandez, J.A.; Corpas, F.J.; Gomez, M.; del Rio, L.A.; Sevilla, F. Salt-induced oxidative stress mediated by activated oxygen species in pea leaf mitochondria. Physiol. Plant. 1993, 89, 103–110. [Google Scholar] [CrossRef]
- Fadzilla, N.M.; Finch, R.P.; Burdon, R.H. Salinity, oxidative stress and antioxidant responses in shoot cultures of rice. J. Exp. Bot. 1997, 48, 325–331. [Google Scholar] [CrossRef]
- Esfandiari, E.; Shekari, F.; Shekari, F.; Esfandiari, M. The effect of salt stress on antioxidant enzymes’ activity and lipid peroxide ation on the wheat seedling. Not. Bot. Horti Agrobot. Cluj-Napoca 2007, 35, 48. [Google Scholar]
- Baque, M.A.; Hahn, E.J.; Paek, K. Induction mechanism of adventitious root from leaf explants of Morindacitrifolia as affected by auxin and light quality. In Vitro Cell. Dev. Biol. Plant 2010, 46, 71–80. [Google Scholar] [CrossRef]
- Kong, W.; Liu, F.; Zhang, C.; Zhang, J.; Feng, H. Non-destructive determination of Malondialdehyde (MDA) distribution in oilseed rape leaves by laboratory scale NIR hyperspectral imaging. Sci. Rep. 2016, 6, 1–8. [Google Scholar] [CrossRef]
- González, L.; González-Vilar, M. Determination of relative water content. In Handbook of Plant Ecophysiology Techniques; Springer: Dordrecht, The Netherlands, 2001; pp. 207–212. [Google Scholar]
- Darabi, M.; Seddigh, S. Computational study of biochemical properties of Ribulose-1,5-Bisphosphate Carboxylase/Oxygenase (RuBisCO) enzyme in C3 plants. J. Plant Biol. 2017, 60, 35–47. [Google Scholar] [CrossRef]
- Spreitzer, R.J. Role of the Rubisco Small Subunit; University of Nebraska: Lincoln, NE, USA, 2016. [Google Scholar]
- Andersson, I.; Backlund, A. Structure and function of Rubisco. Plant. Physiol. Biochem. 2008, 46, 275–291. [Google Scholar] [CrossRef] [PubMed]
- Kaur, A.; Pati, P.K.; Pati, A.M.; Nagpal, A.K. Physico-chemical characterization and topological analysis of pathogenesis-related proteins from Arabidopsis thaliana and Oryza sativa using in-silico approaches. PLoS ONE 2020, 15, e0239836. [Google Scholar] [CrossRef]
- Verschueren, K.H.G.; Blanchet, C.; Felix, J.; Vos, D.D.; Bloch, Y.; Beeumen, J.V.; Suergun, D.; Gutsche, I.; Savvides, S.N.; Verstraete, K. Structure of ATP citrate lyase and the origin of citrate synthase in the Krebs cycle. Nature 2019, 568, 571–575. [Google Scholar] [CrossRef] [PubMed]
- Terzaghi, W.B.; Cashmore, A.R. Light-regulated transcription. Annu. Rev. Plant. Biol. 1995, 46, 445–474. [Google Scholar] [CrossRef]
- Lam, E.; Chua, N.H. GT-1 binding site confers light responsive expression in transgenic tobacco. Science 1990, 248, 471–474. [Google Scholar] [CrossRef]
- Pang, C.H.; Wang, B.S. Oxidative stress and salt tolerance in plants. In Progress in Botany; Springer: Berlin/Heidelberg, Germany, 2008; pp. 231–245. [Google Scholar]
- Garretón, V.; Carpinelli, J.; Jordana, X.; Holuigue, L. The as-1 promoter element is an oxidative stress-responsive element and salicylic acid activates it via oxidative species. Plant Physiol. 2002, 130, 1516–1526. [Google Scholar] [CrossRef] [PubMed] [Green Version]
- Tyagi, S.; Sembi, J.K.; Upadhyay, S.K. Gene architecture and expression analyses provide insights into the role of glutathione peroxidases (GPXs) in bread wheat (Triticum aestivum L.). J. Plant Physiol. 2018, 223, 19–31. [Google Scholar] [CrossRef] [PubMed]
- Johannesson, H.; Wang, Y.; Hanson, J.; Engström, P. The Arabidopsis thaliana homeobox gene ATHB5 is a potential regulator of abscisic acid responsiveness in developing seedlings. Plant Mol. Biol. 2003, 51, 719–729. [Google Scholar] [CrossRef] [PubMed]
- Fujita, M.; Fujita, Y.; Maruyama, K.; Seki, M.; Hiratsu, K.; Ohme-Takagi, M.; Tran, L.P. Yamaguchi-Shinozaki, K.; Shinozaki, K. A dehydration-induced NAC protein, RD26, is involved in a novel ABA-dependent stress-signaling pathway. Plant J. 2004, 39, 863–876. [Google Scholar] [CrossRef]
- Leung, J.; Merlot, S.; Giraudat, J. The Arabidopsis ABSCISIC ACID-INSENSITIVE2 (ABI2) and ABI1 genes encode homologous protein phosphatases 2C involved in abscisic acid signal transduction. Plant Cell 1997, 9, 759–771. [Google Scholar]
- Yoshida, T.; Fujita, Y.; Sayama, H.; Kidokoro, S.; Maruyama, K.; Mizoi, J.; Shinozaki, K.; Yamaguchi-Shinozaki, K. AREB1, AREB2, and ABF3 are master transcription factors that cooperatively regulate ABRE-dependent ABA signaling involved in drought stress tolerance and require ABA for full activation. Plant J. 2010, 61, 672–685. [Google Scholar] [CrossRef]
- Söderman, E.; Mattsson, J.; Engström, P. The Arabidopsis homeobox gene ATHB-7 is induced by water deficit and by abscisic acid. Plant J. 1996, 10, 375–381. [Google Scholar] [CrossRef]
- Ré, D.A.; Capella, M.; Bonaventure, G.; Chan, R.L. Arabidopsis AtHB7 and AtHB12 evolved divergently to fine tune processes associated with growth and responses to water stress. BMC Plant Biol. 2014, 14, 1–14. [Google Scholar] [CrossRef] [Green Version]
- Valdés, A.E.; Övernäs, E.; Johansson, H.; Rada-Iglesias, A.; Engström, P. The homeodomain-leucine zipper (HD-Zip) class I transcription factors ATHB7 and ATHB12 modulate abscisic acid signalling by regulating protein phosphatase 2C and abscisic acid receptor gene activities. Plant Mol. Biol. 2012, 80, 405–418. [Google Scholar] [CrossRef]
- Willems, E.; Leyns, L.; Vandesompele, J. Standardization of real-time PCR gene expression data from independent biological replicates. Anal. Biochem. 2008, 379, 127–129. [Google Scholar] [CrossRef] [PubMed]
- Ausubel, F.M.; Brent, R.; Kingston, R.E.; Moore, D.D.; Smith, J.A.; Seidman, J.G.; Smith, J.A.; Struhl, K. Preparation and Analysis of DNA: Preparation of Genomic DNA from Bacteria. In Current Protocols in Molecular Biology; John Wiley Sons Inc.: Hoboken, NJ, USA, 2003. [Google Scholar]
- Gallo-Oller, G.; Ordonez, R.; Dotor, J. A new background subtraction method for Western blot densitometry band quantification through image analysis software. J. Immunol. Methods 2018, 457, 1–5. [Google Scholar] [CrossRef] [PubMed]
- Yao, W.; Wang, S.; Zhou, B.; Jiang, T. Transgenic poplar overexpressing the endogenous transcription factor ERF76 gene improves salinity tolerance. Tree Physiol. 2016, 36, 896–908. [Google Scholar] [CrossRef] [Green Version]
- Jambunathan, N. Determination and detection of reactive oxygen species (ROS), lipid peroxidation, and electrolyte leakage in plants. In Plant Stress Tolerance; Humana Press: Totowa, NJ, USA, 2010; pp. 291–297. [Google Scholar]
- Huang, X.S.; Luo, T.; Fu, X.Z.; Fan, Q.J.; Liu, J.H. Cloning and molecular characterization of a mitogen-activated protein kinase gene from Poncirus trifoliata whose ectopic expression confers dehydration/drought tolerance in transgenic tobacco. J. Exp. Bot. 2011, 62, 5191–5206. [Google Scholar] [CrossRef] [Green Version]
- Cheng, Z.; Zhang, X.; Zhao, K.; Zhou, B.; Jiang, T. Ectopic expression of a poplar gene NAC13 confers enhanced tolerance to salinity stress in transgenic Nicotiana tabacum. J. Plant Res. 2020, 133, 727–737. [Google Scholar] [CrossRef] [PubMed]
Figure 1.
Bioinformatic analysis of McHB7 and homologous TF proteins. (A) Phylogenetic tree of XP_021748183.1, XP_021767274.1, XP_021846961.1, XP_010692437.1, KNA21535.1, KMT20244.1, ACZ05048.1, PSS26255.1, QEQ92614.1, and XP_002320889.1. The red dot indicates the McHB7 TF. (B) Amino acid sequence alignment of XP_021748183.1, XP_021767274.1, XP_021846961.1, XP_010692437.1, KNA21535.1, KMT20244.1, ACZ05048.1, PSS26255.1, QEQ92614.1, and XP_002320889.1. (C) Two domains of homeobox TFs: conserved homeobox domain (HD) and variable HALZ domain.
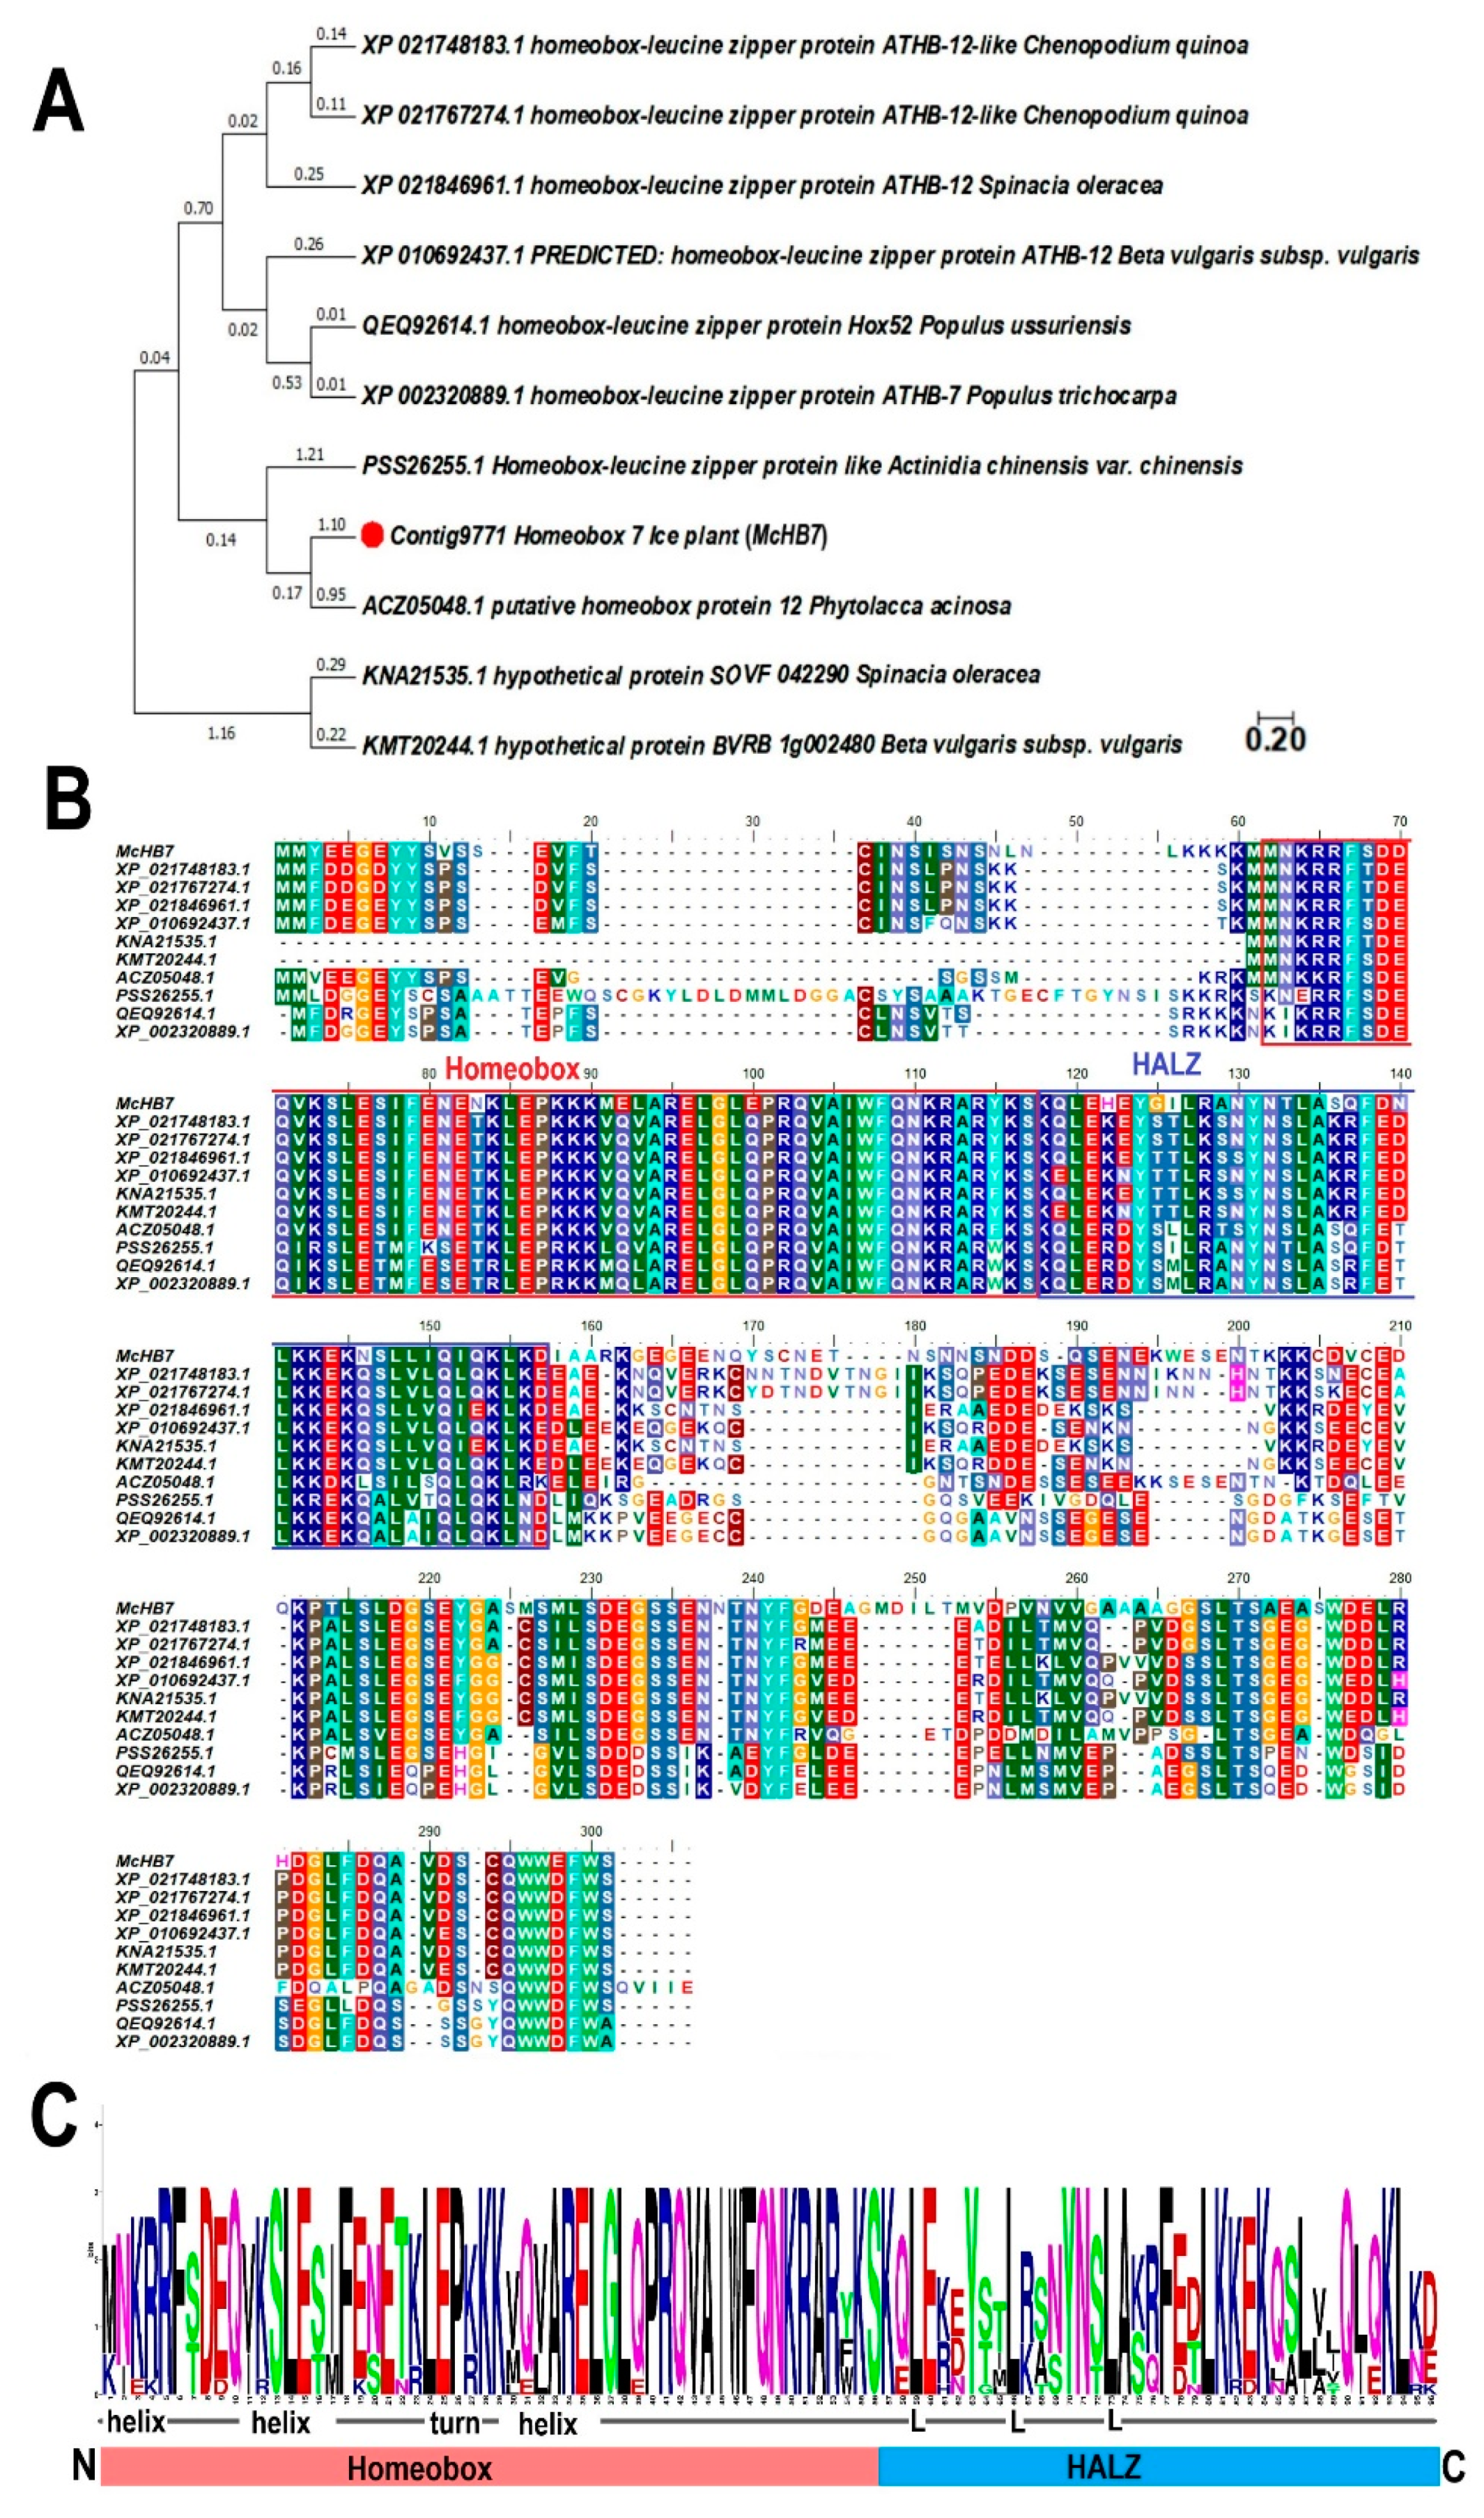
Figure 2.
Subcellular localization of McHB7 protein. (A) Schematic maps of the positive control pCAMBIA1302-GFP and the McHB7-GFP construct in the pCAMBIA1302vector. (B) The McHB7-GFP fusion construct and the positive control pCAMBIA1302were introduced into tobacco leaves by infiltration. GFP fluorescence was observed by confocal laser scanning microscopy. (a,d) fluorescence images observed in a dark field (green); (b,e) light images observed in bright field; (c,f) merged images of dark field and bright field. Scale bar = 30 μm.
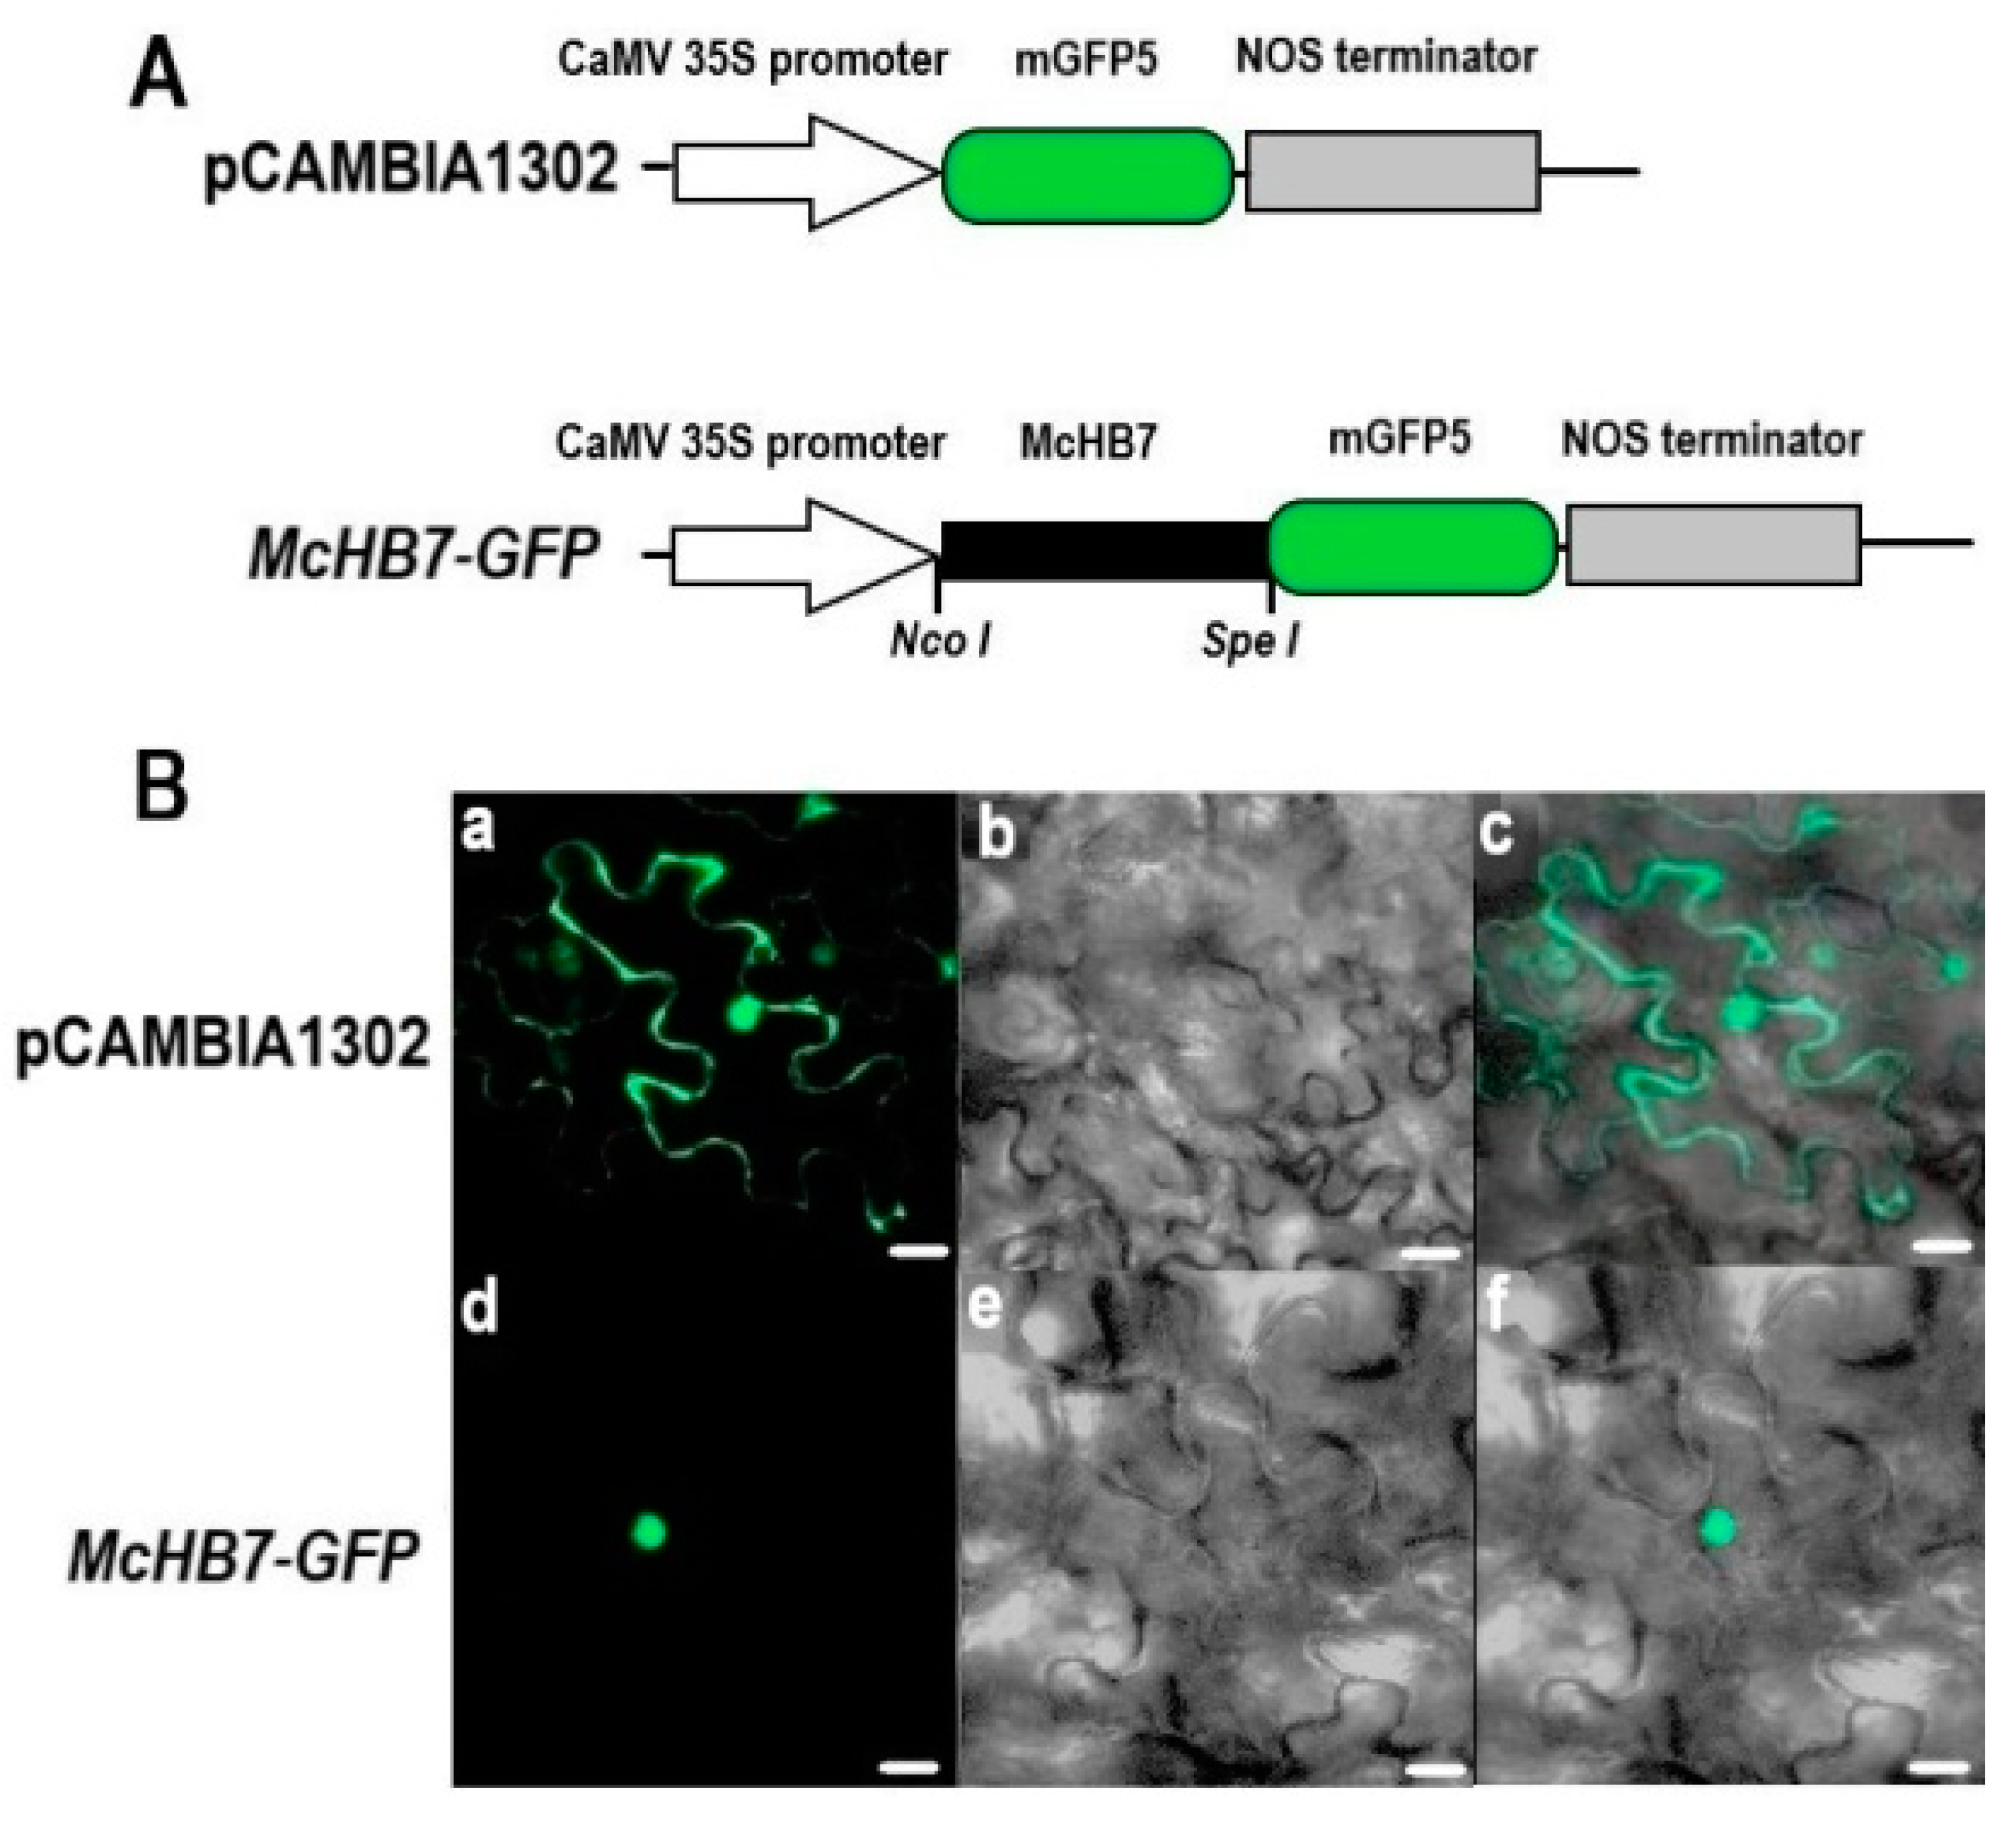
Figure 3.
Ice plant growth phenotype and McHB7 expression after high salinity treatment. (A) Phenotype of ice plant seedlings under 500 mM NaCl treatment for 0, 7, and 14 days. (B) Relative expression of McHB7 after 500 mM NaCl treatment (compared with the control condition). Student’s t-test: t: * p < 0.05; ** p < 0.01, *** p < 0.001, error bars indicate mean ± standard deviation (SD) (n = 4).

Figure 4.
Overexpression of McHB7 in ice plants at day 7 after transformation. (A) The relative expression of McHB7 in the overexpression (OE) plants compared to WT; Student’s t-test, ** p < 0.01. Error bars indicate mean ±SD (n = 4). (B) Images of Western blot showing Flag signal of McHB7 protein level in the OE plants. The protein loading was assessed by Coomassie staining and Ponceau S staining of Rubisco, showing equal loading. WT1–WT4 are four replicates of WT, OE1–OE4 are four replicates of McHB7-over-expressing seedlings.

Figure 5.
McHB7-overexpressing (OE) plants under control and salt stress conditions. (A) Phenotype of OE plants and WT under control and salt stress conditions, bar = 2 cm. (B) Validation of OE plants after salt stress treatment. The OE plants were at day 14 after transformation; Student’s t-test, * p< 0.05, ** p < 0.01, *** p < 0.001. Error bars indicate mean ± SD (n = 4). (C) SOD activity of OE plants and WT under control and salt stress conditions. (D) POD activity. (E) MDA content. (F) Water content. (G) NBT staining. (H) DAB staining. (I) Evans blue staining. WTC, WT under control conditions; OEC, transgenic plants under control conditions; WTS, WT after salt stress treatment; OES, transgenic plants after salt stress treatment.

Figure 6.
Heatmap of identified proteins under control and high salinity conditions and GO functional categorization of the proteins. (A) Identified proteins under control conditions. WTC1–WTC4, four biological replicates of WT under control conditions; OEC1–OEC4, four replicates of OE plants under control conditions. (B) Identified proteins under salt stress conditions. WTS1–WTS4, four biological replicates of WT after salt stress treatment; OES1–OES4, four biological replicates of transgenic plants after salt stress treatment. (C) Biological process of identified proteins. (D) Cellular component of identified proteins. (E) Molecular function of identified proteins.

Figure 7.
Differentially expressed proteins (DEPs) under control and salt stress treatment. WTC1-WTC4, four biological replicates of WT under control conditions; OEC1-OEC4, four replicates of OE plants under control conditions; WTS1-WTS4, four biological replicates of WT after salt stress treatment; OES1-OES4, four biological replicates of transgenic plants after salt stress treatment. (A) PCA result of all the control and salt stress samples of WT and McHB7 OE. (B) DEPs under control conditions. (C) DEPs under salt stress treatment. (D) Venn diagram of DEPs under control and salt stress treatment.

Publisher’s Note: MDPI stays neutral with regard to jurisdictional claims in published maps and institutional affiliations. |
© 2021 by the authors. Licensee MDPI, Basel, Switzerland. This article is an open access article distributed under the terms and conditions of the Creative Commons Attribution (CC BY) license (https://creativecommons.org/licenses/by/4.0/).
Share and Cite
MDPI and ACS Style
Zhang, X.; Tan, B.; Zhu, D.; Dufresne, D.; Jiang, T.; Chen, S. Proteomics of Homeobox7 Enhanced Salt Tolerance in Mesembryanthemum crystallinum. Int. J. Mol. Sci. 2021, 22, 6390. https://doi.org/10.3390/ijms22126390
AMA Style
Zhang X, Tan B, Zhu D, Dufresne D, Jiang T, Chen S. Proteomics of Homeobox7 Enhanced Salt Tolerance in Mesembryanthemum crystallinum. International Journal of Molecular Sciences. 2021; 22(12):6390. https://doi.org/10.3390/ijms22126390
Chicago/Turabian StyleZhang, Xuemei, Bowen Tan, Dan Zhu, Daniel Dufresne, Tingbo Jiang, and Sixue Chen. 2021. "Proteomics of Homeobox7 Enhanced Salt Tolerance in Mesembryanthemum crystallinum" International Journal of Molecular Sciences 22, no. 12: 6390. https://doi.org/10.3390/ijms22126390
Note that from the first issue of 2016, this journal uses article numbers instead of page numbers. See further details here.