Article

Particulate Matter (PM10) Promotes Cell Invasion through Epithelial–Mesenchymal Transition (EMT) by TGF-β Activation in A549 Lung Cells

by
Claudia M. García-Cuellar
1,†,
Miguel Santibáñez-Andrade
1,†,
Yolanda I. Chirino
2,
Raúl Quintana-Belmares
1,
Rocío Morales-Bárcenas
1,
Ericka Marel Quezada-Maldonado
1 and
Yesennia Sánchez-Pérez
1,*
1
Instituto Nacional de Cancerología (INCan), Subdirección de Investigación Básica, San Fernando No. 22, Ciudad de México 14080, Mexico
2
Unidad de Biomedicina, Facultad de Estudios Superiores Iztacala, Universidad Nacional Autónoma de México, Los Reyes Iztacala, Tlalnepantla 54090, Estado de México, Mexico
*
Author to whom correspondence should be addressed.
These authors contributed equally.
Int. J. Mol. Sci. 2021, 22(23), 12632; https://doi.org/10.3390/ijms222312632
Submission received: 28 October 2021 / Revised: 17 November 2021 / Accepted: 19 November 2021 / Published: 23 November 2021
(This article belongs to the Special Issue The Epithelial-to-Mesenchymal Transition (EMT) in Cancers)

Abstract

:
Air pollution presents a major environmental problem, inducing harmful effects on human health. Particulate matter of 10 μm or less in diameter (PM10) is considered an important risk factor in lung carcinogenesis. Epithelial–mesenchymal transition (EMT) is a regulatory program capable of inducing invasion and metastasis in cancer. In this study, we demonstrated that PM10 treatment induced phosphorylation of SMAD2/3 and upregulation of SMAD4. We also reported that PM10 increased the expression and protein levels of TGFB1 (TGF-β), as well as EMT markers SNAI1 (Snail), SNAI2 (Slug), ZEB1 (ZEB1), CDH2 (N-cadherin), ACTA2 (α-SMA), and VIM (vimentin) in the lung A549 cell line. Cell exposed to PM10 also showed a decrease in the expression of CDH1 (E-cadherin). We also demonstrated that expression levels of these EMT markers were reduced when cells are transfected with small interfering RNAs (siRNAs) against TGFB1. Interestingly, phosphorylation of SMAD2/3 and upregulation of SMAD induced by PM10 were not affected by transfection of TGFB1 siRNAs. Finally, cells treated with PM10 exhibited an increase in the capacity of invasiveness because of EMT induction. Our results provide new evidence regarding the effect of PM10 in EMT and the acquisition of an invasive phenotype, a hallmark necessary for lung cancer progression.

1. Introduction

Air pollution presents one of the major environmental problems, inducing harmful effects in human health. These effects have a major impact in highly populated cities, where industrial activity and vehicle traffic increase emissions of multiple pollutants. Epidemiological and toxicological research led to the classification of air pollution as carcinogenic in Group 1 by the International Agency for Research on Cancer (IARC) [1]. Multiple epidemiologic studies have demonstrated that particulate matter (PM) inhalation has a negative impact on human health, increasing the occurrence of respiratory diseases such as chronic obstructive pulmonary disease, asthma, and, over the long term, lung cancer [2,3,4,5]. According to the International Agency for Research in Cancer (IARC), lung cancer is still the leading cause of cancer death worldwide. In 2018, approximately 1.7 million deaths were attributed to lung cancer cases. Interestingly, from all lung cancer cases, at least 29% were linked with ambient air pollution [6,7]. To act against air pollution, the World Health Organization (WHO) developed the ambient air quality database, with the aim of maintaining particles with an aerodynamic diameter less or equal to 10 µm (PM10) and an annual mean value below 20 µg/m3. However, the increasing of emissions by industry, power generation, transportation, and domestic burning in highly populated sites exceeds constantly the WHO’s health-based air-quality guidelines.
Epithelial–mesenchymal transition (EMT) is defined as a regulatory program capable of orchestrating the induction of invasion and metastasis processes in cancer, via the loss of the apical-basal polarity in epithelial cells and the acquisition of a mesenchymal phenotype [8,9]. EMT results from certain molecular events, such as the repression of E-cadherin expression, the induction of N-cadherin and vimentin, and the loss of cell–cell junctions [10,11]. These events are accompanied by other cytoskeleton remodeling signals, including the formation of actin stress fibers, and the induction of α-smooth muscle actin (α-SMA) and fibronectin [12].
One of the main initiators for EMT signaling is the transforming growth factor-beta (TGF-β). TGF-β is capable of regulating directly and positively mesenchymal markers such as the alfa-smooth muscle actin (α-SMA) [13]. Additionally, TGF-β acts as a strong regulator of cytoskeleton remodeling [14]. Downstream signaling induced by TGF-β involves the type I and type II TGF-β receptors (TβRI and TβRII) forming a hetero-tetrameric complex by phosphorylation of the TβRI GS domain [15,16,17]. Then, TβRI recruits and phosphorylates two cytoplasmic mediators of TGF-β signaling, the receptor-activated SMAD proteins SMAD2 and SMAD3, which in assistance of SMAD4 are translocated to the nucleus [18].
Although the loss of E-cadherin is the main EMT hallmark, the underlying mechanism for the acquisition of the EMT phenotype include the zinc-finger proteins Snail and Slug and the two-handed zinc-finger protein ZEB1 [19,20]. SMAD2/3/4 as well as other co-activators induce the expression of Snail, Slug, and ZEB1. Then, these transcription factors bind to the promoter region of the human E-cadherin gene (CDH1), silencing its transcription [19,21,22].
Cancer progression pathways are activated as a consequence of deregulated expression of genes caused by PM, such as the activation of downstream EMT inducers in lung cancer cells [23,24]. In addition, chronic PM exposure induces EMT morphology [25], different degrees of EMT progression, and increased invasion ability in lung cells in a concentration-dependent manner [26]. Moreover, lung metastasis associated to air pollution has also been associated with the methylation of EMT genes [27].
The effect of PM in migration and invasion pathways has been reported in some in vitro experiments [28]. For example, cells exposed to PM10 and PM2.5 (particles with an aerodynamic diameter less or equal to 2.5 µm) showed an increase in protease activity, as well as an invasive phenotype, associated with the up-regulation in metalloproteases [29,30,31]. Transepithelial electrical resistance experiments have shown that PM components are capable of increasing cell permeability, enhancing the ability of invasion and orthotopic lung carcinoma metastasis in mice [32]. However, the association between PM exposure, EMT induction, and the acquisition of the invasive phenotype remains unclear.
In the present study, we evaluated the effect of PM10 exposure in the induction of TGF-β and the expression/abundance/phosphorylation of EMT components, as well as its impact in the invasive phenotype using the lung epithelial A549 cell line.

2. Results

2.1. Particulate Matter PM10 Increases the Phosphorylation of SMAD2/3 and the Levels of SMAD4 in A549 Cells

Cells exposed to PM10 for 48 h and transfected with non-targeting siRNA showed an increase in the phosphorylation levels of SMAD2/3 when compared with control group (fold change→FC of 1.24 vs. 1.00; p < 0.05) (Figure 1A). In addition, cells treated with TGF-β showed an increase in the phosphorylation levels of SMAD2/3 when compared with control group (FC of 1.19 vs. 1.00; p < 0.05). Cells transfected with TGFB1 siRNAs showed no changes in the phosphorylation levels of SMAD2/3 in non-treated, PM10, and TGF-β groups (FC of 0.89, 0.92, and 0.91 vs. 1.00, respectively; p < 0.05), suggesting a link between the phosphorylation status of SMAD2/3 and PM10 treatment independent of TGFB1 repression. Moreover, cells exposed to PM10 for 48 h and transfected with non-targeting siRNA showed an increase in the protein levels of SMAD4 when compared with control group (FC of 1.19 vs. 1.00; p < 0.05) (Figure 1B). Cells treated with TGF-β also showed an increase in protein levels of SMAD4 when compared with control group (FC of 1.27 vs. 1.00; p < 0.05). Cells transfected with TGFB1 siRNAs showed no change in the protein levels of SMAD4 in non-treated, PM10, and TGF-β groups (FC of 1.13, 1.07, and 1.12 vs. 1.00, respectively; p < 0.05), suggesting a link between the abundance of SMAD4 and PM10 treatment independent of TGFB1 repression.

2.2. Particulate Matter PM10 Induce the Expression of TGFB1 and EMT Components in A549 Cells

Cells exposed to PM10 for 48 h and transfected with non-targeting siRNA showed an increase in the expression levels of TGFB1 when compared with control group (FC of 1.36 vs. 1.00; p < 0.05) (Figure 2). In addition, cells treated with TGF-β showed an increase in the expression levels of TGFB1 when compared with control group (FC of 3.06 vs. 1.00; p < 0.05). Moreover, cells transfected with TGFB1 siRNAs showed a decrease in TGFB1 expression levels in non-treated, PM10, and TGF-β groups (FC of 0.13, 0.06, and 0.28 vs. 1.00, respectively; p < 0.05), maintaining the effect in TGFB1 knockdown. Cells exposed to PM10 and transfected with non-targeting siRNA also exhibited an increase in expression levels of SNAI1 (Snail), SNAI2 (Slug), ZEB1 (ZEB1), CDH2 (N-cadherin), ACTA2 (α-SMA), and VIM (vimentin) (FC of 1.21, 2.79, 1.30, 1.39, 1.41, and 3.02 vs. 1.00, respectively; p < 0.05), and a decrease in expression levels of CDH1 (E-cadherin) when compared with control group (FC of 0.29 vs. 1.00, respectively; p < 0.05). A similar effect in EMT genes SNAI1 (Snail), SNAI2 (Slug), ZEB1 (ZEB1), CDH2 (N-cadherin), ACTA2 (α-SMA), VIM (vimentin), and CDH1 (E-cadherin) was observed in cells treated with TGF-β (FC of 2.98, 4.10, 1.86, 3.09, 1.84, 3.12, and 0.12 vs. 1.00, respectively; p < 0.05). When cells were transfected with TGFB1 siRNAs, EMT gene SNAI1 (Snail) exhibited a decrease in expression levels in non-treated and PM10, but an increase in expression levels in TGF-β group (FC of 0.91, 0.64, and 3.60, respectively; p < 0.05) when compared with their non-targeting siRNA pair. A similar effect was observed in CDH1 (E-cadherin) (FC of 0.75, 0.27, and 0.07, respectively; p < 0.05) and CDH2 (N-cadherin) (FC of 0.75, 0.78, and 2.39, respectively; p < 0.05). Cells transfected with TGFB1 siRNAs exhibited a decrease in expression levels in non-treated group, but an increase in expression levels in PM10 and TGF-β-treated groups in SNAI2 (Slug) (FC of 0.80, 3.22, and 5.11, respectively; p < 0.05) and VIM (vimentin) (FC of 0.69, 1.94, and 3.54, respectively; p < 0.05). On the other hand, cells transfected with TGFB1 siRNAs exhibited no changes in expression levels in non-treated and PM10 groups, but an increase in expression levels in PM10 and TGF-β-treated groups in ZEB1 (ZEB1) (FC of 1.06, 1.36, and 2.40, respectively; p < 0.05) and ACTA2 (α-SMA) (FC of 1.12, 1.29, and 1.92, respectively; p < 0.05).

2.3. Particulate Matter PM10 Increases the Protein Levels of EMT Markers in A549 Cells

Cells exposed to PM10 for 48 h and transfected with non-targeting siRNA exhibited an increase in protein levels of SNAI1 (Snail), SNAI2 (Slug), ZEB1 (ZEB1), CDH2 (N-cadherin), ACTA2 (α-SMA), and VIM (vimentin) (FC of 1.19, 1.38, 1.23, 1.30, 1.35, and 1.47 vs. 1.00, respectively; p < 0.05), and a decrease in protein levels of CDH1 (E-cadherin) when compared with the control group (FC of 0.80 vs. 1.00, respectively; p < 0.05) (Figure 3). A similar effect in EMT markers was observed in cells treated with TGF- β, with an increase in protein levels of SNAI1 (Snail), SNAI2 (Slug), ZEB1 (ZEB1), CDH2 (N-cadherin), ACTA2 (α-SMA), and VIM (vimentin) (FC of 1.27, 1.38, 1.23, 1.53, 1.52, and 1.37 vs. 1.00, respectively; p < 0.05) and a decrease in protein levels of CDH1 (E-cadherin) (FC of 0.72 vs. 1.00, respectively; p < 0.05). When cells were transfected with TGFB1 siRNAs, EMT marker SNAI1 (Snail) exhibited an increase in protein levels in non-treated, PM10, and TGF-β groups (FC of 1.15, 1.17, and 1.10, respectively; p < 0.05) when compared with their non-targeting siRNA pair. SNAI2 (Slug) exhibited a decrease in protein levels in the non-treated group, followed by an increase in PM10-treated and TGF-β groups (FC of 0.89, 1.18, and 1.53, respectively; p < 0.05). ZEB1 (ZEB1) exhibited a decrease in protein levels in non-treated and PM10 groups, with no changes in TGF-β group (FC of 0.88, 0.93, and 1.01, respectively; p < 0.05). CDH1 (E-cadherin) exhibited no changes in protein levels in the non-treated group, followed by a decrease in PM10-treated group and no changes in TGF-β group (FC of 0.97, 0.87, and 0.93, respectively; p < 0.05). CDH2 (N-cadherin) exhibited no changes in protein levels in the non-treated, PM10-treated, and TGF-β groups (FC of 0.98, 0.99, and 0.94, respectively; p < 0.05). ACTA2 exhibited no changes in protein levels in the non-treated, PM10-treated, and TGF-β groups (α-SMA) (FC of 0.98, 1.00, and 1.00, respectively; p < 0.05). Finally, VIM (vimentin) exhibited a decrease in protein levels in the non-treated group, followed by an increase in PM10-treated and TGF-β groups (FC of 0.88, 1.21, and 1.26, respectively; p < 0.05).

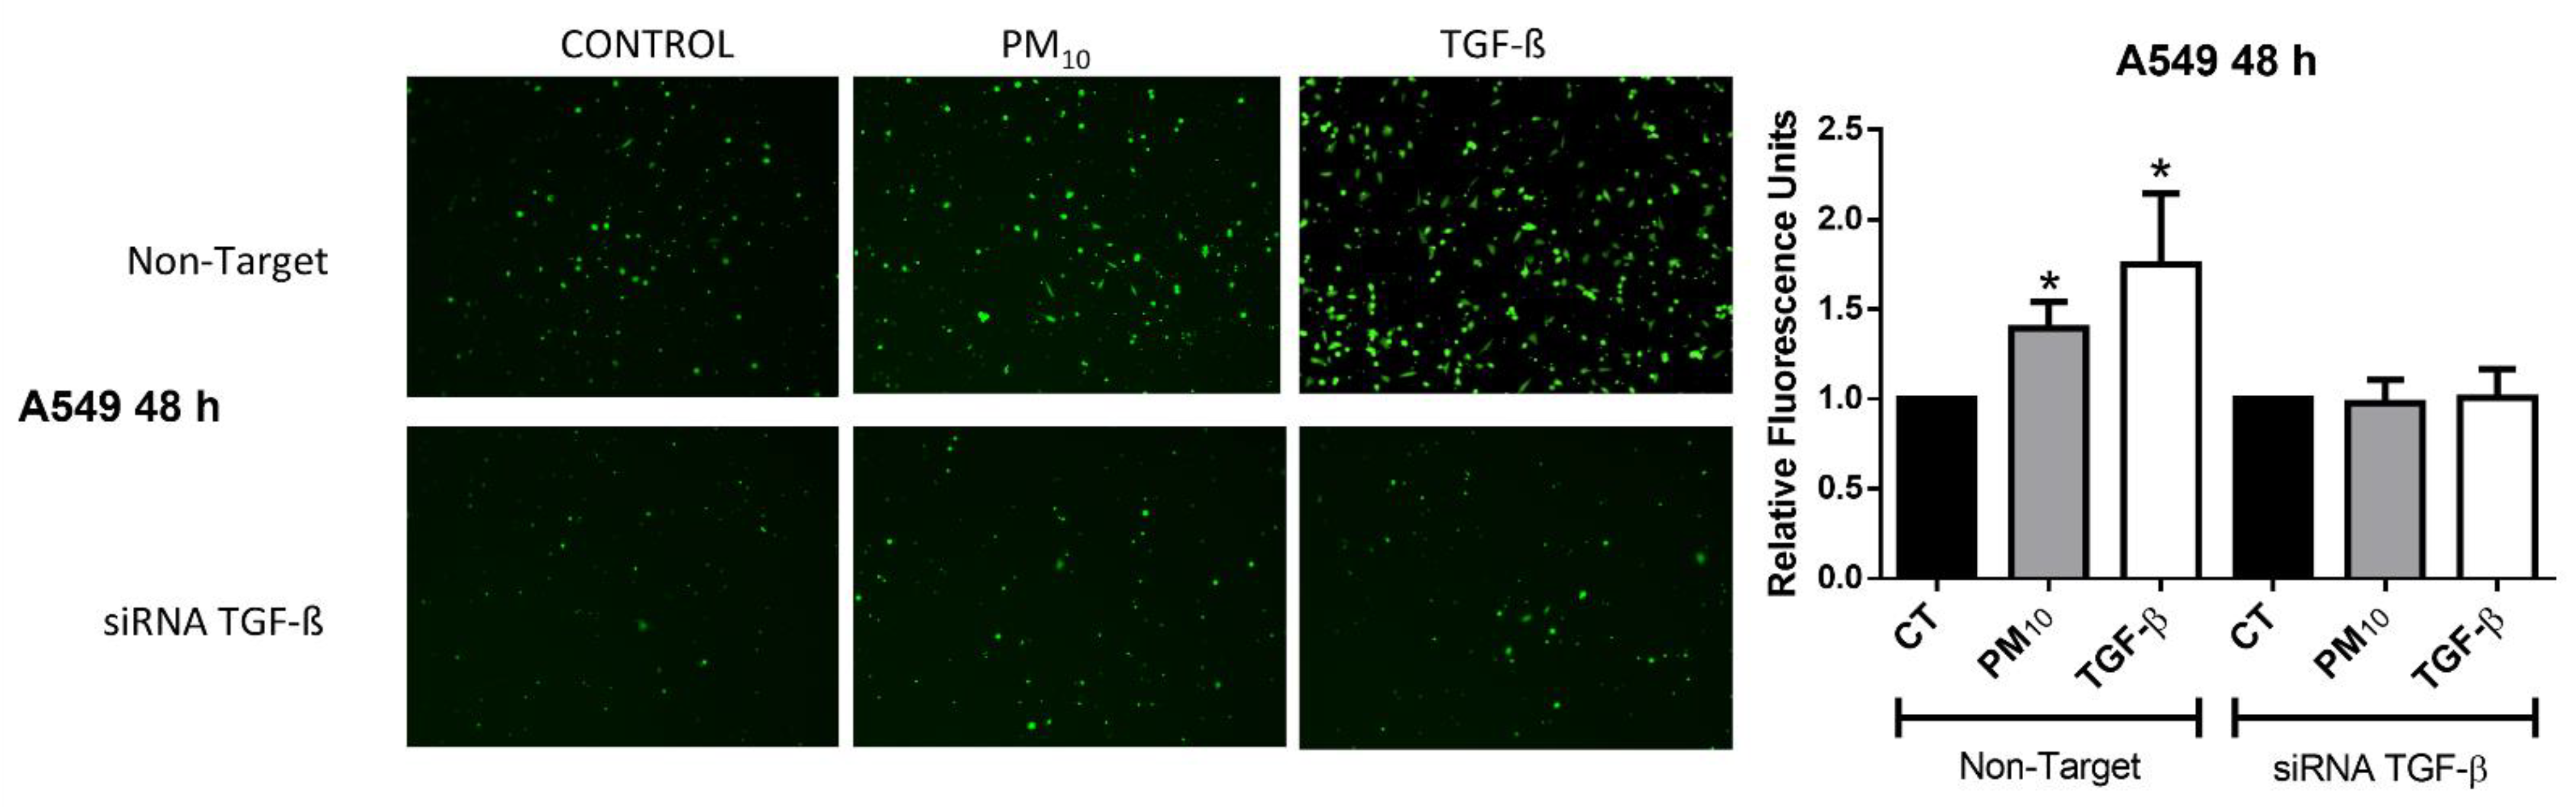
2.4. Particulate Matter PM10 Activates the Invasive Phenotype in A549 Cells

A549 cells exposed to PM10 for 48 h and transfected with non-targeting siRNA showed an increase in the invasiveness levels when compared with control group (FC of 1.39 vs. 1.00; p < 0.05) (Figure 4). In addition, cells treated with TGF-β showed an increase in invasiveness level when compared with control group (FC of 1.74 vs. 1.00; p < 0.05). Cells transfected with TGFB1 siRNAs showed no changes in invasiveness levels in the non-treated, PM10, and TGF-β groups (FC of 1.00, 0.97, and 1.00 vs. 1.00, respectively; p < 0.05), suggesting a role of TGFB1 expression in the induction of the invasive phenotype.

3. Discussion

In the present study, we evaluated the effect of PM10 in the induction of EMT through the TGF-β pathway, considering the phosphorylation of EMT cascade initiators such as SMAD2/3, as well as the upregulation of SMAD4, in order to follow the transcription activation of multiple EMT markers. We found that PM10 is capable of inducing the expression of TGFB1 and EMT markers SNAI1, SNAI2, ZEB1, CDH2, ACTA2, and VIM as well as their respective products TGF-β, Snail, Slug, ZEB1, N-cadherin, α-SMA, and vimentin in the lung A549 cell line. Cell exposed to PM10 also shows a decrease in the expression of CDH1 and its product, E-cadherin. Interestingly, expression levels of these EMT markers were reduced when cells are transfected with small interfering RNAs (siRNAs) against TGFB1. However, phosphorylation of SMAD2/3 and upregulation of SMAD induced by PM10 was not affected by transfection of TGFB1 siRNAs. As a response to these molecular changes in EMT components on cells treated with PM10, the biological consequence is the increase in the capacity of invasiveness.
EMT is involved in multiple pulmonary fibrotic diseases as well as in lung cancer [12,33,34,35,36]. According to the physiological and pathological processes where is involved, EMT has been classified into three types. While type 1 and type 2 are related to embryonic development and tissue regeneration/cicatrization, respectively, type 3 EMT has been widely recognized as necessary for cancer cells in order to confer an invasive and metastatic phenotype, where cancer cells not only show conversion from epithelial to mesenchymal cells, but also undergo mesenchymal–epithelial transition (MET) in sites where they are established after metastasis [37]. Some studies have detected the induction of type 2 and 3 EMT in lung diseases, providing some clues regarding the relevance of PM in EMT [38,39].
Cancer pathways where EMT is involved are well known. In this context, the induction of EMT is mainly associated with factors such as TGF-β, SMAD2/3, MAPK, IL-6, Wnt, SHH, and Notch [40,41]. The target of these pathways involves multiple transcription factors but show affinity to SNAI1, SNAI2, and ZEB. This step in the EMT signaling is crucial because these transcription factors have a direct impact on E-cadherin expression. Thus, EMT signaling is oriented to cause an inhibition of epithelial markers and, in the same way, cause an induction of mesenchymal markers.
EMT markers that are well established and usually detected in vitro or in vivo include a decrease in E-cadherin expression, accompanied by an increase in the expression levels of N-cadherin, α-SMA, and vimentin [41,42]. Additionally, an increase in the expression levels of MMPs and type 1 collagen is also induced [43,44]. Together, these EMT components create a microenvironment in which growth factors, degrade extracellular matrix enzymes and extracellular matrix proteins, and orchestrate the activation of autocrine and paracrine signals oriented to sustain EMT in cancer [45,46].
The mechanisms by which air pollution is capable of inducing cell transformation depend on a complex interaction between environmental and individual factors. PM is a mixture of organic, inorganic, and biological entities interacting not only in the air, but also in their site of deposition. The composition of this mixture is dependent of the location where the PM is collected, the sources of emission near to the collection site, and the season in which PM is sampled [47,48,49,50]. While epidemiological studies have reported a sustained increase in risk for lung cancer incidence of approximately 8% per each increase of 10 µg/m3 in PM10 concentrations [51], other evidence points to the fact that PM10 as well as PM2.5 are associated with poorer lung cancer survival, emphasizing their effect in early stage non-small cell lung cancer [52]. Because air pollution has been catalogued as a Group I carcinogen by the IARC, the underlying process of malignant cell transformation is expected to follow the multistep sequence described for these group of diseases: initiation, promotion, and progression [53]. As part of the cancer progression step, a reversible process called epithelial–mesenchymal transition (EMT) takes place. The goal of EMT in cancer is the colonization of distant sites, starting with the signaling necessary for the induction of a phenotype suitable for cell migration (mesenchymal), followed by the invasion of adjacent tissues, and finally, colonizing distant tissues trough metastasis and promoting the establishment by switching again the phenotype through the epithelial condition [54]. Thus, the EMT process is the program that converts a benign tumor into an aggressive and highly invasive neoplasm.
Several cancer progression programs are subject to change by PM10, and these effects have been linked to deregulated expression of genes caused by PAHs contained in PM [24]. Further, PM exposure activates inducers of EMT in lung cancer cells, impacting positively the downstream signaling of multiple mesenchymal markers [23]. Chronic exposure to PM also induces a well-defined EMT morphology in A549 cells [25]. Furthermore, chronic exposure has described the carcinogenic mechanisms of PM in the induction of EMT, emphasizing the role of the organic fraction in the induction of different degrees of EMT progression and increased invasion ability in BEAS-2B cells in a concentration-dependent manner [26]. In fact, BEAS2B exposed to PM exhibits a decrease in E-cadherin, followed by an increase in mesenchymal markers such as α-SMA, Snail, Slug, ZEB1, and extracellular matrix degradation related to an increase in TGFB1, MMP3, and MMP9 [55].
The effect of PM in migration and invasion pathways in cancer cells has also been described in A549 cells. Toxicological assays as well as global transcriptome profiling exhibit an increase in the activity of proteases, as well as an invasive phenotype (due to the up-regulation of metalloproteases) when cells are exposed to PM10 and PM2.5 [28,29,30,31]. PM exposure has been also associated with methylation of EMT genes [27]. PM components also increase cell permeability, according to experiments measuring transepithelial electrical resistance. Deregulation of metalloprotease activity, as well as other signaling pathways, enhance the ability of invasion and induce orthotopic lung carcinoma metastasis in mice [32]. This evidence suggests that both, PM10 and PM2.5 are potent signal transducers, acting as activators of transcription of key regulators in EMT, a condition strongly linked to tumor progression [56].
A variety of cell lines have been considered for the evaluation of the effect of PM in the induction of EMT. These models include the epithelial bronchial cell lines BEAS2B, 16HBE, HBEC, and HBEC3, as well as the alveolar carcinoma cell line A549 and the lung carcinoma NCI-H441 and H292 cell lines. From these, BEAS2B and A549 are the most frequently used models [57]. Although several studies report similar effects of PM in both cell lines, we considered the A549 cell line to be a more suitable model for the study of EMT, once that is a transformed cell line. This feature is crucial in the evaluation of the carcinogenic process because invasion and metastasis are cancer hallmarks involved in progression. We performed experiments in A549 cells treated with PM10 for 24 h (data not shown). However, the effects of PM10 in EMT are more evident after 48 h of exposure. Moreover, when we performed the invasion assay in BEAS2B, no changes were observed when cells were treated with PM10 or TGF-β and compared with controls (data not shown). These results suggest that BEAS2B could lack of some cancer hallmarks necessary for the acquisition of an invasive phenotype. Further studies should be addressed in search of the invasion capacity between these models in order to consider if a non-transformed cell line is suitable for analysis of EMT.
To our knowledge, this is the first study that has demonstrated the effect of PM10 on the induction of the growth factor TGF-β, and its influence on EMT regulation. PM10 induces TGFB1 overexpression followed by overexpression of EMT genes SNAI1 (Snail), SNAI2 (Slug), ZEB1 (ZEB1), CDH2 (N-cadherin), ACTA2 (α-SMA), and VIM (vimentin), and a decrease in the expression of CDH1 (E-cadherin) (Figure 5). These changes in gene expression result in TGF-β autoinduction, the activation of type 3 EMT, and the subsequent acquisition of an invasive phenotype, features observed in cancer cells. We also demonstrated that PM10 is capable of inducing phosphorylation of SMAD2/3 and an increase in protein levels of SMAD4 in A549 cells treated with PM10. Our results suggest that phosphorylation of SMAD2/3, as well as an increase in levels of SMAD4, are not influenced by TGFB1 overexpression caused by PM10 exposure in A549 cells. Moreover, this is the first in vitro study to document the invasive phenotype associated with PM10 exposure, integrating gene expression, protein synthesis, and signal transduction of multiple EMT markers. These findings offer new evidence regarding the effect of air pollution in tumor progression, by the acquisition of a key hallmark in carcinogenesis. The effect of air pollution in EMT signaling needs to be evaluated by other approaches, such as the analysis of EMT markers in vivo exposed to PM or of lung cancer patients exposed to air pollution, to determine the role of this risk factor during cancer continuum, and to associate the effect of PM10 in lung cancer susceptibility, incidence, and survival.

4. Materials and Methods

4.1. PM10 Sampling

Collection of PM10 was performed in Mexico City area using the GMW model 1200 VFC HVPM10 high-volume particle collector with a flux of 1.13 m3/min (Sierra Andersen, Atlanta, GA, USA). Particles were captured on cellulose nitrate filters with a pore size of 3.0 μm (Sartorius AG, Goettingen, Germany) for 3 d per week. Storage of the filters was made at 4 °C in dark and dry conditions. After that, particles were removed by gently scraping off membranes, using a surgical blade. Samples were placed for storage into endotoxin-free glass vials. All vials were maintained at 4 °C in dark and dry conditions. Prior to their use for treatment in cell cultures, particles were always sterilized for 15 min at 121 °C and 15 PSI. Characterization of collected PM10 is available in previous reports [58,59,60].

4.2. Lung Epithelial A549 Cell Culture and Exposure

Cell line A549 (human adenocarcinoma alveolar basal epithelial cells) was obtained from the American Type Culture Collection (ATCC, Manassas, VA, USA). Cell culture was performed using F-12 Kaighn’s medium (Gibco, New York, NY, USA) at 37 °C under an atmosphere of 5% of CO2. Only cultures reaching a confluence of 80% of the surface were considered before propagation or experiment running. All experiments were performed in 6-well plates, considering an initial concentration of 250,000 cells per well. Cells were kept in F-12 Kaighn’s medium considering a concentration of 10% of fetal bovine serum (FBS) (Gibco, Brooklyn, NY, USA) for 48 h. Before treatment (4 h prior to exposure), cells were transfected with the Silencer Select Negative Control small interfering RNA (siRNA) (Ambion-Thermo Fisher, Waltham, MA, USA), a control non-targeting siRNA, employing the Xfect RNA Transfection Reagent (Takara, Clontech, Beijing, China) according to manufacturer’s protocol. A549 cells were exposed to non-targeting siRNA to a final concentration of 20 nM. After 4 h, medium was removed, plates were then washed with PBS, and cells were treated with PM10, considering a final concentration of 10 µg/cm2 in F-12 Kaighn’s medium supplemented with 10% of FBS. This dose is equivalent to a 5-day exposure in humans, according to previous reports [61,62]. Cultures were evaluated at 48 h of treatment, comparing results with control cells (cultures without PM10 treatment) Additionally, experiments included cells treated for 48 h with TGF-β, 5 ng/mL (Sigma, St. Louis, MI, USA), serving as positive control of EMT induction.

4.3. Knockdown of TGF-β

To compare the effect of PM10 in the induction of EMT markers and evaluate the endpoints proposed, cultures of A549 cells were also transfected using a mixture of small interference RNAs (siRNAs) against TGFβ1 (mRNA of TGF-β), targeting multiple regions of its mRNA to improve the likelihood of degradation. Assays were performed in 6-well plates using an initial concentration of 250,000 cells per well. Cells were kept in F-12 Kaighn’s medium with 10% of fetal bovine serum (FBS) (Gibco, Brooklyn, NY, USA) for 48 h. Then, medium was removed, plates were washed in PBS and cells were synchronized by serum starvation for 24 h using free-FBS F-12 Kaighn’s medium. Before treatment (4 h prior to exposure), cells were transfected with the TGFβ1 siRNA (h2) (sc-270322) (Santa Cruz Biotechnology, Paso Robles, CA, USA), employing the XfectTM RNA Transfection Reagent (Takara, Clontech, Beijing, China) according to manufacturer’s protocol. A549 cells were exposed to TGFβ1 siRNA to a final concentration of 20 nM (Supplementary Figure S1). After 4 h, medium was removed, plates were then washed in PBS, and cells were treated with PM10 (10 µg/cm2), and TGF-β (100 ng/mL; Sigma, St. Louis, MI, USA), respectively. Comparisons in all experiments were performed considering two conditions (cells transfected with non-targeting siRNA and cells transfected with TGFβ1 siRNAs) with three experimental groups each of them (control/non-treated, PM10, and TGF-β).

4.4. Western Blot Analysis

Levels of EMT proteins were analyzed by Western blotting. Cell cultures were exposed to PM10 (10 µg/cm2) for 48 h. Then, cells were washed with PBS and lysed for 5 min in RIPA buffer (20 mM Tris-HCl pH 8; 150 mM NaCl; 1% NP-40) together with a protease inhibitor cocktail (Roche, Mannheim, Germany). Then, lysates were centrifuged at 12,000 rpm and 4 °C for 5 min and supernatants were collected. Protein concentration was analyzed using the bicinchoninic acid assay (Sigma, MI, USA). For each treatment, 20 µg of protein extract was separated by SDS–PAGE for SMAD2/3, pSMAD2 (Ser465/467), pSMAD3 (Ser423/425), SMAD4, Snail, Slug, ZEB1, E-cadherin, N-cadherin, α-SMA, and vimentin and transferred to polyvinylidene difluoride (PVDF) membranes. Membranes were kept in agitation with 5% low-fat milk—0.1% Tween 20 in TBS blocking buffer at room temperature for 1 h. Membranes were incubated with primary antibody (anti-SMAD2/3 (5678), dilution 1:1000; anti-pSMAD2 (Ser465/467)/pSMAD3 (Ser423/425) (8828), dilution 1:1000; anti-SMAD4 (46535), dilution 1:1000; anti-Snail (sc-271977), dilution 1:500; anti-Slug (9585), dilution 1:500, anti-ZEB1 (3396S), dilution 1:1000; anti-E-cadherin (MAB3199), dilution 1:1000; anti-N-cadherin (ab98952), dilution 1:1000; anti-α-SMA (19245S), dilution 1:1000; anti-vimentin (ab922547), dilution 1:5000) (Cell Signaling, Danvers, MA, USA; Santa Cruz Biotechnology, CA, USA; MilliporeSigma, MA, USA; Abcam, Cambrindge, UK) overnight at 4° C using GAPDH as control protein (anti-GAPDH, dilution 1:3000) (Santa Cruz Biotechnology, Dallas, TX, USA). Membranes were washed by agitation in 0.1% Tween 20 in TBS and incubated with HRP-linked secondary antibodies (anti-rabbit IgG, dilution 1:3000). Finally, membranes were incubated with chemiluminescent peroxidase substrate (MilliporeSigma, Burlington, MA, USA). An UVP luminescence reader was used to visualize the results and densitometry analysis was performed in the ImageJ software. Data were normalized using the GAPDH protein levels, and results were presented as the fold change over the control.

4.5. RNA Isolation and Expression Analysis

Total RNA isolation from A549 cells was performed using Trizol Reagent (Invitrogen, Waltham, MA, USA) after 48 h of exposure to PM10. RNA quantification was obtained using the ND-1000 spectrophotometer (NanoDrop Technologies, Wilmington, MA, USA), with samples having a purity (A260/A280 absorbance ratio) between 1.8 and 2. cDNA synthesis was performed using the High-Capacity cDNA Reverse Transcription Kit (Applied Biosystems, Thermo Fisher Scientific, Lithuania) according to the manufacturer’s specifications. Primers for the evaluation of expression analysis included TGFB1 (TGF-β) (forward primer [fwd] 5′-TGAAGCAATAGTTGGTGTCCA-3′ and reverse primer [rev] 5′-GCAGGGATAACACACTGCAA-3′) and the following EMT genes: SNAI1 (Snail) (fwd 5′-TTCTCACTGCCATGGAATTCC’-3′ and rev 5′-GCAGAGGACACAGAACCAGAAA-3′), SNAI2 (Slug) fwd 5′-AGATGCATATTCGGACCCAC-3′ and rev 5′-CCTCATGTTTGTGCAGGAGA-3′), ZEB1 (ZEB1) (fwd 5′-GCACCTGAAGAGGACCAGAG-3′ and rev 5′-TGCATCTGGTGTTCCATTTT-3′), CDH1 (E-cadherin) (fwd 5′-CAACGACCCAACCCAAGAA-3′ and rev 5′-CCGAAGAAACAGCAAGAGCA-3′), CDH2 (N-cadherin) (fwd 5′-AAAGAACGCCAGGCCAAAC-3′ and rev 5′-GGCATCAGGCTCCACAGTGT-3′), ACTA2 (α-SMA) (fwd 5′-CAGCACCGCCTGGATAGCC-3′ and rev 5′-AGGCACCCCTGAACCCGAA-3′) and VIM (vimentin) (fwd 5′-CGTCTCTGGCACGTCTTGAC-3′ and rev 5′-GCTTGGAAACATCCACATCGA-3′). RT- qPCR reactions were performed using the qPCR SYBR Kit (Takara, Clontech, China) according to the manufacturer’s protocol, using the StepOne plus Real-Time PCR System (Applied Biosystems, Thermo Fisher Scientific, Waltham, MA, USA). The relative quantification or fold change (FC) was obtained using the 2−ΔΔCt method, considering GAPDH as internal control.

4.6. Cell Invasion Assay

Invasion capacity was evaluated using a mobility system according to manufacturer protocol (BioCoat BD, Franklin Lakes, NJ, USA). After treatment with PM10, 50,000 cells were seeded in a mobile, 24-well chamber previously rehydrated. Then, 750 µL of chemoattractant (DMEM with 5% FBS) was added to the lower chamber, and samples were incubated for 22 h at 37 °C under an atmosphere of 5% of CO2. After that, medium was removed from the apical compartment, and the chamber was transferred to a second mobile plate of 24 wells containing 500 µL per well of calcein AM (4µg/mL in Hank’s balanced salt solution (HBSS) and incubated for 1 h at 37 °C under an atmosphere of 5% of CO2. Fluorescence of invaded cells was analyzed in a fluorescence plate reader (Tecan, GENios Plus, Männedorf, Switzerland) with bottom reading capabilities at excitation/emission wavelengths of 485/530 nm without further manipulation. Only those labeled cells that invaded the Matrigel Matrix and passed through the pores of the FluoroBlok membrane were detected using an inverted fluorescence microscope (40×, Carl Zeiss, AxioVert 200 M, Zeiss, Oberkoche, Germany).

4.7. Statistical Analysis

Gene expression, protein levels/phosphorylation, and invasion assays were analyzed by one-way analysis of variance and post hoc comparisons performed with Bonferroni’s and Dunn’s tests. Analysis was performed in the GraphPad Prism 6 software. Statistically significant differences were considered at the 95% level (p < 0.05).

5. Conclusions

PM10 induces overexpression of TGFB1 and genes involved in the activation of the epithelial–mesenchymal transition in lung cancer cell line A549, predisposing cells to the acquisition of an invasive phenotype, a hallmark necessary during the carcinogenic process.

Supplementary Materials

Author Contributions

C.M.G.-C., M.S.-A., Y.I.C., and Y.S.-P. conceived the original idea; C.M.G.-C., M.S.-A., Y.I.C., and Y.S.-P. designed the study; R.Q.-B., R.M.-B., E.M.Q.-M., and M.S.-A. were involved in the experimental conduction; M.S.-A. and Y.S.-P. analyzed the data; M.S.-A. drafted the manuscript. All authors have read and agreed to the published version of the manuscript.

Funding

This study has been supported by CONACYT (Consejo Nacional de Ciencia y Tecnología—México)—FOSISS (Fondo Sectorial de Investigación en Salud y Seguridad Social SS/IMSS/ISSTE-CONACYT). FOSISS grants A3-S-48281 (CMGC) and A3-S-41131 (YSP).

Institutional Review Board Statement

Not applicable.

Informed Consent Statement

Not applicable.

Data Availability Statement

The data that support the findings of this study are available from the corresponding author upon reasonable request.

Conflicts of Interest

Authors declare no conflict of interest regarding to this manuscript.

References

  1. Loomis, D.; Grosse, Y.; Lauby-Secretan, B.; El Ghissassi, F.; Bouvard, V.; Benbrahim-Tallaa, L.; Guha, N.; Baan, R.; Mattock, H.; Straif, K.; et al. The carcinogenicity of outdoor air pollution. Lancet Oncol. 2013, 14, 1262–1263. [Google Scholar] [CrossRef]
  2. Pope, C.A., 3rd; Burnett, R.T.; Thun, M.J.; Calle, E.E.; Krewski, D.; Ito, K.; Thurston, G.D. Lung cancer, cardiopulmonary mortality, and long-term exposure to fine particulate air pollution. Jama 2002, 287, 1132–1141. [Google Scholar] [CrossRef] [Green Version]
  3. de Kok, T.M.; Driece, H.A.; Hogervorst, J.G.; Briede, J.J. Toxicological assessment of ambient and traffic-related particulate matter: A review of recent studies. Mutat. Res. 2006, 613, 103–122. [Google Scholar] [CrossRef]
  4. Falcon-Rodriguez, C.I.; Osornio-Vargas, A.R.; Sada-Ovalle, I.; Segura-Medina, P. Aeroparticles, Composition, and Lung Diseases. Front. Immunol. 2016, 7, 3. [Google Scholar] [CrossRef] [Green Version]
  5. Turner, M.C.; Andersen, Z.J.; Baccarelli, A.; Diver, W.R.; Gapstur, S.M.; Pope III, C.A.; Prada, D.; Samet, J.; Thurston, G.; Cohen, A. Outdoor air pollution and cancer: An overview of the current evidence and public health recommendations. CA Cancer J. Clin. 2020, 70, 460–479. [Google Scholar] [CrossRef]
  6. Bray, F.; Ferlay, J.; Soerjomataram, I.; Siegel, R.L.; Torre, L.A.; Jemal, A. Global cancer statistics 2018: GLOBOCAN estimates of incidence and mortality worldwide for 36 cancers in 185 countries. CA Cancer J. Clin. 2018, 68, 394–424. [Google Scholar] [CrossRef] [Green Version]
  7. WHO. Ambient Air Pollution: A Global Assessment of Exposure and Burden of Disease; World Health Organization Publications: Geneva, Switzerland, 2016; p. 121. [Google Scholar]
  8. Katsuno, Y.; Lamouille, S.; Derynck, R. TGF-β signaling and epithelial-mesenchymal transition in cancer progression. Curr. Opin. Oncol. 2013, 25, 76–84. [Google Scholar] [CrossRef]
  9. Chaffer, C.L.; San Juan, B.P.; Lim, E.; Weinberg, R.A. EMT, cell plasticity and metastasis. Cancer Metastasis Rev. 2016, 35, 645–654. [Google Scholar] [CrossRef] [PubMed]
  10. Kourtidis, A.; Lu, R.; Pence, L.J.; Anastasiadis, P.Z. A central role for cadherin signaling in cancer. Exp. Cell Res. 2017, 358, 78–85. [Google Scholar] [CrossRef] [PubMed]
  11. Miyazono, K.; Katsuno, Y.; Koinuma, D.; Ehata, S.; Morikawa, M. Intracellular and extracellular TGF-β signaling in cancer: Some recent topics. Front. Med. 2018, 12, 387–411. [Google Scholar] [CrossRef] [Green Version]
  12. Kalluri, R.; Weinberg, R.A. The basics of epithelial-mesenchymal transition. J. Clin. Investig. 2009, 119, 1420–1428. [Google Scholar] [CrossRef] [Green Version]
  13. Zavadil, J.; Böttinger, E.P. TGF-beta and epithelial-to-mesenchymal transitions. Oncogene 2005, 24, 5764–5774. [Google Scholar] [CrossRef] [Green Version]
  14. Fernandez, I.E.; Eickelberg, O. The impact of TGF-β on lung fibrosis: From targeting to biomarkers. Proc. Am. Thorac. Soc. 2012, 9, 111–116. [Google Scholar] [CrossRef] [PubMed]
  15. Miyazawa, K.; Shinozaki, M.; Hara, T.; Furuya, T.; Miyazono, K. Two major Smad pathways in TGF-beta superfamily signalling. Genes Cells Devoted Mol. Cell. Mech. 2002, 7, 1191–1204. [Google Scholar] [CrossRef] [PubMed]
  16. Huang, F.; Chen, Y.G. Regulation of TGF-β receptor activity. Cell Biosci. 2012, 2, 9. [Google Scholar] [CrossRef] [Green Version]
  17. Vander Ark, A.; Cao, J.; Li, X. TGF-β receptors: In and beyond TGF-β signaling. Cell. Signal. 2018, 52, 112–120. [Google Scholar] [CrossRef]
  18. Fabregat, I.; Caballero-Díaz, D. Transforming Growth Factor-β-Induced Cell Plasticity in Liver Fibrosis and Hepatocarcinogenesis. Front. Oncol. 2018, 8, 357. [Google Scholar] [CrossRef] [Green Version]
  19. Guaita, S.; Puig, I.; Franci, C.; Garrido, M.; Dominguez, D.; Batlle, E.; Sancho, E.; Dedhar, S.; De Herreros, A.G.; Baulida, J. Snail induction of epithelial to mesenchymal transition in tumor cells is accompanied by MUC1 repression and ZEB1 expression. J. Biol. Chem. 2002, 277, 39209–39216. [Google Scholar] [CrossRef] [Green Version]
  20. Burger, G.A.; Danen, E.H.J.; Beltman, J.B. Deciphering Epithelial-Mesenchymal Transition Regulatory Networks in Cancer through Computational Approaches. Front. Oncol. 2017, 7, 162. [Google Scholar] [CrossRef]
  21. Batlle, E.; Sancho, E.; Francí, C.; Domínguez, D.; Monfar, M.; Baulida, J.; García De Herreros, A. The transcription factor snail is a repressor of E-cadherin gene expression in epithelial tumour cells. Nat. Cell Biol. 2000, 2, 84–89. [Google Scholar] [CrossRef] [PubMed]
  22. Vesuna, F.; van Diest, P.; Chen, J.H.; Raman, V. Twist is a transcriptional repressor of E-cadherin gene expression in breast cancer. Biochem. Biophys. Res. Commun. 2008, 367, 235–241. [Google Scholar] [CrossRef] [PubMed] [Green Version]
  23. Yang, D.; Ma, M.; Zhou, W.; Yang, B.; Xiao, C. Inhibition of miR-32 activity promoted EMT induced by PM2.5 exposure through the modulation of the Smad1-mediated signaling pathways in lung cancer cells. Chemosphere 2017, 184, 289–298. [Google Scholar] [CrossRef] [PubMed]
  24. Libalova, H.; Krckova, S.; Uhlirova, K.; Klema, J.; Ciganek, M.; Rossner, P., Jr.; Sram, R.J.; Vondracek, J.; Machala, M.; Topinka, J. Analysis of gene expression changes in A549 cells induced by organic compounds from respirable air particles. Mutat. Res. 2014, 770, 94–105. [Google Scholar] [CrossRef]
  25. Wei, H.; Liang, F.; Cheng, W.; Zhou, R.; Wu, X.; Feng, Y.; Wang, Y. The mechanisms for lung cancer risk of PM2.5: Induction of epithelial-mesenchymal transition and cancer stem cell properties in human non-small cell lung cancer cells. Environ. Toxicol. 2017, 32, 2341–2351. [Google Scholar] [CrossRef]
  26. Chi, Y.; Huang, Q.; Lin, Y.; Ye, G.; Zhu, H.; Dong, S. Epithelial-mesenchymal transition effect of fine particulate matter from the Yangtze River Delta region in China on human bronchial epithelial cells. J. Environ. Sci. 2018, 66, 155–164. [Google Scholar] [CrossRef] [PubMed]
  27. Huang, X.; Wu, C.; Fu, Y.; Guo, L.; Kong, X.; Cai, H. Methylation analysis for multiple gene promoters in non-small cell lung cancers in high indoor air pollution region in China. Bull. Du Cancer 2018, 105, 746–754. [Google Scholar] [CrossRef]
  28. Yang, B.; Li, X.; Chen, D.; Xiao, C. Effects of fine air particulates on gene expression in non-small-cell lung cancer. Adv. Med. Sci. 2017, 62, 295–301. [Google Scholar] [CrossRef]
  29. Morales-Barcenas, R.; Chirino, Y.I.; Sanchez-Perez, Y.; Osornio-Vargas, A.R.; Melendez-Zajgla, J.; Rosas, I.; Garcia-Cuellar, C.M. Particulate matter (PM(1)(0)) induces metalloprotease activity and invasion in airway epithelial cells. Toxicol. Lett. 2015, 237, 167–173. [Google Scholar] [CrossRef]
  30. Yang, B.; Chen, D.; Zhao, H.; Xiao, C. The effects for PM2.5 exposure on non-small-cell lung cancer induced motility and proliferation. SpringerPlus 2016, 5, 2059. [Google Scholar] [CrossRef] [Green Version]
  31. Zhang, Q.; Luo, Q.; Yuan, X.; Chai, L.; Li, D.; Liu, J.; Lv, Z. Atmospheric particulate matter2.5 promotes the migration and invasion of hepatocellular carcinoma cells. Oncol. Lett. 2017, 13, 3445–3450. [Google Scholar] [CrossRef] [Green Version]
  32. Chen, Z.; Ji, N.; Wang, Z.; Wu, C.; Sun, Z.; Li, Y.; Hu, F.; Wang, Z.; Huang, M.; Zhang, M. Fine Particulate Matter (PM2.5) Promoted the Invasion of Lung Cancer Cells via an ARNT2/PP2A/STAT3/MMP2 Pathway. J. Biomed. Nanotechnol. 2018, 14, 2172–2184. [Google Scholar] [CrossRef] [PubMed]
  33. Acloque, H.; Adams, M.S.; Fishwick, K.; Bronner-Fraser, M.; Nieto, M.A. Epithelial-mesenchymal transitions: The importance of changing cell state in development and disease. J. Clin. Investig. 2009, 119, 1438–1449. [Google Scholar] [CrossRef] [PubMed] [Green Version]
  34. Bartis, D.; Mise, N.; Mahida, R.Y.; Eickelberg, O.; Thickett, D.R. Epithelial-mesenchymal transition in lung development and disease: Does it exist and is it important? Thorax 2014, 69, 760–765. [Google Scholar] [CrossRef] [PubMed] [Green Version]
  35. Thiery, J.P. Epithelial-mesenchymal transitions in tumour progression. Nat. Rev. Cancer 2002, 2, 442–454. [Google Scholar] [CrossRef] [PubMed]
  36. Thiery, J.P.; Acloque, H.; Huang, R.Y.; Nieto, M.A. Epithelial-mesenchymal transitions in development and disease. Cell 2009, 139, 871–890. [Google Scholar] [CrossRef]
  37. Brabletz, T.; Kalluri, R.; Nieto, M.A.; Weinberg, R.A. EMT in cancer. Nat. Rev. Cancer 2018, 18, 128–134. [Google Scholar] [CrossRef]
  38. Nowrin, K.; Sohal, S.S.; Peterson, G.; Patel, R.; Walters, E.H. Epithelial-mesenchymal transition as a fundamental underlying pathogenic process in COPD airways: Fibrosis, remodeling and cancer. Expert Rev. Respir. Med. 2014, 8, 547–559. [Google Scholar] [CrossRef]
  39. Pain, M.; Bermudez, O.; Lacoste, P.; Royer, P.J.; Botturi, K.; Tissot, A.; Brouard, S.; Eickelberg, O.; Magnan, A. Tissue remodelling in chronic bronchial diseases: From the epithelial to mesenchymal phenotype. Eur. Respir. Rev. Off. J. Eur. Respir. Soc. 2014, 23, 118–130. [Google Scholar] [CrossRef] [Green Version]
  40. Mittal, V. Epithelial Mesenchymal Transition in Aggressive Lung Cancers. Adv. Exp. Med. Biol. 2016, 890, 37–56. [Google Scholar] [CrossRef]
  41. Xiao, D.; He, J. Epithelial mesenchymal transition and lung cancer. J. Thorac. Dis. 2010, 2, 154–159. [Google Scholar] [CrossRef]
  42. Polette, M.; Mestdagt, M.; Bindels, S.; Nawrocki-Raby, B.; Hunziker, W.; Foidart, J.M.; Birembaut, P.; Gilles, C. Beta-catenin and ZO-1: Shuttle molecules involved in tumor invasion-associated epithelial-mesenchymal transition processes. Cells Tissues Organs 2007, 185, 61–65. [Google Scholar] [CrossRef] [PubMed]
  43. Polette, M.; Nawrocki-Raby, B.; Gilles, C.; Clavel, C.; Birembaut, P. Tumour invasion and matrix metalloproteinases. Crit. Rev. Oncol./Hematol. 2004, 49, 179–186. [Google Scholar] [CrossRef] [PubMed]
  44. Kalluri, R.; Zeisberg, M. Fibroblasts in cancer. Nat. Rev. Cancer 2006, 6, 392–401. [Google Scholar] [CrossRef]
  45. Jung, H.Y.; Fattet, L.; Yang, J. Molecular pathways: Linking tumor microenvironment to epithelial-mesenchymal transition in metastasis. Clin. Cancer Res. Off. J. Am. Assoc. Cancer Res. 2015, 21, 962–968. [Google Scholar] [CrossRef] [Green Version]
  46. Syn, N.; Wang, L.; Sethi, G.; Thiery, J.P.; Goh, B.C. Exosome-Mediated Metastasis: From Epithelial-Mesenchymal Transition to Escape from Immunosurveillance. Trends Pharmacol. Sci. 2016, 37, 606–617. [Google Scholar] [CrossRef] [PubMed]
  47. Cheung, K.; Daher, N.; Kam, W.; Shafer, M.M.; Ning, Z.; Schauer, J.J.; Sioutas, C. Spatial and temporal variation of chemical composition and mass closure of ambient coarse particulate matter (PM10–2.5) in the Los Angeles area. Atmos. Environ. 2011, 45, 2651–2662. [Google Scholar] [CrossRef]
  48. Azevedo, R.S.S.; de Sousa, J.R.; Araujo, M.T.F.; Martins Filho, A.J.; de Alcantara, B.N.; Araujo, F.M.C.; Queiroz, M.G.L.; Cruz, A.C.R.; Vasconcelos, B.H.B.; Chiang, J.O.; et al. In situ immune response and mechanisms of cell damage in central nervous system of fatal cases microcephaly by Zika virus. Sci. Rep. 2018, 8, 1. [Google Scholar] [CrossRef]
  49. Plummer, L.E.; Ham, W.; Kleeman, M.J.; Wexler, A.; Pinkerton, K.E. Influence of Season and Location on Pulmonary Response to California’s San Joaquin Valley Airborne Particulate Matter. J. Toxicol. Environ. Health Part. A 2012, 75, 253–271. [Google Scholar] [CrossRef] [PubMed]
  50. Tsai, M.Y.; Hoek, G.; Eeftens, M.; de Hoogh, K.; Beelen, R.; Beregszászi, T.; Cesaroni, G.; Cirach, M.; Cyrys, J.; De Nazelle, A.; et al. Spatial variation of PM elemental composition between and within 20 European study areas--Results of the ESCAPE project. Environ. Int. 2015, 84, 181–192. [Google Scholar] [CrossRef]
  51. Hamra, G.B.; Guha, N.; Cohen, A.; Laden, F.; Raaschou-Nielsen, O.; Samet, J.M.; Vineis, P.; Forastiere, F.; Saldiva, P.; Yorifuji, T.; et al. Outdoor particulate matter exposure and lung cancer: A systematic review and meta-analysis. Environ. Health Perspect. 2014, 122, 906–911. [Google Scholar] [CrossRef] [Green Version]
  52. Eckel, S.P.; Cockburn, M.; Shu, Y.H.; Deng, H.; Lurmann, F.W.; Liu, L.; Gilliland, F.D. Air pollution affects lung cancer survival. Thorax 2016, 71, 891–898. [Google Scholar] [CrossRef] [PubMed] [Green Version]
  53. Puisieux, A.; Pommier, R.M.; Morel, A.P.; Lavial, F. Cellular Pliancy and the Multistep Process of Tumorigenesis. Cancer Cell 2018, 33, 164–172. [Google Scholar] [CrossRef] [PubMed] [Green Version]
  54. Gos, M.; Miłoszewska, J.; Przybyszewska, M. Epithelial-mesenchymal transition in cancer progression. Postepy Biochem. 2009, 55, 121–128. [Google Scholar] [PubMed]
  55. Thevenot, P.T.; Saravia, J.; Jin, N.; Giaimo, J.D.; Chustz, R.E.; Mahne, S.; Kelley, M.A.; Hebert, V.Y.; Dellinger, B.; Dugas, T.R.; et al. Radical-containing ultrafine particulate matter initiates epithelial-to-mesenchymal transitions in airway epithelial cells. Am. J. Respir. Cell Mol. Biol. 2013, 48, 188–197. [Google Scholar] [CrossRef] [PubMed] [Green Version]
  56. Tas, I.; Zhou, R.; Park, S.Y.; Yang, Y.; Gamage, C.D.B.; Son, Y.J.; Paik, M.J.; Kim, H. Inflammatory and tumorigenic effects of environmental pollutants found in particulate matter on lung epithelial cells. Toxicol. Vitr. Int. J. Publ. Assoc. BIBRA 2019, 59, 300–311. [Google Scholar] [CrossRef]
  57. Cochard, M.; Ledoux, F.; Landkocz, Y. Atmospheric fine particulate matter and epithelial mesenchymal transition in pulmonary cells: State of the art and critical review of the in vitro studies. J. Toxicol. Environ. Health Part B 2020, 23, 293–318. [Google Scholar] [CrossRef]
  58. Sanchez-Perez, Y.; Chirino, Y.I.; Osornio-Vargas, A.R.; Morales-Barcenas, R.; Gutierrez-Ruiz, C.; Vazquez-Lopez, I.; Garcia-Cuellar, C.M. DNA damage response of A549 cells treated with particulate matter (PM10) of urban air pollutants. Cancer Lett. 2009, 278, 192–200. [Google Scholar] [CrossRef]
  59. Salcido-Neyoy, M.E.; Sanchez-Perez, Y.; Osornio-Vargas, A.R.; Gonsebatt, M.E.; Melendez-Zajgla, J.; Morales-Barcenas, R.; Petrosyan, P.; Molina-Servin, E.D.; Vega, E.; Manzano-Leon, N.; et al. Induction of c-Jun by air particulate matter (PM10) of Mexico city: Participation of polycyclic aromatic hydrocarbons. Environ. Pollut. 2015, 203, 175–182. [Google Scholar] [CrossRef]
  60. Chirino, Y.I.; Garcia-Cuellar, C.M.; Garcia-Garcia, C.; Soto-Reyes, E.; Osornio-Vargas, A.R.; Herrera, L.A.; Lopez-Saavedra, A.; Miranda, J.; Quintana-Belmares, R.; Perez, I.R.; et al. Airborne particulate matter in vitro exposure induces cytoskeleton remodeling through activation of the ROCK-MYPT1-MLC pathway in A549 epithelial lung cells. Toxicol. Lett. 2017, 272, 29–37. [Google Scholar] [CrossRef]
  61. Li, N.; Hao, M.; Phalen, R.F.; Hinds, W.C.; Nel, A.E. Particulate air pollutants and asthma. A paradigm for the role of oxidative stress in PM-induced adverse health effects. Clin. Immunol. 2003, 109, 250–265. [Google Scholar] [CrossRef]
  62. Ferecatu, I.; Borot, M.C.; Bossard, C.; Leroux, M.; Boggetto, N.; Marano, F.; Baeza-Squiban, A.; Andreau, K. Polycyclic aromatic hydrocarbon components contribute to the mitochondria-antiapoptotic effect of fine particulate matter on human bronchial epithelial cells via the aryl hydrocarbon receptor. Part. Fibre Toxicol. 2010, 7, 18. [Google Scholar] [CrossRef] [PubMed] [Green Version]
Figure 1. Particulate matter PM10 increases the phosphorylation of SMAD2/3 and the levels of SMAD4 in A549 cells after 48 h of treatment: (A) Particulate matter exposure increases the phosphorylation levels of SMAD2/3 in A549 cells transfected with non-targeting siRNA, with a similar effect in cells treated with TGF- β for 48 h. (B) PM10 exposure increases the protein levels of SMAD4 in A549 cells transfected with non-targeting siRNA, with a similar effect in cells treated with TGF- β for 48 h. These effects are not prevented in A549 cells transfected with TGFB1 siRNAs. Cells were exposed to PM10 (10 µg/cm2) and TGF-β (5 ng/mL) for 48 h. The quantitative results were expressed after normalization using GAPDH as a loading control. Data are reported as the means ± SD of three independent experiments. The images are representative of the data obtained. (*) indicates statistically differences between treatments. Densitometry was performed using arbitrary units p < 0.05.
Ijms 22 12632 g001
Figure 2. Particulate matter PM10 induces the expression of TGFB1 and EMT components in A549 cells after 48 h of treatment. Particulate matter exposure increases the expression levels of TGFB1, SNAI1 (Snail), SNAI2 (Slug), ZEB1 (ZEB1), CDH2 (N-cadherin) ACTA2 (α-SMA), and VIM (vimentin), and decreases the expression levels of CDH1 (E-cadherin), while TGF- β treatment increases the expression levels of TGFB1, SNAI1 (Snail), SNAI2 (Slug), ZEB1 (ZEB1), CDH2 (N-cadherin), ACTA2 (α-SMA), and VIM (vimentin), and decreases the expression levels of CDH1 (E-cadherin) in cultures of A549 cells transfected with non-targeting siRNA. These effects are prevented by TGFB1 siRNAs only in TGFB1, SNAI1 (Snail), CDH2 (N-cadherin), and VIM (vimentin). Cells were exposed to PM10 (10 µg/cm2) and TGF-β (5 ng/mL) for 48 h. The quantitative results were expressed after normalization using GAPDH as a control. Data are reported as the means ± SD of three independent experiments. The images are representative of the data obtained. (*) indicates statistically differences between treatments. Relative quantification or fold change (FC) was performed using the 2−ΔΔCt; p < 0.05.
Ijms 22 12632 g002
Figure 3. Particulate matter PM10 increases the protein levels of EMT markers in A549 cells after 48 h of treatment. Particulate matter exposure increases the protein levels of Snail, Slug, ZEB1, N-cadherin, α-SMA, and vimentin, and decreases the protein levels of E-cadherin, while TGF-β treatment increases the protein levels of Snail, Slug, ZEB1, N-cadherin, α-SMA, and vimentin, and decreases the protein levels of E-cadherin in cultures of A549 cells transfected with non-targeting siRNA. These effects are prevented by TGFB1 siRNAs only in Slug, ZEB1, N-cadherin, α-SMA, and vimentin. Cells were exposed to PM10 (10 µg/cm2) and TGF-β (5 ng/mL) for 48 h. The quantitative results were expressed after normalization using GAPDH as a loading control. Data are reported as the means ± SD of three independent experiments. The images are representative of the data obtained. (*) indicates statistically differences between treatments. Densitometry was performed using arbitrary units p < 0.05.
Ijms 22 12632 g003
Figure 4. Particulate matter PM10 activates the invasive phenotype in A549 cells. Particulate matter exposure increases the invasiveness of A549 cells exposed to PM10 and transfected with non-targeting siRNA, with a similar effect in cells treated with TGF-β for 48 h. These effects are prevented in A549 cells transfected with TGFB1 siRNAs. Cells were exposed to PM10 (10 µg/cm2) and TGF-β (5 ng/mL) for 48 h. The quantitative results were expressed after obtaining the relative fluorescence units of each condition. Data are reported as the means ± SD of three independent experiments. The images are representative of data obtained. (*) indicates statistical differences between treatments p < 0.05.
Ijms 22 12632 g004
Figure 5. Schematic representation of the effect of PM10 in EMT. PM10 exposure cause overexpression of TGFB1 in A549 cells, promoting the autoinduction of TGF-β signaling. As a result, SNAI1 (Snail), SNAI2 (Slug), ZEB1 (ZEB1), CDH2 (N-cadherin), ACTA2 (α-SMA), and VIM (vimentin) genes are overexpressed, while CDH1 (E-cadherin) is downregulated in a TGFB1-dependent way. PM10 also induces phosphorylation of SMAD2/3 and an increase in protein levels of SMAD4 in a TGFB1-independent way. These alterations predispose cells to the acquisition of an invasive phenotype, as evidenced by the invasion assay. Stop signal (in CDH1) represents gene repression, while green and red arrows represent increase and decrease of protein levels, respectively.
Ijms 22 12632 g005
Publisher’s Note: MDPI stays neutral with regard to jurisdictional claims in published maps and institutional affiliations.

