1. Introduction
Apricot (
Prunus armeniaca) is an important fruit crop in Mediterranean basin countries and Asia, with a wide diversity in pomological characteristics and fruit quality properties due to its different diversification centers [
1]. Apricots are a good source of vitamins, carotenoids, and polyphenols [
2], which makes this species a good choice from a nutraceutical point of view [
3].
Higher plants have several defense mechanisms against biotic and abiotic stresses. Some of these mechanisms result in the synthesis of a large number of secondary metabolites. Flavonoids are one of these defense-related secondary metabolites, being a family of polyphenols synthesized by the phenylpropanoid biosynthetic pathway [
4]. These secondary metabolites remain in different plant organs and accumulate on the plant surface [
5]. In the case of flavonoid compounds, their accumulation is unequally distributed within tissues, as its concentration is higher in the peel of several fruits such as apple [
6], peach [
7], or apricot [
8].
Polyphenols have been identified as secondary metabolites with great antioxidant activity [
9,
10,
11]. In recent years, there is an increasing interest in them as contributors to fruit quality and dietary properties. In the case of apricot, the fruit peel is an excellent source of phenolic compounds. The main phenylpropanoid-derivate secondary metabolites in apricot are chlorogenic and neochlorogenic acids, two caffeate derivates monolignols, while the main flavonols are rutin and quercetin-3-glucuronide [
12].
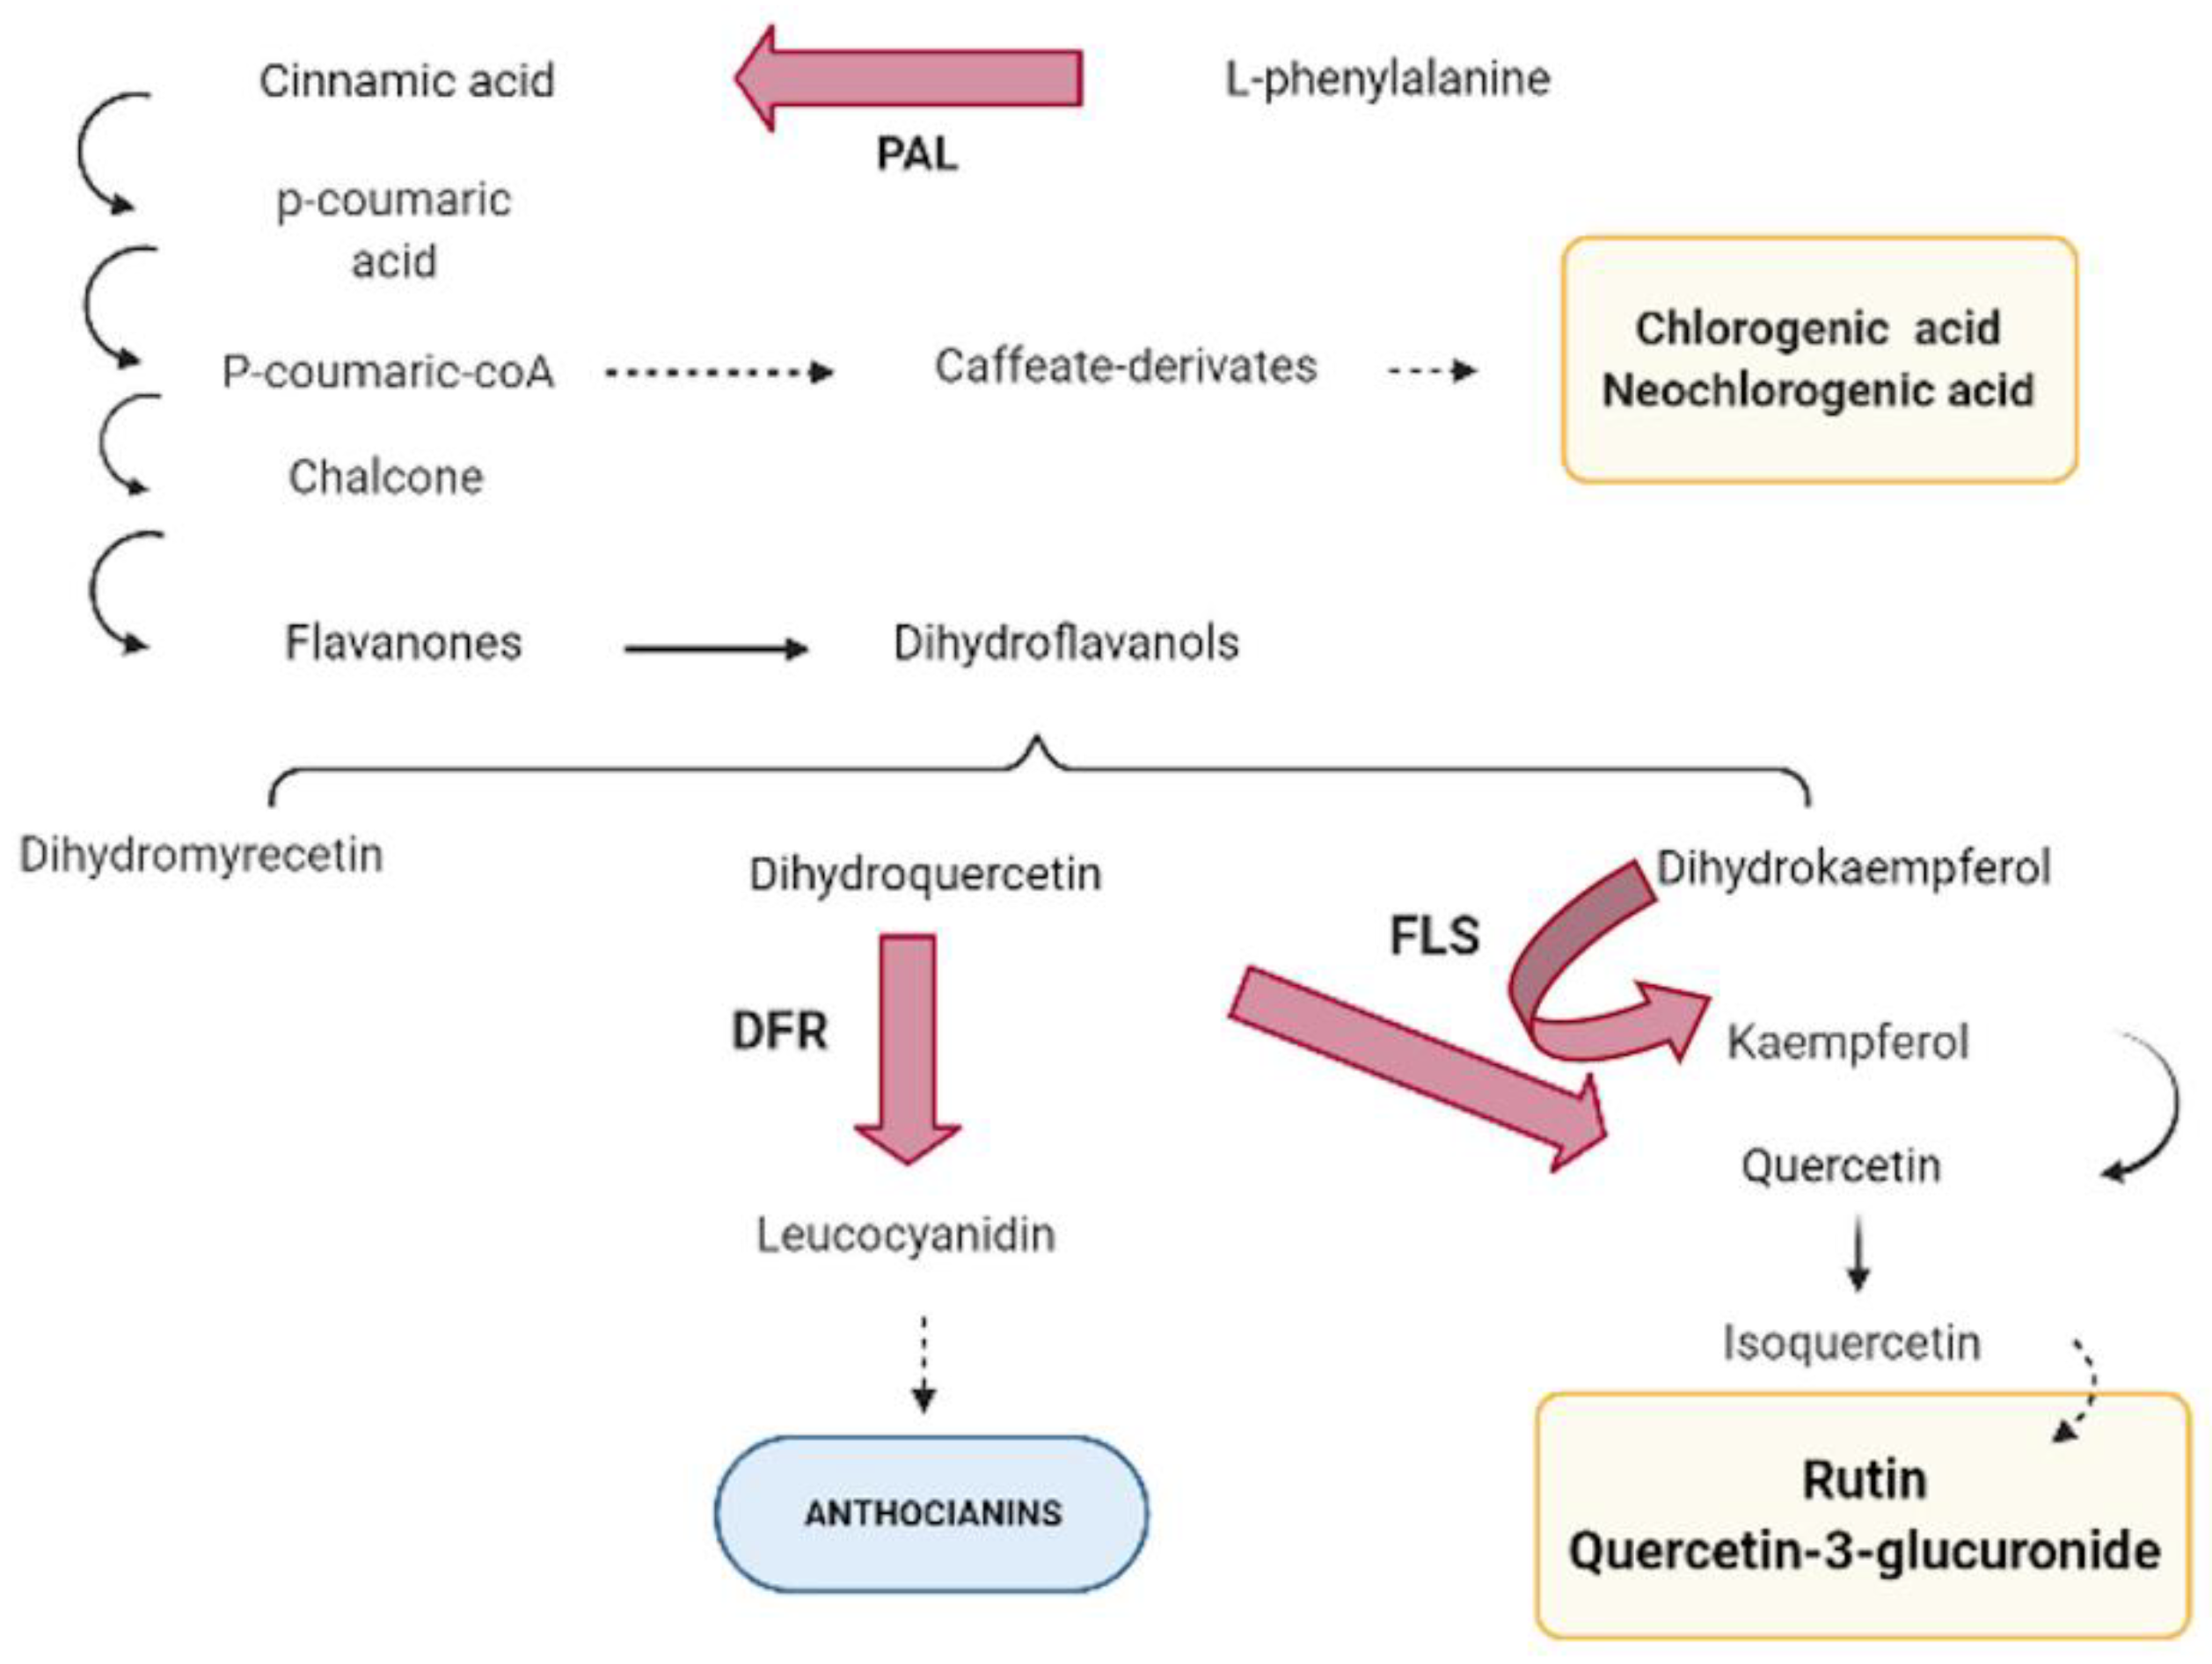
Phenylpropanoid biosynthesis starts from the conversion of L-phenylalanine into cinnamic acid due to the action of phenylalanine ammonia-lyase (PAL) (
Figure 1).
Phenylalanine ammonia-lyase (PAL) has been described as the first enzyme in the phenylpropanoid pathway, considered a key regulatory point between primary and secondary metabolism through conversion of L-phenylalanine into cinnamic acid [
13]. PAL is encoded by a multi-gene family, in which the number of genes involved depends on the species. In
Arabidopsis and
Nicotiana, four PAL-encoding genes have been described [
14,
15,
16], five in poplar [
17], and two in different
Prunus species [
18]. In the following step, cinnamic acid 4-hydroxylase converts cinnamic acid into 4-coumaric acid, to which a coenzyme-A is added due to the action of 4-coumarate-CoA ligase, giving 4-coumaroyl-CoA as a result. At this point, the pathway can branch off to the caffeate derivates biosynthesis, producing chlorogenic and neochlorogenic acids. Alternatively, 4-coumaroyl-CoA is also used by chalcone synthase to catalyze the synthesis of chalcone, which is isomerized to colorless flavanones. These compounds can be hydroxylated at three different positions, by three different flavonoid hydroxylases, producing a group of dihydroflavonols. Then, the phenolic pathway can branch off to the flavonols biosynthesis due to the action of flavonol synthase (FLS). This enzyme uses dihydroflavonols (dihydroquercetin, dihydrokaempferol, or dihydromyricetin) as a substrate to produce kaempferol, quercetin, or myricetin, the main precursors of some flavonols such as rutin or quercetin-3-glucuronide. Previous works have identified FLS-encoding genes in Arabidopsis [
19,
20]. In addition, FLS has been related with dihydroflavonols catalysis to flavonol but also it has been related to anthocyanin accumulation [
20,
21]. On the other hand, dihydroflavonol-4-reductase (DFR) enzyme controls one of the limiting steps of the anthocyanin pathway, reducing dihydroflavonols to leucoanthocyanidins [
22,
23,
24], therefore using the same substrate as FLS. Several DFR-encoding genes have been identified in different species [
23,
25,
26,
27]. Although phenolic metabolism regulation remains ambiguous in some points, various studies have identified the role of MYB transcription factors in phenolic synthesis regulation [
28,
29,
30].
Nevertheless, although the main steps of the metabolic pathway are described, the identification of key gene enzymes and their roles in the phenylpropanoid pathway of some fruit crops remain uncertain. As the first step for a better understanding of the phenolic pathway in fruits, we selected a set of apricot accessions from the IVIA’s apricot breeding program with genetic-based differences in phenolic compound accumulation [
8].
Fruit phenolic content of the genotypes selected was evaluated and compared with the genetic expression of genes encoding key enzymes of the phenolic biosynthesis pathway related to primary phenolic compounds (PAL), anthocyanin biosynthesis (DFR), and secondary phenolic metabolites (FLS). Since FLS and DFR use the same substrate for producing either flavonols or anthocyanins, respectively, their possible role in flavonol accumulation in apricot should be studied. Characterization of the expression of main genes acting in the phenolic pathway and its relationship with fruit polyphenol content will provide tools to unravel the phenolic pathway of fruit species. This information will be of interest in breeding programs aimed at increasing fruit quality and useful for the promotion of fruit consumption.
2. Results
2.1. Apricot Polyphenol Content
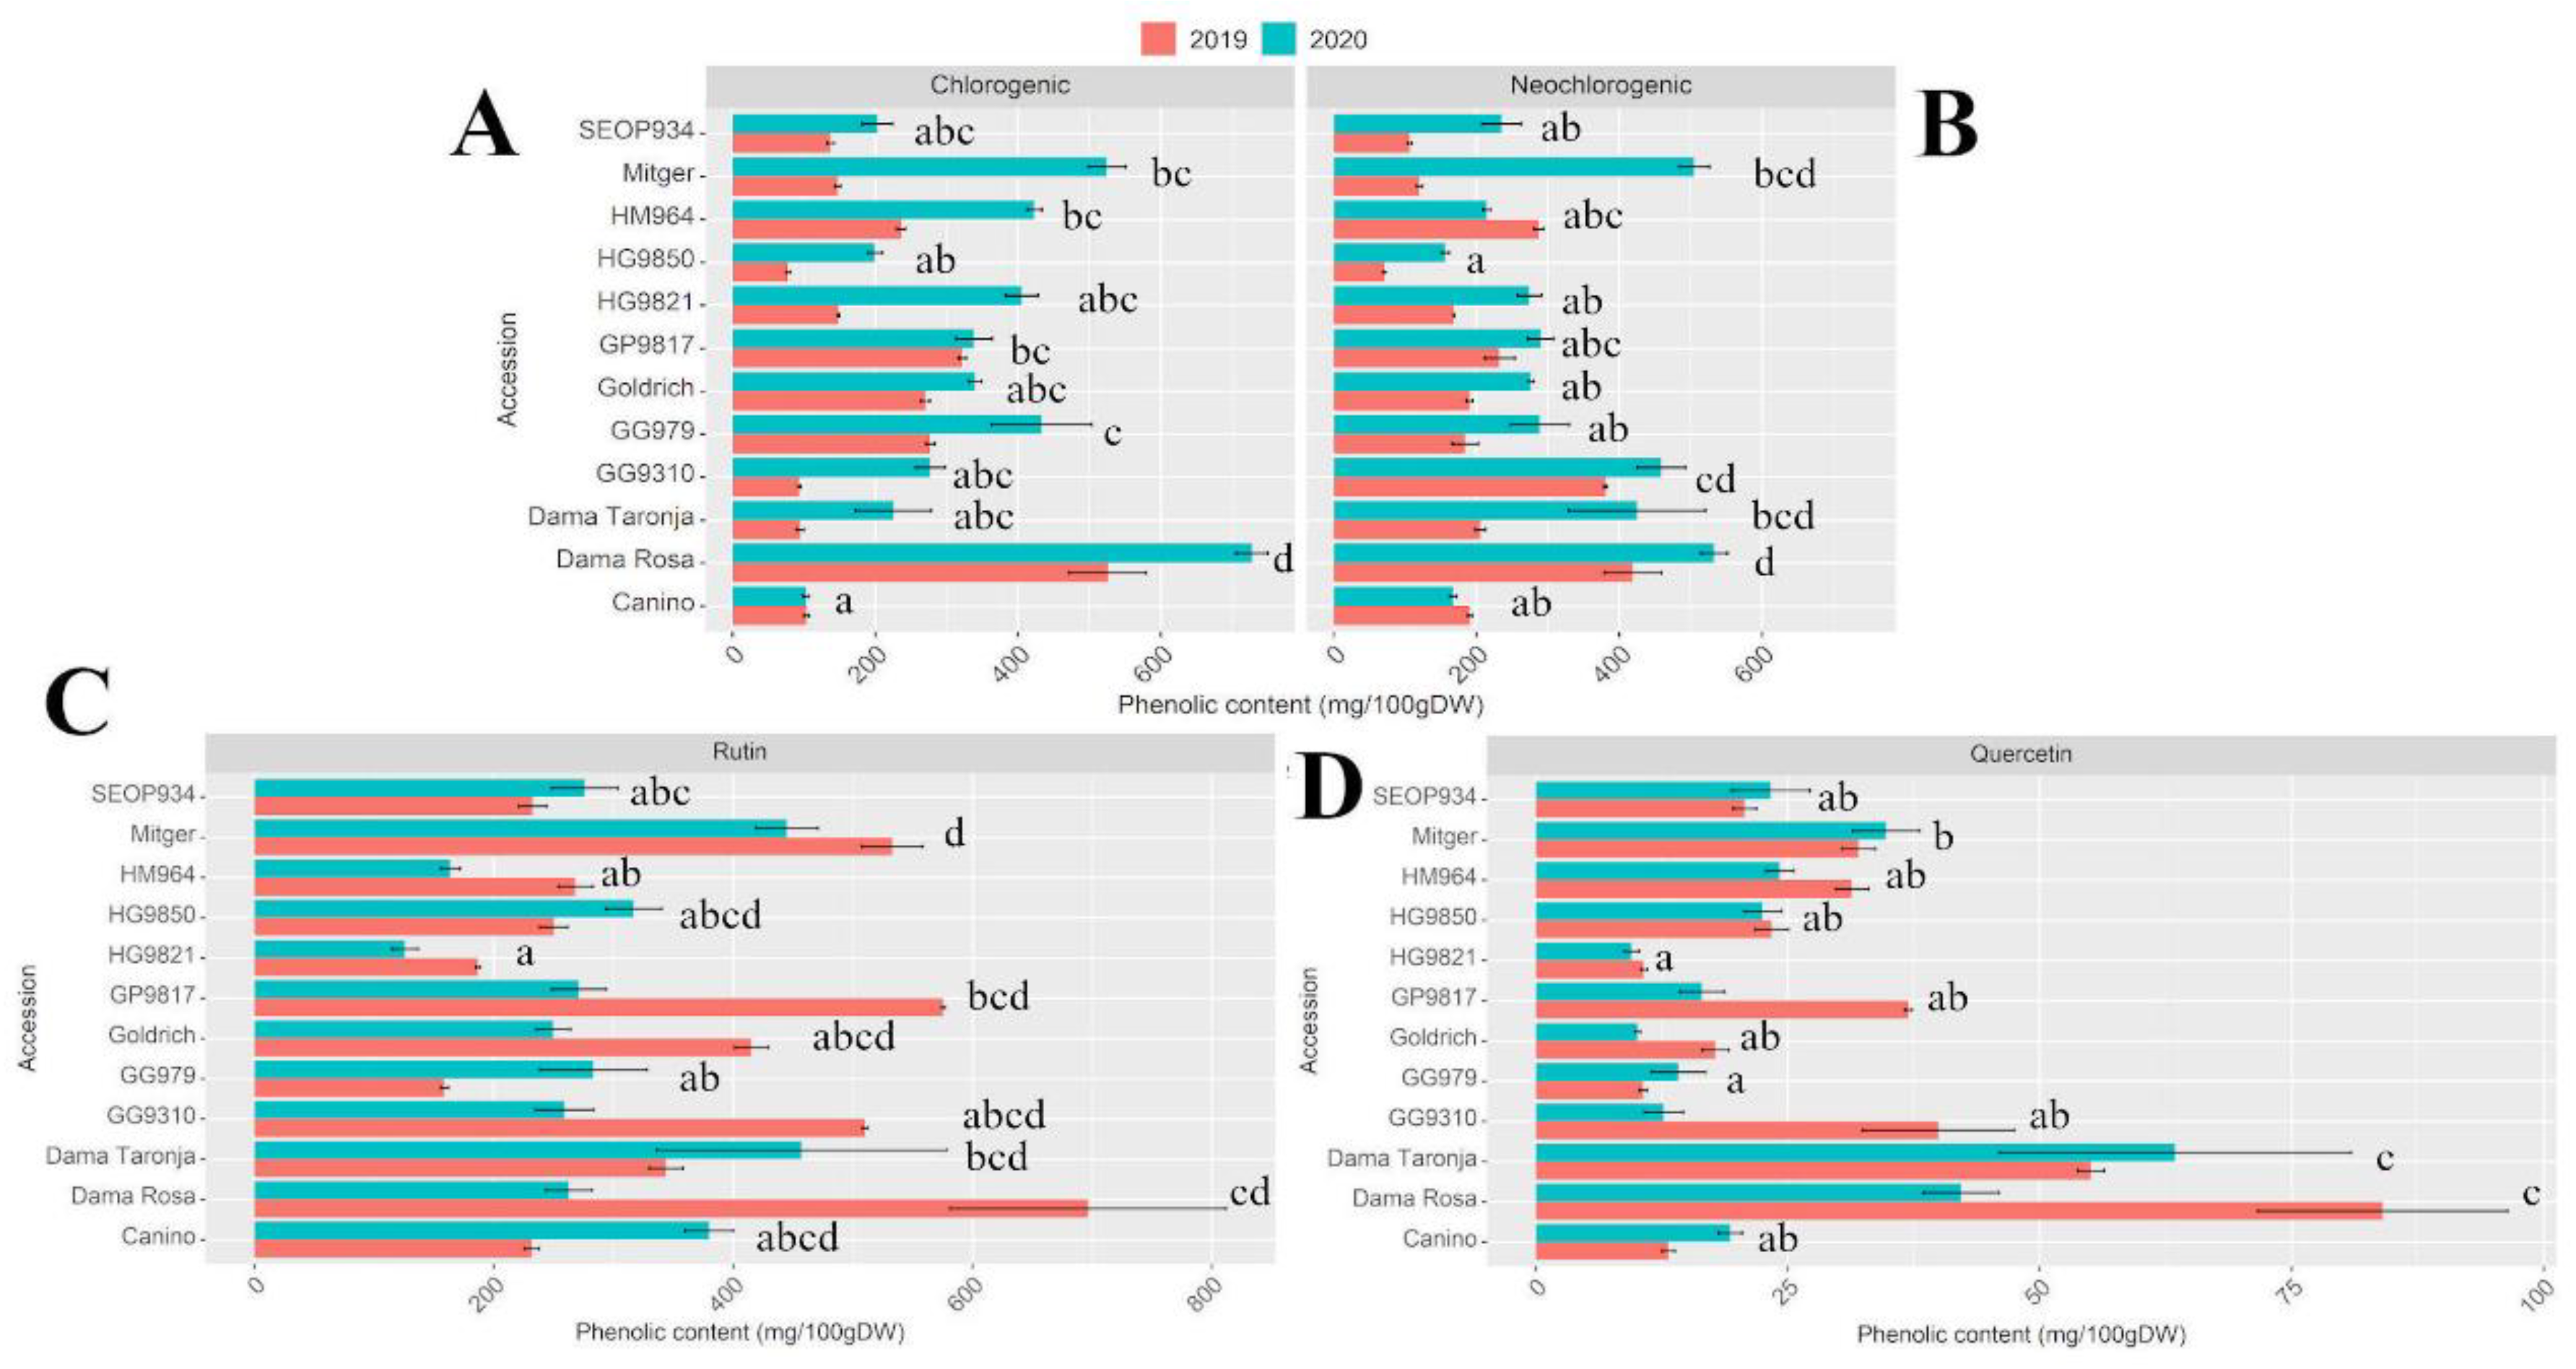
Total polyphenol content and the main phenolic compounds were evaluated for each year of study, including the two-years average content. Results are indicated in
Table 1 and
Table S1. Significant differences were found among all genotypes studied. The higher values were obtained in genotypes with an important red-blush color on the skin: ‘Dama Rosa’, ‘GG9310’, ‘GG979’, ‘GP9817’, and ‘HM964’.
The most important disease affecting
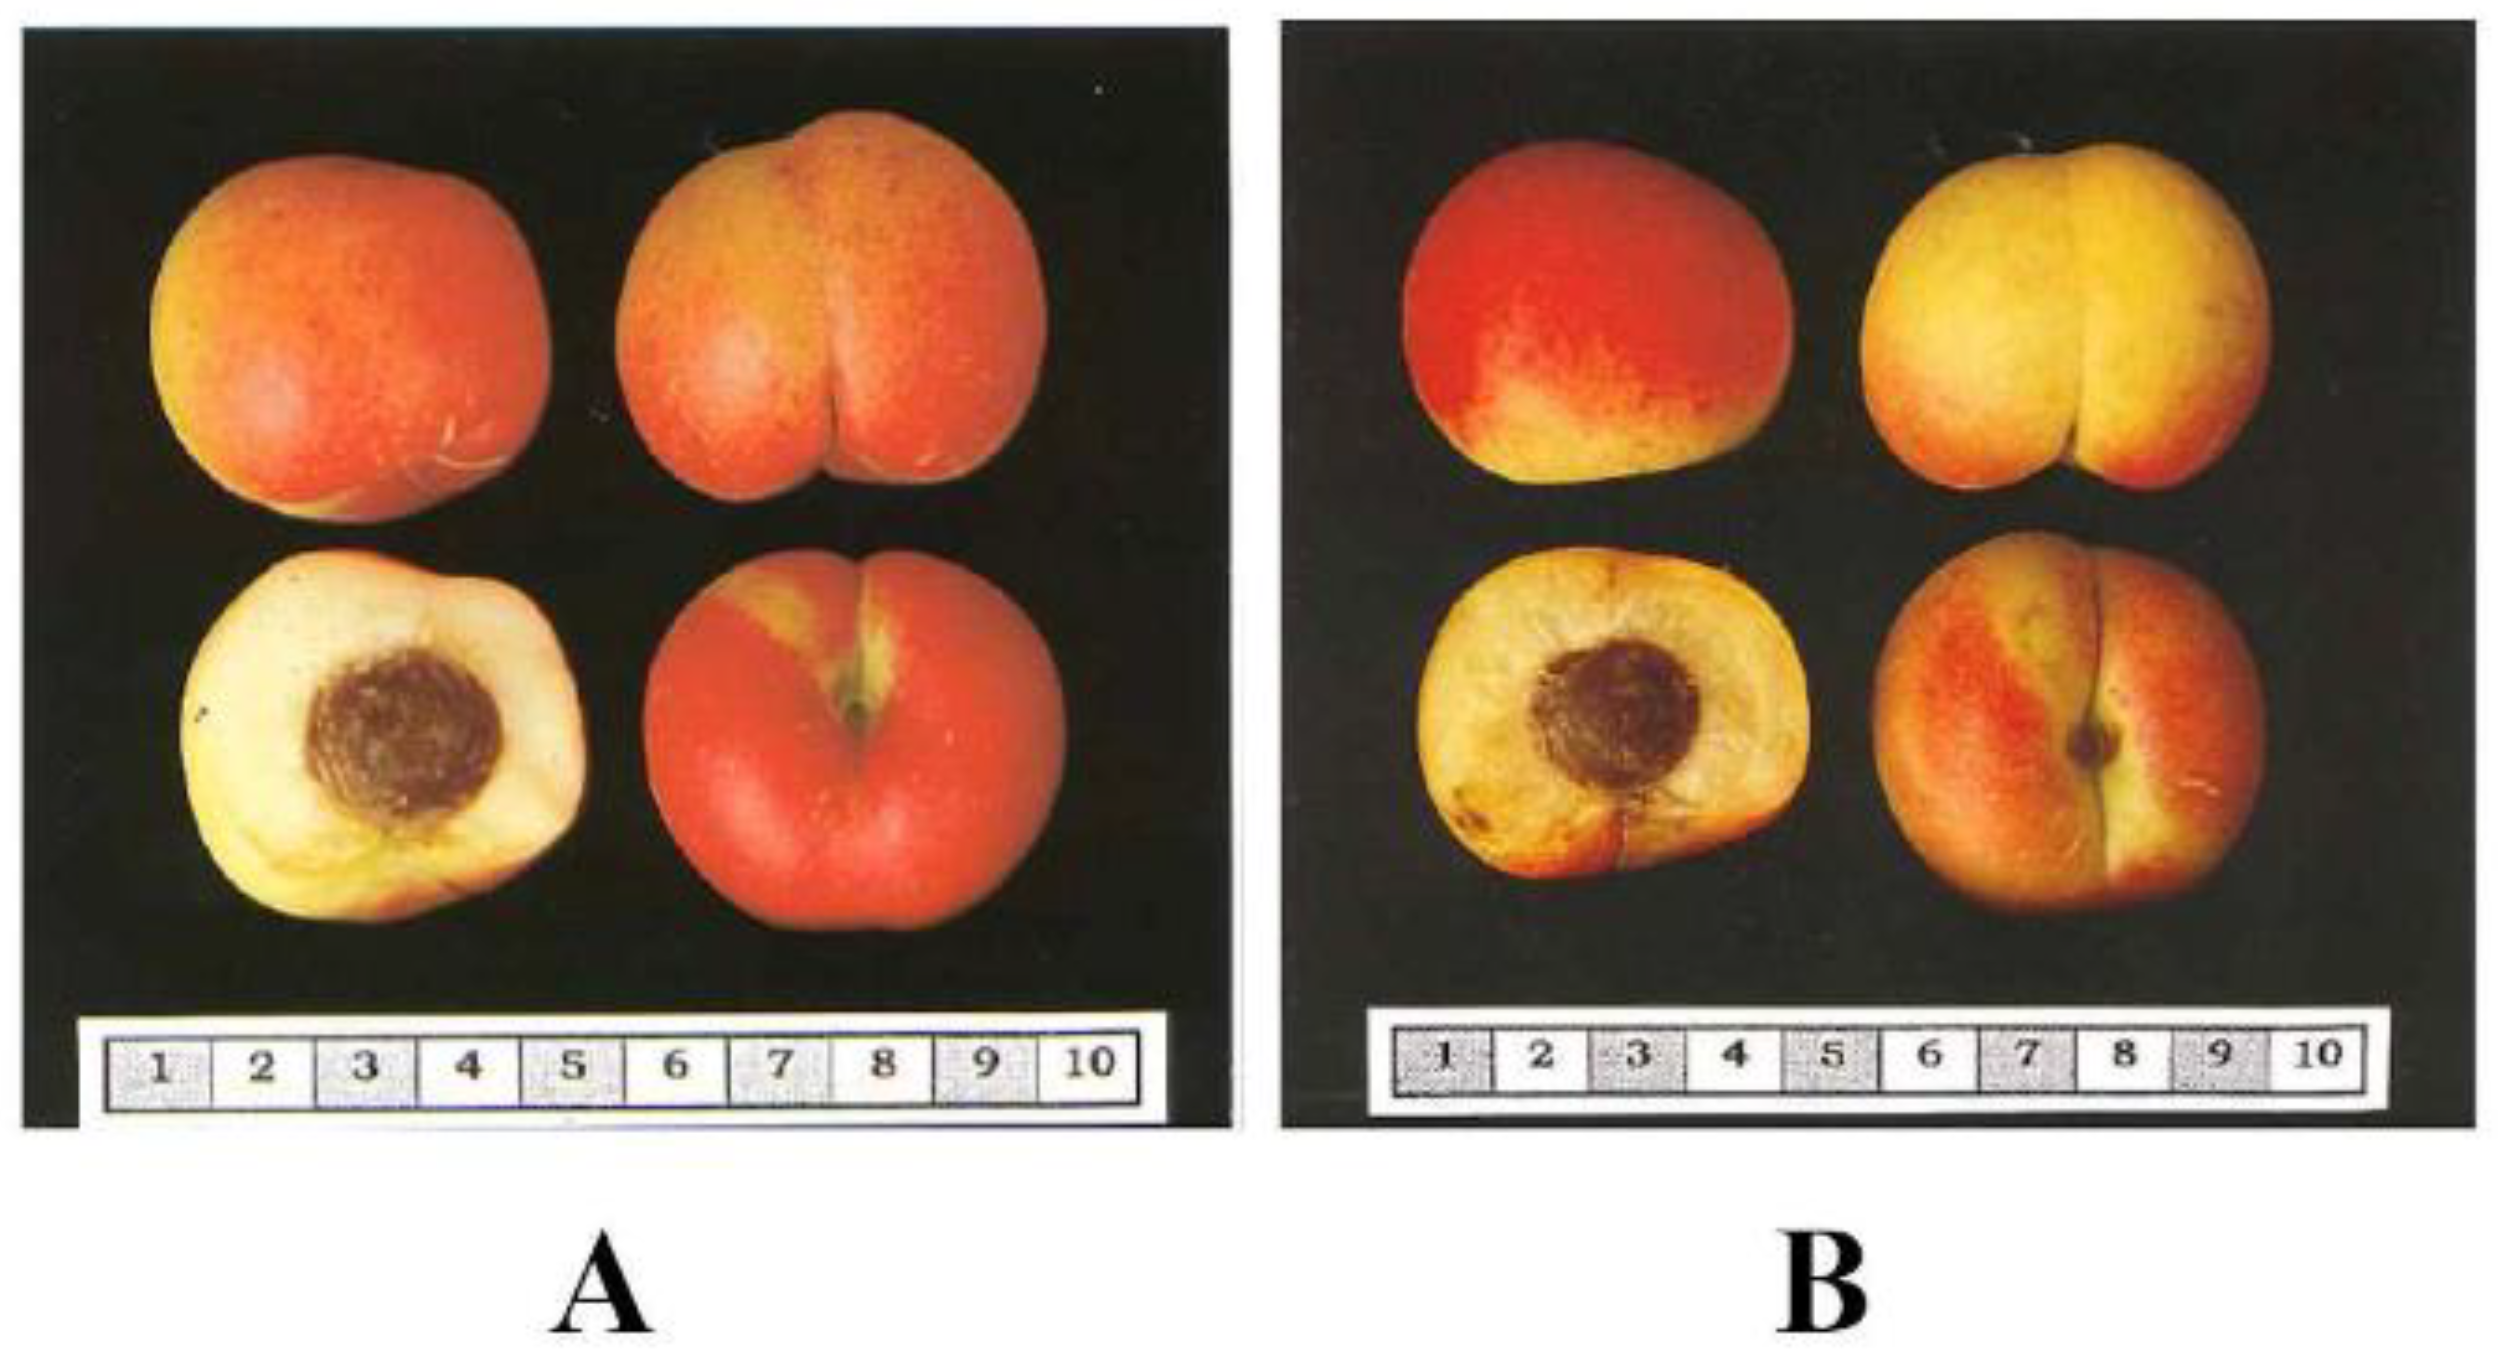
Prunus species is caused by the Plum Pox Virus (PPV). The donor of PPV resistance ‘Goldrich’ and hybrids between ‘Goldrich’ and the Mediterranean autochthonous varieties (Ginesta and Palau) (
Figure 2), presented more than 50% of red-blush in the skin and the highest amounts of total polyphenol content. The variety ‘Mitger’ contributes as well to the total polyphenol content of hybrids. Results indicated that hybrids from these three varieties (Ginesta, Palau and Mitger) crossed with ‘Goldrich’ produced genotypes with interesting polyphenol content.
The main secondary phenolic compounds: rutin, quercetin, chlorogenic, and neochlorogenic acid were analyzed and a similar trend was obtained. ‘Dama Rosa’ showed the highest concentrations for all the studied compounds. ‘Goldrich’ hybrids ‘Dama Rosa’, ‘Dama Taronja’, and ‘GP9817’ showed higher content of neochlorogenic acid and rutin compared to the other accessions (
Figure 3). Differences among cultivars were found in both years (
Table S1).
2.2. Putative Orthologous and Phylogenetic Analysis
BLAST analysis using
P. persica and
A. thaliana DFR, FLS, and PAL identified a total of five genes in P. armeniaca:
ParDFR (PARG07267),
ParFLS1 (PARG08425),
ParFLS2 (PARG08426),
ParPAL1 (PARG18722),
ParPAL2 (PARG02214).
Table S2 shows high (>95%) conservation between peach and apricot for all genes. PAL genes were located in different linkage groups in both species, and as a consequence, in different synteny blocks.
PpePAL1 was located in LG2, meanwhile apricot was located in LG5. However,
PpePAL2, located in LG6, matched in LG1 in apricot.
PpeDFR,
PpeFLS1, and
PpeFLS2 were located in LG1 in peach, but they match with LG2 in
Prunus armeniaca. All the predicted locations matched with the synteny between these regions in apricot and peach. In addition,
Arabidopsis thaliana and
Prunus armeniaca also had a high identity (>80%) for PAL, more than 70% for
ParDFR and 60% for
ParFLS1 and 45.65% for
ParFLS2 (
Table S3). In addition, protein alignment revealed a high conservation among
Prunus and
Arabidopsis thaliana (
Tables S4 and S5).
ParPAL1 and
ParPAL2 showed around 80% of similarity with
AtPAL1 and
AtPAL2, respectively. Regarding DFR, similarity was around 70% mean. FLS showed the lowest similarity with 57% and 43% for FLS1 and FLS2. A similar trend was observed for
Prunus persica and
Arabidopsis thaliana.
ParPAL1 and the putative
PAL1 orthologous from
Prunus persica and
Malus domestica were clustered together.
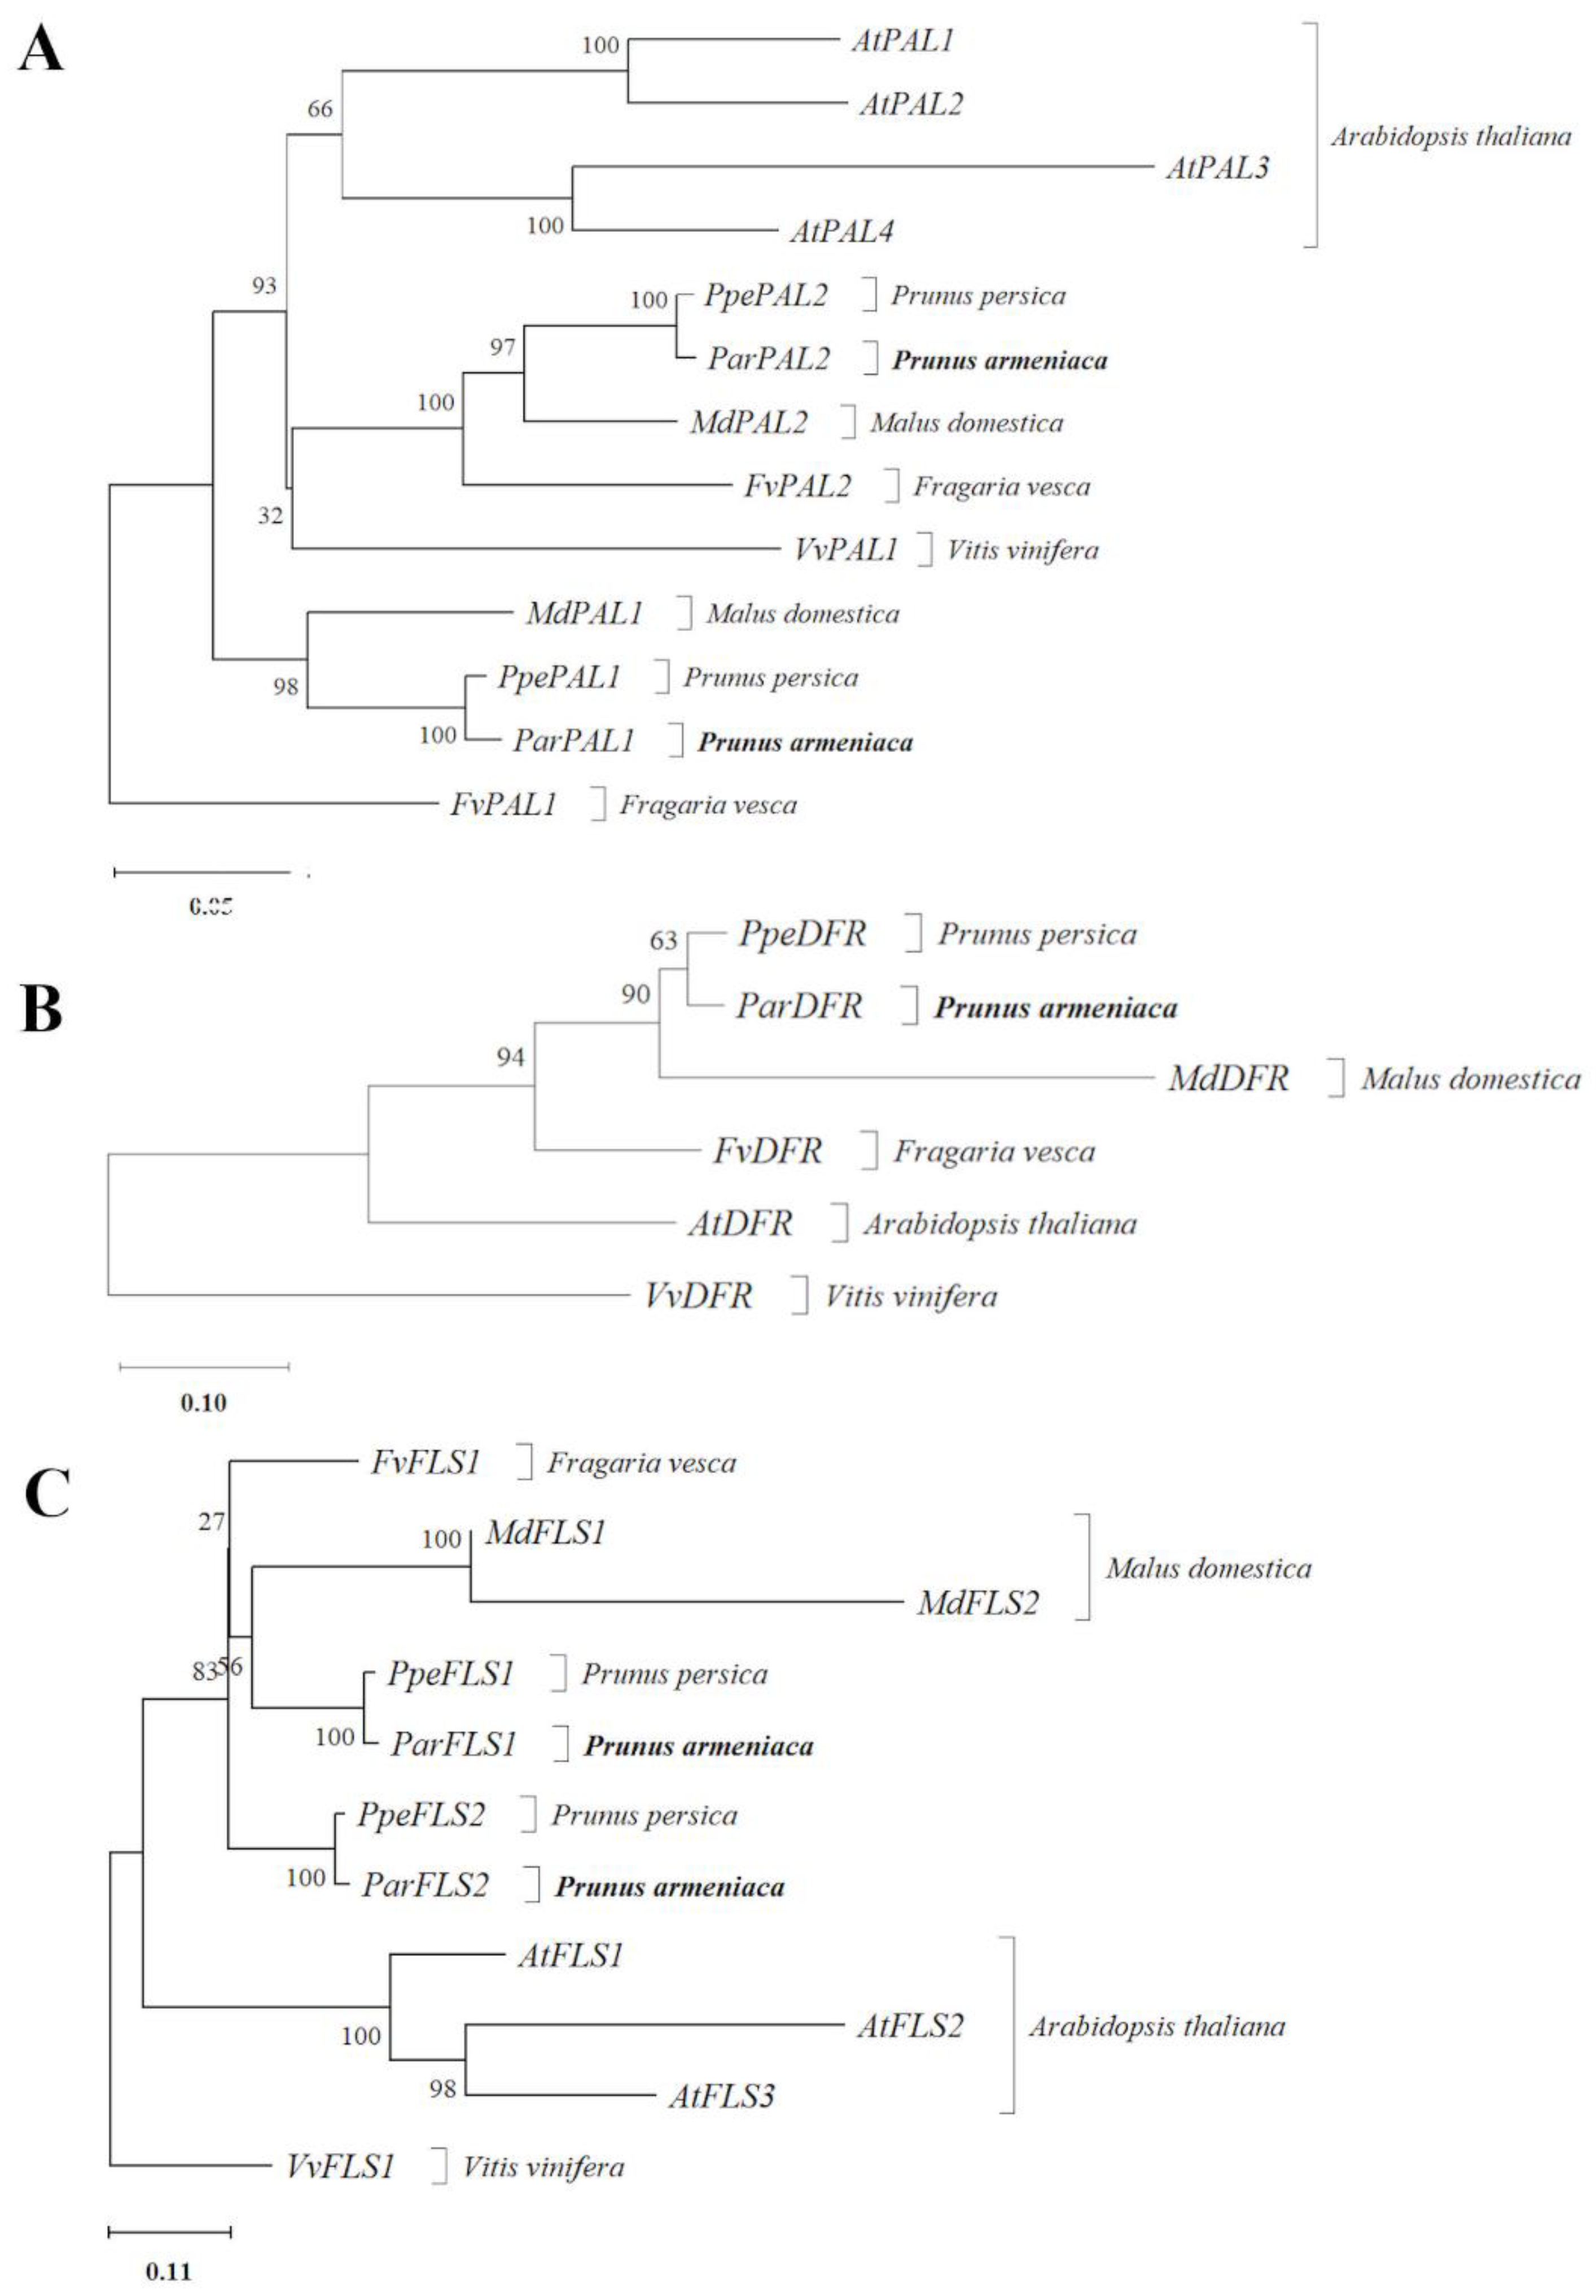
ParPAL2 and its putative orthologous were grouped in a different cluster which showed the differences among both paralogs. The phylogenetic tree of phenylalanine ammonia-lyase proteins (
Figure 4A), showed that all
Arabidopsis thaliana proteins clustered together.
The phylogenetic tree revealed that DFR proteins of
Prunus persica and
Prunus armeniaca clustered together, being closed to its orthologous from
Malus domestica (
Figure 4B).
The predicted proteins encoded by FLS genes of
Arabidopsis thaliana grouped in a cluster. On the other hand,
Prunus persica predicted proteins from
PpeFLS2 and
ParFLS2 were grouped in the same cluster, as were
Prunus armeniaca PpeFLS1 and
ParFLS1. However,
Fragaria vesca predicted sequences encoded by
FvFLS clustered in another tree branch with the
Malus domestica proteins group (
Figure 4C).
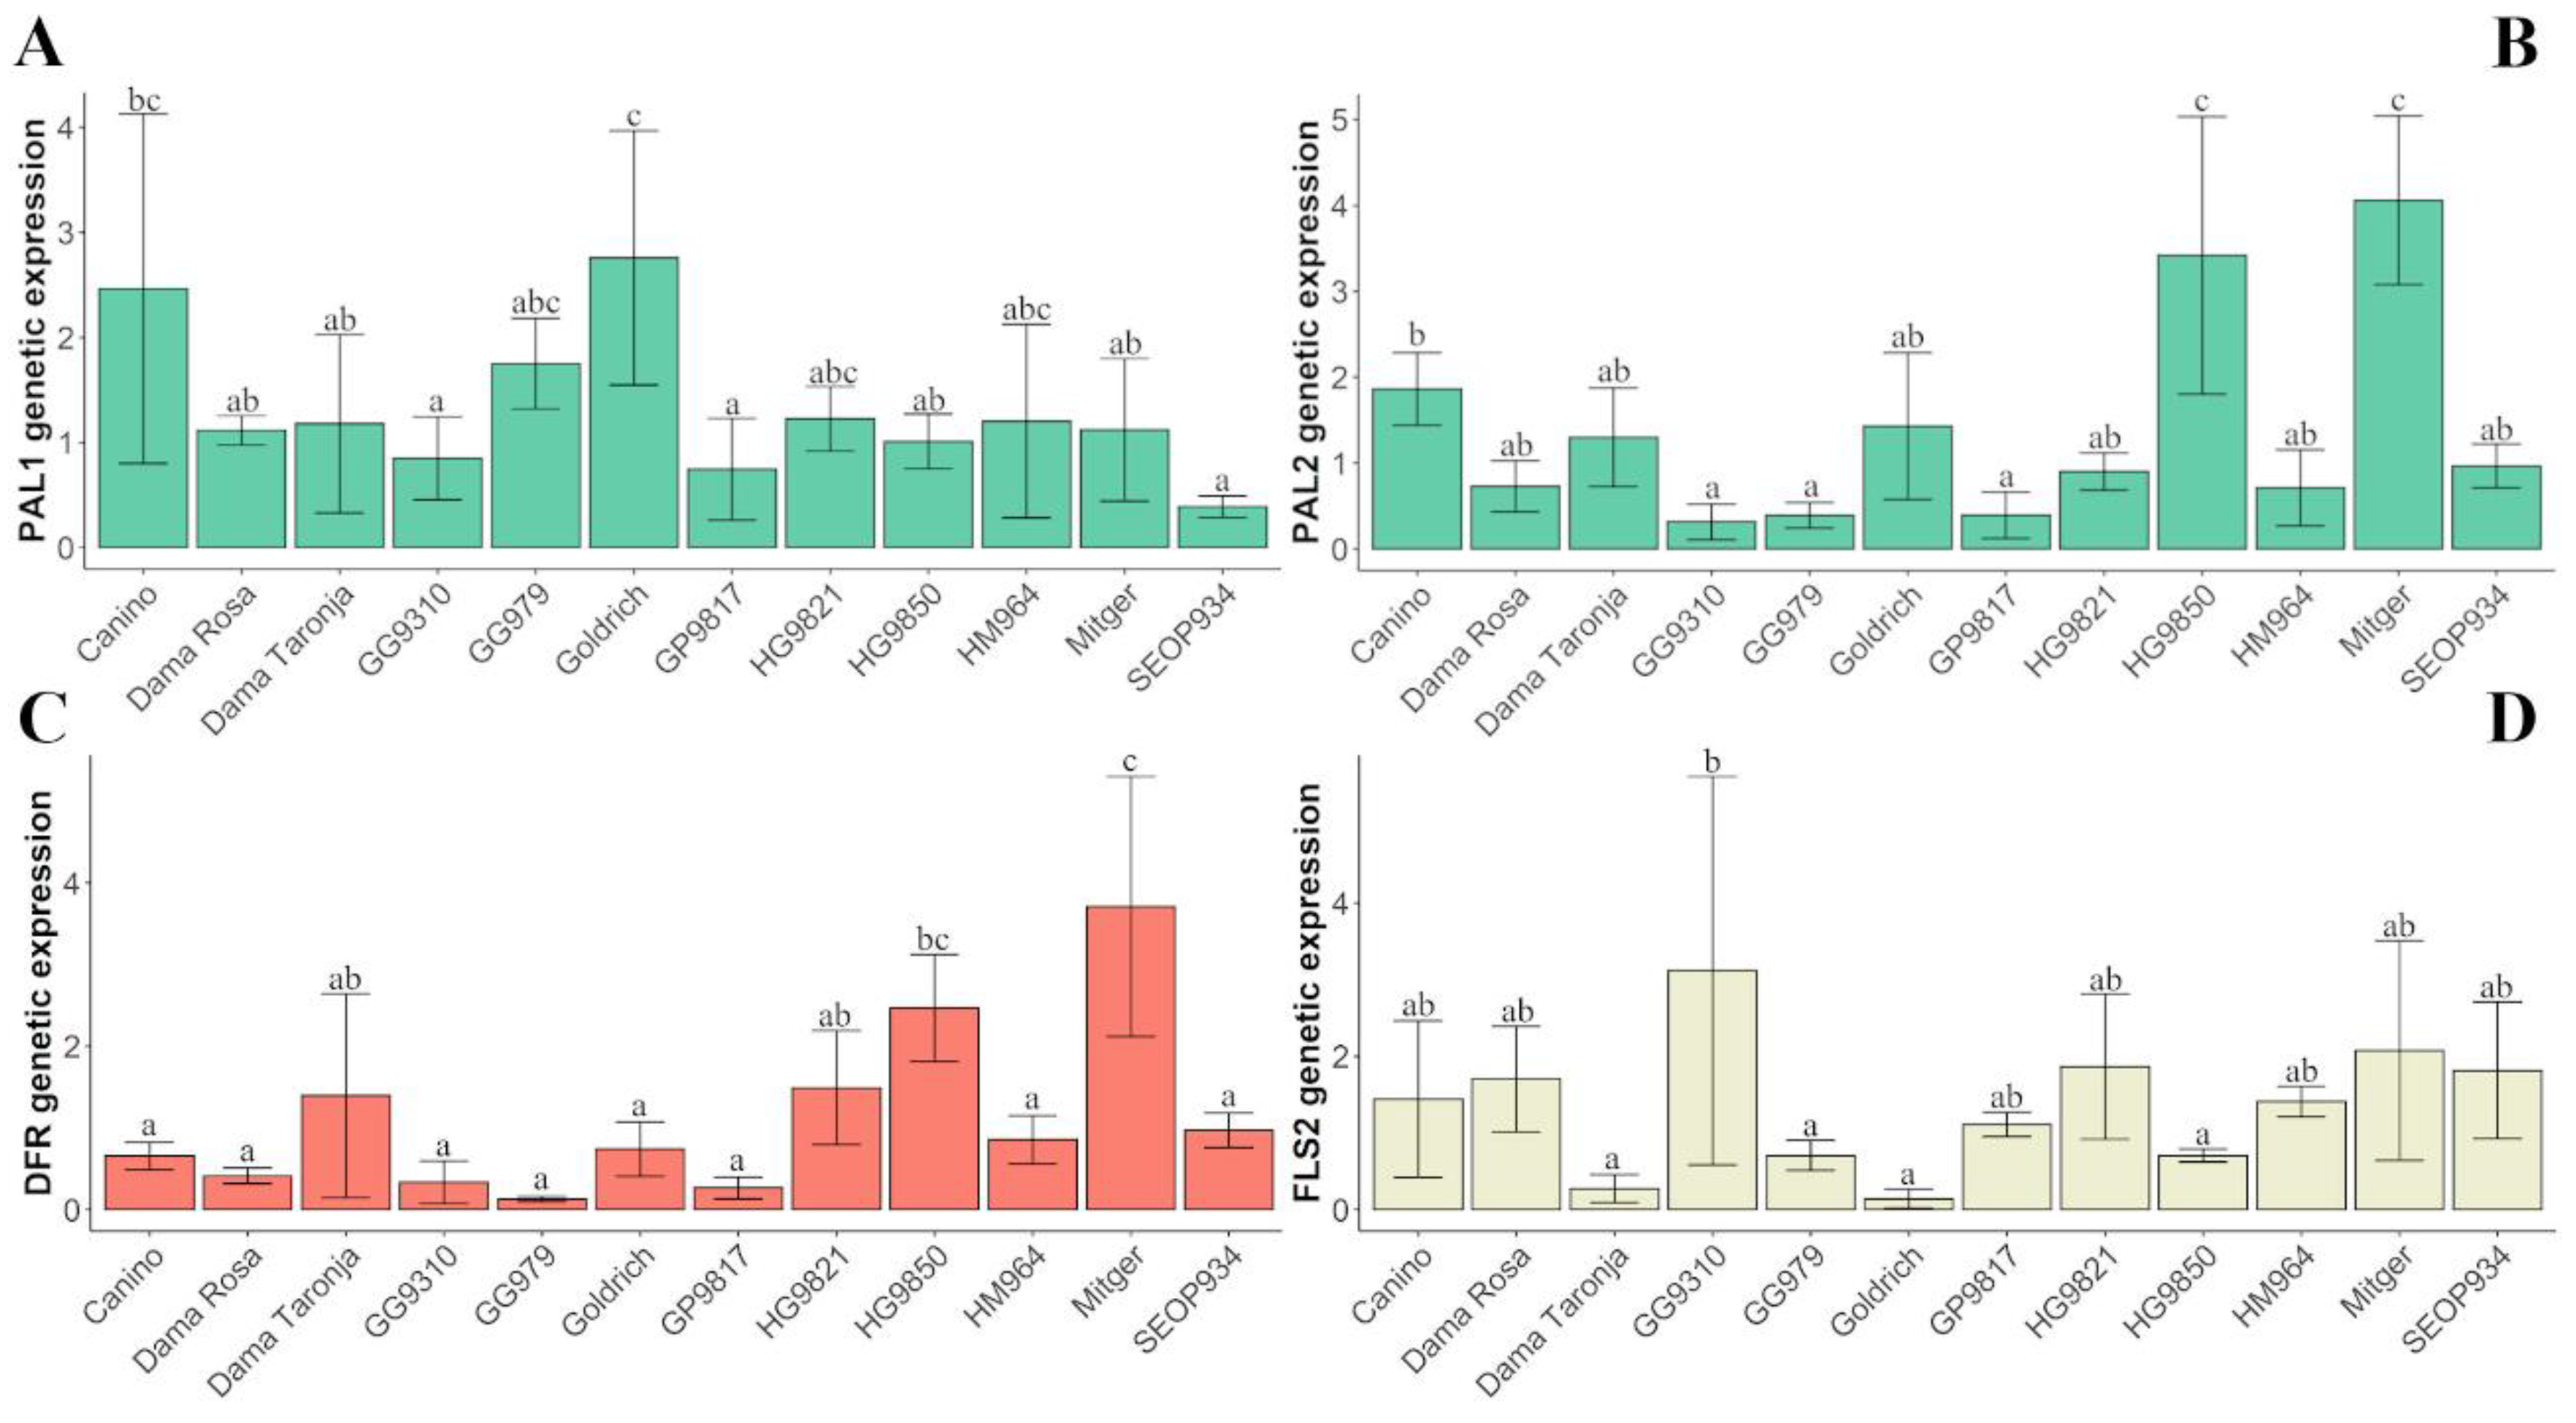
2.3. Gene Expression
Genetic expression of the genes studied (
ParPAL1,
ParPAL2, ParDFR,
ParFLS1,
ParFLS2) did not show a year effect but a genotype effect (Kruskal-Wallis test). Subsequently, we found minor differences in gene expression among genotypes (
Figure 5,
Table S6).
Genetic expression of
ParPAL1, ParPAL2, ParDFR, and
ParFLS2 showed significant differences among genotypes (
Figure 5). Concerning the expression of flavonol-synthase encoding gene
ParFLS1, no significant differences among genotypes were observed.
Regarding the expression of phenylalanine ammonia-lyase (ParPAL1 and ParPAL2), only the variety ‘Goldrich’ showed significant differences on PAL1 and two genotypes showed significant differences on PAL2 (‘Mitger’ and HG9850).
2.4. Contribution of ‘Goldrich’ to Phenolic Compounds Content and Genetic Expression
In this study, ‘Goldrich’ used as donor of resistance to PPV in most apricot breeding programs worldwide and the main contributor to the hybrids included in this study, was evaluated as contributor of compounds for fruit quality (
Table 2).
The variety ‘Goldrich’ showed a significant genetic effect on total polyphenol content. A coefficient of 382.28 mg 100 g−1 DW, which represents more than 45% of the general average of the population. A similar genetic effect was observed for the specific phenolic compounds, except quercetin-3-glucuronide, in which the genetic effect of ‘Goldrich’ was not significant. The genetic effect of ‘Goldrich’ for neochlorogenic and chlorogenic acids were 127.94 and 135.22 mg 100g−1, representing 56% and 57% of the general average, respectively. For rutin, the coefficient was 110.7 mg 100g−1 (37.3% of the general average).
Concerning genetic expression, the cultivar ‘Goldrich’ had a genetic effect on the expression of all the genes studied. This effect was significant for the five genes studied
ParPAL1,
ParPAL2 ParDFR,
ParFLS1,
ParFLS2, (
Table 3). The genetic effect of ‘Goldrich’ varies from 58.2% in
ParFLS2 to 98.7% in
ParDFR.
2.5. Relationships between Gene Expression and Phenolic Compound Accumulation
A correlation analysis performed among compounds and expression of genes studied revealed a significant correlation between neochlorogenic acid and the rest of the phenolic compounds. (
Table 4).
ParDFR expression revealed a positive correlation with ParAL2 (0.8) but also showed positive correlation with ParFLS1, which also correlated positively with ParPAL2. The gene expression obtained indicates interaction among the genes selected in key steps of the polyphenol pathway.
To complete the previous study, we studied the relationships between the gene expression and each phenolic compound content through a linear regression model (
Tables S7 and S8). Ratios such as
PAL/
FLS,
PAL/
DFR or
FLS/
DFR were analyzed in order to study the differences in gene expression balance and its possible relationship with a preferential biosynthesis of anthocyanins, flavonols or caffeate-derivates. The trend between the phenolic compounds content and the expression of genes obtained is summarized in
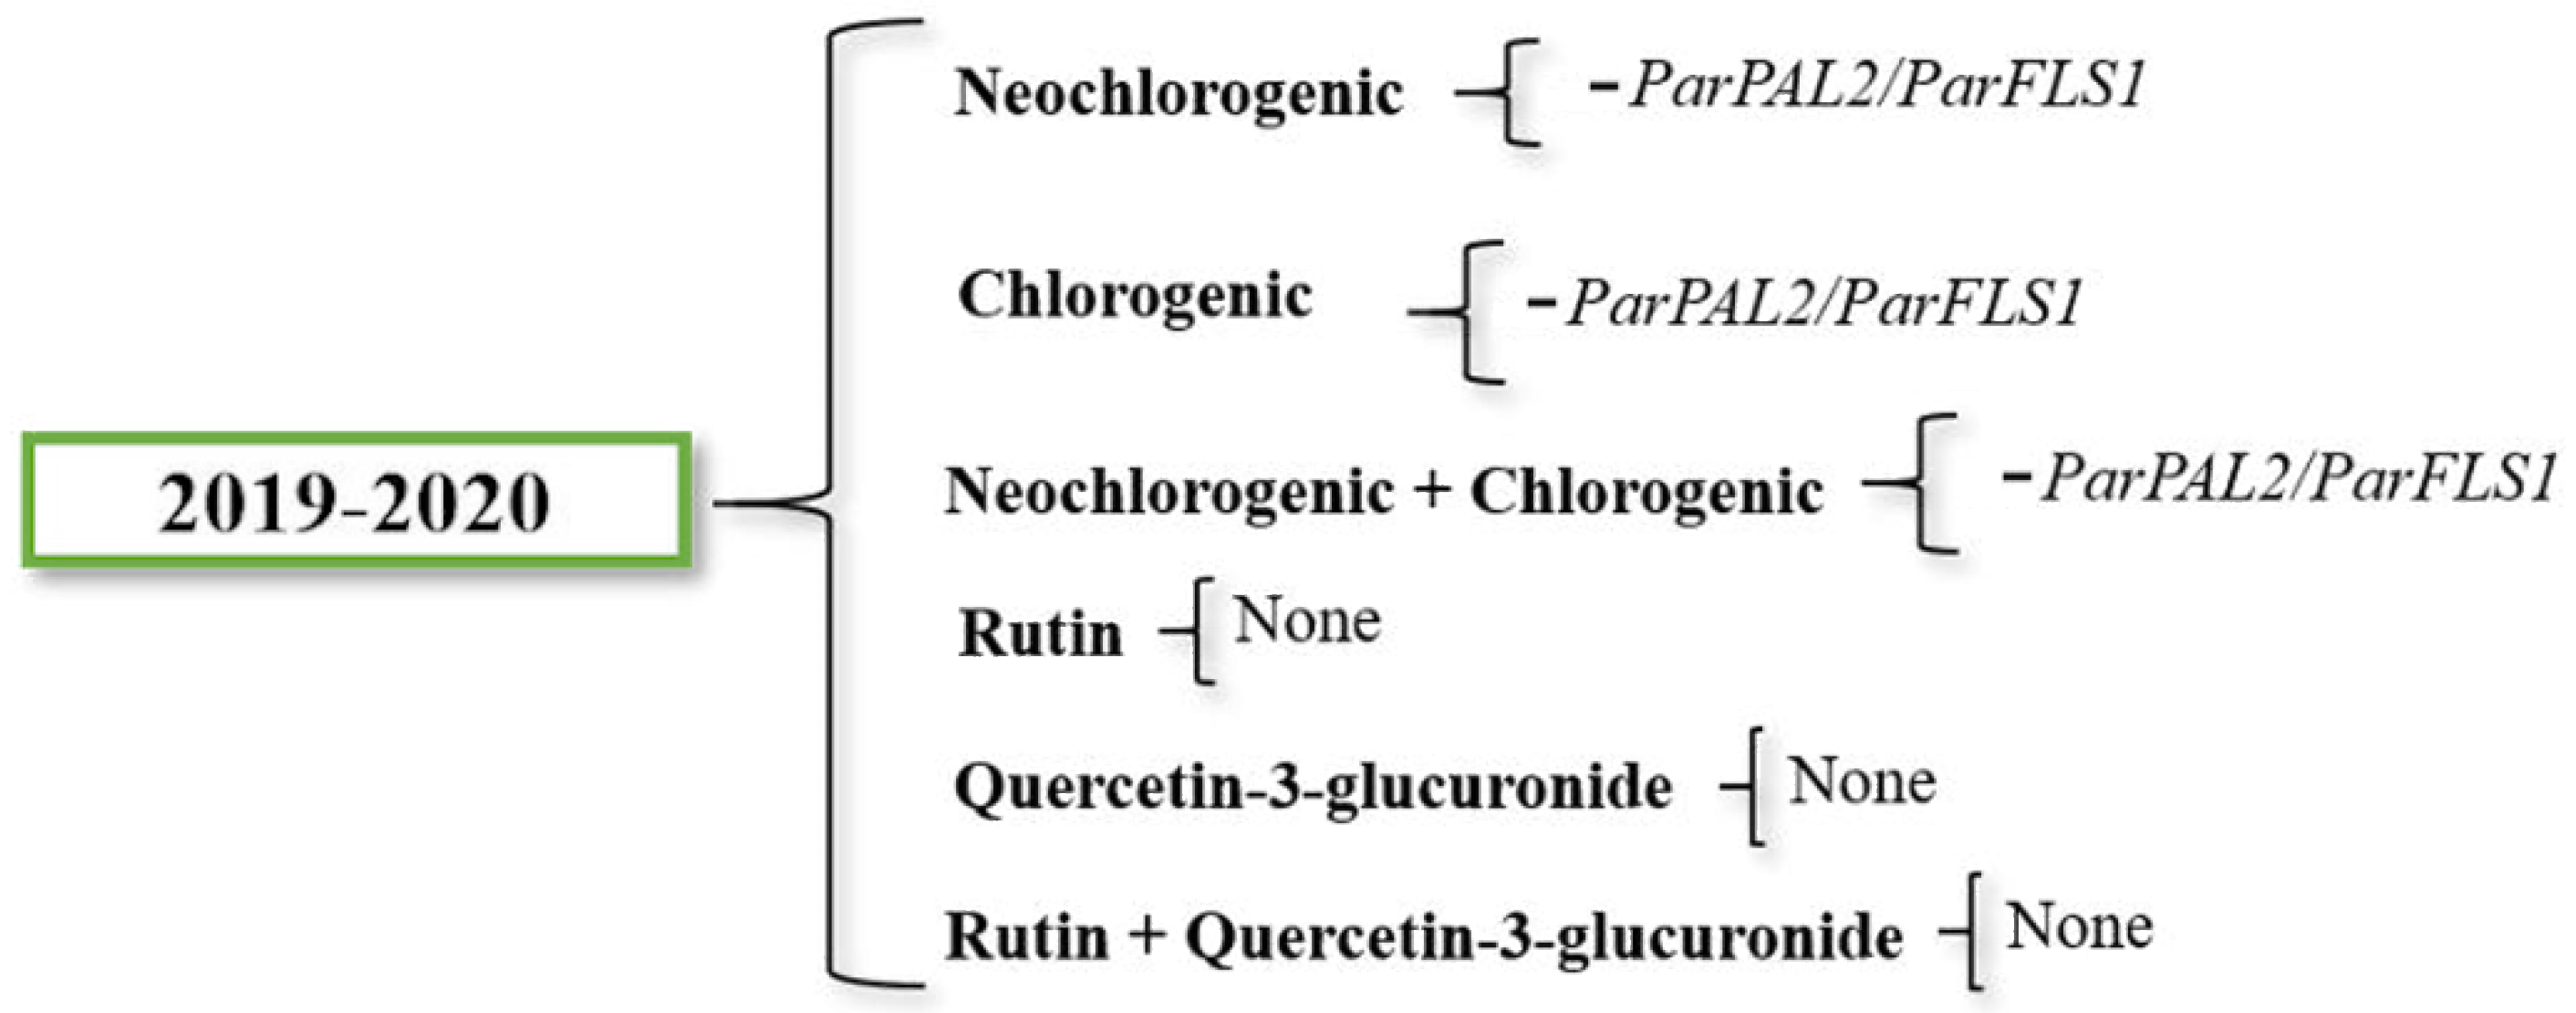
Figure 6.
Both neochlorogenic and chlorogenic acid content were negatively influenced by ParPAL2/ParFLS2 ratio. Due to neochlorogenic and chlorogenic acids being synthetized in the same pathway branch, the correlation between their content and the gene expression was also evaluated together. Data from the two-years average revealed a negative impact of ParPAL2/ParFLS1 in the neochlorogenic and chlorogenic total content. Concerning rutin and quercetin-3-glucuronide content, no significant correlation was found. The gene expression effect on the levels of accumulation of all the compounds was low.
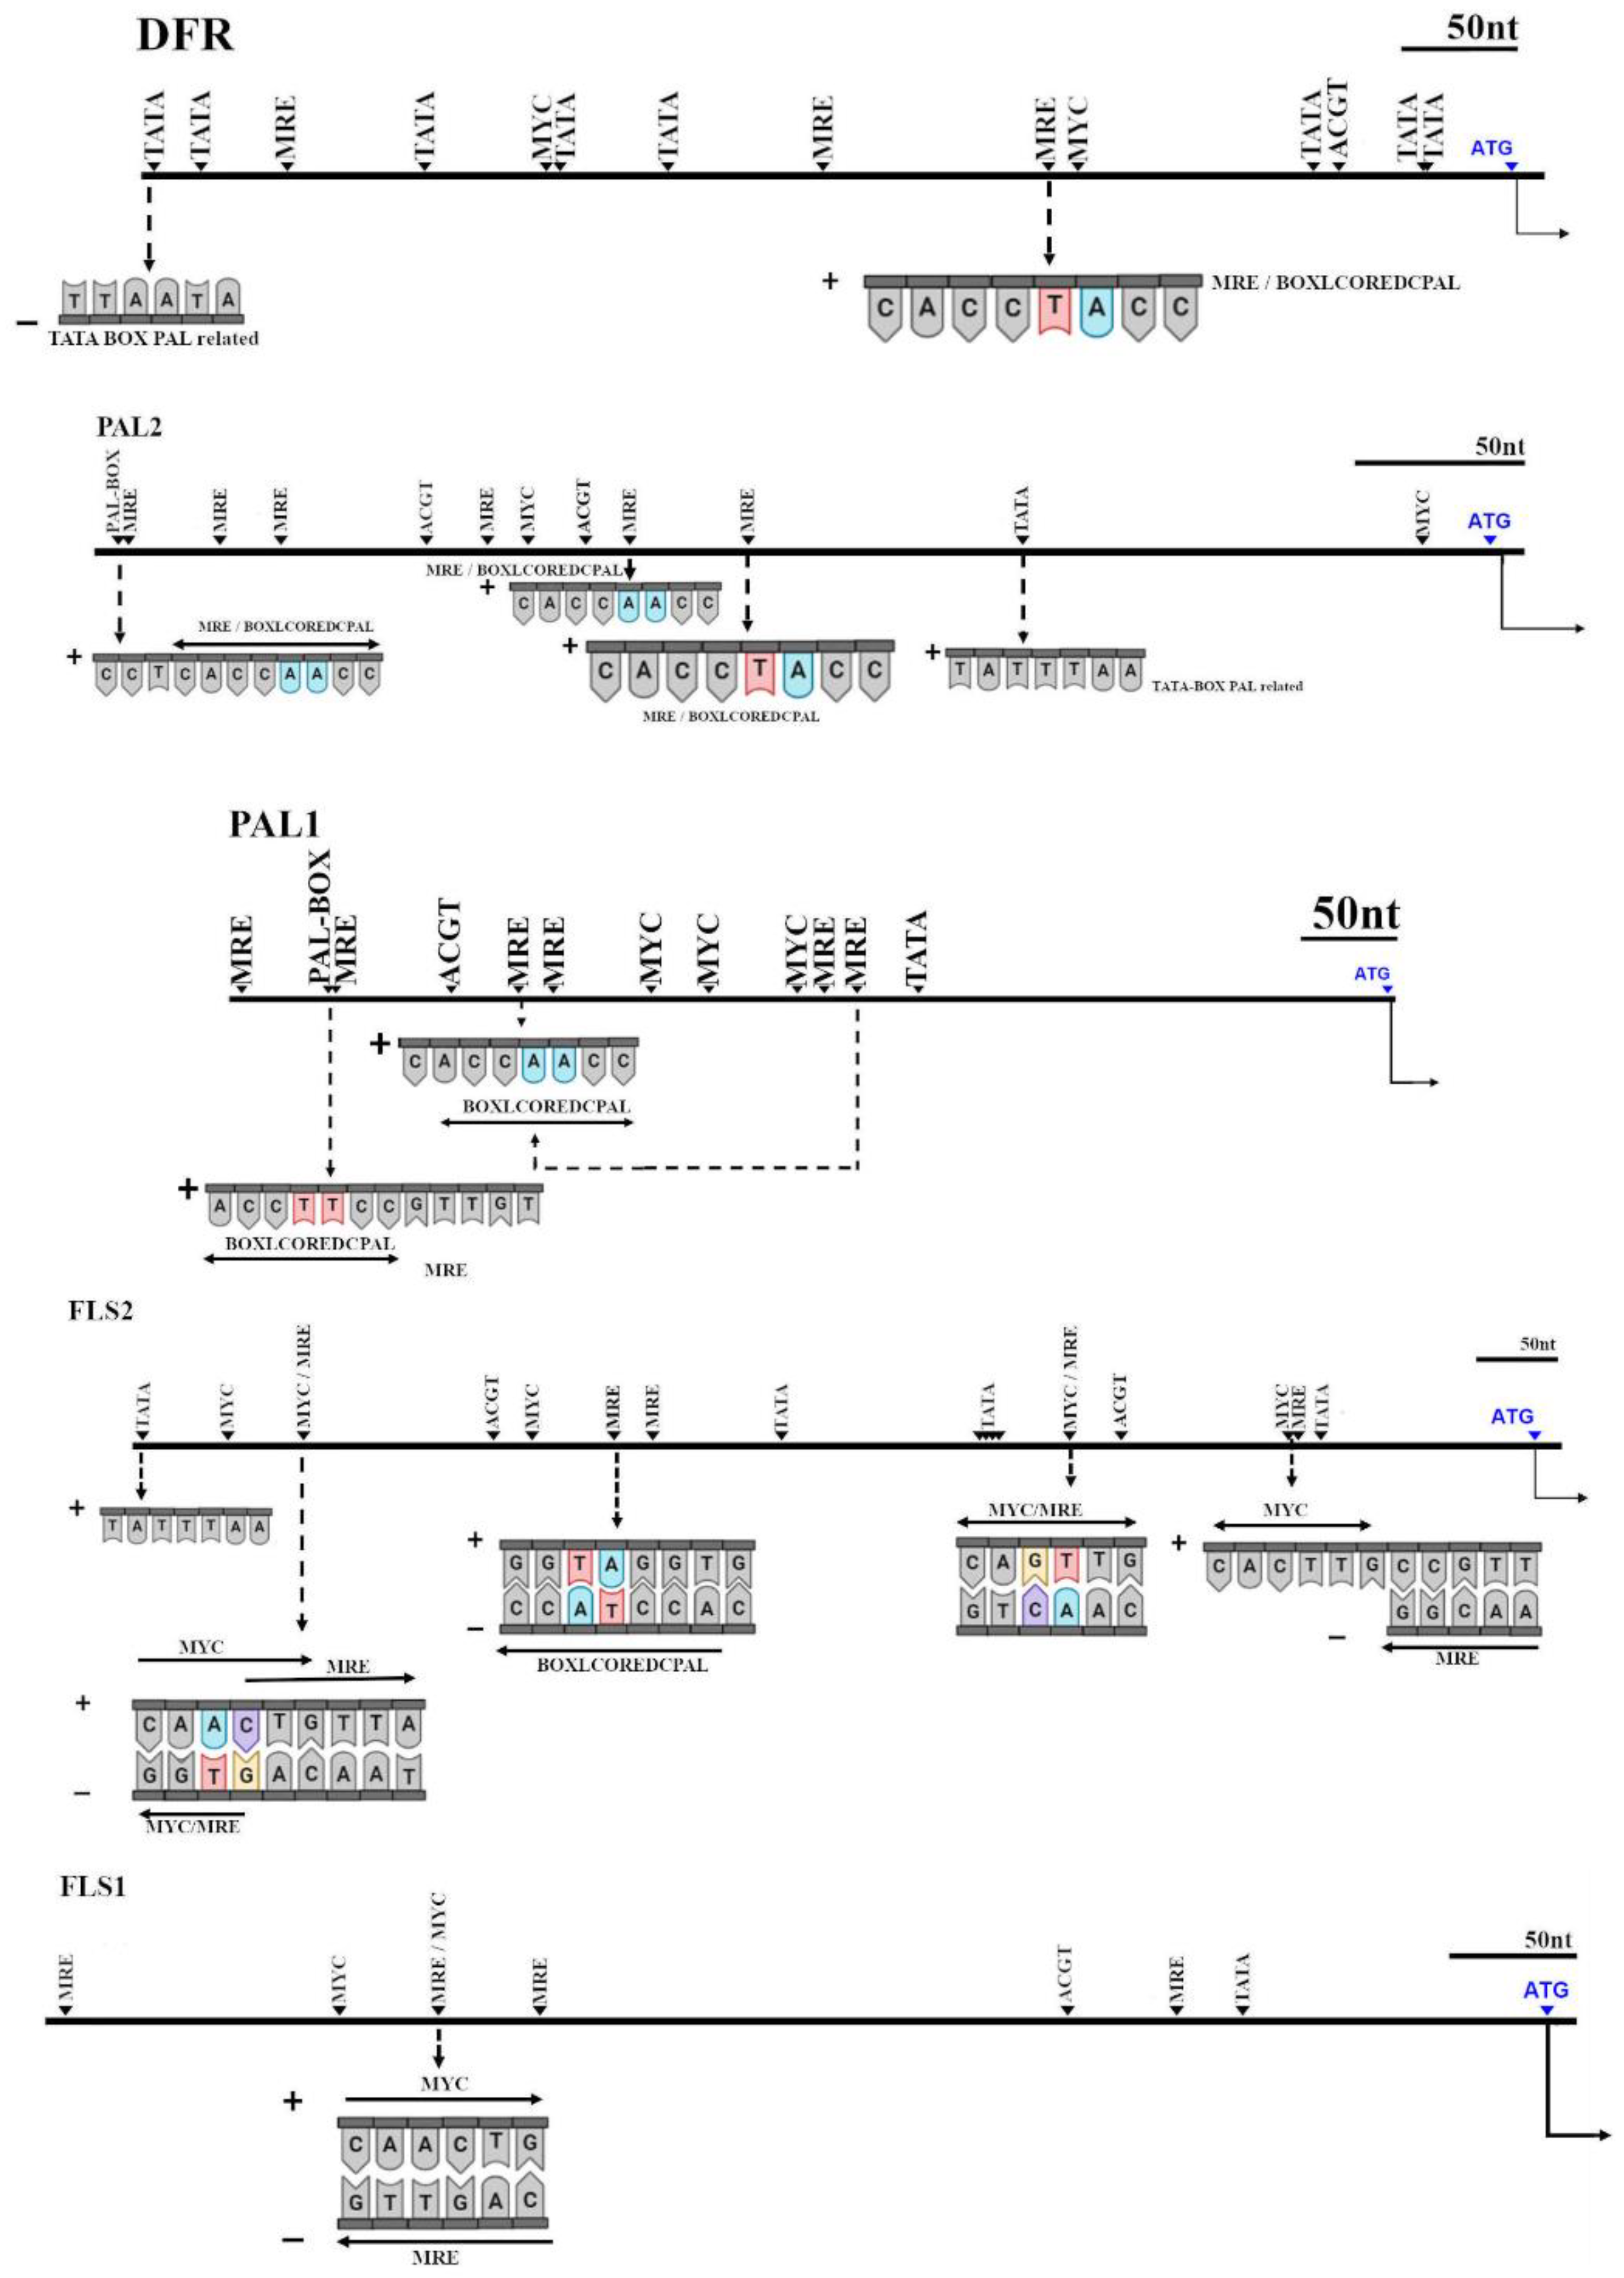
2.6. Cis-Acting Elements Analysis
Due to the correlation among expression of some genes, a study of upstream sequences to find cis-acting elements recognized by
MYB-like transcription factors was carried out (
Figure 7).
In ParDFR, we found at 694 bp upstream from ATG, a TATA-BOX-PAL related, next to other TATA-box-like motif and MRE (a MYB-recognition element). In addition, a MYC motif was found together with a TATA-box-like. Furthermore, at 238 bp upstream from ATG, a MRE was found encoding also a BOXLCOREDCPAL, a motif related with the PAL promoter region. This MRE was closed to a MYC motif.
In ParPAL2, 403 bp and 255 bp upstream from ATG we found an MRE encoding a BOXLCOREDCPAL with a different sequence from the one found in ParDFR. However, 220 bp upstream from ATG we found the same MRE encoding a BOXLCOREDCPAL as found in DFR. In addition, a TATA-BOX-PAL related was found 139 bp upstream.
However, in ParPAL1 we did not find the same MRE encoding the BOXLCOREDCPAL, found in ParDRF and PAL2 upstream. Indeed, we found 551 bp upstream from ATG, also the same MRE motif but differing only in a nucleotide. On the other hand, in 276 bp upstream we found an MRE encoding a PAL-box-like motif, identical as found twice in PAL2.
In ParFLS1, we found four MRE, but none of them encoded a PAL-box-like motif. However, 438 bp upstream from ATG, we found a MYC motif, but also an MRE antisense.
In ParFLS2, we found 572 bp upstream the same MRE encoding a BOXLCOREDCPAL, as found in ParDFR and ParPAL2. Furthermore, 765 bp upstream we found the same MYC/MRE motif found in ParFLS1. Moreover, the same cis-acting element was found antisense 289 bp upstream from ATG, but antisense.
4. Materials and Methods
4.1. Plant Material
A set of 2 Mediterranean cultivars (‘Canino’ and ‘Mitger’) a North American variety (‘Goldrich’) and 9 hybrids from the IVIA’s apricot breeding program were analyzed (
Table 5). ‘Goldrich’ used as the main donor of resistance to PPV at the breeding program is one of the parents in most of the resistant hybrids obtained. ‘Canino’ and ‘Mitger’ are two autochthonous varieties used for introgression of adaptability to Mediterranean conditions. The trees are maintained at the IVIA’s apricot collection located in Moncada (latitude 37°45′31.5″ N, longitude 1°01′35.1″ W), Spain.
Five fruits per tree were harvested at the ripening stage during two growing seasons (2019 and 2020). For each fruit, the peel was separated from the flesh with a peeler. The samples consisted of a mix of the peel from 5 fruits per genotype and year. Samples were frozen with liquid nitrogen and kept at −80 °C until processing.
4.2. HPLC Analysis
For HPLC analysis, the tissue was processed to lyophilized powder. Tissue homogenization was carried out using a vortex. Phenolic compounds were extracted and determined according to the procedure described by [
43,
44]. Briefly, 10 mg of freeze-dried peel were mixed with 1 mL of DMSO/MeOH (1:1,
v/
v). Then, the sample was centrifuged (Eppendorf 5810R centrifuge; Eppendorf Iberica, Madrid, Spain) at 4 °C for 20 min at 10,000 rpm. The supernatant was filtered through a 0.45 μm nylon filter and analyzed by HPLC-DAD and HPLC-MS in a reverse-phase column C18 Tracer Excel 5 μm 120 OSDB (250 mm × 4.6 mm) (Teknokroma, Barcelona, Spain). An Alliance liquid chromatographic system (Waters, Barcelona, Spain) equipped with a 2695 separation module, was coupled to a 2996 photodiode array detector and a ZQ2000 mass detector. A gradient mobile phase consisting of acetonitrile (solvent A) and 0.6% acetic acid (solvent B) was used at a flow rate of 1 mL/min, with an injection volume of 10 μL. The gradient change was as follows: 10% 2 min, 10–75% 28 min, 75–10% 1 min, and hold at 10% 5 min. An HPLC-MS analysis was performed and worked under electrospray ion positive (flavonoids) and negative (phenolic acids) conditions. Capillary voltage was 3.50 kV, cone voltage was 20 V, source temperature was 100 °C, desolvation temperature was 225 °C, cone gas flow was 70 L/h.
Chromatograms were recorded at 340 nm absorbance. Chlorogenic acid and rutin were identified by comparison with pure standards obtained from Sigma-Aldrich (Sigma Co., Barcelona, Spain) using an external calibration curve. In addition, standards were run daily with samples for validation. Neochlorogenic acid and quercetin-3-glucuronide were tentatively identified based on their retention times, UV-vis spectra and mass spectrum characteristics and mass spectrum data with available data described in the literature. For the quantitative analysis, an external calibration curve with available standards chlorogenic acid and rutin was carried out. In addition, standards were run daily with samples for validation. All the solvents used were of LC-MS grade. Three samples per cultivar were analyzed and all the samples were run in triplicate. The Empower 2 software (Waters, Spain) was used for data processing. Standard measurements (
Figure S1) and a sample of the chromatograms in apricot peel sample (
Figure S2) are included.
4.3. Obtention of Gene Sequences and Cis-Acting Elements Motif Identification
To identify the genetic regulation in the phenolics biosynthesis pathway, a set of genes encoding for dihydroflavonol-4-reductase (DFR), flavonol synthase (FLS) and phenylalanine ammonia-lyase (PAL) were selected. To obtain putative orthologs of apricot species, a BLAST search was performed using
A. thaliana and
P. persica described genes in GDR (Genome Database of Rosaceae) [
45] on
Prunus armeniaca genome.
Identification of cis-acting elements was made from a total sequence of 1500 bp upstream of the start codons from the
Prunus armeniaca genome published at Genomic Database of Rosaceae (GDR). Analysis of cis-acting elements was made using PLACE (Plant cis-acting Elements) database [
46] and searching for described motifs related to the phenolic pathway.
In addition, to check the sequence conservation among species, a phylogenetic analysis was made with the obtained
Prunus armeniaca genes predicted proteins and
Prunus persica (
PpeDFR (Prupe.1G376400.1),
PpeFLS1 (Prupe.1G502700.1),
PpeFLS2 (Prupe.1G502800.1),
PpePAL1 (ppa002328m)
, PpePAL2 (ppa002099m)),
Fragaria vesca (
FvDFR (mrna15174.1-v1.0-hybrid)
, FvFLS1 (mrna11126.1-v1.0-hybrid),
FvPAL1 (mrna23261.1-v1.0-hybrid),
FvPAL2 (mrna09753.1-v1.0-hybrid)),
Vitis vinifera (
VvDFR (GSVIVT01009742001)
, VvFLS1(
GSVIVT01008913001),
VvPAL1 (GSVIVT01016257001)),
Malus domestica (
MdDFR (MDP0000734274),
MdFLS1 (MDP0000311541),
MdFLS2 (MDP0000294667),
MdPAL1 (MDP0000668828),
MdPAL2 (MDP0000261492)) and
Arabidopsis thaliana (
AtDFR (NM_123645.4),
AtFLS1 (U84259.1),
AtFLS2 (BT003134.1)
, AtFLS3 (NM_125754.3),
AtPAL1 (AY303128.1),
AtPAL2 (AY303129.1),
AtPAL3 (NM_001203294.1),
AtPAL4 (AY303130.1)) predicted proteins. For apricot, coding sequences (
ParDFR (PARG07267m);
ParPAL1 (PARG18722m),
ParPAL2 (PARG02214m),
ParFLS1 (PARG08425m),
ParFLS2 (PARG08426m), were translated into proteins with a DNA translate tool from
Expasy [
47]. Multiple protein sequence alignment was performed with the
ClustalW program with
MEGA X v.10.1.8 software [
48], and a phylogenetic tree was built with the Neighbor-Joining method using
MEGA X v.10.1.8 software with a bootstrap value of 1000 replicates.
The number of amino acid differences per site from between sequences (
p-distance) was calculated with MEGA X Software with bootstrap method with 1000 replications. 1-
p-distance was calculated to similarity estimation among proteins. In addition, a BLAST and a synteny of
Prunus persica against and
Prunus armeniaca reference genome was performed in the GDR database. Moreover, a BLAST of
Arabidopsis thaliana against
Prunus armeniaca genome was also performed in GDR database [
45].
4.4. Gene Expression
Samples consisted of 80 mg of powered tissue. RNA isolation was made using Plant/Fungi Total RNA Purification Kit (NORGEN, Thorold, ON, Canada) with some modifications. Frozen power tissue was diluted in 600 mL of lysis buffer C, a 2% PVP-40 and 2% β-mercaptoethanol was added. Purified RNA quality and integrity were checked by agarose gel electrophoresis, RNA was quantified by Qubit (Invitrogen, Carlsbad, CA, USA).
cDNA synthesis was obtained from 500 ng of RNA diluted in 10 μL reaction using the PrimeScript RT Reagent kit (‘Perfect Real Time’) (Takara Bio, Otsu, Japan).
Amplification was carried out with StepOnePLus Real-Time PCR System (Life Technologies, Carlsbad, CA, USA) software and TB Green Premix Ex Taq (Tli RNaseH Plus) (Takara Bio, Otsu, Japan) kit was used. Mix reaction contained 7.5 μL enzyme, 0.09 μL of primers (100 μM), 0.3 mL ROX, 5.02 μL H20, and 1 μL of cDNA. Mix was incubated at 95 °C for 30 s, followed by 40 cycles of 5 s at 95 °C and 30 s at 60 °C. Finally, the mix was incubated for 15 s at 95 °C, followed by a minute at 60 °C and 15 s at 95 °C. Apricot
ACTIN and
SAND geometric mean expression was used as housekeeping gene for normalization. Primers used are indicated in
Table 6. For each year and genotype, the calculated expression was the mean of three biological replicates. Relative expression of each gene was calculated using the relative standard curve method.
4.5. Data Analysis
Data were statistically analyzed by Statgraphics Centurion VII version 17.2.00 software (Statpoint Technologies Inc., Warrenton, VA, USA). Differences among samples and years were analyzed with the Kruskal-Wallis test (p ≤ 0.05) and averages were compared using the Multiple Range Test with Bonferroni method.
For testing the contribution of ‘Goldrich’ to the phenolic content and genetic expression in the set of accessions, we performed a regression of the data to a general linear model [
8]. In the model, the phenotype is linearly explained as follows:
where C is the general average of the population (constant), G
Goldrich is the genetic effect of ‘Goldrich’, Year is the environmental effect due to the year and Residual is the residual effect. The model was calculated using the
Statgraphics Centurion VII version 17.2.00 software (Statpoint Technologies, Warrenton, VA, USA). A quantitative variable for evaluating the genetic effect of ‘Goldrich’ was included with a value of 1 for ‘Goldrich’, 0.5 value for ‘Goldrich × X’ hybrids, and a null value for the other genotypes non-related to ‘Goldrich’. Model parameters were estimated with a 95% confidence level (
p ≤ 0.05).
Elucidation of parameters significantly influent in phenolic content was made by a linear regression model with Statgraphics Centurion VII version 17.2.00 software (Statpoint Technologies, Warrenton, VA, USA). Parameters included in the linear regression were: genetic expression in apricot of ParDFR, ParFLS1, ParFLS2, ParPAL1, and ParPAL2, and the following genetic expression ratios: ParPAL1/ParPAL2, ParPAL1/ParFLS1, ParPAL1/ParFLS2, ParPAL2/ParFLS1, ParPAL2/ParFLS2, and ParFLS1/ParFLS2. Non-significant parameters were excluded from each model and only those significant were maintained.
In addition, a multivariate analysis was performed with Statgraphics XVII software (Statpoint Technologies, Warrenton, VA, USA) to study Pearson correlation among gene expression, phenolic contents, and the relationships among all of them. Correlation with a p < 0.05 was considered significant.
Graphics were made using R-studio software (Version 1.1.463, 2009–2018, Rstudio, Inc., Boston, MA, USA) with ‘stats’, grDevices’, and ‘graphics’ (R Core Team), ‘dplyr’ [
49], ‘readxl’ [
50], ‘plyr’ [
51], ‘scales’ [
52] and ‘ggplot2’ [
53] packages.


 ,
, 


