
Single-Cell Atlas of the Drosophila Leg Disc Identifies a Long Non-Coding RNA in Late Development

 , , , , and
Abstract
:1. Introduction
2. Results
2.1. Generation of a Transcriptomic Cell Atlas of the Developing Leg Imaginal Disc
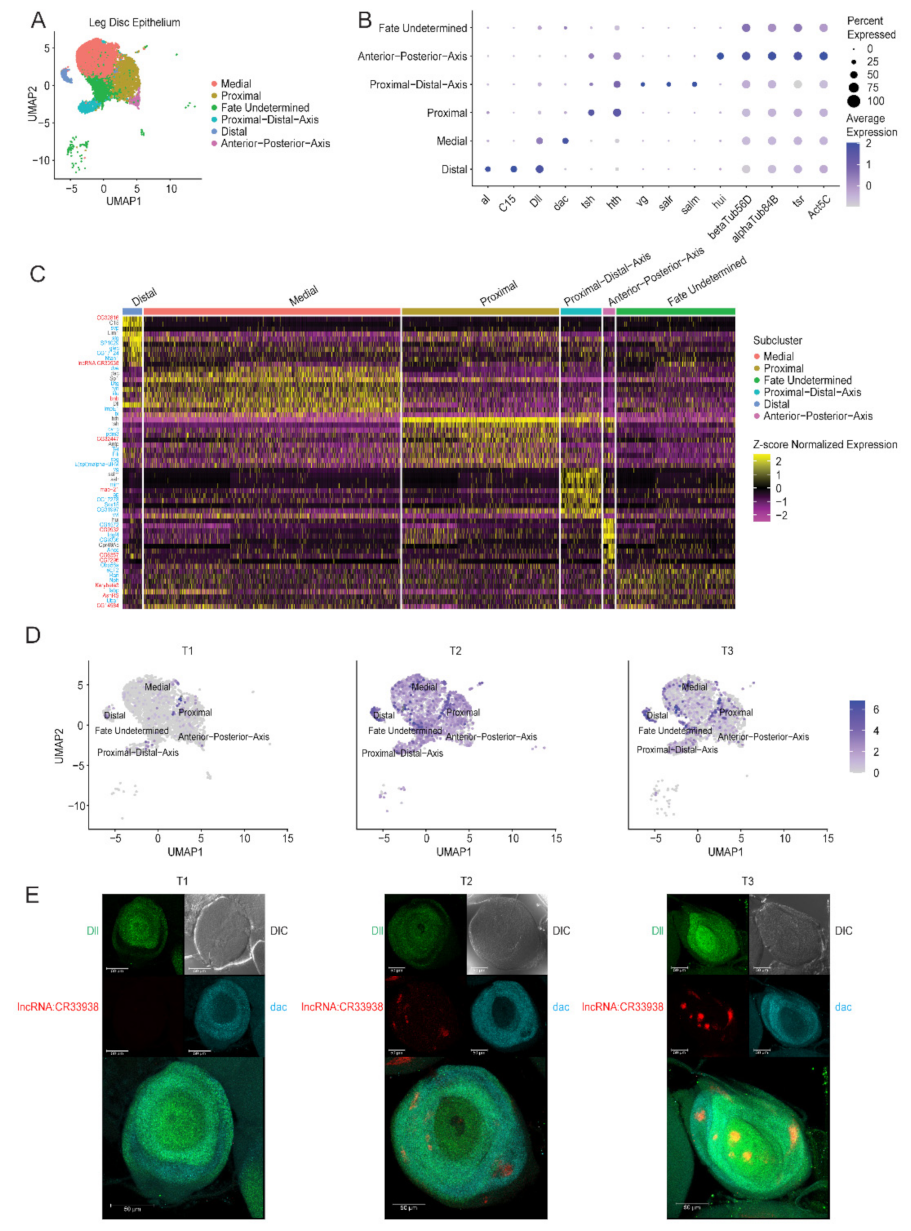
2.1.1. Single-Cell RNA-Sequencing Identifies Four Main Cell Types in L3 Discs
2.1.2. Subclustering of the Main Cell Types Reveals Cell Subtypes
2.2. Identification and Characterization of a Novel Long Non-Coding RNA
2.2.1. Identification of a Long Non-Coding RNA of Unknown Function in Distal Cells
2.2.2. Experimental Validation of lncRNA:CR33938 Expression in L3 Discs
2.2.3. Conservation of lncRNA:CR33938 in Insect Species
2.2.4. Overexpression of lncRNA:CR33938 in S2 Cells
2.3. Generation of an Epigenomic Cell Atlas of the Developing Leg Imaginal Disc
2.3.1. scATAC-seq Identified Similar Cell Types as scRNA-seq
2.3.2. Chromatin Accessibility Differentiated the T1, T2, and T3 Distal Cell Functions
3. Discussion
4. Materials and Methods
4.1. Fly Maintenance and Stocks
4.2. Fly Breeding Schedule for T1, T2, and T3
4.3. Third Leg Disc Dissection and Single Cell Dissociation
4.4. DNA Library Preparation and Sequencing
4.5. scRNA-seq Raw Data Processing, Quality Assessment, and Filtering
4.6. scRNA-seq Data Integration, Clustering, and Cell Type Identification
4.7. Validation of scRNA-seq Results by FISH and Confocal Imaging
4.8. Construction of lncRNA:CR33938 Expression Vector for Expression Studies
4.9. S2 Cell Culture and Transfection
4.10. RNA Extraction and qRT-PCR of S2 Cells
4.11. Nuclei Isolation for scATAC-seq
4.12. DNA Library Preparation and scATAC-seq
4.13. scATAC-seq Data Analysis
Supplementary Materials
Author Contributions
Funding
Institutional Review Board Statement
Informed Consent Statement
Data Availability Statement
Conflicts of Interest
Appendix A

| Cell Subtype | Gene | Percent Expressed | Normalized UMI Count | Seurat Scaled Normalized UMI Count |
|---|---|---|---|---|
| Medial | al | 14.47507953 | 0.446617753 | −0.38657561 |
| Medial | C15 | 1.033934252 | 0.020802751 | −0.414645183 |
| Medial | Dll | 75.95440085 | 5.128735566 | 0.44025229 |
| Medial | dac | 68.31919406 | 3.578504256 | 1.883267974 |
| Medial | tsh | 8.324496288 | 0.18788577 | −0.980689638 |
| Medial | hth | 39.10392365 | 4.268092807 | −0.888707309 |
| Medial | vg | 1.802757158 | 0.078396772 | −0.412093522 |
| Medial | salr | 1.272534464 | 0.028393623 | −0.448546528 |
| Medial | salm | 1.405090138 | 0.032101424 | −0.457590917 |
| Medial | hui | 10.49840933 | 0.275768473 | −0.441380335 |
| Medial | betaTub56D | 99.73488865 | 67.01346734 | −0.603531241 |
| Medial | alphaTub84B | 99.70837752 | 57.70906617 | −0.54154286 |
| Medial | tsr | 99.60233298 | 52.63663428 | −0.473061117 |
| Medial | Act5C | 99.76139979 | 61.24349032 | −0.509223741 |
| Proximal | al | 17.52711497 | 0.862922147 | 0.067037547 |
| Proximal | C15 | 0.954446855 | 0.015783215 | −0.4175847 |
| Proximal | Dll | 28.63340564 | 1.420345973 | −0.645129847 |
| Proximal | dac | 18.13449024 | 0.723348582 | −0.290659318 |
| Proximal | tsh | 71.32321041 | 4.083784238 | 1.609816265 |
| Proximal | hth | 96.52928416 | 79.60652398 | 1.461906241 |
| Proximal | vg | 1.561822126 | 0.068269738 | −0.417599705 |
| Proximal | salr | 2.212581345 | 0.12027794 | −0.360530445 |
| Proximal | salm | 2.993492408 | 0.195738255 | −0.347537362 |
| Proximal | hui | 8.937093275 | 0.343389783 | −0.426442771 |
| Proximal | betaTub56D | 99.65292842 | 67.46030873 | −0.576381945 |
| Proximal | alphaTub84B | 99.52277657 | 59.83865741 | −0.467998663 |
| Proximal | tsr | 99.43600868 | 53.94964304 | −0.392002795 |
| Proximal | Act5C | 99.69631236 | 64.22054168 | −0.447496433 |
| Fate_Undetermined | al | 7.564469914 | 0.479912329 | −0.350297209 |
| Fate_Undetermined | C15 | 1.088825215 | 0.054030437 | −0.395186544 |
| Fate_Undetermined | Dll | 37.13467049 | 2.905723476 | −0.210385285 |
| Fate_Undetermined | dac | 24.41260745 | 1.538342317 | 0.329880269 |
| Fate_Undetermined | tsh | 13.29512894 | 0.933420238 | −0.484960231 |
| Fate_Undetermined | hth | 51.57593123 | 10.93855676 | −0.680584009 |
| Fate_Undetermined | vg | 1.891117479 | 0.261258161 | −0.312669703 |
| Fate_Undetermined | salr | 1.604584527 | 0.097676107 | −0.382180764 |
| Fate_Undetermined | salm | 2.063037249 | 0.167802628 | −0.3663254 |
| Fate_Undetermined | hui | 6.074498567 | 0.405081245 | −0.412815111 |
| Fate_Undetermined | betaTub56D | 99.94269341 | 87.40336921 | 0.635323338 |
| Fate_Undetermined | alphaTub84B | 99.88538682 | 77.19868569 | 0.131519833 |
| Fate_Undetermined | tsr | 99.82808023 | 67.62449968 | 0.452211633 |
| Fate_Undetermined | Act5C | 99.77077364 | 82.08451192 | −0.07709812 |
| Proximal-Distal-Axis | al | 10.36789298 | 0.323764339 | −0.520439017 |
| Proximal-Distal-Axis | C15 | 2.173913043 | 0.053608202 | −0.395433811 |
| Proximal-Distal-Axis | Dll | 34.44816054 | 1.98972318 | −0.478482888 |
| Proximal-Distal-Axis | dac | 12.04013378 | 0.424840171 | −0.517944852 |
| Proximal-Distal-Axis | tsh | 29.59866221 | 2.366915062 | 0.468215741 |
| Proximal-Distal-Axis | hth | 81.27090301 | 59.52749037 | 0.835425868 |
| Proximal-Distal-Axis | vg | 39.96655518 | 4.585898734 | 2.038686595 |
| Proximal-Distal-Axis | salr | 43.81270903 | 2.625894433 | 2.039602193 |
| Proximal-Distal-Axis | salm | 53.34448161 | 3.74465689 | 2.039279287 |
| Proximal-Distal-Axis | hui | 6.18729097 | 0.155657069 | −0.467912975 |
| Proximal-Distal-Axis | betaTub56D | 99.49832776 | 71.17380529 | −0.350756424 |
| Proximal-Distal-Axis | alphaTub84B | 98.82943144 | 59.83141261 | −0.468248858 |
| Proximal-Distal-Axis | tsr | 98.66220736 | 44.76118553 | −0.959250307 |
| Proximal-Distal-Axis | Act5C | 99.49832776 | 55.6216358 | −0.625789399 |
| Distal | al | 60 | 2.603285376 | 1.963370297 |
| Distal | C15 | 73.57142857 | 4.214292742 | 2.041126432 |
| Distal | Dll | 92.14285714 | 9.809431808 | 1.810211936 |
| Distal | dac | 9.642857143 | 0.250736492 | −0.650508111 |
| Distal | tsh | 9.642857143 | 0.248253186 | −0.940549437 |
| Distal | hth | 27.85714286 | 2.856922579 | −0.932736841 |
| Distal | vg | 1.071428571 | 0.02411907 | −0.441604926 |
| Distal | salr | 1.071428571 | 0.013810745 | −0.462515482 |
| Distal | salm | 2.142857143 | 0.045931453 | −0.448289565 |
| Distal | hui | 12.85714286 | 0.966716888 | −0.288749653 |
| Distal | betaTub56D | 100 | 62.93114147 | −0.851566182 |
| Distal | alphaTub84B | 100 | 55.43422202 | −0.620103282 |
| Distal | tsr | 100 | 53.09832627 | −0.444558658 |
| Distal | Act5C | 100 | 69.10840865 | −0.346149551 |
| Anterior-Posterior-Axis | al | 4.519774011 | 0.091887873 | −0.773096008 |
| Anterior-Posterior-Axis | C15 | 1.129943503 | 0.014602416 | −0.418276194 |
| Anterior-Posterior-Axis | Dll | 13.55932203 | 0.493279925 | −0.916466206 |
| Anterior-Posterior-Axis | dac | 5.649717514 | 0.11476684 | −0.754035963 |
| Anterior-Posterior-Axis | tsh | 56.49717514 | 2.156294232 | 0.3281673 |
| Anterior-Posterior-Axis | hth | 88.70056497 | 39.31225982 | 0.204696051 |
| Anterior-Posterior-Axis | vg | 0 | 0 | −0.454718739 |
| Anterior-Posterior-Axis | salr | 1.694915254 | 0.093867563 | −0.385828973 |
| Anterior-Posterior-Axis | salm | 3.389830508 | 0.088684597 | −0.419536042 |
| Anterior-Posterior-Axis | hui | 79.0960452 | 11.49658469 | 2.037300845 |
| Anterior-Posterior-Axis | betaTub56D | 100 | 105.6986505 | 1.746912454 |
| Anterior-Posterior-Axis | alphaTub84B | 100 | 130.3298526 | 1.966373831 |
| Anterior-Posterior-Axis | tsr | 100 | 89.72629303 | 1.816661244 |
| Anterior-Posterior-Axis | Act5C | 100 | 182.5387119 | 2.005757244 |
| Gene | p_val | avg_log2FC | pct.1 | pct.2 |
|---|---|---|---|---|
| eEF2 | 2.63 × 10−76 | 0.541911833 | 0.949 | 0.968 |
| fabp | 1.12 × 10⁻¹¹ | 0.468294279 | 0.655 | 0.722 |
| Uba1 | 1.76 × 10⁻⁵ | 0.462953007 | 0.446 | 0.655 |
| CG14984 | 0.000107 | 0.459747394 | 0.323 | 0.445 |
| Stip1 | 2.15 × 10⁻⁸ | 0.417890064 | 0.375 | 0.582 |
| Karybeta3 | 5.45 × 10⁻¹³ | 0.411510198 | 0.293 | 0.469 |
| CG3226 | 0.024048 | 0.409442343 | 0.553 | 0.731 |
| SmD3 | 5.37 × 10⁻²¹ | 0.403214155 | 0.733 | 0.868 |
| Ran | 4.25 × 10−44 | 0.394201883 | 0.888 | 0.942 |
| AsnRS | 1.47 × 10⁻¹¹ | 0.392768286 | 0.36 | 0.569 |
| Nph | 1.83 × 10−39 | 0.388031758 | 0.86 | 0.928 |
| CG9922 | 0.673966 | 0.381062842 | 0.531 | 0.76 |
| UQCR-Q | 1.16 × 10⁻²³ | 0.377240451 | 0.782 | 0.901 |
| SmD2 | 2.31 × 10⁻¹⁶ | 0.375790159 | 0.724 | 0.865 |
| eIF3b | 0.002117 | 0.374134239 | 0.619 | 0.813 |
| CCT2 | 0.275826 | 0.370703182 | 0.539 | 0.763 |
| CG8149 | 5.72 × 10⁻⁷ | 0.369303556 | 0.41 | 0.627 |
| COX5A | 2.80 × 10⁻²⁷ | 0.36834579 | 0.789 | 0.9 |
| CG3760 | 4.05 × 10⁻⁶ | 0.3672513 | 0.625 | 0.792 |
| san | 0.000989 | 0.366350781 | 0.443 | 0.663 |
| CCT7 | 0.000414 | 0.36533304 | 0.601 | 0.799 |
| Tudor-SN | 0.001026 | 0.363468674 | 0.489 | 0.701 |
| CG11858 | 0.594245 | 0.362893992 | 0.531 | 0.743 |
| CG11980 | 8.49 × 10⁻¹⁰ | 0.362794172 | 0.382 | 0.598 |
| Fkbp39 | 1.10 × 10⁻³⁴ | 0.362430772 | 0.837 | 0.917 |
| CG17202 | 0.063868 | 0.362292286 | 0.508 | 0.74 |
| Cyt-c-p | 0.739486 | 0.360850946 | 0.547 | 0.754 |
| Tim9a | 8.62 × 10⁻⁵ | 0.360541648 | 0.447 | 0.675 |
| UQCR-14 | 5.71 × 10⁻⁹ | 0.35959829 | 0.693 | 0.862 |
| Rpb8 | 0.014119 | 0.3594748 | 0.474 | 0.699 |
| CCT8 | 3.72 × 10⁻⁸ | 0.355410141 | 0.642 | 0.81 |
| alphaTub84B | 9.72 × 10−106 | 0.351533668 | 0.999 | 0.996 |
| ATPsynbeta | 5.99E-54 | 0.351328277 | 0.926 | 0.955 |
| betaTub56D | 2.12 × 10−111 | 0.351110198 | 0.999 | 0.997 |
| eEF1delta | 3.35 × 10−36 | 0.348262336 | 0.861 | 0.934 |
| eIF6 | 8.97 × 10⁻⁵ | 0.346187749 | 0.437 | 0.661 |
| CG11267 | 4.58 × 10⁻¹⁸ | 0.345982895 | 0.788 | 0.902 |
| Aos1 | 3.11 × 10⁻⁵ | 0.345697042 | 0.633 | 0.808 |
| NHP2 | 1.59 × 10⁻⁵ | 0.34467569 | 0.66 | 0.835 |
| mod | 1.41 × 10⁻¹² | 0.343973569 | 0.709 | 0.863 |
| CG2021 | 4.20 × 10⁻¹² | 0.343366272 | 0.345 | 0.547 |
| Nurf-38 | 5.99 × 10⁻¹⁸ | 0.339601891 | 0.75 | 0.879 |
| ND-ACP | 9.76 × 10⁻¹³ | 0.338718622 | 0.711 | 0.872 |
| CG13994 | 1.07 × 10⁻¹⁵ | 0.337794285 | 0.295 | 0.484 |
| tsr | 1.61 × 10−102 | 0.336728868 | 0.998 | 0.995 |
| ATPsynCF6 | 1.79 × 10⁻²⁶ | 0.335348459 | 0.818 | 0.923 |
| Nedd8 | 1.67 × 10⁻¹² | 0.334310017 | 0.715 | 0.876 |
| Nap1 | 6.07 × 10⁻¹² | 0.334107702 | 0.773 | 0.895 |
| hoip | 6.18 × 10⁻⁶ | 0.333796151 | 0.689 | 0.847 |
| SmB | 1.14 × 10⁻²⁰ | 0.333628184 | 0.785 | 0.895 |
| Incenp | 2.62 × 10⁻¹⁵ | 0.332481608 | 0.315 | 0.513 |
| CG14210 | 6.88 × 10⁻¹⁰ | 0.332309093 | 0.381 | 0.598 |
| alpha-Spec | 7.27 × 10⁻²² | 0.331563515 | 0.298 | 0.518 |
| Act5C | 6.76 × 10−84 | 0.330948608 | 0.998 | 0.997 |
| Pfdn5 | 0.000266 | 0.328369305 | 0.65 | 0.83 |
| tsu | 0.026133 | 0.32834557 | 0.602 | 0.804 |
| RanGAP | 1.02 × 10⁻¹¹ | 0.328311508 | 0.339 | 0.531 |
| CCT1 | 0.001893 | 0.326762196 | 0.621 | 0.814 |
| CRIF | 8.74 × 10⁻¹⁴ | 0.326369065 | 0.313 | 0.499 |
| Ahcy | 0.140383 | 0.325984833 | 0.497 | 0.717 |
| UbcE2M | 2.61 × 10⁻⁵ | 0.324931312 | 0.452 | 0.684 |
| LysRS | 1.92 × 10⁻²⁰ | 0.324481333 | 0.284 | 0.486 |
| Pfdn1 | 0.015668 | 0.322437535 | 0.505 | 0.745 |
| janA | 0.027436 | 0.322236117 | 0.64 | 0.84 |
| Ote | 2.27 × 10⁻¹¹ | 0.321707361 | 0.335 | 0.517 |
| Rpn9 | 0.001611 | 0.321592929 | 0.626 | 0.817 |
| CG1542 | 1.21 × 10⁻¹² | 0.321248406 | 0.351 | 0.568 |
| COX5B | 1.43 × 10⁻¹⁴ | 0.320658424 | 0.768 | 0.899 |
| eIF3l | 3.71 × 10⁻⁶ | 0.320621493 | 0.434 | 0.656 |
| Pen | 3.70 × 10⁻¹⁵ | 0.320548585 | 0.764 | 0.892 |
| nop5 | 3.23 × 10⁻⁸ | 0.31963021 | 0.432 | 0.655 |
| HP4 | 0.192532 | 0.319387871 | 0.517 | 0.737 |
| NAT1 | 1.18 × 10⁻¹⁶ | 0.318248392 | 0.38 | 0.613 |
| Rpn1 | 1.24 × 10⁻¹⁰ | 0.318033663 | 0.422 | 0.661 |
| ND-51 | 1.15 × 10⁻⁹ | 0.31799648 | 0.41 | 0.652 |
| Txl | 0.013031 | 0.317304773 | 0.484 | 0.704 |
| Prosbeta5 | 8.73 × 10⁻¹⁹ | 0.316609822 | 0.779 | 0.894 |
| wac | 0.050386 | 0.316434419 | 0.484 | 0.703 |
| Hsc70-4 | 5.19 × 10−63 | 0.316015021 | 0.982 | 0.986 |
| me31B | 0.419468 | 0.315758713 | 0.581 | 0.797 |
| GluProRS | 1.96 × 10⁻⁹ | 0.315644484 | 0.181 | 0.28 |
| Prp8 | 1.00 × 10⁻¹⁴ | 0.3153532 | 0.221 | 0.363 |
| Set | 1.77 × 10⁻¹³ | 0.3136136 | 0.755 | 0.882 |
| Pfdn2 | 7.64 × 10⁻⁶ | 0.313432961 | 0.669 | 0.849 |
| SelD | 0.008104 | 0.313112222 | 0.61 | 0.807 |
| HmgD | 3.22 × 10−58 | 0.31212012 | 0.995 | 0.994 |
| Jafrac1 | 1.11 × 10⁻²² | 0.311403095 | 0.867 | 0.935 |
| Mcm6 | 4.23 × 10⁻¹⁰ | 0.309433046 | 0.267 | 0.404 |
| lost | 0.001046 | 0.309298263 | 0.7 | 0.873 |
| Sem1 | 0.001049 | 0.309268908 | 0.67 | 0.863 |
| smid | 2.02 × 10⁻¹⁶ | 0.308262181 | 0.306 | 0.505 |
| CG15019 | 0.475046 | 0.308257341 | 0.587 | 0.808 |
| Echs1 | 0.000121 | 0.308112475 | 0.662 | 0.836 |
| CG34132 | 4.59 × 10⁻¹¹ | 0.307967688 | 0.386 | 0.61 |
| Rpn10 | 0.557285 | 0.30744727 | 0.577 | 0.784 |
| CCT5 | 1.39 × 10⁻¹² | 0.306858295 | 0.739 | 0.862 |
| baf | 1.48 × 10⁻⁹ | 0.30568901 | 0.746 | 0.88 |
| CG16985 | 7.99 × 10⁻¹² | 0.305096172 | 0.231 | 0.368 |
| ND-13B | 0.003083 | 0.304167028 | 0.516 | 0.768 |
| Cdk1 | 0.182413 | 0.3034567 | 0.507 | 0.731 |
| Phb2 | 0.056628 | 0.30342253 | 0.597 | 0.798 |
| La | 0.012425 | 0.30287118 | 0.513 | 0.741 |
| Prp19 | 5.29E-15 | 0.301071904 | 0.342 | 0.558 |
| CG12321 | 4.27E-21 | 0.300344146 | 0.292 | 0.501 |
| ox | 0.214652 | 0.299991914 | 0.533 | 0.769 |
| Prosalpha3 | 5.63E-19 | 0.298876442 | 0.791 | 0.903 |
| SmE | 4.45E-06 | 0.298829465 | 0.694 | 0.867 |
| CG3594 | 2.93E-15 | 0.298465681 | 0.286 | 0.471 |
| Pomp | 5.66E-19 | 0.298305603 | 0.813 | 0.907 |
| CG5903 | 0.6842 | 0.297434191 | 0.571 | 0.795 |
| Acbp1 | 0.059744 | 0.297149608 | 0.557 | 0.768 |
| CG6523 | 0.022022 | 0.296185019 | 0.602 | 0.808 |
| aurB | 3.70E-05 | 0.295450632 | 0.4 | 0.586 |
| ND-SGDH | 0.175992 | 0.295209903 | 0.581 | 0.802 |
| mtSSB | 1.81E-10 | 0.294435499 | 0.409 | 0.639 |
| Rpb5 | 1.51E-06 | 0.293998942 | 0.444 | 0.68 |
| CG2862 | 8.93E-22 | 0.293161476 | 0.83 | 0.931 |
| Sgt | 0.056897 | 0.292139314 | 0.537 | 0.763 |
| pch2 | 9.67E-12 | 0.292049575 | 0.399 | 0.631 |
| CG12848 | 7.97E-15 | 0.292017665 | 0.334 | 0.547 |
| His2Av | 2.63E-27 | 0.291847689 | 0.915 | 0.954 |
| Prosalpha7 | 0.000855 | 0.290548841 | 0.652 | 0.843 |
| ATPsynD | 1.62E-27 | 0.289427165 | 0.868 | 0.941 |
| CCT3 | 4.81E-05 | 0.289356898 | 0.669 | 0.852 |
| tko | 0.060424 | 0.288967965 | 0.515 | 0.744 |
| ND-19 | 6.71E-06 | 0.288617644 | 0.468 | 0.717 |
| CG9752 | 1.15E-05 | 0.288354586 | 0.316 | 0.44 |
| mge | 2.15E-08 | 0.288185938 | 0.449 | 0.704 |
| Srp19 | 8.31E-13 | 0.287931596 | 0.401 | 0.64 |
| Chc | 3.98E-16 | 0.287462202 | 0.377 | 0.612 |
| eIF3j | 6.29E-20 | 0.287256028 | 0.367 | 0.623 |
| CG14543 | 1.82E-16 | 0.286760991 | 0.276 | 0.458 |
| CCT6 | 0.088352 | 0.286307611 | 0.598 | 0.809 |
| Mdh2 | 2.50E-12 | 0.285312875 | 0.39 | 0.639 |
| bonsai | 2.32E-18 | 0.284517765 | 0.311 | 0.53 |
| feo | 2.85E-14 | 0.28445883 | 0.342 | 0.551 |
| CG5355 | 7.68E-19 | 0.284380697 | 0.371 | 0.611 |
| GlyRS | 6.75E-13 | 0.283564199 | 0.405 | 0.644 |
| CG9205 | 2.12E-11 | 0.28348611 | 0.394 | 0.623 |
| Rrp40 | 5.61E-18 | 0.282892518 | 0.274 | 0.461 |
| l(1)G0004 | 1.37E-17 | 0.282407454 | 0.303 | 0.511 |
| Non2 | 9.28E-23 | 0.282276666 | 0.856 | 0.941 |
| CG10576 | 3.19E-07 | 0.281613969 | 0.695 | 0.85 |
| CG6617 | 1.29E-11 | 0.281332974 | 0.408 | 0.653 |
| CCT4 | 3.04E-07 | 0.280798696 | 0.7 | 0.856 |
| Tom7 | 1.14E-06 | 0.280078089 | 0.706 | 0.878 |
| Pfdn6 | 0.957133 | 0.279903383 | 0.564 | 0.792 |
| Uch | 1.44E-06 | 0.279613571 | 0.492 | 0.738 |
| CG4866 | 1.67E-13 | 0.279468463 | 0.341 | 0.555 |
| roh | 9.19E-20 | 0.279380844 | 0.816 | 0.916 |
| Rpn13 | 0.12711 | 0.279322366 | 0.543 | 0.772 |
| alphaTub84D | 3.38E-07 | 0.279114348 | 0.666 | 0.844 |
| Nlp | 3.51E-44 | 0.278341613 | 0.955 | 0.978 |
| fzy | 1.92E-16 | 0.277611464 | 0.293 | 0.481 |
| Nmt | 1.32E-15 | 0.277587163 | 0.364 | 0.6 |
| CG34200 | 2.80E-19 | 0.277548087 | 0.342 | 0.573 |
| CG3420 | 6.50E-15 | 0.2771143 | 0.362 | 0.589 |
| Cdc37 | 9.32E-12 | 0.276940009 | 0.45 | 0.704 |
| CG10038 | 6.04E-16 | 0.276910568 | 0.308 | 0.506 |
| CG10638 | 8.48E-05 | 0.276901373 | 0.466 | 0.701 |
| Tim23 | 0.098321 | 0.27545809 | 0.536 | 0.772 |
| Rpn11 | 0.777644 | 0.274812562 | 0.548 | 0.771 |
| CG5515 | 8.66E-09 | 0.274683335 | 0.434 | 0.676 |
| Pcd | 9.01E-12 | 0.274174524 | 0.433 | 0.671 |
| DENR | 7.60E-11 | 0.27411005 | 0.418 | 0.67 |
| CG8635 | 4.18E-08 | 0.274072152 | 0.449 | 0.698 |
| Rpn12 | 0.021678 | 0.273993176 | 0.513 | 0.745 |
| pont | 1.01E-08 | 0.273709261 | 0.417 | 0.654 |
| Grx1 | 6.78E-20 | 0.273641436 | 0.344 | 0.58 |
| Gart | 6.00E-18 | 0.27314057 | 0.297 | 0.5 |
| Nacalpha | 6.76E-49 | 0.272817196 | 0.981 | 0.988 |
| GstO2 | 4.65E-08 | 0.272726982 | 0.441 | 0.685 |
| CG14817 | 6.98E-14 | 0.272320839 | 0.377 | 0.598 |
| cype | 7.38E-26 | 0.2714151 | 0.857 | 0.948 |
| COX7A | 2.08E-20 | 0.270870929 | 0.858 | 0.936 |
| Rpn8 | 5.05E-07 | 0.270666209 | 0.468 | 0.725 |
| Prosalpha2 | 1.35E-06 | 0.27064609 | 0.708 | 0.865 |
| Prosalpha5 | 4.93E-09 | 0.270487893 | 0.705 | 0.86 |
| Rpn7 | 0.494035 | 0.27046284 | 0.551 | 0.765 |
| Ski6 | 1.25E-18 | 0.270029048 | 0.269 | 0.461 |
| Scsalpha1 | 0.33089 | 0.269419769 | 0.568 | 0.784 |
| COX8 | 2.60E-14 | 0.269389489 | 0.808 | 0.923 |
| CG7630 | 1.15E-13 | 0.268873423 | 0.803 | 0.922 |
| Arp1 | 2.34E-15 | 0.268500605 | 0.411 | 0.662 |
| Prosbeta7 | 0.700295 | 0.268425349 | 0.597 | 0.804 |
| eIF3c | 6.27E-06 | 0.268191638 | 0.509 | 0.751 |
| CG6937 | 1.25E-14 | 0.267816225 | 0.356 | 0.588 |
| Rae1 | 8.51E-20 | 0.267383088 | 0.301 | 0.509 |
| Art1 | 0.001476 | 0.266939135 | 0.488 | 0.72 |
| Roc1a | 6.33E-16 | 0.266631796 | 0.801 | 0.918 |
| CG17059 | 2.17E-09 | 0.266613285 | 0.453 | 0.708 |
| Non3 | 4.49E-17 | 0.266495993 | 0.339 | 0.564 |
| ncd | 4.47E-16 | 0.264327838 | 0.277 | 0.447 |
| CG4511 | 1.92E-16 | 0.264239389 | 0.394 | 0.649 |
| Updo | 2.45E-20 | 0.264041525 | 0.345 | 0.591 |
| CG1598 | 1.46E-17 | 0.263529104 | 0.362 | 0.604 |
| CG1789 | 3.81E-22 | 0.263440367 | 0.319 | 0.548 |
| ATPsynE | 8.47E-21 | 0.263433084 | 0.848 | 0.943 |
| Nop56 | 0.013911 | 0.262395693 | 0.655 | 0.841 |
| Prosbeta6 | 0.000207 | 0.262237698 | 0.678 | 0.857 |
| COX4 | 1.30E-19 | 0.262022839 | 0.844 | 0.936 |
| CG13364 | 5.33E-09 | 0.261858812 | 0.768 | 0.914 |
| Rpt5 | 1.59E-07 | 0.26115752 | 0.467 | 0.709 |
| CG9667 | 8.35E-18 | 0.261015475 | 0.269 | 0.454 |
| ATPsynB | 1.97E-20 | 0.261004129 | 0.854 | 0.934 |
| ND-13A | 1.30E-15 | 0.260501665 | 0.389 | 0.632 |
| Ssb-c31a | 0.428003 | 0.260444449 | 0.609 | 0.813 |
| eEF1beta | 2.95E-47 | 0.260441246 | 0.986 | 0.989 |
| RnrL | 3.99E-14 | 0.25996256 | 0.231 | 0.365 |
| ND-B15 | 0.00029 | 0.259827447 | 0.501 | 0.742 |
| p23 | 3.03E-21 | 0.259045322 | 0.88 | 0.947 |
| RFeSP | 0.446974 | 0.258835685 | 0.601 | 0.82 |
| AIMP2 | 1.69E-19 | 0.258671195 | 0.332 | 0.569 |
| CG17776 | 1.54E-13 | 0.257691639 | 0.398 | 0.638 |
| Usp5 | 4.82E-22 | 0.257589507 | 0.232 | 0.413 |
| Rpn3 | 9.87E-05 | 0.257434516 | 0.487 | 0.726 |
| blw | 1.28E-26 | 0.257118864 | 0.883 | 0.946 |
| Rpn5 | 0.209107 | 0.256465518 | 0.572 | 0.8 |
| pAbp | 3.06E-12 | 0.256184891 | 0.972 | 0.994 |
| ssx | 6.04E-19 | 0.256144854 | 0.193 | 0.338 |
| CHORD | 3.20E-17 | 0.255801888 | 0.191 | 0.33 |
| Cbs | 1.29E-15 | 0.255282574 | 0.308 | 0.498 |
| Vha14-1 | 0.000131 | 0.255064003 | 0.497 | 0.74 |
| CG9643 | 2.04E-22 | 0.254773967 | 0.286 | 0.495 |
| Fib | 2.20E-09 | 0.254765817 | 0.444 | 0.685 |
| endos | 0.001143 | 0.2546236 | 0.677 | 0.86 |
| msd5 | 3.63E-13 | 0.254565067 | 0.268 | 0.423 |
| Prosbeta3 | 8.21E-15 | 0.254528661 | 0.785 | 0.904 |
| cl | 0.010449 | 0.254513723 | 0.679 | 0.86 |
| CG11444 | 0.171588 | 0.25436775 | 0.559 | 0.779 |
| CG8891 | 8.66E-09 | 0.254175553 | 0.443 | 0.691 |
| icln | 0.000109 | 0.25393175 | 0.492 | 0.748 |
| mAcon1 | 2.12E-21 | 0.253581166 | 0.295 | 0.51 |
| SmF | 0.001047 | 0.253472919 | 0.677 | 0.866 |
| porin | 1.68E-18 | 0.252948112 | 0.846 | 0.943 |
| Nup50 | 1.92E-19 | 0.252683608 | 0.259 | 0.443 |
| dpa | 1.96E-08 | 0.252625619 | 0.22 | 0.322 |
| thoc6 | 1.31E-18 | 0.252359096 | 0.296 | 0.498 |
| RpA-70 | 4.90E-19 | 0.252331257 | 0.243 | 0.413 |
| CG9705 | 0.019547 | 0.252183496 | 0.676 | 0.873 |
| Shmt | 1.73E-06 | 0.251894976 | 0.455 | 0.699 |
| alien | 3.33E-15 | 0.251507249 | 0.385 | 0.636 |
| Arl2 | 1.16E-21 | 0.251458627 | 0.256 | 0.445 |
| SerRS | 0.076293 | 0.250933288 | 0.547 | 0.774 |
| CG1943 | 2.38E-10 | 0.250821203 | 0.795 | 0.895 |
| ND-B14.5B | 5.78E-05 | 0.250452901 | 0.496 | 0.755 |
| Analysis Type: | PANTHER Overrepresentation Test (Released on 2 February 2022) | ||||||
| Annotation Version and Release Date: | GO Ontology database DOI: 10.5281/zenodo.6399963 Released on 22 March 2022 | ||||||
| Analyzed List: | upload_1 (Drosophila melanogaster) | ||||||
| Reference List: | Drosophila melanogaster (all genes in database) | ||||||
| Test Type: | FISHER | ||||||
| Correction: | FDR | ||||||
| GO biological process complete | Drosophila melanogaster—REFLIST (13821) | upload_1 (205) | upload_1 (expected) | upload_1 (over/under) | upload_1 (fold Enrichment) | upload_1 (raw P-value) | upload_1 (FDR) |
| mitochondrial electron transport, ubiquinol to cytochrome c (GO:0006122) | 13 | 5 | 0.19 | + | 25.93 | 4.66E-06 | 4.54E-04 |
| DNA unwinding involved in DNA replication (GO:0006268) | 11 | 4 | 0.16 | + | 24.52 | 5.33E-05 | 4.03E-03 |
| spliceosomal snRNP assembly (GO:0000387) | 18 | 6 | 0.27 | + | 22.47 | 9.79E-07 | 1.12E-04 |
| proton motive force-driven ATP synthesis (GO:0015986) | 21 | 6 | 0.31 | + | 19.26 | 2.08E-06 | 2.25E-04 |
| mitochondrial electron transport, cytochrome c to oxygen (GO:0006123) | 15 | 4 | 0.22 | + | 17.98 | 1.45E-04 | 9.39E-03 |
| ATP biosynthetic process (GO:0006754) | 23 | 6 | 0.34 | + | 17.59 | 3.25E-06 | 3.38E-04 |
| purine ribonucleoside triphosphate biosynthetic process (GO:0009206) | 27 | 6 | 0.4 | + | 14.98 | 7.22E-06 | 6.54E-04 |
| purine ribonucleoside triphosphate metabolic process (GO:0009205) | 27 | 6 | 0.4 | + | 14.98 | 7.22E-06 | 6.47E-04 |
| purine nucleoside triphosphate biosynthetic process (GO:0009145) | 27 | 6 | 0.4 | + | 14.98 | 7.22E-06 | 6.39E-04 |
| aerobic electron transport chain (GO:0019646) | 54 | 12 | 0.8 | + | 14.98 | 1.70E-10 | 4.56E-08 |
| purine nucleoside triphosphate metabolic process (GO:0009144) | 28 | 6 | 0.42 | + | 14.45 | 8.66E-06 | 7.42E-04 |
| mitochondrial electron transport, NADH to ubiquinone (GO:0006120) | 19 | 4 | 0.28 | + | 14.19 | 3.16E-04 | 1.89E-02 |
| mitochondrial ATP synthesis coupled electron transport (GO:0042775) | 58 | 12 | 0.86 | + | 13.95 | 3.48E-10 | 7.34E-08 |
| ribonucleoside triphosphate biosynthetic process (GO:0009201) | 30 | 6 | 0.44 | + | 13.48 | 1.22E-05 | 1.03E-03 |
| ribonucleoside triphosphate metabolic process (GO:0009199) | 30 | 6 | 0.44 | + | 13.48 | 1.22E-05 | 1.01E-03 |
| nucleoside triphosphate metabolic process (GO:0009141) | 36 | 7 | 0.53 | + | 13.11 | 2.65E-06 | 2.83E-04 |
| ATP synthesis coupled electron transport (GO:0042773) | 62 | 12 | 0.92 | + | 13.05 | 6.83E-10 | 1.40E-07 |
| respiratory electron transport chain (GO:0022904) | 69 | 13 | 1.02 | + | 12.7 | 1.75E-10 | 4.54E-08 |
| oxidative phosphorylation (GO:0006119) | 69 | 13 | 1.02 | + | 12.7 | 1.75E-10 | 4.39E-08 |
| electron transport chain (GO:0022900) | 76 | 14 | 1.13 | + | 12.42 | 4.43E-11 | 1.38E-08 |
| nucleoside triphosphate biosynthetic process (GO:0009142) | 33 | 6 | 0.49 | + | 12.26 | 1.98E-05 | 1.60E-03 |
| germarium-derived female germ-line cyst formation (GO:0030727) | 23 | 4 | 0.34 | + | 11.73 | 5.97E-04 | 3.35E-02 |
| female germ-line cyst formation (GO:0048135) | 24 | 4 | 0.36 | + | 11.24 | 6.89E-04 | 3.75E-02 |
| DNA duplex unwinding (GO:0032508) | 25 | 4 | 0.37 | + | 10.79 | 7.90E-04 | 4.16E-02 |
| aerobic respiration (GO:0009060) | 101 | 16 | 1.5 | + | 10.68 | 1.33E-11 | 4.70E-09 |
| cellular respiration (GO:0045333) | 111 | 17 | 1.65 | + | 10.33 | 4.82E-12 | 1.88E-09 |
| ATP metabolic process (GO:0046034) | 118 | 18 | 1.75 | + | 10.28 | 1.18E-12 | 5.73E-10 |
| mitochondrial respiratory chain complex I assembly (GO:0032981) | 36 | 5 | 0.53 | + | 9.36 | 3.10E-04 | 1.90E-02 |
| NADH dehydrogenase complex assembly (GO:0010257) | 36 | 5 | 0.53 | + | 9.36 | 3.10E-04 | 1.89E-02 |
| translational initiation (GO:0006413) | 53 | 7 | 0.79 | + | 8.9 | 2.58E-05 | 2.05E-03 |
| tRNA aminoacylation for protein translation (GO:0006418) | 38 | 5 | 0.56 | + | 8.87 | 3.89E-04 | 2.30E-02 |
| energy derivation by oxidation of organic compounds (GO:0015980) | 135 | 17 | 2 | + | 8.49 | 7.90E-11 | 2.28E-08 |
| tRNA aminoacylation (GO:0043039) | 41 | 5 | 0.61 | + | 8.22 | 5.35E-04 | 3.04E-02 |
| amino acid activation (GO:0043038) | 43 | 5 | 0.64 | + | 7.84 | 6.53E-04 | 3.61E-02 |
| protein folding (GO:0006457) | 132 | 15 | 1.96 | + | 7.66 | 3.85E-09 | 6.82E-07 |
| proteasome-mediated ubiquitin-dependent protein catabolic process (GO:0043161) | 217 | 24 | 3.22 | + | 7.46 | 1.08E-13 | 1.20E-10 |
| proteasomal protein catabolic process (GO:0010498) | 229 | 24 | 3.4 | + | 7.07 | 3.16E-13 | 2.74E-10 |
| generation of precursor metabolites and energy (GO:0006091) | 183 | 18 | 2.71 | + | 6.63 | 8.59E-10 | 1.67E-07 |
| centrosome cycle (GO:0007098) | 72 | 7 | 1.07 | + | 6.55 | 1.53E-04 | 9.85E-03 |
| ribonucleoprotein complex assembly (GO:0022618) | 117 | 11 | 1.74 | + | 6.34 | 2.72E-06 | 2.86E-04 |
| modification-dependent macromolecule catabolic process (GO:0043632) | 318 | 29 | 4.72 | + | 6.15 | 2.43E-14 | 4.74E-11 |
| microtubule organizing center organization (GO:0031023) | 77 | 7 | 1.14 | + | 6.13 | 2.25E-04 | 1.41E-02 |
| ribonucleoprotein complex subunit organization (GO:0071826) | 122 | 11 | 1.81 | + | 6.08 | 3.96E-06 | 3.90E-04 |
| modification-dependent protein catabolic process (GO:0019941) | 311 | 28 | 4.61 | + | 6.07 | 9.51E-14 | 1.23E-10 |
| ubiquitin-dependent protein catabolic process (GO:0006511) | 307 | 27 | 4.55 | + | 5.93 | 4.57E-13 | 2.97E-10 |
| proteolysis involved in cellular protein catabolic process (GO:0051603) | 332 | 28 | 4.92 | + | 5.69 | 4.22E-13 | 2.99E-10 |
| cellular protein catabolic process (GO:0044257) | 334 | 28 | 4.95 | + | 5.65 | 4.83E-13 | 2.90E-10 |
| microtubule cytoskeleton organization involved in mitosis (GO:1902850) | 85 | 7 | 1.26 | + | 5.55 | 3.94E-04 | 2.31E-02 |
| protein catabolic process (GO:0030163) | 343 | 28 | 5.09 | + | 5.5 | 8.82E-13 | 4.58E-10 |
| nuclear transport (GO:0051169) | 118 | 9 | 1.75 | + | 5.14 | 1.02E-04 | 6.99E-03 |
| nucleocytoplasmic transport (GO:0006913) | 118 | 9 | 1.75 | + | 5.14 | 1.02E-04 | 6.93E-03 |
| establishment of protein localization to membrane (GO:0090150) | 95 | 7 | 1.41 | + | 4.97 | 7.35E-04 | 3.95E-02 |
| purine ribonucleotide biosynthetic process (GO:0009152) | 96 | 7 | 1.42 | + | 4.92 | 7.79E-04 | 4.13E-02 |
| ribonucleoprotein complex biogenesis (GO:0022613) | 288 | 21 | 4.27 | + | 4.92 | 5.00E-09 | 8.65E-07 |
| cellular macromolecule catabolic process (GO:0044265) | 447 | 32 | 6.63 | + | 4.83 | 5.01E-13 | 2.79E-10 |
| purine-containing compound biosynthetic process (GO:0072522) | 112 | 8 | 1.66 | + | 4.82 | 3.77E-04 | 2.24E-02 |
| cell population proliferation (GO:0008283) | 122 | 8 | 1.81 | + | 4.42 | 6.43E-04 | 3.58E-02 |
| rRNA metabolic process (GO:0016072) | 168 | 11 | 2.49 | + | 4.41 | 6.48E-05 | 4.80E-03 |
| mRNA splicing, via spliceosome (GO:0000398) | 214 | 14 | 3.17 | + | 4.41 | 6.56E-06 | 6.08E-04 |
| RNA splicing, via transesterification reactions with bulged adenosine as nucleophile (GO:0000377) | 214 | 14 | 3.17 | + | 4.41 | 6.56E-06 | 6.01E-04 |
| rRNA processing (GO:0006364) | 153 | 10 | 2.27 | + | 4.41 | 1.41E-04 | 9.25E-03 |
| nucleotide biosynthetic process (GO:0009165) | 123 | 8 | 1.82 | + | 4.39 | 6.77E-04 | 3.71E-02 |
| RNA splicing, via transesterification reactions (GO:0000375) | 216 | 14 | 3.2 | + | 4.37 | 7.25E-06 | 6.35E-04 |
| macromolecule catabolic process (GO:0009057) | 494 | 32 | 7.33 | + | 4.37 | 6.16E-12 | 2.29E-09 |
| nucleoside phosphate biosynthetic process (GO:1901293) | 124 | 8 | 1.84 | + | 4.35 | 7.12E-04 | 3.85E-02 |
| spindle organization (GO:0007051) | 125 | 8 | 1.85 | + | 4.31 | 7.48E-04 | 3.99E-02 |
| translation (GO:0006412) | 304 | 19 | 4.51 | + | 4.21 | 2.72E-07 | 3.47E-05 |
| protein-containing complex assembly (GO:0065003) | 433 | 27 | 6.42 | + | 4.2 | 7.19E-10 | 1.44E-07 |
| establishment of protein localization to organelle (GO:0072594) | 179 | 11 | 2.66 | + | 4.14 | 1.11E-04 | 7.43E-03 |
| RNA splicing (GO:0008380) | 228 | 14 | 3.38 | + | 4.14 | 1.29E-05 | 1.06E-03 |
| peptide biosynthetic process (GO:0043043) | 310 | 19 | 4.6 | + | 4.13 | 3.61E-07 | 4.39E-05 |
| meiotic cell cycle (GO:0051321) | 215 | 13 | 3.19 | + | 4.08 | 3.09E-05 | 2.40E-03 |
| mitotic cell cycle (GO:0000278) | 399 | 24 | 5.92 | + | 4.06 | 1.33E-08 | 2.11E-06 |
| meiotic cell cycle process (GO:1903046) | 204 | 12 | 3.03 | + | 3.97 | 8.02E-05 | 5.63E-03 |
| organonitrogen compound catabolic process (GO:1901565) | 514 | 30 | 7.62 | + | 3.93 | 3.34E-10 | 7.64E-08 |
| microtubule cytoskeleton organization (GO:0000226) | 344 | 20 | 5.1 | + | 3.92 | 3.88E-07 | 4.65E-05 |
| nuclear division (GO:0000280) | 246 | 14 | 3.65 | + | 3.84 | 2.88E-05 | 2.27E-03 |
| cell cycle (GO:0007049) | 608 | 34 | 9.02 | + | 3.77 | 5.64E-11 | 1.69E-08 |
| ribosome biogenesis (GO:0042254) | 215 | 12 | 3.19 | + | 3.76 | 1.29E-04 | 8.49E-03 |
| mitochondrion organization (GO:0007005) | 235 | 13 | 3.49 | + | 3.73 | 7.34E-05 | 5.20E-03 |
| amide biosynthetic process (GO:0043604) | 350 | 19 | 5.19 | + | 3.66 | 2.03E-06 | 2.22E-04 |
| organelle fission (GO:0048285) | 259 | 14 | 3.84 | + | 3.64 | 4.92E-05 | 3.75E-03 |
| protein-containing complex organization (GO:0043933) | 527 | 28 | 7.82 | + | 3.58 | 9.82E-09 | 1.59E-06 |
| mRNA metabolic process (GO:0016071) | 344 | 18 | 5.1 | + | 3.53 | 6.19E-06 | 5.81E-04 |
| mRNA processing (GO:0006397) | 268 | 14 | 3.98 | + | 3.52 | 6.98E-05 | 4.99E-03 |
| cell cycle process (GO:0022402) | 513 | 26 | 7.61 | + | 3.42 | 8.53E-08 | 1.17E-05 |
| mitotic cell cycle process (GO:1903047) | 277 | 14 | 4.11 | + | 3.41 | 9.75E-05 | 6.72E-03 |
| chromosome organization (GO:0051276) | 476 | 24 | 7.06 | + | 3.4 | 3.06E-07 | 3.84E-05 |
| spermatogenesis (GO:0007283) | 264 | 13 | 3.92 | + | 3.32 | 2.21E-04 | 1.40E-02 |
| peptide metabolic process (GO:0006518) | 409 | 20 | 6.07 | + | 3.3 | 4.90E-06 | 4.71E-04 |
| protein localization to organelle (GO:0033365) | 249 | 12 | 3.69 | + | 3.25 | 4.63E-04 | 2.67E-02 |
| cellular catabolic process (GO:0044248) | 801 | 38 | 11.88 | + | 3.2 | 3.45E-10 | 7.48E-08 |
| microtubule-based process (GO:0007017) | 464 | 21 | 6.88 | + | 3.05 | 8.79E-06 | 7.44E-04 |
| male gamete generation (GO:0048232) | 310 | 14 | 4.6 | + | 3.04 | 2.97E-04 | 1.84E-02 |
| ncRNA metabolic process (GO:0034660) | 377 | 17 | 5.59 | + | 3.04 | 6.83E-05 | 4.97E-03 |
| cellular nitrogen compound biosynthetic process (GO:0044271) | 711 | 32 | 10.55 | + | 3.03 | 3.45E-08 | 5.07E-06 |
| regulation of catabolic process (GO:0009894) | 291 | 13 | 4.32 | + | 3.01 | 5.39E-04 | 3.04E-02 |
| RNA processing (GO:0006396) | 560 | 25 | 8.31 | + | 3.01 | 1.46E-06 | 1.63E-04 |
| organic substance catabolic process (GO:1901575) | 823 | 36 | 12.21 | + | 2.95 | 8.56E-09 | 1.42E-06 |
| intracellular protein transport (GO:0006886) | 328 | 14 | 4.87 | + | 2.88 | 5.12E-04 | 2.93E-02 |
| cellular amide metabolic process (GO:0043603) | 493 | 21 | 7.31 | + | 2.87 | 2.10E-05 | 1.69E-03 |
| female gamete generation (GO:0007292) | 628 | 26 | 9.31 | + | 2.79 | 3.36E-06 | 3.45E-04 |
| gene expression (GO:0010467) | 1120 | 46 | 16.61 | + | 2.77 | 3.36E-10 | 7.48E-08 |
| catabolic process (GO:0009056) | 932 | 38 | 13.82 | + | 2.75 | 1.91E-08 | 2.92E-06 |
| cellular macromolecule biosynthetic process (GO:0034645) | 496 | 20 | 7.36 | + | 2.72 | 6.96E-05 | 5.02E-03 |
| sexual reproduction (GO:0019953) | 931 | 37 | 13.81 | + | 2.68 | 5.75E-08 | 8.30E-06 |
| germ cell development (GO:0007281) | 713 | 28 | 10.58 | + | 2.65 | 3.63E-06 | 3.63E-04 |
| cellular component biogenesis (GO:0044085) | 1285 | 50 | 19.06 | + | 2.62 | 2.90E-10 | 6.85E-08 |
| organonitrogen compound biosynthetic process (GO:1901566) | 800 | 31 | 11.87 | + | 2.61 | 1.34E-06 | 1.52E-04 |
| cellular process involved in reproduction in multicellular organism (GO:0022412) | 852 | 33 | 12.64 | + | 2.61 | 5.89E-07 | 6.95E-05 |
| RNA metabolic process (GO:0016070) | 828 | 32 | 12.28 | + | 2.61 | 9.37E-07 | 1.09E-04 |
| gamete generation (GO:0007276) | 915 | 35 | 13.57 | + | 2.58 | 3.38E-07 | 4.18E-05 |
| oogenesis (GO:0048477) | 576 | 22 | 8.54 | + | 2.58 | 6.48E-05 | 4.76E-03 |
| cellular protein metabolic process (GO:0044267) | 1683 | 63 | 24.96 | + | 2.52 | 4.07E-12 | 1.67E-09 |
| cellular component assembly (GO:0022607) | 1109 | 41 | 16.45 | + | 2.49 | 8.82E-08 | 1.18E-05 |
| nucleobase-containing compound metabolic process (GO:0006139) | 1369 | 50 | 20.31 | + | 2.46 | 2.65E-09 | 4.79E-07 |
| cytoskeleton organization (GO:0007010) | 580 | 21 | 8.6 | + | 2.44 | 3.13E-04 | 1.89E-02 |
| nucleic acid metabolic process (GO:0090304) | 1105 | 40 | 16.39 | + | 2.44 | 1.96E-07 | 2.54E-05 |
| reproductive process (GO:0022414) | 1190 | 43 | 17.65 | + | 2.44 | 6.16E-08 | 8.57E-06 |
| developmental process involved in reproduction (GO:0003006) | 892 | 32 | 13.23 | + | 2.42 | 5.10E-06 | 4.84E-04 |
| cellular nitrogen compound metabolic process (GO:0034641) | 1801 | 64 | 26.71 | + | 2.4 | 2.20E-11 | 7.45E-09 |
| heterocycle metabolic process (GO:0046483) | 1451 | 51 | 21.52 | + | 2.37 | 7.34E-09 | 1.24E-06 |
| cellular macromolecule metabolic process (GO:0044260) | 2106 | 74 | 31.24 | + | 2.37 | 3.46E-13 | 2.70E-10 |
| organelle organization (GO:0006996) | 1721 | 60 | 25.53 | + | 2.35 | 2.20E-10 | 5.35E-08 |
| multicellular organismal reproductive process (GO:0048609) | 1041 | 36 | 15.44 | + | 2.33 | 3.50E-06 | 3.54E-04 |
| macromolecule biosynthetic process (GO:0009059) | 696 | 24 | 10.32 | + | 2.32 | 1.57E-04 | 1.00E-02 |
| cellular aromatic compound metabolic process (GO:0006725) | 1495 | 51 | 22.17 | + | 2.3 | 1.55E-08 | 2.42E-06 |
| proteolysis (GO:0006508) | 861 | 29 | 12.77 | + | 2.27 | 5.96E-05 | 4.46E-03 |
| organic cyclic compound metabolic process (GO:1901360) | 1558 | 51 | 23.11 | + | 2.21 | 5.89E-08 | 8.35E-06 |
| cellular metabolic process (GO:0044237) | 3877 | 126 | 57.51 | + | 2.19 | 7.75E-23 | 3.02E-19 |
| cellular component organization or biogenesis (GO:0071840) | 2778 | 88 | 41.2 | + | 2.14 | 2.76E-13 | 2.69E-10 |
| macromolecule localization (GO:0033036) | 874 | 27 | 12.96 | + | 2.08 | 4.25E-04 | 2.47E-02 |
| cellular biosynthetic process (GO:0044249) | 1178 | 36 | 17.47 | + | 2.06 | 4.31E-05 | 3.32E-03 |
| reproduction (GO:0000003) | 1421 | 43 | 21.08 | + | 2.04 | 7.99E-06 | 6.92E-04 |
| cellular component organization (GO:0016043) | 2616 | 79 | 38.8 | + | 2.04 | 8.68E-11 | 2.41E-08 |
| organic substance biosynthetic process (GO:1901576) | 1212 | 36 | 17.98 | + | 2 | 9.41E-05 | 6.55E-03 |
| macromolecule metabolic process (GO:0043170) | 3193 | 94 | 47.36 | + | 1.98 | 1.44E-12 | 6.23E-10 |
| biosynthetic process (GO:0009058) | 1239 | 36 | 18.38 | + | 1.96 | 1.15E-04 | 7.63E-03 |
| nitrogen compound metabolic process (GO:0006807) | 3671 | 106 | 54.45 | + | 1.95 | 3.62E-14 | 5.64E-11 |
| protein metabolic process (GO:0019538) | 2183 | 63 | 32.38 | + | 1.95 | 1.26E-07 | 1.67E-05 |
| multicellular organism reproduction (GO:0032504) | 1275 | 36 | 18.91 | + | 1.9 | 2.28E-04 | 1.42E-02 |
| metabolic process (GO:0008152) | 4548 | 128 | 67.46 | + | 1.9 | 1.15E-17 | 3.00E-14 |
| organonitrogen compound metabolic process (GO:1901564) | 2725 | 75 | 40.42 | + | 1.86 | 2.76E-08 | 4.14E-06 |
| primary metabolic process (GO:0044238) | 4039 | 109 | 59.91 | + | 1.82 | 1.30E-12 | 5.96E-10 |
| cellular process (GO:0009987) | 7306 | 188 | 108.37 | + | 1.73 | 2.61E-33 | 2.03E-29 |
| organic substance metabolic process (GO:0071704) | 4283 | 110 | 63.53 | + | 1.73 | 2.91E-11 | 9.45E-09 |
| biological_process (GO:0008150) | 11314 | 197 | 167.81 | + | 1.17 | 1.87E-09 | 3.47E-07 |
| Unclassified (UNCLASSIFIED) | 2507 | 8 | 37.19 | − | 0.22 | 1.87E-09 | 3.55E-07 |
References
- Schmitz, S.U.; Grote, P.; Herrmann, B.G. Mechanisms of long noncoding RNA function in development and disease. Cell. Mol. Life Sci. 2016, 73, 2491–2509. [Google Scholar] [CrossRef] [PubMed] [Green Version]
- Laurent, G.S.; Wahlestedt, C.; Kapranov, P. The Landscape of long non-coding RNA classification: The non-coding RNA universe. Trends Genet. 2016, 31, 239–251. [Google Scholar] [CrossRef] [PubMed] [Green Version]
- Sarropoulos, I.; Marin, R.; Cardoso-Moreira, M.; Kaessmann, H. Developmental dynamics of lncRNAs across mammalian organs and species. Nature 2019, 571, 510–514. [Google Scholar] [CrossRef] [PubMed]
- Esteller, M. Non-coding RNAs in human disease. Nat. Rev. Genet. 2011, 12, 861–874. [Google Scholar] [CrossRef]
- Adams, M.D.; Celniker, S.E.; Holt, R.A.; Evans, C.A.; Gocayne, J.D.; Amanatides, P.G.; Scherer, S.E.; Li, P.W.; Hoskins, R.A.; Galle, R.F.; et al. The genome sequence of Drosophila melanogaster. Science 2000, 287, 2185–2195. [Google Scholar] [CrossRef] [Green Version]
- Pandey, U.B.; Nichols, C.D. Human Disease Models in Drosophila melanogaster and the Role of the Fly in Therapeutic Drug Discovery. Pharmacol. Rev. 2011, 63, 411–436. [Google Scholar] [CrossRef] [PubMed] [Green Version]
- Beira, J.V.; Paro, R. The legacy of Drosophila imaginal discs. Chromosoma 2016, 125, 573–592. [Google Scholar] [CrossRef] [Green Version]
- Aldridge, S.; Teichmann, S.A. Single cell transcriptomics comes of age. Nat. Commun. 2020, 11, 4307. [Google Scholar] [CrossRef]
- Tang, F.; Barbacioru, C.; Wang, Y.; Nordman, E.; Lee, C.; Xu, N.; Wang, X.; Bodeau, J.; Tuch, B.B.; Siddiqui, A.A.; et al. mRNA-Seq whole-transcriptome analysis of a single cell. Nat. Methods 2009, 6, 377–382. [Google Scholar] [CrossRef]
- Hwang, B.; Lee, J.H.; Bang, D. Single-cell RNA sequencing technologies and bioinformatics pipelines. Exp. Mol. Med. 2018, 50, 96. [Google Scholar] [CrossRef] [Green Version]
- Chen, G.; Ning, B.; Shi, T. Single-Cell RNA-Seq Technologies and Related Computational Data Analysis. Front. Genet. 2019, 10, 317. [Google Scholar] [CrossRef] [PubMed]
- Svensson, V.; da Veiga Beltrame, E.; Pachter, L. A curated database reveals trends in single-cell transcriptomics. Database 2020, 2020, baaa073. [Google Scholar] [CrossRef]
- Klein, A.M.; Treutlein, B. Single cell analyses of development in the modern era. Development 2019, 146, dev181396. [Google Scholar] [CrossRef] [PubMed] [Green Version]
- Ariss, M.M.; Islam, A.B.M.M.K.; Critcher, M.; Zappia, M.P.; Frolov, M.V. Single cell RNA-sequencing identifies a metabolic aspect of apoptosis in Rbf mutant. Nat. Commun. 2018, 9, 5024. [Google Scholar] [CrossRef] [PubMed]
- Bageritz, J.; Willnow, P.; Valentini, E.; Leible, S.; Boutros, M.; Teleman, A.A. Gene expression atlas of a developing tissue by single cell expression correlation analysis. Nat. Methods 2019, 16, 750–756. [Google Scholar] [CrossRef]
- Deng, M.; Wang, Y.; Zhang, L.; Yang, Y.; Huang, S.; Wang, J.; Ge, H.; Ishibashi, T.; Yan, Y. Single cell transcriptomic landscapes of pattern formation, proliferation and growth in Drosophila wing imaginal discs. Development 2019, 146, dev179754. [Google Scholar] [CrossRef] [Green Version]
- Zappia, M.P.; de Castro, L.; Ariss, M.M.; Jefferson, H.; Islam, A.B.; Frolov, M.V. A cell atlas of adult muscle precursors uncovers early events in fibre-type divergence in Drosophila. EMBO Rep. 2020, 21, e49555. [Google Scholar] [CrossRef]
- González-Blas, C.B.; Quan, X.J.; Duran-Romaña, R.; Taskiran, I.I.; Koldere, D.; Davie, K.; Christiaens, V.; Makhzami, S.; Hulselmans, G.; de Waegeneer, M.; et al. Identification of genomic enhancers through spatial integration of single-cell transcriptomics and epigenomics. Mol. Syst. Biol. 2020, 16, e9438. [Google Scholar] [CrossRef]
- Everetts, N.J.; Worley, M.I.; Yasutomi, R.; Yosef, N.; Hariharan, I.K. Single-cell transcriptomics of the Drosophila wing disc reveals instructive epithelium-to-myoblast interactions. Elife 2021, 10, e61276. [Google Scholar] [CrossRef]
- Li, H.; Janssens, J.; De Waegeneer, M.; Kolluru, S.S.; Davie, K.; Gardeux, V.; Saelens, W.; David, F.P.A.; Brbić, M.; Spanier, K.; et al. Fly Cell Atlas: A single-nucleus transcriptomic atlas of the adult fruit fly. Science 2022, 375, 6584. [Google Scholar] [CrossRef]
- Worley, M.I.; Everetts, N.J.; Yasutomi, R.; Yosef, N.; Hariharan, I.K. Critical genetic program for Drosophila imaginal disc regeneration revealed by single-cell analysis. BioRxiv 2021. [Google Scholar] [CrossRef]
- Estella, C.; Voutev, R.; Mann, R.S. A Dynamic Network of Morphogens and Transcription Factors Patterns the Fly Leg. Curr. Top. Dev. Biol. 2012, 98, 173–198. [Google Scholar] [PubMed] [Green Version]
- Schubiger, G.; Schubiger, M.; Sustar, A. The three leg imaginal discs of Drosophila: “Vive la différence”. Dev. Biol. 2012, 369, 76–90. [Google Scholar] [CrossRef] [Green Version]
- Sudarsan, V.; Anant, S.; Guptan, P.; Vijayraghavan, K.; Skaer, H. Myoblast Diversification and Ectodermal Signaling in Drosophila. Dev. Cell 2001, 1, 829–839. [Google Scholar] [CrossRef]
- Fraichard, S.; Bougé, A.L.; Kendall, T.; Chauvel, I.; Bouhin, H.; Bunch, T.A. Tenectin is a novel αPS2βPS integrin ligand required for wing morphogenesis and male genital looping in Drosophila. Dev. Biol. 2010, 340, 504–517. [Google Scholar] [CrossRef] [PubMed]
- Cattenoz, P.B.; Monticelli, S.; Pavlidaki, A.; Giangrande, A. Toward a Consensus in the Repertoire of Hemocytes Identified in Drosophila. Front. Cell Dev. Biol. 2021, 9, 643712. [Google Scholar] [CrossRef]
- Trébuchet, G.; Cattenoz, P.B.; Zsámboki, J.; Mazaud, D.; Siekhaus, D.E.; Fanto, M.; Giangrande, A. The Repo Homeodomain Transcription Factor Suppresses Hematopoiesis in Drosophila and Preserves the Glial Fate. J. Neurosci. 2019, 39, 255. [Google Scholar] [CrossRef] [Green Version]
- Zaharieva, E.; Haussmann, I.U.; Bräuer, U.; Soller, M. Concentration and Localization of Coexpressed ELAV/Hu Proteins Control Specificity of mRNA Processing. Mol. Cell. Biol. 2015, 35, 3104–3115. [Google Scholar] [CrossRef] [Green Version]
- Morriss, G.R.; Bryantsev, A.L.; Chechenova, M.; LaBeau, E.M.; Lovato, T.L.; Ryan, K.M.; Cripps, R.M. Analysis of Skeletal Muscle Development in Drosophila. Methods Mol. Biol. 2012, 798, 127–152. [Google Scholar]
- Taylor, M.V. Comparison of Muscle Development in Drosophila and Vertebrates. In Muscle Development in Drosophila; Springer: New York, NY, USA, 2006. [Google Scholar]
- Lee, C.-Y.; Andersen, R.O.; Cabernard, C.; Manning, L.; Tran, K.D.; Lanskey, M.J.; Bashirullah, A.; Doe, C.Q. Drosophila Aurora-A kinase inhibits neuroblast self-renewal by regulating aPKC/Numb cortical polarity and spindle orientation. Genes Dev. 2006, 20, 3474. [Google Scholar] [CrossRef] [Green Version]
- Lilly, B.; O’Keefe, D.D.; Thomas, J.B.; Botas, J. The LIM homeodomain protein dLim1 defines a subclass of neurons within the embryonic ventral nerve cord of Drosophila. Mech. Dev. 1999, 88, 195–205. [Google Scholar] [CrossRef]
- Sen, S.; Hartmann, B.; Reichert, H.; Rodrigues, V. Expression and function of the empty spiracles gene in olfactory sense organ development of Drosophila melanogaster. Development 2010, 137, 3687–3695. [Google Scholar] [CrossRef] [PubMed] [Green Version]
- Avalos, C.B.; Maier, G.L.; Bruggmann, R.M.; Sprecher, S.G. Single cell transcriptome atlas of the Drosophila larval brain. Elife 2019, 8, e50354. [Google Scholar] [CrossRef] [PubMed]
- Wagh, D.A.; Rasse, T.M.; Asan, E.; Hofbauer, A.; Schwenkert, I.; Dürrbeck, H.; Buchner, S.; Dabauvalle, M.-C.; Schmidt, M.; Qin, G.; et al. Bruchpilot, a Protein with Homology to ELKS/CAST, Is Required for Structural Integrity and Function of Synaptic Active Zones in Drosophila. Neuron 2006, 49, 833–844. [Google Scholar] [CrossRef] [Green Version]
- Lee, C.H.; Herman, T.; Clandinin, T.R.; Lee, R.; Zipursky, S.L. N-Cadherin Regulates Target Specificity in the Drosophila Visual System. Neuron 2001, 30, 437–450. [Google Scholar] [CrossRef] [Green Version]
- De Navascués, J.; Modolell, J. The pronotum LIM-HD gene tailup is both a positive and a negative regulator of the proneural genes achaete and scute of Drosophila. Mech. Dev. 2010, 127, 393–406. [Google Scholar] [CrossRef]
- Ho, T.Y.; Wu, W.H.; Hung, S.J.; Liu, T.; Lee, Y.M.; Liu, Y.H. Expressional Profiling of Carpet Glia in the Developing Drosophila Eye Reveals Its Molecular Signature of Morphology Regulators. Front. Neurosci. 2019, 13, 244. [Google Scholar] [CrossRef]
- Organista, M.F.; de Celis, J.F. The spalt transcription factors regulate cell proliferation, survival and epithelial integrity downstream of the Decapentaplegic signalling pathway. Biol. Open 2013, 2, 37–48. [Google Scholar] [CrossRef] [Green Version]
- Brown, J.B.; Boley, N.; Eisman, R.; May, G.E.; Stoiber, M.H.; Duff, M.O.; Booth, B.W.; Wen, J.; Park, S.; Suzuki, A.M.; et al. Diversity and dynamics of the Drosophila transcriptome. Nature 2014, 512, 393–399. [Google Scholar] [CrossRef] [Green Version]
- Samuels, T.J.; Järvelin, A.I.; Ish-Horowicz, D.; Davis, I. Imp/IGF2BP levels modulate individual neural stem cell growth and division through myc mRNA stability. Elife 2020, 9, e51529. [Google Scholar] [CrossRef]
- Xu, Q.; Song, Z.; Zhu, C.; Tao, C.; Kang, L.; Liu, W.; He, F.; Yan, J.; Sang, T. Systematic comparison of lncRNAs with protein coding mRNAs in population expression and their response to environmental change. BMC Plant Biol. 2017, 17, 42. [Google Scholar] [CrossRef] [PubMed] [Green Version]
- Grubbs, N.; Leach, M.; Su, X.; Petrisko, T.; Rosario, J.B. New Components of Drosophila Leg Development Identified through Genome Wide Association Studies. PLoS ONE 2013, 8, e60261. [Google Scholar] [CrossRef] [PubMed] [Green Version]
- Dey, B.K.; Zhao, X.L.; Popo-Ola, E.; Campos, A.R. Mutual regulation of the Drosophila disconnected (disco) and Distal-less (Dll) genes contributes to proximal-distal patterning of antenna and leg. Cell Tissue Res. 2009, 338, 227–240. [Google Scholar] [CrossRef] [PubMed]
- Hao, Y.; Hao, S.; Andersen-Nissen, E.; Mauck, W.M., 3rd; Zheng, S.; Butler, A.; Lee, M.J.; Wilk, A.J.; Darby, C.; Zager, M.; et al. Integrated analysis of multimodal single-cell data. Cell 2021, 184, 3573–3587.e29. [Google Scholar] [CrossRef]
- Granja, J.M.; Corces, M.R.; Pierce, S.E.; Bagdatli, S.T.; Choudhry, H.; Chang, H.Y.; Greenleaf, W.J. ArchR is a scalable software package for integrative single-cell chromatin accessibility analysis. Nat. Genet. 2021, 53, 403–411. [Google Scholar] [CrossRef] [PubMed]
- Gaspar, J.M. Improved peak-calling with MACS2. BioRxiv 2018, 496521. [Google Scholar] [CrossRef]


Publisher’s Note: MDPI stays neutral with regard to jurisdictional claims in published maps and institutional affiliations. |
© 2022 by the authors. Licensee MDPI, Basel, Switzerland. This article is an open access article distributed under the terms and conditions of the Creative Commons Attribution (CC BY) license (https://creativecommons.org/licenses/by/4.0/).
Share and Cite
Tse, J.; Li, T.H.; Zhang, J.; Lee, A.C.K.; Lee, I.; Qu, Z.; Lin, X.; Hui, J.; Chan, T.-F. Single-Cell Atlas of the Drosophila Leg Disc Identifies a Long Non-Coding RNA in Late Development. Int. J. Mol. Sci. 2022, 23, 6796. https://doi.org/10.3390/ijms23126796
Tse J, Li TH, Zhang J, Lee ACK, Lee I, Qu Z, Lin X, Hui J, Chan T-F. Single-Cell Atlas of the Drosophila Leg Disc Identifies a Long Non-Coding RNA in Late Development. International Journal of Molecular Sciences. 2022; 23(12):6796. https://doi.org/10.3390/ijms23126796
Chicago/Turabian StyleTse, Joyce, Tsz Ho Li, Jizhou Zhang, Alan Chun Kit Lee, Ivy Lee, Zhe Qu, Xiao Lin, Jerome Hui, and Ting-Fung Chan. 2022. "Single-Cell Atlas of the Drosophila Leg Disc Identifies a Long Non-Coding RNA in Late Development" International Journal of Molecular Sciences 23, no. 12: 6796. https://doi.org/10.3390/ijms23126796