
Nanoparticles Influence Lytic Phage T4-like Performance In Vitro

 ,
,
Abstract
:
1. Introduction
2. Materials and Methods
2.1. Bacterial Host and Bacteriophage
2.2. Chemical Reagents
2.3. Nanoparticle Synthesis
2.3.1. Synthesis of Silica Shell on Iron Oxide Nanoparticles (SiO2-Fe3O4) and Their Functionalization with Titanium Dioxide (SiO2-Fe3O4-TiO2)
2.3.2. Synthesis of Silica Nanospheres (SiO2) and Functionalization with Titanium Dioxide
2.4. Nanoparticle Microscopic Analysis, Zeta Potentials and Stock Suspension Preparation
2.5. Coincubation Assay for Plaque-Forming Ability Determination
2.6. Bacteriophage Lysis of Liquid Culture
2.7. Determination of Phage Eclipse Period
2.8. Microscopic Visualization of Phage–Nanoparticle Interactions
2.9. Statistical Analysis
3. Results
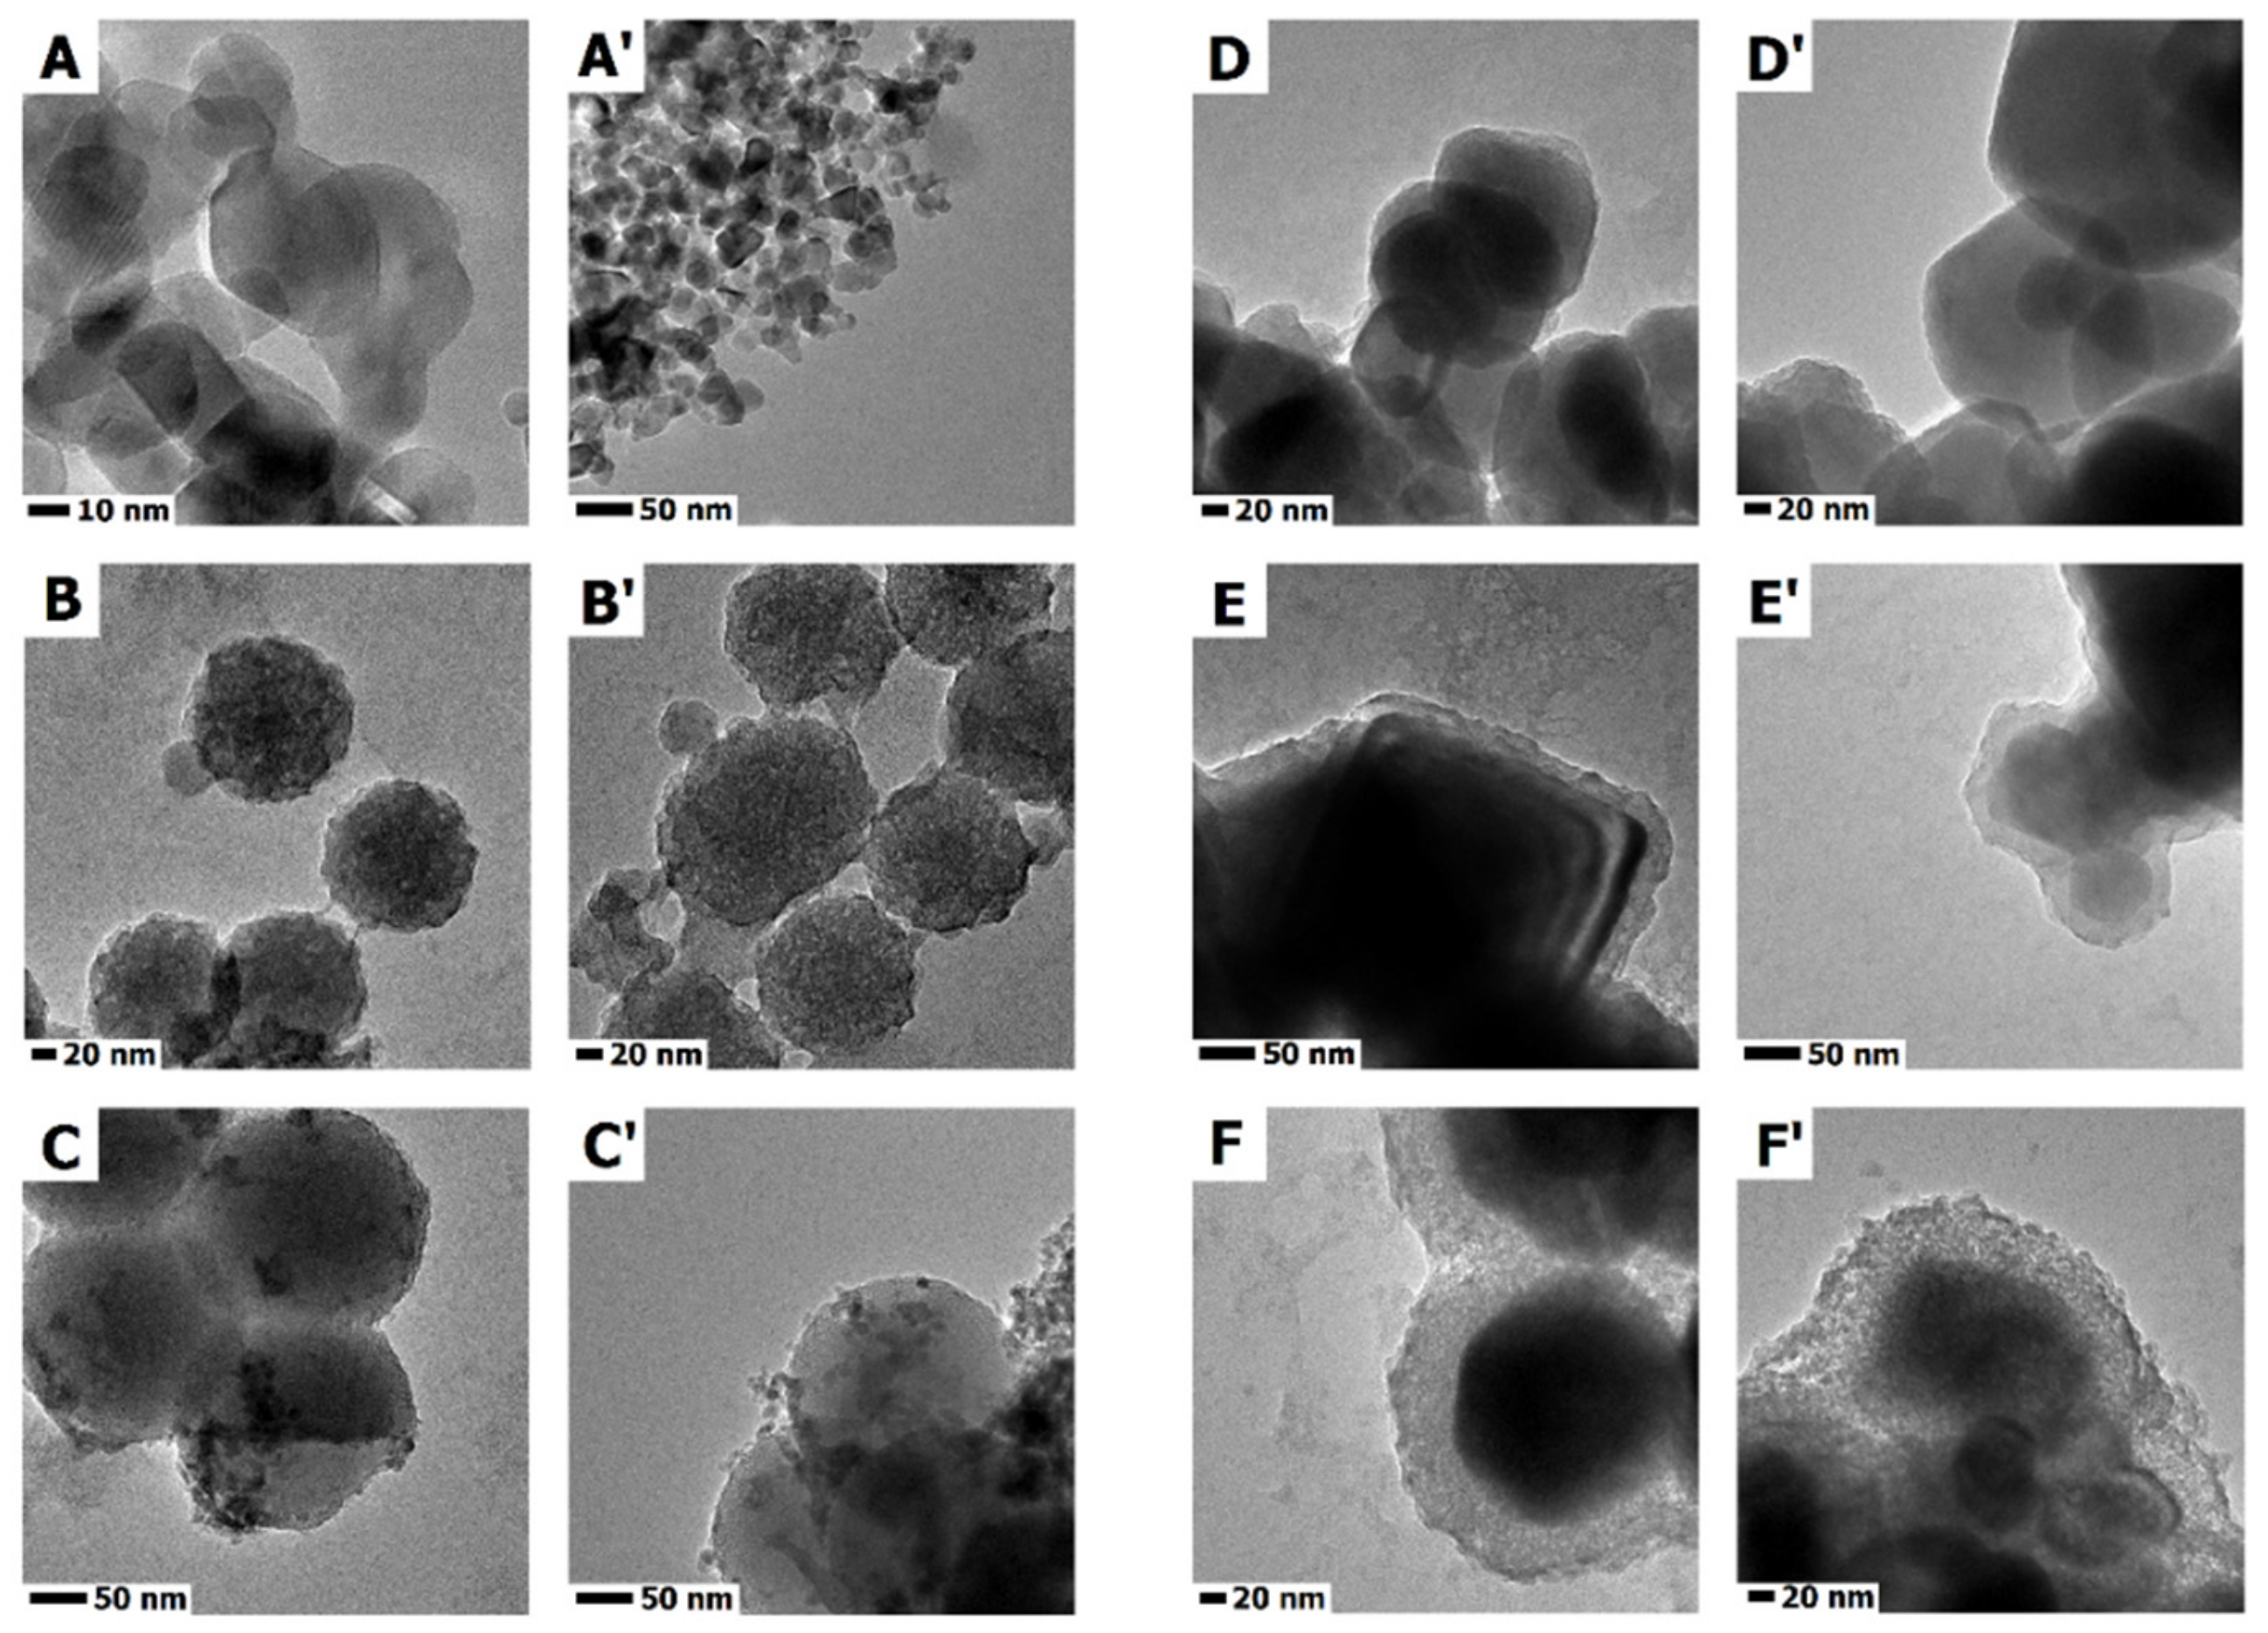
3.1. Nanomaterials Characterization
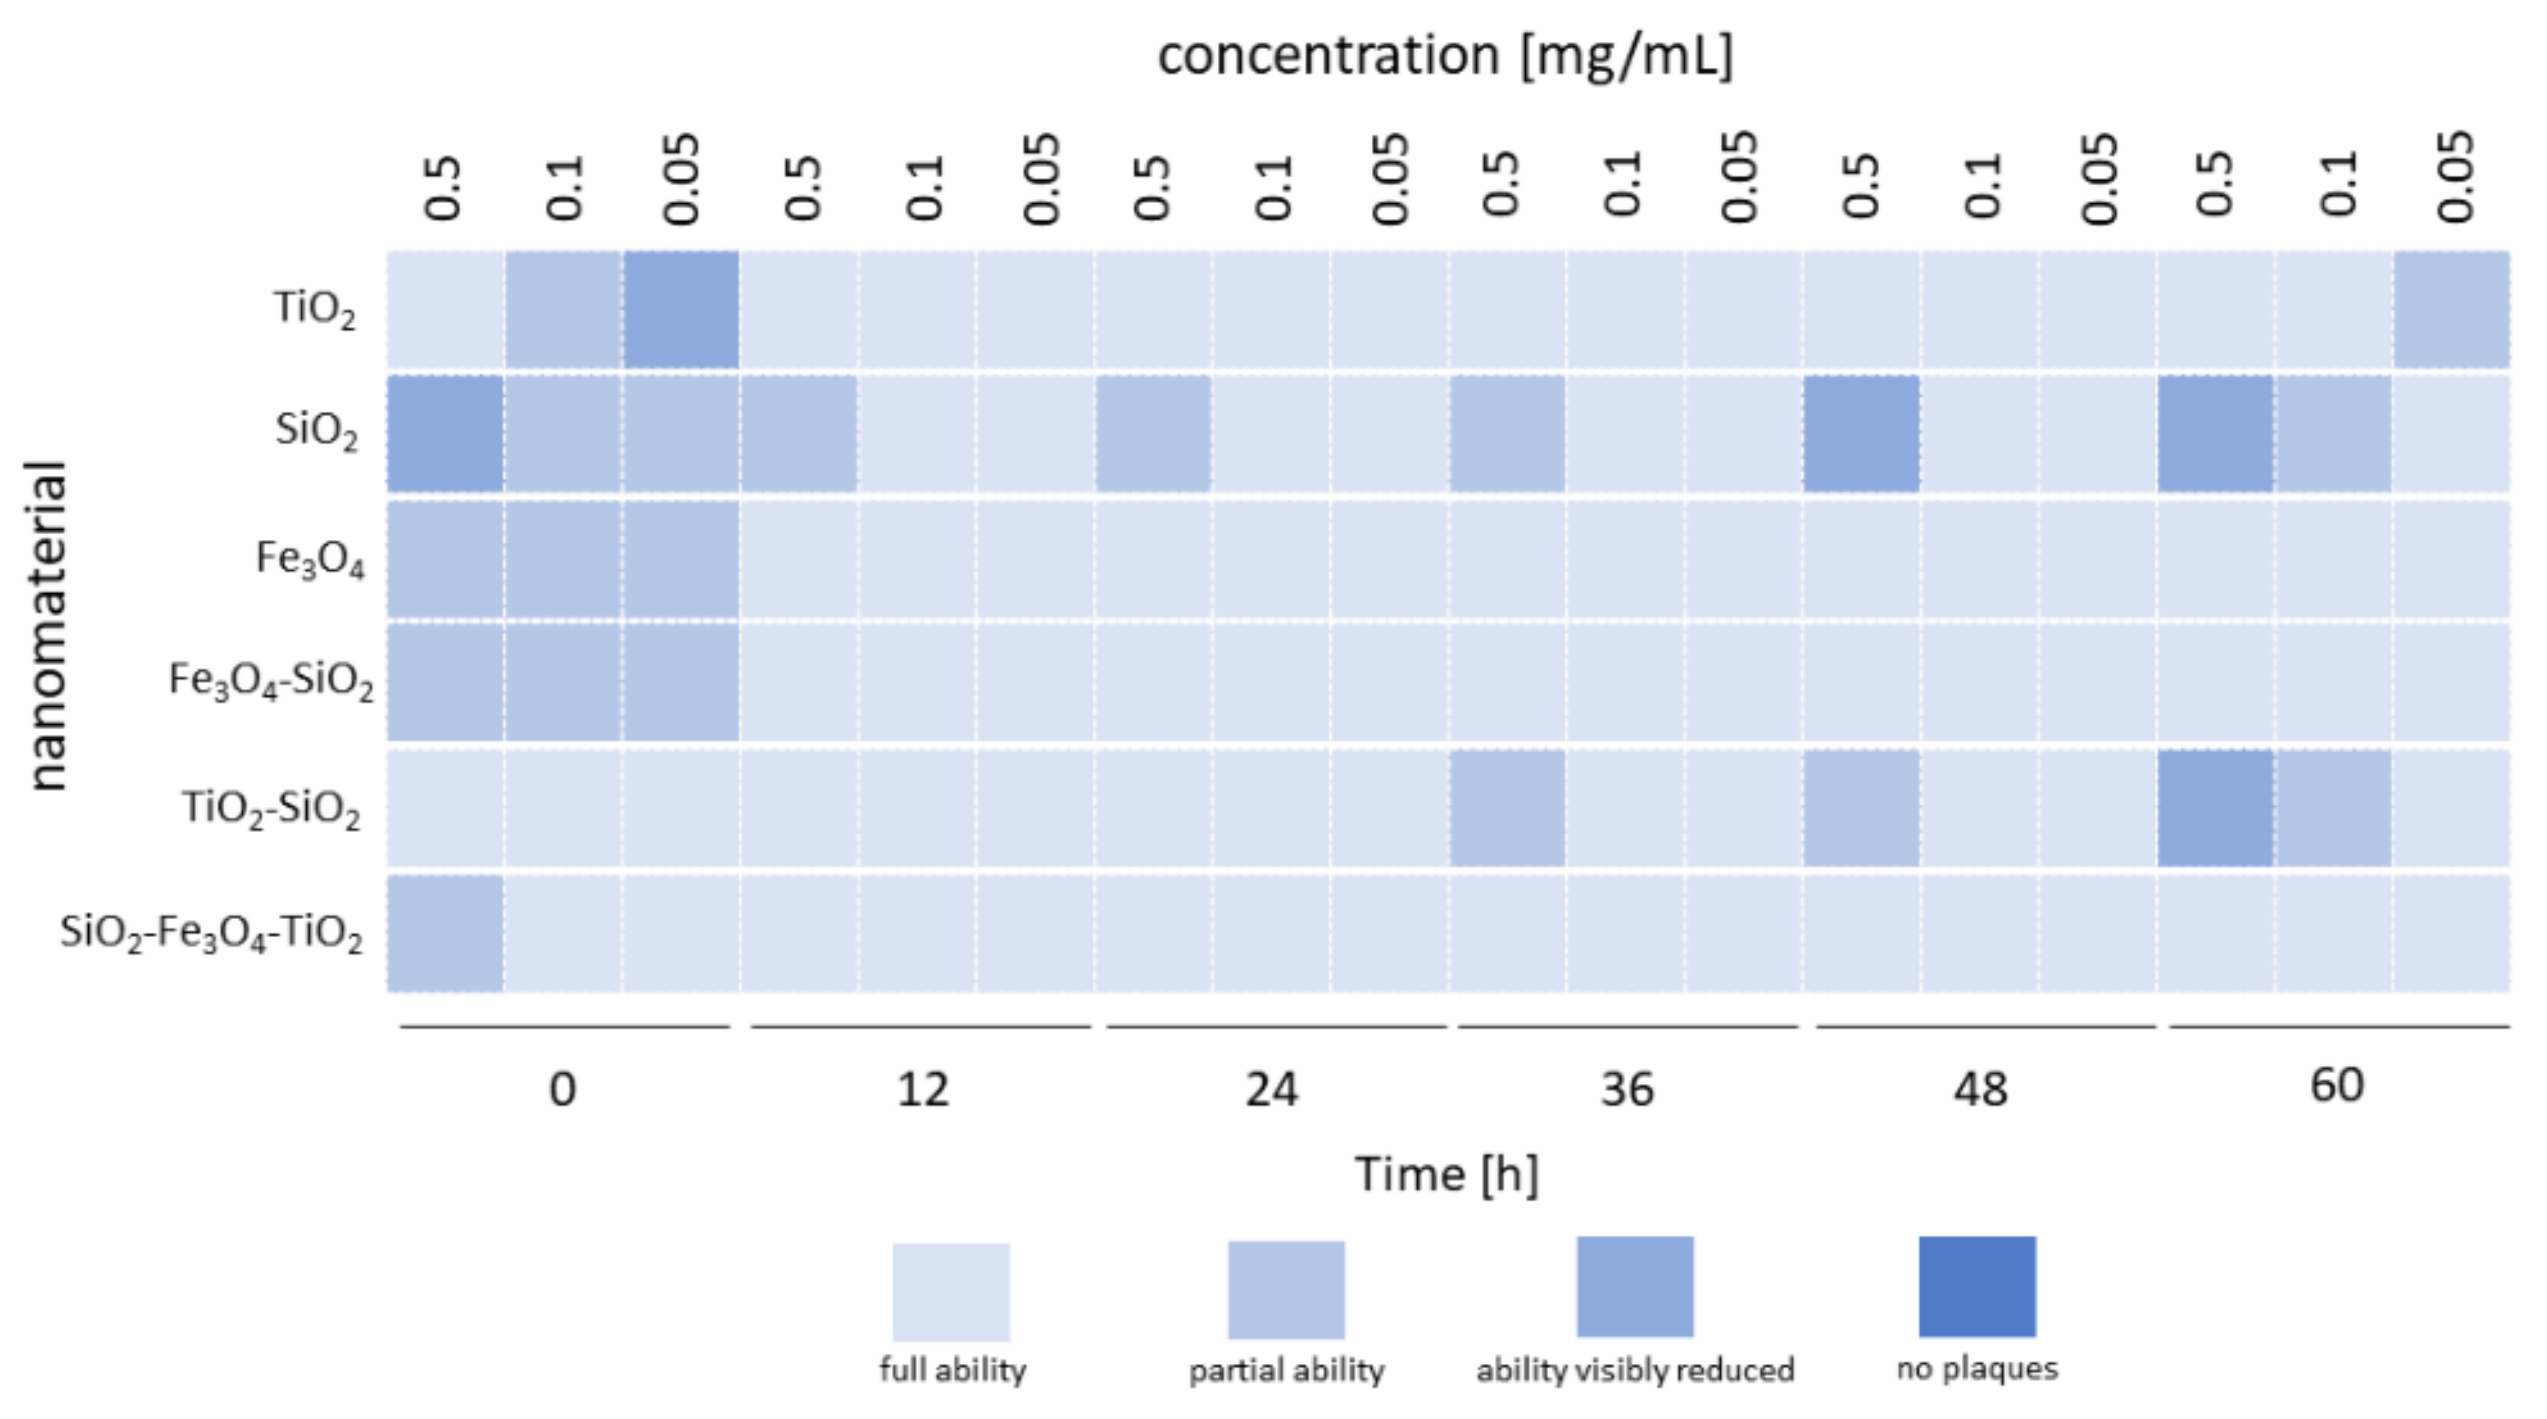
3.2. Coincubation Assay
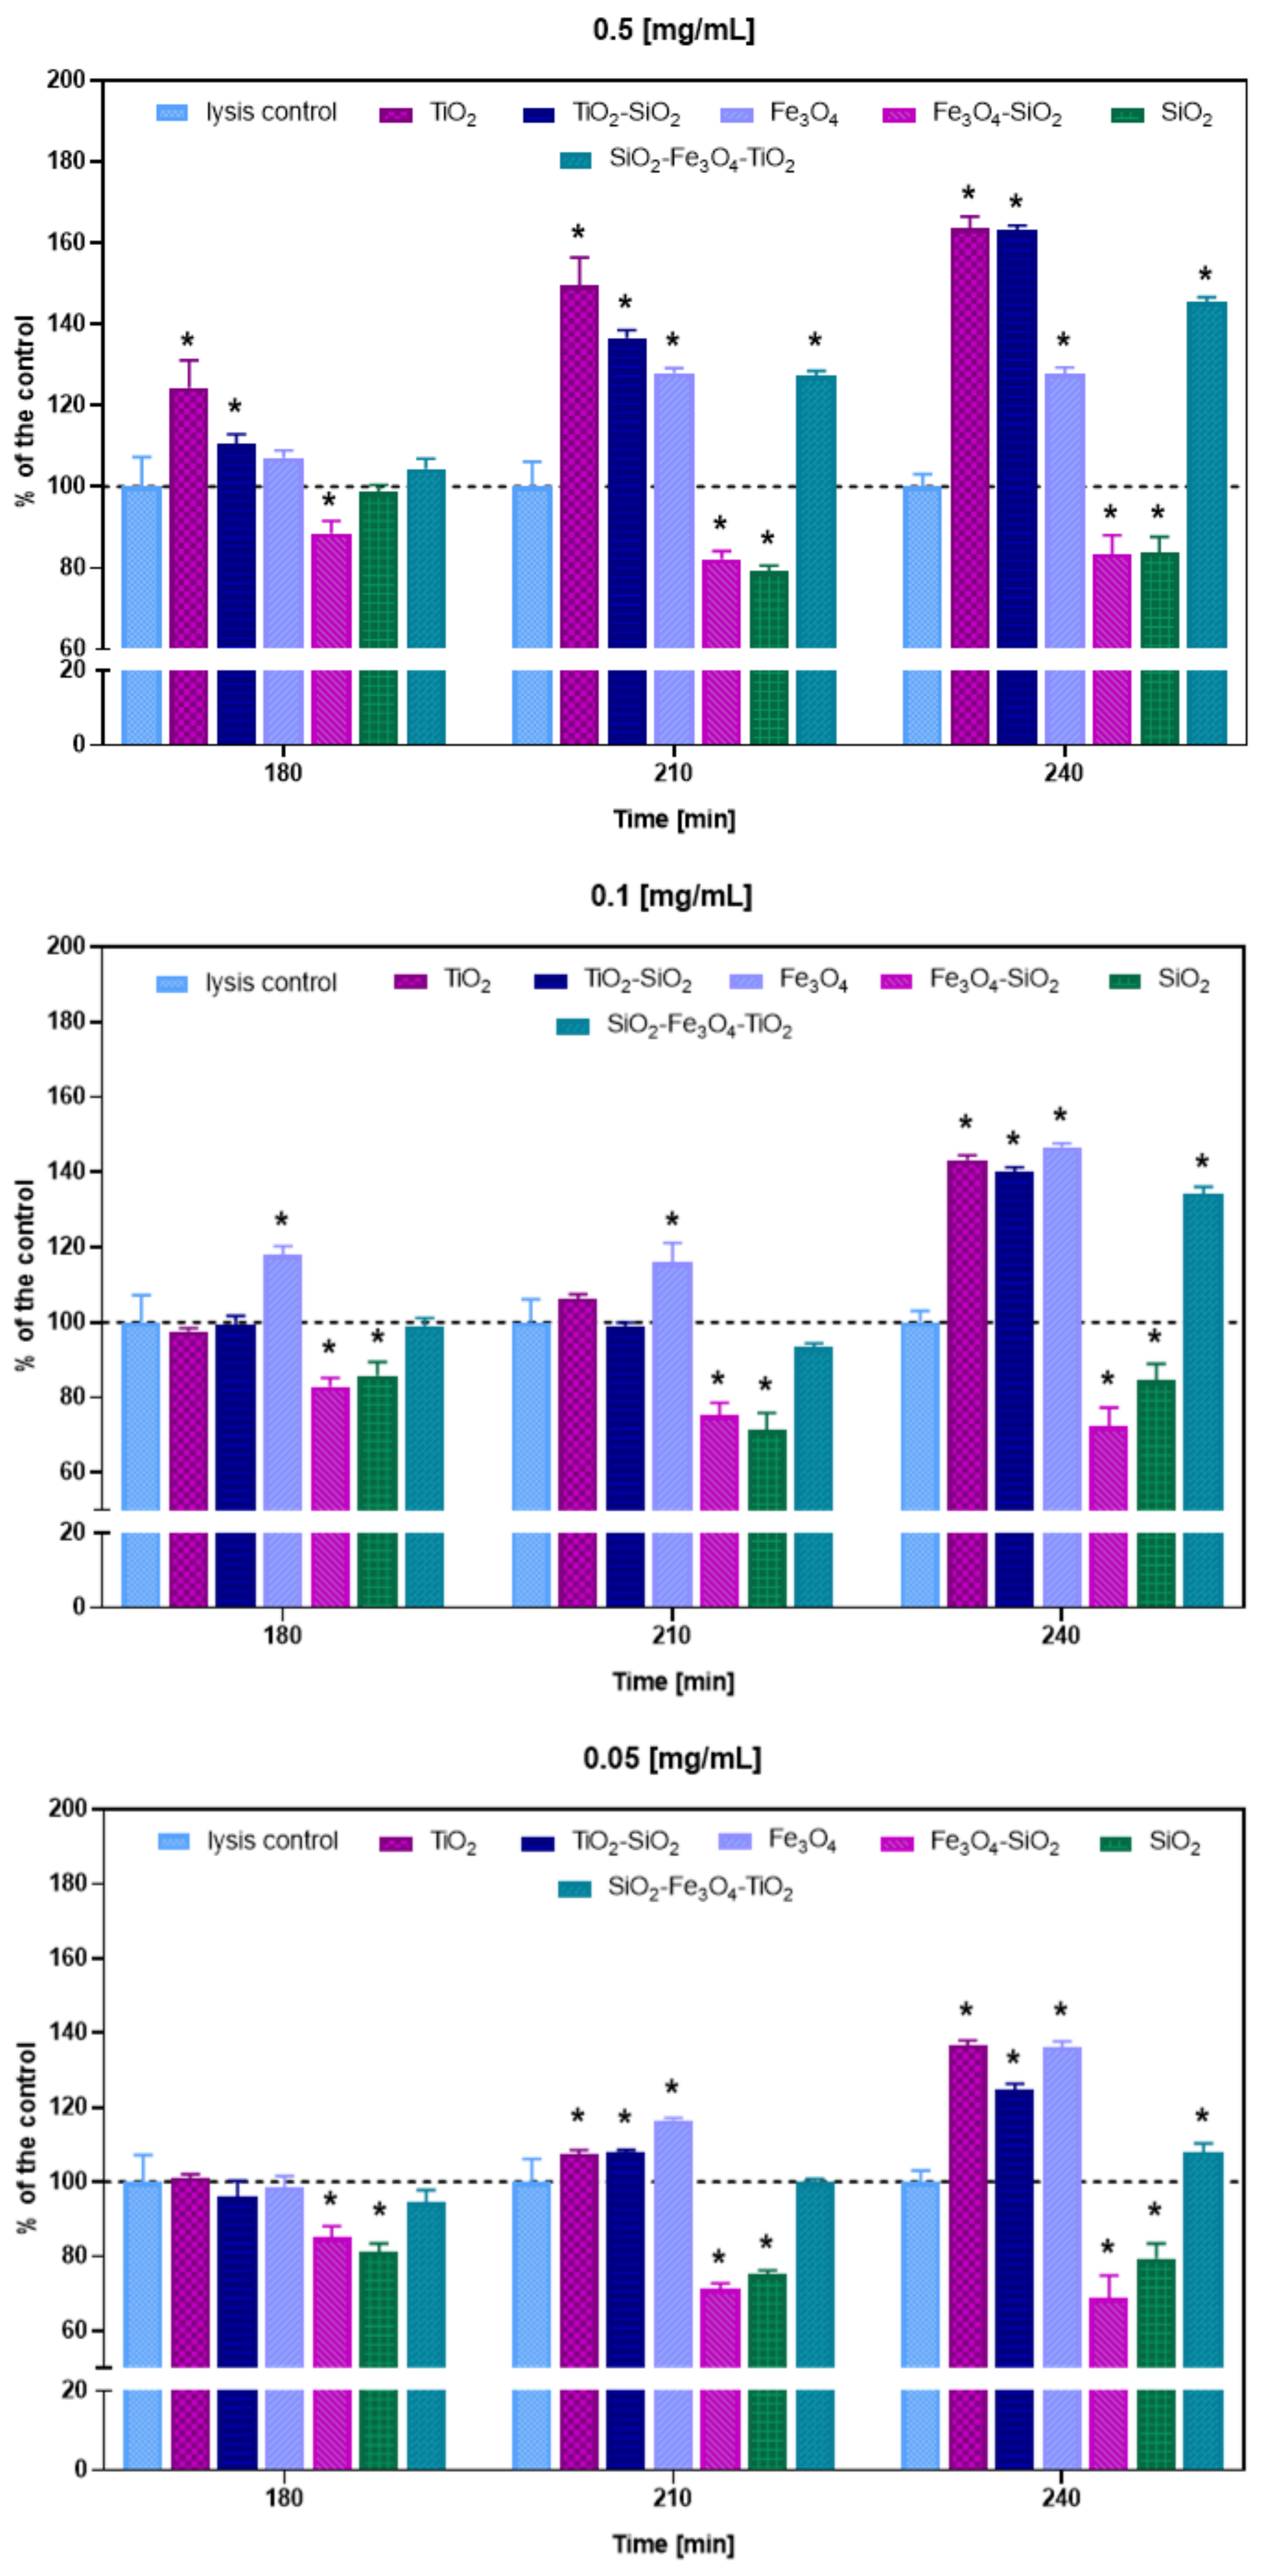
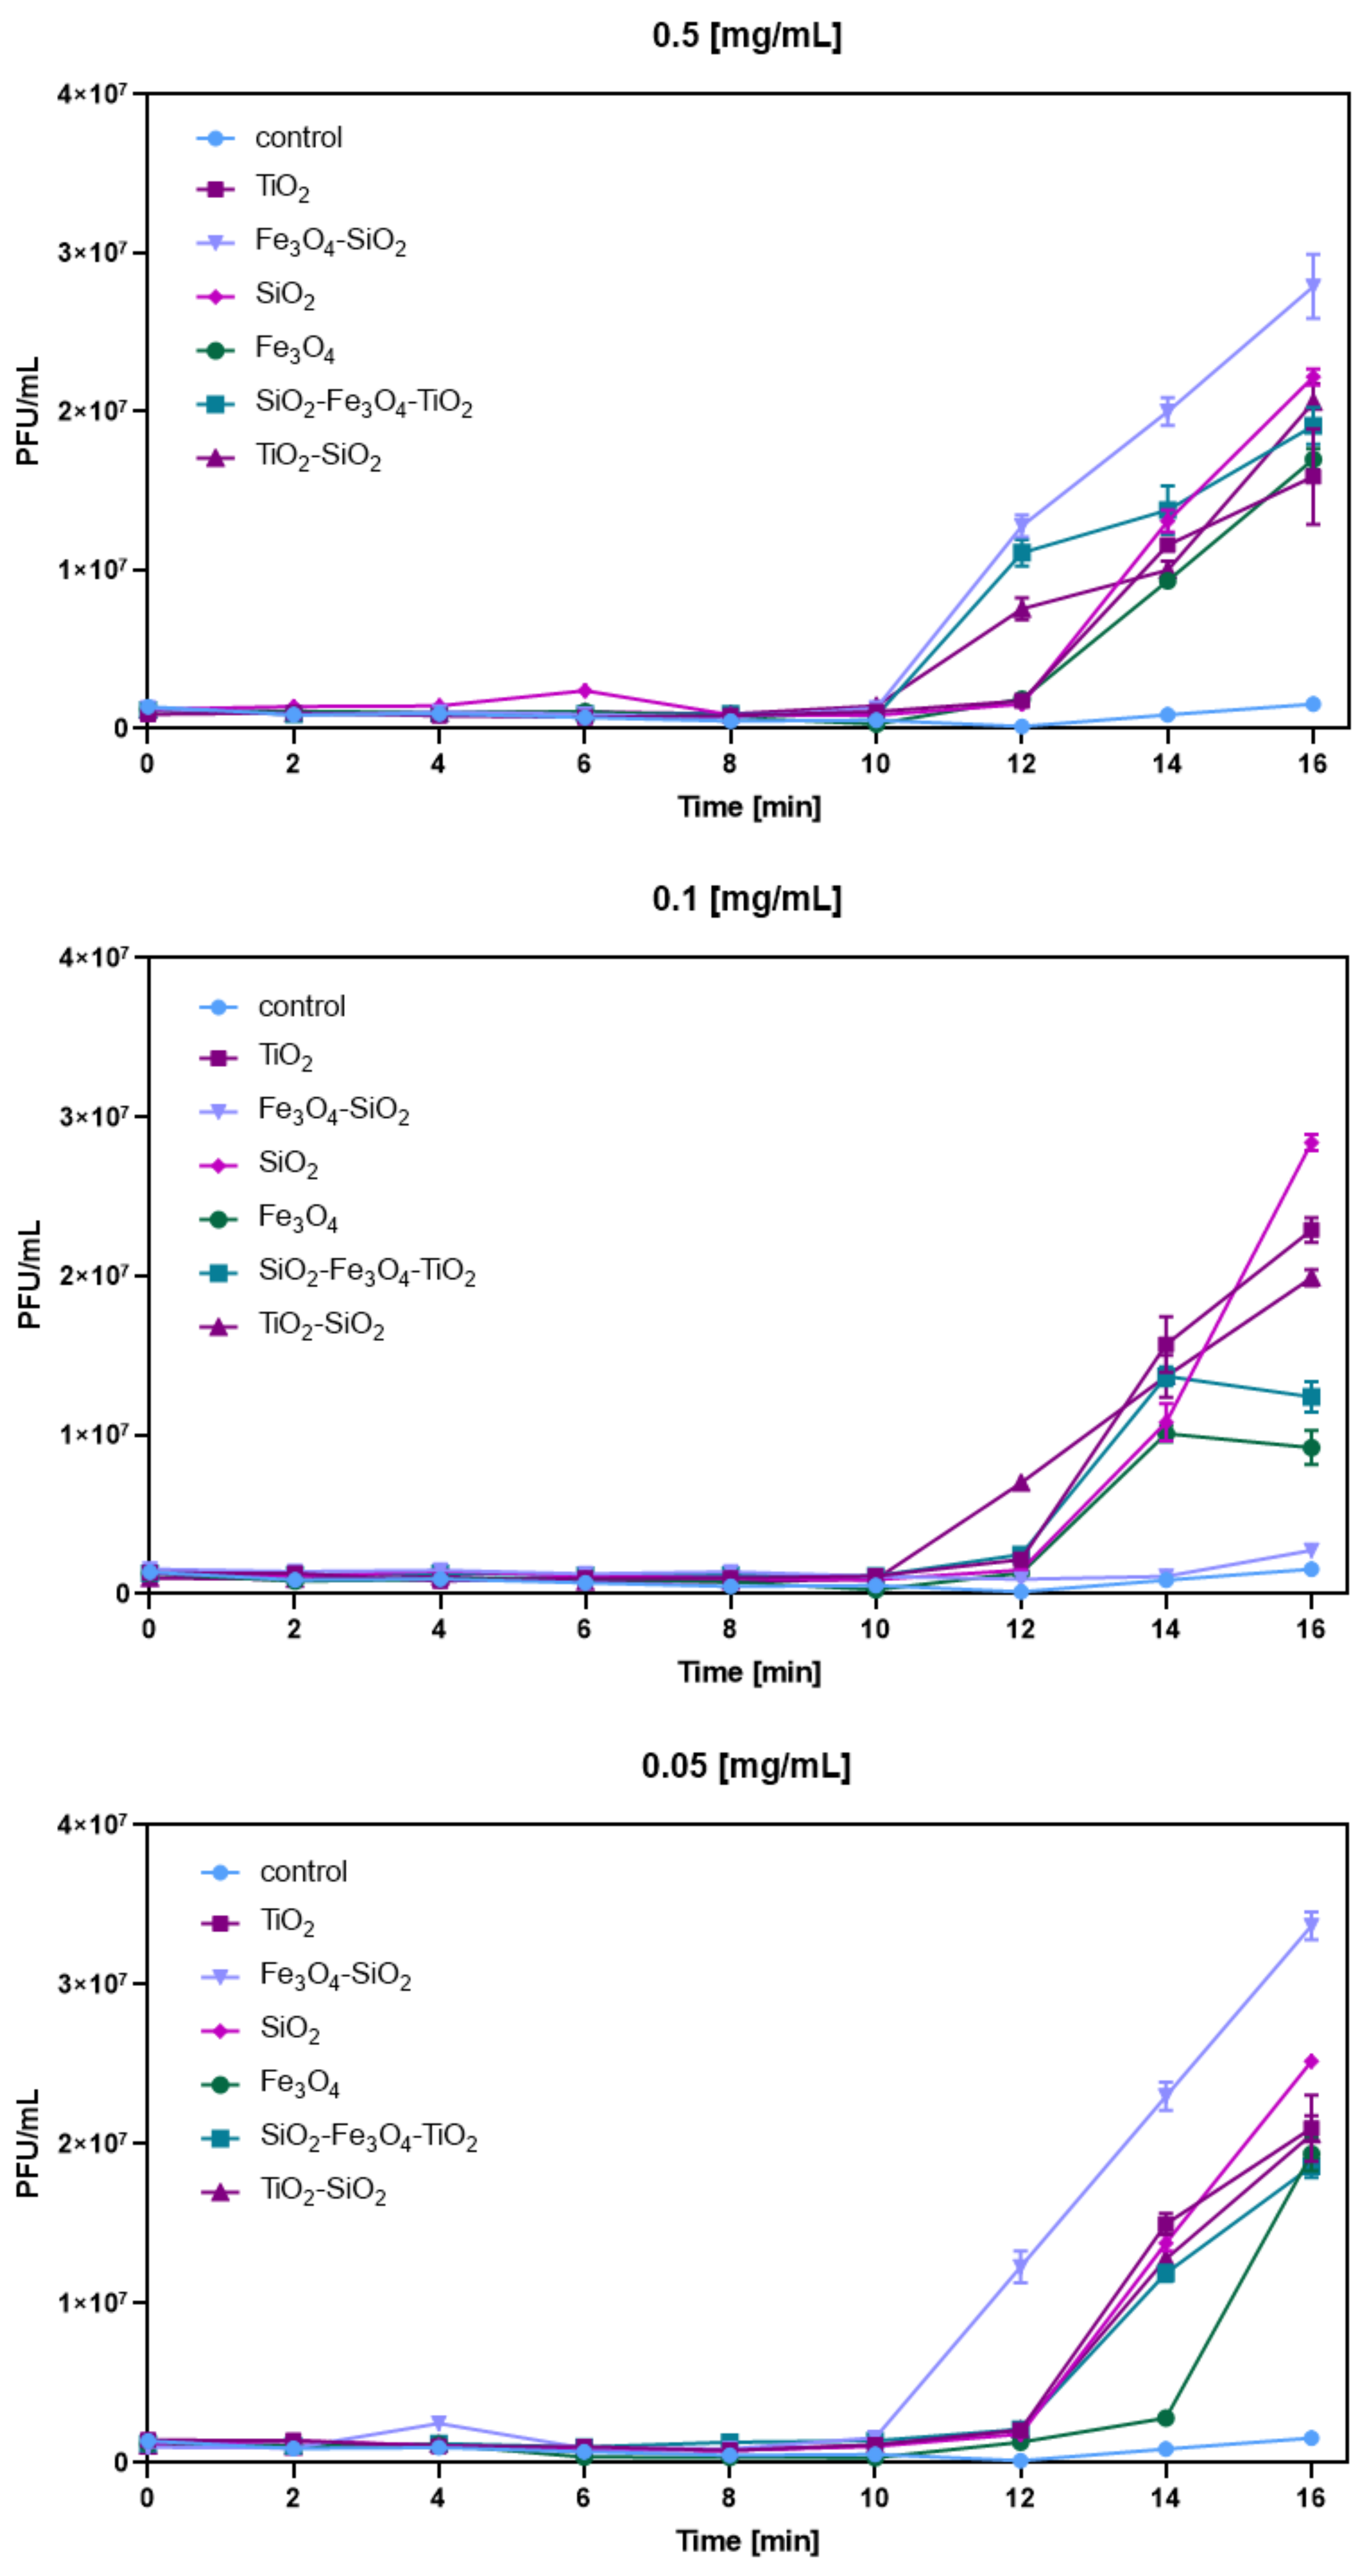
3.3. Bacteriophage Lytic Performance
3.4. Phage Eclipse Periods after Nanoparticle Exposure
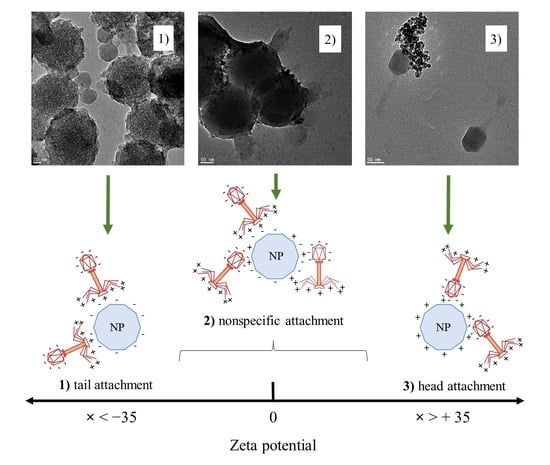
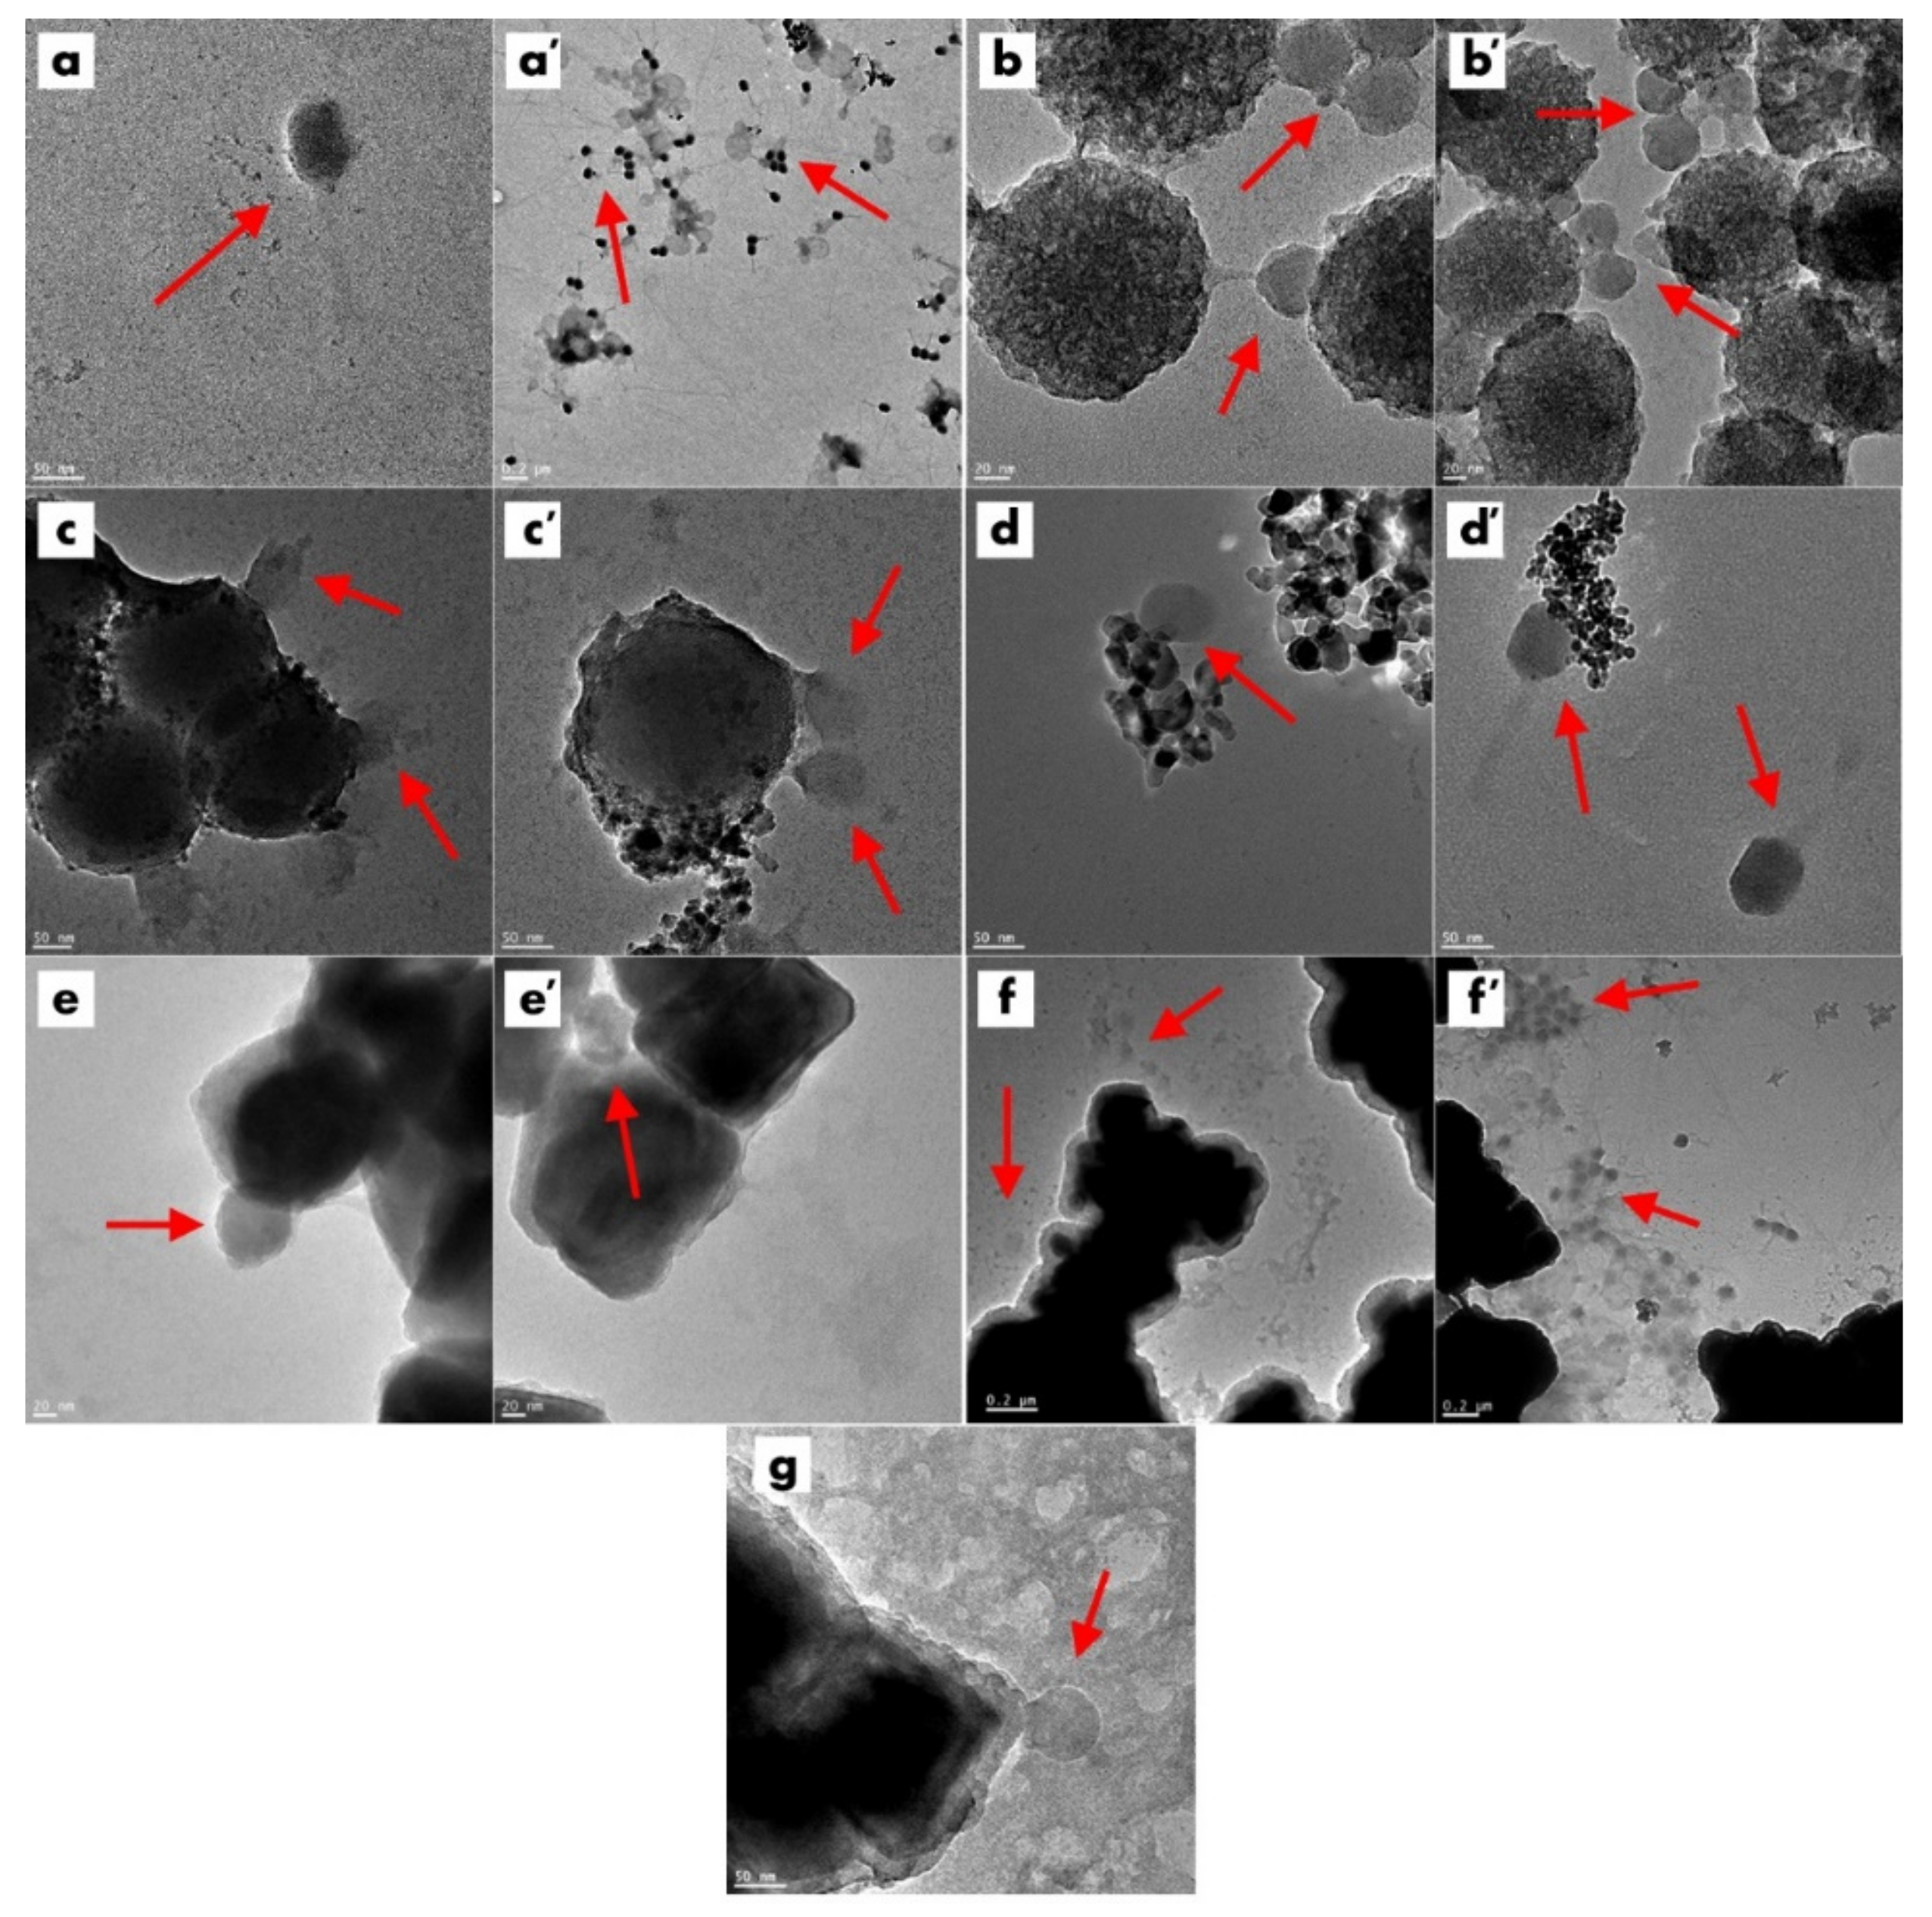
3.5. Visualization of Phage–Nanoparticle Interaction
4. Discussion
5. Conclusions
Supplementary Materials
Author Contributions
Funding
Institutional Review Board Statement
Informed Consent Statement
Data Availability Statement
Conflicts of Interest
References
- Sunderland, K.S.; Yang, M.; Mao, C. Phage-Enabled Nanomedicine: From Probes to Therapeutics in Precision Medicine. Angew. Chem. Int. Ed. 2017, 56, 1964–1992. [Google Scholar] [CrossRef] [Green Version]
- Abedon, S.T.; García, P.; Mullany, P.; Aminov, R. Editorial: Phage Therapy: Past, Present and Future. Front. Microbiol. 2017, 8, 981. [Google Scholar] [CrossRef] [PubMed] [Green Version]
- Stachurska, X.; Roszak, M.; Jabłońska, J.; Mizielińska, M.; Nawrotek, P. Double-Layer Agar (DLA) Modifications for the First Step of the Phage-Antibiotic Synergy (PAS) Identification. Antibiotics 2021, 10, 1306. [Google Scholar] [CrossRef] [PubMed]
- Chan, B.K.; Abedon, S.T.; Loc-Carrillo, C. Phage cocktails and the future of phage therapy. Future Microbiol. 2013, 8, 769–783. [Google Scholar] [CrossRef] [PubMed]
- Hatfull, G.F. Bacteriophage genomics. Curr. Opin. Microbiol. 2008, 5, 447–453. [Google Scholar] [CrossRef] [PubMed] [Green Version]
- Hendrix, R.W.; Hatfull, G.F.; Smith, M.C. Bacteriophages with tails: Chasing their origins and evolution. Res. Microbiol. 2003, 154, 253–257. [Google Scholar] [CrossRef]
- Paczesny, J.; Bielec, K. Application of Bacteriophages in Nanotechnology. Nanomaterials 2020, 10, 1944. [Google Scholar] [CrossRef]
- Nawrotek, P.; Stachurska, X.; Augustyniak, A. Perspektywiczne możliwości wykorzystania kombinacji działania bakteriofagów i nanomateriałów w zwalczaniu chorób bakteryjnych u zwierząt. Med. Weter. 2020, 76, 375–381. [Google Scholar] [CrossRef]
- You, J.; Zhang, Y.; Hu, Z. Bacteria and bacteriophage inactivation by silver and zinc oxide nanoparticles. Colloids Surf. B Biointerfaces 2011, 85, 161–167. [Google Scholar] [CrossRef]
- Stark, W.J. Nanoparticles in Biological Systems. Angew. Chem. Int. Ed. 2011, 50, 1242–1258. [Google Scholar] [CrossRef]
- Petros, R.A.; DeSimone, J.M. Strategies in the design of nanoparticles for therapeutic applications. Nat. Rev. Drug Discov. 2010, 9, 615–627. [Google Scholar] [CrossRef] [PubMed]
- Lewinski, N.; Colvin, V.; Drezek, R. Cytotoxicity of Nanoparticles. Small 2008, 4, 26–49. [Google Scholar] [CrossRef] [PubMed]
- Ravishankar, R.V.; Jamuna, B.A. Nanoparticles and their potential application as antimicrobials. In Science against Microbial Pathogens: Communicating Current Research and Technological Advances; Méndez-Vilas, A., Ed.; Microbiology Series No. 3; Formatex: Badajoz, Spain, 2011; Volume 1, p. 197. [Google Scholar]
- Dizaj, S.M.; Lotfipour, F.; Barzegar-Jalali, M.; Zarrintan, M.H.; Adibkia, K. Antimicrobial activity of the metals and metal oxide nanoparticles. Mater. Sci. Eng. C 2014, 44, 278–284. [Google Scholar] [CrossRef]
- Salata, O.C. Applications of nanoparticles in biology and medicine. J. Nanobiotechnology 2004, 2, 3. [Google Scholar] [CrossRef] [PubMed] [Green Version]
- Khan, I.; Saeed, K.; Khan, I. Nanoparticles: Properties, applications and toxicities. Arab. J. Chem. 2019, 12, 908–931. [Google Scholar] [CrossRef]
- Khan, R.H.; Ahmad, E.; Zaman, M.; Qadeer, A.; Rabbani, G. Nanoparticles in relation to peptide and protein aggregation. Int. J. Nanomed. 2014, 9, 899–912. [Google Scholar] [CrossRef] [Green Version]
- Hajipour, M.J.; Fromm, K.M.; Ashkarran, A.A.; de Aberasturi, D.J.; de Larramendi, I.R.; Rojo, T.; Serpooshan, V.; Parak, W.J.; Mahmoudi, M. Antibacterial properties of nanoparticles. Trends Biotechnol. 2012, 30, 499–511. [Google Scholar] [CrossRef] [Green Version]
- Moritz, M.; Geszke-Moritz, M. The newest achievements in synthesis, immobilization and practical applications of antibacterial nanoparticles. Chem. Eng. J. 2013, 228, 596–613. [Google Scholar] [CrossRef]
- Zhao, Y.; Chen, Z.; Chen, Y.; Xu, J.; Li, J.; Jiang, X. Synergy of Non-antibiotic Drugs and Pyrimidinethiol on Gold Nanoparticles against Superbugs. J. Am. Chem. Soc. 2013, 135, 12940–12943. [Google Scholar] [CrossRef]
- Comeau, A.M.; Tétart, F.; Trojet, S.N.; Prère, M.-F.; Krisch, H.M. Phage-Antibiotic Synergy (PAS): β-Lactam and Quinolone Antibiotics Stimulate Virulent Phage Growth. PLoS ONE 2007, 2, e799. [Google Scholar] [CrossRef] [Green Version]
- Karimi, M.; Mirshekari, H.; Basri, S.M.M.; Bahrami, S.; Moghoofei, M.; Hamblin, M.R. Bacteriophages and phage-inspired nanocarriers for targeted delivery of therapeutic cargos. Adv. Drug Deliv. Rev. 2016, 106, 45–62. [Google Scholar] [CrossRef] [Green Version]
- Scibilia, S.; Lentini, G.; Fazio, E.; Franco, D.; Neri, F.; Mezzasalma, A.M.; Guglielmino, S.P.P. Self-assembly of silver nanoparticles and bacteriophage. Sens. Bio-Sens. Res. 2016, 7, 146–152. [Google Scholar] [CrossRef] [Green Version]
- Kaikabo, A.A.; Mohammed, A.S.; Abas, F. Chitosan Nanoparticles as Carriers for the Delivery of ΦKAZ14 Bacteriophage for Oral Biological Control of Colibacillosis in Chickens. Molecules 2016, 21, 256. [Google Scholar] [CrossRef]
- Li, L.-L.; Yu, P.; Wang, X.; Yu, S.-S.; Mathieu, J.; Yu, H.-Q.; Alvarez, P.J.J. Enhanced biofilm penetration for microbial control by polyvalent phages conjugated with magnetic colloidal nanoparticle clusters (CNCs). Environ. Sci. Nano 2017, 4, 1817–1826. [Google Scholar] [CrossRef]
- Segall, A.M.; Roach, D.R.; Strathdee, S.A. Stronger together? Perspectives on phage-antibiotic synergy in clinical applications of phage therapy. Curr. Opin. Microbiol. 2019, 51, 46–50. [Google Scholar] [CrossRef]
- Tagliaferri, T.L.; Jansen, M.; Horz, H.-P. Fighting Pathogenic Bacteria on Two Fronts: Phages and Antibiotics as Combined Strategy. Front. Cell. Infect. Microbiol. 2019, 9, 22. [Google Scholar] [CrossRef]
- Akturk, E.; Oliveira, H.; Santos, S.B.; Costa, S.; Kuyumcu, S.; Melo, L.D.R.; Azeredo, J. Synergistic Action of Phage and Antibiotics: Parameters to Enhance the Killing Efficacy against Mono and Dual-Species Biofilms. Antibiotics 2019, 8, 103. [Google Scholar] [CrossRef] [Green Version]
- Mangalea, M.R.; Duerkop, B.A. Fitness Trade-Offs Resulting from Bacteriophage Resistance Potentiate Synergistic Antibacterial Strategies. Infect. Immun. 2020, 88, e00926-19. [Google Scholar] [CrossRef] [Green Version]
- Zhang, Q.-G.; Buckling, A. Phages limit the evolution of bacterial antibiotic resistance in experimental microcosms. Evol. Appl. 2012, 5, 575–582. [Google Scholar] [CrossRef]
- Dickey, J.; Perrot, V. Adjunct phage treatment enhances the effectiveness of low antibiotic concentration against Staphylococcus aureus biofilms in vitro. PLoS ONE 2019, 14, e0209390. [Google Scholar] [CrossRef] [Green Version]
- Jo, A.; Kim, J.; Ding, T.; Ahn, J. Role of phage-antibiotic combination in reducing antibiotic resistance in Staphylococcus aureus. Food Sci. Biotechnol. 2016, 25, 1211–1215. [Google Scholar] [CrossRef]
- Oechslin, F.; Piccardi, P.; Mancini, S.; Gabard, J.; Moreillon, P.; Entenza, J.M.; Resch, G.; Que, Y.-A. Synergistic interaction between phage therapy and antibiotics clears Pseudomonas aeruginosa infection in endocarditis and reduces virulence. J. Infect. Dis. 2017, 215, 703–712. [Google Scholar] [CrossRef] [Green Version]
- Hosseinidoust, Z.; Olsson, A.L.; Tufenkji, N. Going viral: Designing bioactive surfaces with bacteriophage. Colloids Surf. B 2014, 124, 2–16. [Google Scholar] [CrossRef]
- Appleyard, R.K. Segregation of new lysogenic types during growth of a doubly lysogenic strain derived from Escherichia coli K12. Genetics 1954, 39, 440–452. [Google Scholar] [CrossRef]
- Kropinski, A.M.; Mazzocco, A.; Waddell, T.E.; Lingohr, E.; Johnson, R.P. Enumeration of bacteriophages by double agar overlayplaque assay. In Bacteriophages. Methods in Molecular Biology; Clokie, M.R., Kropinski, A.M., Eds.; Humana Press: Totowa, NJ, USA, 2009; Volume 501, pp. 69–76. [Google Scholar]
- Cendrowski, K.; Sikora, P.; Zielinska, B.; Horszczaruk, E.; Mijowska, E. Chemical and thermal stability of core-shelled magnetite nanoparticles and solid silica. Appl. Surf. Sci. 2017, 407, 391–397. [Google Scholar] [CrossRef]
- Cendrowski, K. Titania/mesoporous silica nanotubes with efficient photocatalytic properties. Pol. J. Chem. Technol. 2018, 20, 103–108. [Google Scholar] [CrossRef] [Green Version]
- Augustyniak, A.; Cendrowski, K.; Nawrotek, P.; Barylak, M.; Mijowska, E. Investigating the Interaction between Streptomyces sp. and Titania/Silica Nanospheres. Water, Air, Soil Pollut. 2016, 227, 230. [Google Scholar] [CrossRef]
- Cendrowski, K.; Chen, X.; Zielinska, B.; Kalenczuk, R.J.; Rümmeli, M.H.; Büchner, B.; Klingeler, R.; Borowiak-Palen, E. Synthesis, characterization, and photocatalytic properties of core/shell mesoporous silica nanospheres supporting nanocrystalline titania. J. Nanoparticle Res. 2011, 13, 5899–5908. [Google Scholar] [CrossRef]
- Cendrowski, K.; Kukułka, W.; Wierzbicka, J.; Mijowska, E. The river water influence on cationic and anionic dyes collection by nickel foam with carbonized metal-organic frameworks and carbon nanotubes. J. Alloy. Compd. 2021, 876, 160093. [Google Scholar] [CrossRef]
- Cendrowski, K.; Peruzynska, M.; Markowska-Szczupak, A.; Chen, X.; Wajda, A.; Lapczuk, J.; Kurzawski, M.; Kalenczuk, R.J.; Drozdzik, M.; Mijowska, E. Mesoporous Silica Nanospheres Functionalized by TiO2 as a Photoactive Antibacterial Agent. J. Nanomed. Nanotechnol. 2013, 4, 182. [Google Scholar] [CrossRef] [Green Version]
- Ackermann, H.W. Phage classification and characterization. In Bacteriophages. Methods in Molecular Biology; Clokie, M.R., Kropinski, A.M., Eds.; Humana Press: Totowa, NJ, USA, 2009; Volume 501, pp. 127–140. [Google Scholar]
- Cao, B.; Xu, H.; Mao, C. Transmission electron microscopy as a tool to image bioinorganic nanohybrids: The case of phage-gold nanocomposites. Microsc. Res. Tech. 2011, 74, 627–635. [Google Scholar] [CrossRef] [Green Version]
- Merzlyak, A.; Lee, S.-W. Phage as templates for hybrid materials and mediators for nanomaterial synthesis. Curr. Opin. Chem. Biol. 2006, 10, 246–252. [Google Scholar] [CrossRef]
- You, F.; Yin, G.; Pu, X.; Li, Y.; Hu, Y.; Huang, Z.; Liao, X.; Yao, Y.; Chen, X. Biopanning and characterization of peptides with Fe3O4 nanoparticles-binding capability via phage display random peptide library technique. Colloids Surf. B 2016, 141, 537–545. [Google Scholar] [CrossRef]
- Peng, H.; Chen, I.A. Rapid Colorimetric Detection of Bacterial Species through the Capture of Gold Nanoparticles by Chimeric Phages. ACS Nano 2018, 13, 1244–1252. [Google Scholar] [CrossRef]
- Souza, G.R.; Christianson, D.R.; Staquicini, F.I.; Ozawa, M.G.; Snyder, E.Y.; Sidman, R.L.; Miller, J.H.; Arap, W.; Pasqualini, R. Networks of gold nanoparticles and bacteriophage as biological sensors and cell-targeting agents. Proc. Natl. Acad. Sci. USA 2006, 103, 1215–1220. [Google Scholar] [CrossRef] [Green Version]
- Handa, H.; Gurczynski, S.; Jackson, M.P.; Auner, G.; Walker, J.; Mao, G. Recognition of Salmonella typhimurium by immobilized phage P22 monolayers. Surf. Sci. 2008, 602, 1392–1400. [Google Scholar] [CrossRef] [Green Version]
- Balasubramanian, S.; Sorokulova, I.B.; Vodyanoy, V.J.; Simonian, A.L. Lytic phage as a specific and selective probe for detection of Staphylococcus aureus—A surface plasmon resonance spectroscopic study. Biosens. Bioelectron. 2007, 22, 948–955. [Google Scholar] [CrossRef]
- Richter, L.; Paszkowska, K.; Cendrowska, U.; Olgiati, F.; Silva, P.J.; Gasbarri, M.; Guven, Z.P.; Paczesny, J.; Stellacci, F. Broad-spectrum nanoparticles against bacteriophage infections. Nanoscale 2021, 13, 18684–18694. [Google Scholar] [CrossRef]
- Gottschalk, F.; Sun, T.; Nowack, B. Environmental concentrations of engineered nanomaterials: Review of modeling and analytical studies. Environ. Pollut. 2013, 181, 287–300. [Google Scholar] [CrossRef]
- Grygorcewicz, B.; Rakoczy, R.; Roszak, M.; Konopacki, M.; Kordas, M.; Piegat, A.; Serwin, N.; Cecerska-Heryć, E.; El Fray, M.; Dołęgowska, B. Rotating Magnetic Field-Assisted Reactor Enhances Mechanisms of Phage Adsorption on Bacterial Cell Surface. Curr. Issues Mol. Biol. 2022, 44, 1316–1325. [Google Scholar] [CrossRef]
- Anany, H.; Chen, W.; Pelton, R.; Griffiths, M.W. Biocontrol of Listeria monocytogenes and Escherichia coli O157:H7 in Meat by Using Phages Immobilized on Modified Cellulose Membranes. Appl. Environ. Microbiol. 2011, 77, 6379–6387. [Google Scholar] [CrossRef] [Green Version]
- Cademartiri, R.; Anany, H.; Gross, I.; Bhayania, R.; Griffiths, M.; Brook, M.A. Immobilization of bacteriophages on modified silica particles. Biomaterials 2010, 31, 1904–1910. [Google Scholar] [CrossRef]
- Khan, M.F.; Dong, H.; Chen, Y.; Brook, M.A. Low Discrimination of Charged Silica Particles at T4 Phage Surfaces. Biosens. J. 2015, 4, 125. [Google Scholar] [CrossRef] [Green Version]
- Gilcrease, E.; Williams, R.; Goel, R. Evaluating the effect of silver nanoparticles on bacteriophage lytic infection cycle-a mechanistic understanding. Water Res. 2020, 181, 115900. [Google Scholar] [CrossRef]


| Material Type | Material Abbreviation | Zeta Potential [mV] |
|---|---|---|
| Silica nanospheres | SiO2 | −51 ± 0.3 |
| Meosporous silica nanospheres completed with titanium dioxide | TiO2-SiO2 | −25 ± 0.4 |
| Titanium dioxide | TiO2 | 36.5 ± 6 |
| Iron oxide nanocubes | Fe3O4 | −1.1 ± 1 |
| Iron oxide nanocubes covered with silica shell | Fe3O4-SiO2 | −37.6 ± 0.6 |
| Iron oxide nanocubes covered with mesoporous silica shell completed with titanium dioxide | SiO2-Fe3O4-TiO2 | −19.5 ± 0.2 |
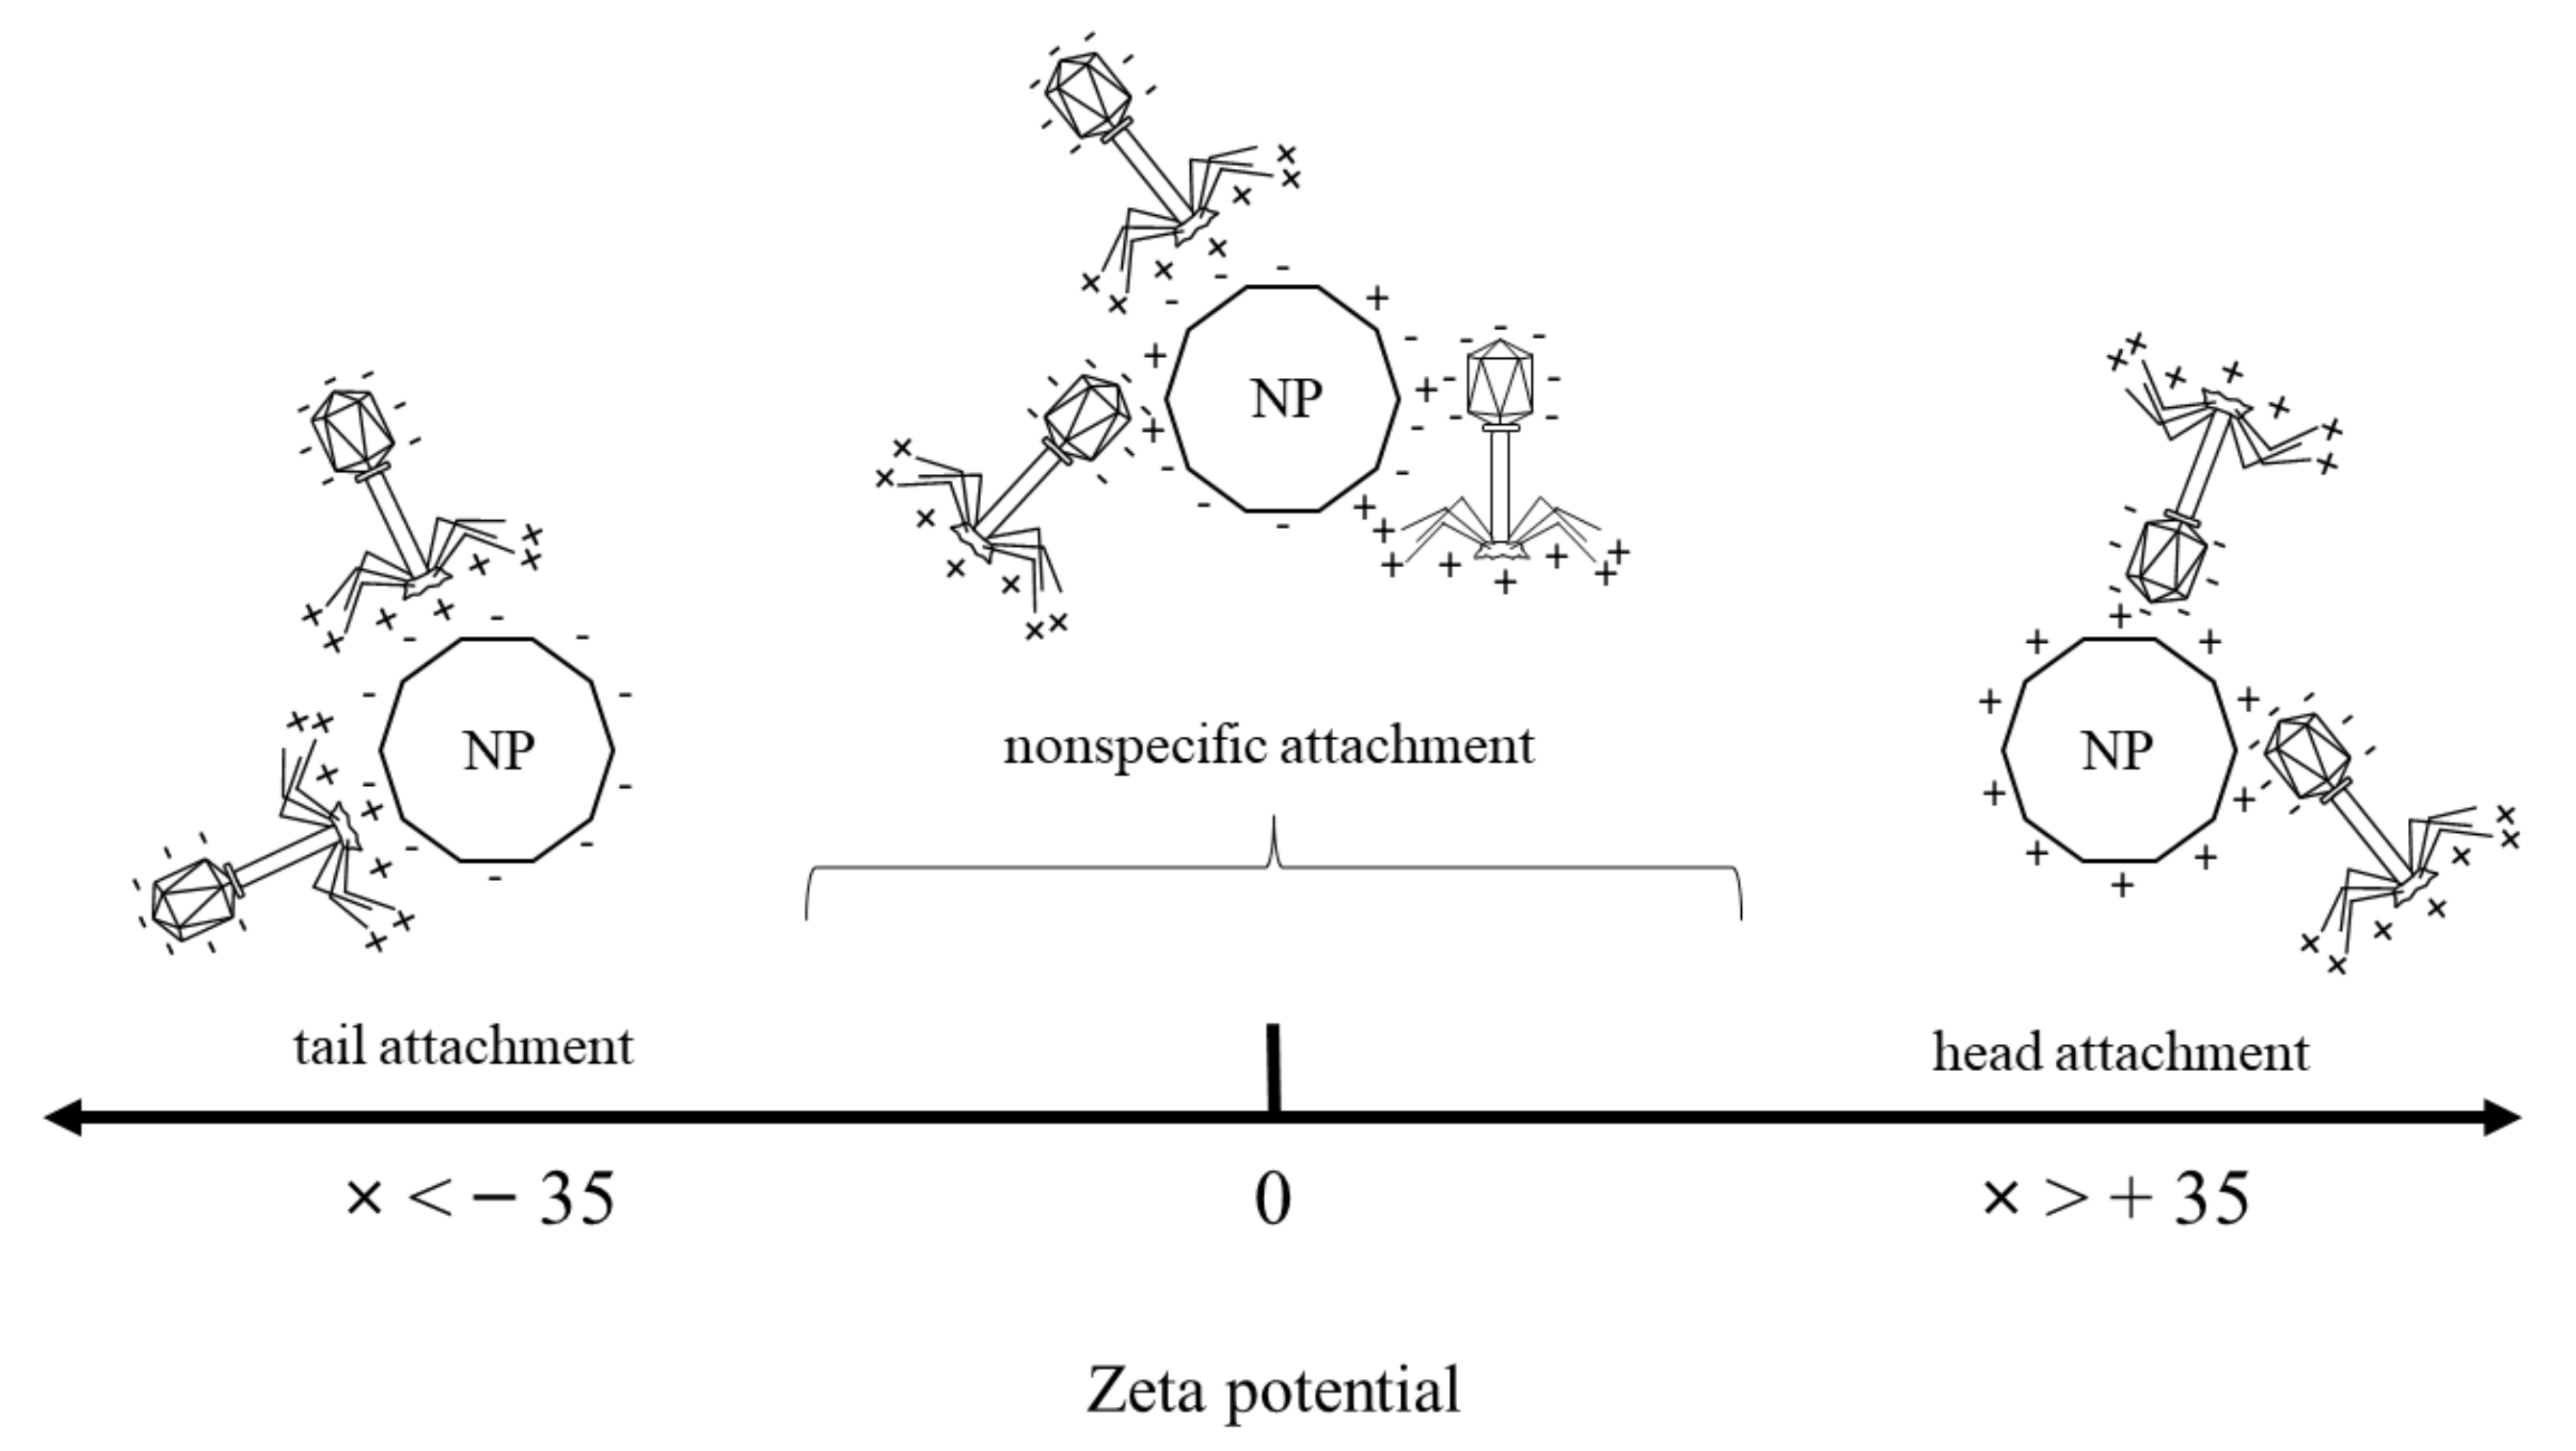
| Nanomaterial | Concentration [mg/mL] | Zeta Potential [mV] | Phage Plaque-Forming Ability at t = 0 h | Phage Plaque-Forming Ability at t = 60 h | Phage Lytic Performance after 240 min | Phage Progeny Boost Time | Phage Progeny Titer [PFU/mL] | Phage Attachment |
|---|---|---|---|---|---|---|---|---|
| SiO2 | 0.5 | −51 ± 0.3 | Visibly reduced | Visibly reduced | Decreased | From 12 min | 2.22 × 10⁷ | Tail |
| 0.1 | Partial | Partial | Decreased | From 12 min | 2.84 × 10⁷ | |||
| 0.05 | Partial | Full | Decreased | From 12 min | 2.52 × 10⁷ | |||
| SiO2-TiO2 | 0.5 | −25 ± 0.4 | Full | Visibly reduced | Increased | From 10 min | 2.06 × 10⁷ | Nonspecific |
| 0.1 | Full | Partial | Increased | From 10 min | 1.99 × 10⁷ | |||
| 0.05 | Full | Full | Increased | From 12 min | 2.06 × 10⁷ | |||
| TiO2 | 0.5 | 36.5 ± 6 | Full | Full | Increased | From 12 min | 1.59 × 10⁷ | Head |
| 0.1 | Partial | Full | Increased | From 12 min | 2.29 × 10⁷ | |||
| 0.05 | Visibly reduced | Partial | Increased | From 12 min | 2.1 × 10⁷ | |||
| Fe3O4 | 0.5 | −1.1 ± 1 | Partial | Full | Increased | From 12 min | 1.7 × 10⁷ | Nonspecific |
| 0.1 | Partial | Full | Increased | From 12 min | 9.22 × 10⁶ | |||
| 0.05 | Partial | Full | Increased | From 14 min | 1.94 × 10⁷ | |||
| Fe3O4-SiO2 | 0.5 | −37.6 ± 0.6 | Partial | Full | Decreased | From 10 min | 2.79 × 10⁷ | Tail |
| 0.1 | Partial | Full | Decreased | After 16 min | 2.76 × 10⁶ | |||
| 0.05 | Partial | Full | Decreased | From 10 min | 3.37 × 10⁷ | |||
| Fe3O4-SiO2-TiO2 | 0.5 | −19.5 ± 0.2 | Partial | Full | Increased | From 10 min | 1.91 × 10⁷ | Nonspecific |
| 0.1 | Full | Full | Increased | From 12 min | 1.24 × 10⁷ | |||
| 0.05 | Full | Full | Increased | From 12 min | 1.86 × 10⁷ |
Publisher’s Note: MDPI stays neutral with regard to jurisdictional claims in published maps and institutional affiliations. |
© 2022 by the authors. Licensee MDPI, Basel, Switzerland. This article is an open access article distributed under the terms and conditions of the Creative Commons Attribution (CC BY) license (https://creativecommons.org/licenses/by/4.0/).
Share and Cite
Stachurska, X.; Cendrowski, K.; Pachnowska, K.; Piegat, A.; Mijowska, E.; Nawrotek, P. Nanoparticles Influence Lytic Phage T4-like Performance In Vitro. Int. J. Mol. Sci. 2022, 23, 7179. https://doi.org/10.3390/ijms23137179
Stachurska X, Cendrowski K, Pachnowska K, Piegat A, Mijowska E, Nawrotek P. Nanoparticles Influence Lytic Phage T4-like Performance In Vitro. International Journal of Molecular Sciences. 2022; 23(13):7179. https://doi.org/10.3390/ijms23137179
Chicago/Turabian StyleStachurska, Xymena, Krzysztof Cendrowski, Kamila Pachnowska, Agnieszka Piegat, Ewa Mijowska, and Paweł Nawrotek. 2022. "Nanoparticles Influence Lytic Phage T4-like Performance In Vitro" International Journal of Molecular Sciences 23, no. 13: 7179. https://doi.org/10.3390/ijms23137179