
RclS Sensor Kinase Modulates Virulence of Pseudomonas capeferrum
by
 and
and
Katarina Novović
1,*, 
Milka Malešević
1,
Miroslav Dinić
1,
Lazar Gardijan
1,
Milan Kojić
1 and
Branko Jovčić
1,2 1
Institute of Molecular Genetics and Genetic Engineering, University of Belgrade, Vojvode Stepe 444a, 11042 Belgrade, Serbia
2
Faculty of Biology, University of Belgrade, Studentski Trg 16, 11000 Belgrade, Serbia
*
Author to whom correspondence should be addressed.
Int. J. Mol. Sci. 2022, 23(15), 8232; https://doi.org/10.3390/ijms23158232
Submission received: 16 June 2022
/
Revised: 18 July 2022
/
Accepted: 20 July 2022
/
Published: 26 July 2022
(This article belongs to the Special Issue Host-Microbe Interaction 3.0)
Abstract
:Signal transduction systems are the key players of bacterial adaptation and survival. The orthodox two-component signal transduction systems perceive diverse environmental stimuli and their regulatory response leads to cellular changes. Although rarely described, the unorthodox three-component systems are also implemented in the regulation of major bacterial behavior such as the virulence of clinically relevant pathogen P. aeruginosa. Previously, we described a novel three-component system in P. capeferrum WCS358 (RclSAR) where the sensor kinase RclS stimulates the intI1 transcription in stationary growth phase. In this study, using rclS knock-out mutant, we identified RclSAR regulon in P. capeferrum WCS358. The RNA sequencing revealed that activity of RclSAR signal transduction system is growth phase dependent with more pronounced regulatory potential in early stages of growth. Transcriptional analysis emphasized the role of RclSAR in global regulation and indicated the involvement of this system in regulation of diverse cellular activities such as RNA binding and metabolic and biocontrol processes. Importantly, phenotypic comparison of WCS358 wild type and ΔrclS mutant showed that RclS sensor kinase contributes to modulation of antibiotic resistance, production of AHLs and siderophore as well as host cell adherence and cytotoxicity. Finally, we proposed the improved model of interplay between RclSAR, RpoS and LasIR regulatory systems in P. capeferrum WCS358.
1. Introduction
Signal transduction systems are the eyes and ears of bacterial cells that perceive diverse extracellular stimuli and enable the adequate cellular response [1]. Bacterial cells are in continuous struggle with dynamic changes in the environment; thus both sensing of fluctuating signals and adequate and fast response are crucial for surviving and thriving of the bacterial cell [1]. The most common form of bacterial signal transduction systems is the two-component system (TCS) consisting of the membrane-associated sensor histidine kinase and its cognate cytoplasmic response regulator, which is usually the activator of gene transcription [1]. In addition, some response regulators are the effectors that interact with RNAs or proteins or even have an enzymatic activity [2]. Response regulators with enzymatic effector domains are commonly involved in the intracellular level regulation of key cellular alarmons (e.g., c-di-GMP) [3].
Three-component signal transduction systems are less frequent and comprise the sensor kinase and two cognate response regulators containing domains that enable DNA-binding and enzymatic functions [3,4,5,6,7]. The interconnection of three-component systems members is achieved on transcriptional and post-translational levels [4,5,6,7]. Although DNA-binding response regulators of three-component systems could stimulate the transcription of genes encoding the response regulators with enzymatic effector domains, these pair of regulators could also manifest the antagonistic activities (e.g., RocA1/RocR and BvgA/BvgR) [4,5]. So far, the involvement of these signal transduction systems in virulence regulation was described in pathogens such as Pseudomonas aeruginosa (RocS1A1R) [5], Bordetella pertussis (BvgAS/R) [4] and Shewanella putrefaciens (LrbS-LrbA-LrbR) [6].
Furthermore, the interconnection of various signal transduction pathways is required for some cellular processes, enabling the modulation of cell behavior in the most appropriate manner [3]. In addition, variation in stoichiometry, domain organization and cellular localization of sensor kinases contributes to the complexity of the signaling network [2].
Pseudomonas spp. is a nutritionally and metabolically versatile bacteria well adapted to wide range of ecological niches [8]. The successful adaptation of Pseudomonas spp. to fluctuating environmental conditions is mediated by numerous regulatory networks [1,9]. The signal transduction systems of genus Pseudomonas were best characterized in the opportunistic pathogen P. aeruginosa. Previous studies have shown that in P. aeruginosa signal transduction systems play a significant role in the regulation of virulence, including the biofilm formation, different types of motility, iron acquisition, production of fimbriae adhesins and type III secretion system, and in antibiotic resistance to aminoglycosides, carbapenems and polymyxins. Integrated complex signal transduction networks (two-, three- and multi-component systems) provide the quick and fine-tuned response of P. aeruginosa to changes in conditions within the host or in the environment [1,3,5,9,10]. The signal transduction systems are of importance for other representatives of genus Pseudomonas as well. In species P. putida TCS ColRS regulates not only the tolerance to phenol and different metals (zinc, iron, manganese and cadmium) [11,12], but also the Tn4652 transposition during starvation [13]. Further, the regulatory role of TCS CzcRS in heavy metal resistance [14], RoxSR in redox signaling, plant colonization and organic molecule metabolism [15] as well as positive regulation of quorum sensing (QS) by GacA-GacS system was also reported [16]. In our previous study, the three-component system in P. putida WCS358 (RclSAR), in which sensor kinase RclS stimulates the intI1 transcription in stationary growth phase, was described for the first time [7]. Apparently, this regulation appears to be rather indirect, at least through the expression regulation of stationary-phase alternative sigma factor RpoS [7].
In the present study, we identified the regulon of RclSAR system in Pseudomonas capeferrum WCS358 (previously known as P. putida WCS358 [17]) using ΔrclS mutant. RNA sequencing revealed the growth phase dependance of RclSAR signal transduction system activity as well as the regulation of diverse cellular activities such as RNA binding and metabolic and biocontrol processes by this signal transduction system. In addition, the virulence functions and resistance to antibiotics could be attributed to RclS regulon, directly or indirectly. Finally, we improved the interconnection model of the regulatory systems in P. capeferrum WCS358 previously proposed by Bertani and Venturi (2004) [16].
2. Results
2.1. RNA Sequencing and Mapping to the Reference Genome
In this study, the total RNA samples of the WCS358 wild type and ΔrclS mutant from the exponential (wt1 and mut1) and stationary growth phase (wt2 and mut2) were used for cDNA library preparation. Constructed cDNA libraries were subjected to Illumina sequencing and the obtained results are summarized in Table 1. The raw reads ranged between samples from 7,978,294 to 11,921,075, while after quality filtering clean data varied from 7,940,628 to 11,895,759 of reads. Since the base accuracy parameters Q20 and Q30 were over 98% and 95% for each library, respectively, the quality of the sequencing data was sufficient for further analysis. Additionally, the GC content ranged from 55.73% to 60.96%. The aligning of clean reads against genome of P. capeferrum WCS358 revealed that at least 97.84% reads were mapped. Uniquely mapped reads accounted for 96.27% to 98.41% of the total mapped reads (Table 1).
2.2. Gene Co-Expression and Differentially Expressed Genes (DEGs) Analysis
The gene expression level of the tested samples was estimated by counting the reads that were mapped to the genes of the reference genome. Thereafter, the FPKM value of each gene was determined based on the length of the gene and sequencing depth and used as the final parameter of gene expression. Venn diagrams were constructed for visualization of the co-expressed and uniquely expressed genes in WCS358 wild type and ΔrclS mutant during the exponential and stationary phase of growth (Figure 1). We found the transcripts of 5261 and 5229 genes expressed in both strains throughout the exponential and stationary growth phase, respectively (Figure 1A,B). A number of uniquely expressed genes in WCS358 wild type was 24 and in ΔrclS mutant was 36 in the exponential phase of growth, while was 30 and 58 for wild type and ΔrclS mutant in the stationary growth phase, respectively. In addition, the co-expression of 5200 genes was determined in wild type and ΔrclS mutant strains in the exponential and stationary growth phase (Figure 1C).
Further, we examined differentially expressed genes (DEGs) comparing the WCS358 wild type and ΔrclS mutant using a fold change > 2 and corrected p value of 0.005 as the parameters of significance. A total of 1591 genes were identified as DEGs in the exponential growth phase, while the number of DEGs in the stationary growth phase was 574 (Figure S1). The number of up-regulated genes in ΔrclS mutant in the exponential (822) and stationary (384) growth phase was higher than the down-regulated genes in the exponential (769) and stationary (190) growth phase (Figure S1). Hierarchical clustering of DEGs in the wild type and ΔrclS mutant at the chosen two time points of growth revealed differential DEG expression profiles of wild type and ΔrclS mutant, with more prominent variation observed in the exponential growth phase (Figure 2). The lists of significant DEGs in ΔrclS mutant compared to wild type in the exponential and stationary growth phase are presented in Tables S1 and S2, respectively.
2.3. GO and KEGG Enrichment Analysis of DEGs
The Gene Ontology (GO) enrichment analysis was performed to attribute the biological functions of detected DEGs. This analysis enabled categorization of DEGs into three GO groups: biological processes (BP), cellular components (CC) and molecular functions (MF). Figure 3 summarizes results obtained for all three GO categories (top 20 enriched GO terms). The highest number of DEGs in exponential growth phase was found to be involved in ion binding (n = 266), small molecule metabolic process (n = 154) and transmembrane transporter activity (n = 87), but after correction of p value only the RNA binding (MF) and small molecule metabolic process (BP) were recognized as statistically significant (Figure 3A). During the stationary phase of growth, neither of the detected functions were significant, but the transmembrane transport counted by far the largest number of DEGs (n = 93) (Figure 3B).
The identification of pathways regulated by sensor kinase RclS was performed using KEGG (Kyoto Encyclopedia of Genes and Genomes) enrichment analysis. The 20 most significantly enriched pathways in the exponential and stationary phase of growth are shown in Figure 4. In the exponential growth phase 10 KEGG pathways (metabolic pathways, oxidative phosphorylation, microbial metabolism in diverse environments, biosynthesis of antibiotics, biosynthesis of secondary metabolites, purine metabolism, citrate cycle-TCA cycle, pyrimidine metabolism, alanine, aspartate and glutamate metabolism, carbon metabolism) were recognized as statistically significant (Figure 4A), while in the stationary growth phase only bacterial secretion system and aminobenzoate degradation showed corrected p value less than 0.05 (Figure 4B).
2.4. Validation of RNA Sequencing Using RT-qPCR
In order to confirm RNA-seq reliability, the mRNA levels transcribed from eight selected genes (bepC1, mdtB1, ptlH, lgrD, ddaF, rsaL, lasI and lasR) were determined by RT-qPCR. The expression trend (up- and down-regulation) of the selected genes was comparable to those obtained from the RNA sequencing, indicating that our transcriptome analysis was valid (Figure 5). The only significant inconsistency was observed for the lasI gene mRNA levels during the exponential growth phase. The observed variations in gene expression intensity between RNA-seq and RT-qPCR could be rooted within the different sensitivity of the two methods applied here.
2.5. Antimicrobial Susceptibility of WCS358 Wild Type and ΔrclS Mutant
The differences in the susceptibility of WCS358 wild type and ΔrclS mutant to clinically relevant antimicrobials were determined, thus indicating the potential role of sensor kinase RclS in regulation of resistance to members of the different antibiotic classes (ceftazidime, gentamicin, novobiocin, levofloxacine and tetracycline) (Table 2). The results revealed that ΔrclS mutant had increased susceptibility to gentamicin, novobiocin, levofloxacine and tetracycline, and decreased susceptibility to ceftazidime compared to the wild type. MIC values for the ampicillin, chloramphenicol and erythromycin did not differ when wild type and ΔrclS mutant were compared.
2.6. AHLs, Pseudobactin 358 and Biofilm Production of WCS358 Wild Type and ΔrclS Mutant
In order to compare the production of the quorum sensing (QS) signaling molecules (N-acyl-homoserine lactones, AHLs) between WCS358 wild type and ΔrclS mutant, fluorescence detection assay was performed. Reporter strain P. putida F117 (pKR-C12) was used for the detection of 3-oxo-C12-HSL and 3-oxo-C10-HSL. The obtained results indicted a significant decrease of AHLs production in ΔrclS mutant (approximately 4.5 times, **** p < 0.0001) relative to the wild type (Figure 6A). In contrast, the calculation of molar concentration of pseudobactin 358 from the wild type and ΔrclS revealed that the production of this siderophore was elevated in ΔrclS mutant by 17.7% (*** p < 0.001). Further, the statistically significant difference in biofilm formation was not observed between the wild type and ΔrclS mutant after 24 and 48 h (Figure 6B).
2.7. Cytotoxic Effect and Adhesion Ability of WCS358 Wild Type and ΔrclS Mutant
In order to reveal the pathogenic potential of WCS358 and role of the RclS sensor kinase in that phenotype, the cytotoxic effect and the ability of adhesion to the host cells were investigated in WCS358 wild type and ΔrclS mutant using the HaCaT keratinocyte cell line. Lactate dehydrogenase (LDH) assay revealed significant increase in the cytotoxic potential of ΔrclS mutant comparing to the wild type (approximately 2.3 times), although WCS358 wild type also had significant cytotoxic effect relative to negative control (Figure 7A). The adhesion assay showed that both WCS358 wild type and ΔrclS mutant have low adhesion ability to HaCaT keratinocyte cell line (<0.1%). However, it was notable that ΔrclS mutant have significantly increased adhesion capability relative to wild type (3.57 times) (Figure 7B).
3. Discussion
The rapid and appropriate physiological response to fluctuating environmental conditions has been recognized as a key factor of bacterial cell adaptation and survival [1]. Signal transduction systems are the major players in this process enabling sensing of diverse environmental stimuli and response through regulating cellular changes [2]. Virulence and antibiotic resistance of clinically important pathogens are also regulated through the signal transduction systems resulting in the recognition of these systems as potential novel antimicrobial targets [1,9,18].
The outstanding metabolic versatility and adaptability of pseudomonads to changing habitats pinpointed these bacteria as attractive models for signal transduction system research [1,9]. Although signal transduction systems of P. aeruginosa are the best characterized due to their clinical relevance, P. putida was also subject of this type of study. Since P. putida is typically soil and/or aquatic bacterium, the focus of the research was on TCSs enabling tolerance to pollutants and plant colonization [11,12,14,15,19]. Albeit rarely, P. putida could also cause different types of infections in human beings [20,21,22]. Of special importance was often described multidrug-resistant phenotype of these isolates [20,21,22], while the pathogenic potential was isolate-specific [23]. Additionally, P. putida has been recognized as a potential reservoir of antibiotic resistance determinants that could be transferred to more successful clinical pathogens [24]. As aforementioned, our previous study investigated the regulation of the intI1 gene transcription, since integrase class 1 performs a key role in dissemination of antibiotic resistance cassettes located on integrons [7]. We observed that RclS sensor kinase, a member of the RclSAR three-component system, has been characterized as the activator of the intI1 transcription in the stationary phase of growth in P. putida WCS358 (now P. capeferrum WCS358) [7]. Since this was the first described three-component system in P. capeferrum, the RNA sequencing was employed to determine the potential regulon of RclSAR system, and to examine the growth phase dependence of regulon expression. This work showed the significant change in the number of uniquely expressed genes in ΔrclS mutant compared to the wild type underlying the importance of RclS signal pathway not only for fine tuning of expression, but also for the ON/OFF general expression regulation. Further, the results obtained from DEG analysis indicate that the regulatory potential of the signal transduction system starting with RclS sensor kinase on gene expression is more pronounced in the early rather than the late stages of growth, with a more prominent activation of gene transcription in ΔrclS mutant strain. The results of this study indicate that the regulation mediated by RclS was growth phase dependent. The growth phase dependent variation in activity and expression of TCSs was previously described as well [25,26]. Although speculative, the more pronounced up-regulation of gene transcription in ΔrclS strain could be explained through the elevated level of DNA-binding response regulator RclA in mutant strain and consequential activation of target genes [7]. GO enrichment analysis, a method for defining biological functions of detected DEGs, revealed that RclS sensor kinase is included in the regulation of DEGs classified in RNA binding GO term. This observation is of special importance because it leads to the conclusion that RclS sensor kinase, besides regulation on transcriptional level, could potentially act as a post-transcriptional regulator of gene expression. Moreover, the detection of pathways regulated by RclS indicates its contribution to the diverse metabolic and biocontrol processes regulation in the exponential phase of growth. As noted in this study, the regulation of amino acid, nucleotide and carbon metabolism mediated by TCS was described in previous studies. This phenomenon has been observed in important pathogens such as Bacillus anthracis (WalRK) [27] and uropathogenic (KguS/KguR) [28] and enterohemorrhagic Escherichia coli (QseBC) [29]. Moreover, Sonawane and colleagues (2006) [30] reported the involvement of AauR-AauS TCS in uptake and metabolism of acidic amino acids in P. putida KT2440. The assumed RclS role in antibiotic production regulation is not a single example of signal transduction system involvement in the modulation of antibiotic biosynthesis. In various antibiotic producers, predominantly members of the genus Streptomyces, diverse TCSs control the biosynthesis of secondary metabolites, including antibiotics [31]. For example, in actinomycetes Nonomuraea gerenzanensis and Saccharopolyspora erythraea (formerly known as Streptomyces erythraeus) TCS negatively regulates the production of glycopeptide A40926 and erythromycin, respectively [32,33]. Besides mapping the RclS regulon genes by transcriptome analysis, our aim was the phenotypic determination of RclS sensor kinase influence on the pathogenic potential of P. capeferrum WCS358. From one side, the obtained results hinted that RclS leads to an elevated resistance to the members of the different antibiotic classes (aminocoumarins, aminoglycosides, fluorohinolones and tetracyclines), while resistance to β-lactam ceftazidime was suppressed. Similarly, as shown in this study, P. aeruginosa isolates containing mutations in the pmrB gene, the gene encoding for sensor kinase PmrB, were more susceptible to various antibiotics (e.g., ciprofloxacin and gentamicin) [34]. Contrary to that, inactivation of the gluS and gluR genes provided resistance to β-lactams in Burkholderia glumae [35]. On the other hand, we investigated the impact of RclS mediated signal transduction pathway to virulence of WCS358. Since AHL-dependent QS regulates bacterial virulence, and TCSs could regulate its expression [16], we monitored AHLs production in WCS358 wild type and ΔrclS mutant. The production of AHLs has been significantly decreased in ΔrclS mutant indicating positive regulation of QS system mediated by RclS sensor kinase. In agreement with this, RNA-seq and RT-qPCR confirmed that mRNA levels of AHLs synthase LasI and regulator LasR were reduced in the mutant strain during the stationary phase of growth independently of its repressor RsaL mRNA levels (Figure 5). Similar to the noted interconnection of the three global regulatory systems (GacA-GacS TCS, RpoS and PpuIR QS) described by Bertani and Venturi (2004) [16], we observed a close link among RclS sensor kinase, RpoS and LasIR (PpuIR) QS system [7]. Accordingly, we proposed the improved interconnection model of regulatory systems in P. capeferrum WCS358 designated by Bertani and Venturi (2004) [16] (Figure 8). In contrast to the commonly described role of QS in biofilm formation, in WCS358 the absence of AHL production caused by the lasI (ppuI) gene mutagenesis did not affect biofilm formation [36]. Our result that showed no difference between WCS358 wild type and ΔrclS mutant in biofilm formation supports this observation. The statistically significant increase of pseudobactin 358 production in ΔrclS mutant indicates the negative regulation of its production mediated by sensor kinase RclS. Previously, the role of FleS/FleR TCS in siderophore biosynthesis regulation in P. aeruginosa was described [37]. Moreover, this TCS regulates the secretion systems in P. aeruginosa [37], and a similar result has been obtained by KEGG analysis for RclSAR system of WCS358 in the stationary phase of growth. This observation, as well as the results obtained from the cytotoxicity and adhesion tests performed on the keratinocyte cell line, indicates the role of RclS in P. capeferrum WCS358 virulence potential. Although P. capeferrum WCS358 was known as a plant-beneficial strain, it is also recognized as a causative agent of skin infection [17]. Thus, RclS sensor kinase could act as a silencer of pathogenic behavior. Similar to our results, Bricio-Moreno and colleagues (2018) [34] reported that P. aeruginosa isolates with mutation in the pmrB gene of TCS showed increased adherence to airway epithelial cells. Additionally, the pmrB gene mutation enhanced the persistence of the described isolates in the murine lungs [38]. Furthermore, the potential role of the response regulator RclR with phosphodiesterase activity in WCS358 virulence should not be neglected [7]. Thus, RclR could affect WCS358 virulence indirectly, through the degradation of c-di-GMP, a second messenger involved in the regulation of bacterial virulence. A recent study summarizing the contribution of c-di-GMP in bacterial virulence revealed that the role of this second messenger is specific for each pathogen, strain as well as type of infection [39]. Above all, the possibility that RclSAR three-component system could cross-talk with other signal transduction pathways in P. capeferrum WCS358 and consequently be involved in the complex regulation of the cellular processes remains open, as previously was noticed for other signal transduction systems [40].
4. Materials and Methods
4.1. Bacterial Strains and Chemicals
Strains P. capeferrum WCS358 (formerly P. putida WCS358) wild type and P. capeferrum WCS358 ΔrclS mutant with inactivated gene encoding RclS sensor kinase [7] were used in this study. Biosensor strain P. putida F117 was used for AHL detection [41]. AHLs N-3-oxodecanoyl-L-homoserine lactone (3-oxo-C10-HSL) and N-3-oxododecanoyl-L-homoserine lactone (3-oxo-C12-HSL) were purchased from Sigma-Aldrich. AHL stock solutions (0.5 mM) were prepared in dimethyl sulfoxide (DMSO) and stored at −20 °C for biological assays.
4.2. RNA Extraction and Sequencing
P. capeferrum WCS358 wild type and ΔrclS mutant were incubated in cation-adjusted Mueller Hinton (caMH) medium at 30 °C with aeration until reaching OD600 value of 1 and 2 (Plate Reader Infinite 200 pro, MTX Lab Systems, Midland, ON, Canada). RNA extraction from collected bacterial cells was performed using RNeasy Mini Kit (Qiagen, Hilden, Germany), with a modified lysis step [42]. AmbionDNAfree Kit (Thermo Fisher Scientific, Waltham, MA, USA) was used for DNase I treatment. The total RNA concentration and purity was determined with NanoPhotometer spectrophotometer (IMPLEN, München, Germany), while RNA integrity was confirmed using Agilent 2100 Bioanalyzer (Agilent Technologies, Santa Clara, CA, USA). After cDNA library construction, the sequencing was performed using Illumina platform. The cDNA library preparation and RNA-seq was carried out by Novogene Bioinformatics Technology Co., Ltd., Beijing, China.
4.3. Data Analysis
The raw reads were filtered to remove low quality reads and reads containing adapters and poly-N sequences. Further, the clean reads were used for calculating Q20, Q30 and GC content. Moreover, clean reads were aligned to genome of P. capeferrum WCS358 strain that was used for RNA isolation in this work (JAKNRD000000000) by Bowtie2 [43]. HTseq was applied to count the number of reads mapped to each gene and FPKM (Fragments PerKilobase of transcript sequence per Millions base pairs sequenced) value of each gene was determined based on the length of the gene and sequencing depth. For co-expression analysis, the threshold of the FPKM value was set to 0.3. Differential expression analysis of wild type and mutant strain was assessed using DEGSeq R package, while p values were adjusted according to Benjamini & Hochberg method. The genes expressed with a fold change > 2 and corrected p value of 0.005 were considered as significant differentially expressed genes (DEGs). Heat map was employed to cluster DEGs detected in wild type and ΔrclS mutant in exponential and stationary phase of growth.
4.4. GO and KEGG Enrichment Analysis
The GO (http://www.geneontology.org/, accessed on 1 April 2019) enrichment analysis of DEGs was applied using GOseq R package, in which the correction of gene length bias was performed. The alternations in certain metabolic or signal transduction pathways in the mutant strain relative to the wild type were determined using KEGG (http://www.genome.jp/kegg/, accessed on 1 April 2019) enrichment analysis. KOBAS software was used for testing the statistical enrichment of DEGs in KEGG pathways. GO and KEGG terms with corrected p < 0.05 were considered significantly enriched by DEGs.
4.5. Real Time Quantitative PCR (RT-qPCR) Analysis
The validating of the transcriptome sequencing analysis was performed by means of RT-qPCR for eight selected genes. After RNA isolation and DNase I treatment, reverse transcription was done with a RevertAidRT Reverse Transcription Kit (Thermo Fisher Scientific) according to the manufacturer’sprotocol. Primers used for RT-qPCR are listed in Table S3. RT-qPCR was carried out with a FastGene 2x IC Green Universal ROX (Nippon Genetics Europe GmbH, Düren, Germany) in a 7500 RealTime PCR System thermocycler (Applied Biosystems, Thermo Fischer Scientific). Thermal conditions comprised an initial denaturation at 95 °C for 2 min, 40 cycles at 95 °C for 5 s and 60 °C for 32 s. Normalization was performed against the rpoD gene using the 2−ΔΔCT method (relative) [44]. The values obtained for ΔrclS mutant were then normalized against those acquired for WCS358 wild type. RT-qPCR experiments were done in triplicate.
4.6. Antimicrobial Susceptibility Testing
The antibiotic susceptibility was determined for WCS358 wild type and ΔrclS mutant by microdilution method according to the European Committee on Antimicrobial Susceptibility Testing (http://www.eucast.org, accessed on 1 April 2019). The strains were tested against ampicillin (100–800 µg/mL), ceftazidime (2.5–20 µg/mL), chloramphenicol (20–160 µg/mL), erythromycin (100–800 µg/mL), gentamicin (2.5–20 µg/mL), novobiocin (100–800 µg/mL), levofloxacine (0.625–5 µg/mL) and tetracycline (2.5–20 µg/mL).
4.7. Preparation of Crude Ethyl Acetate Extract
P. capeferrum WCS358 wild type and ΔrclS mutant bacterial cultures (one liter) were cultivated in M9 minimal medium (10×; 33.7 mM Na2HPO4 × 7H20, 22 mM KH2PO4, 8.55 mM NaCl, 9.35 mM NH4Cl, 1 mM MgSO4 and 0.3 mM CaCl2) supplemented with 0.5% glucose for 24 h at 30 °C, aerobically. After centrifugation at 13,680× g at 4 °C for 30 min, the collected supernatants were mixed with an equal volume of ethyl acetate and 0.1 mL/l glacial acetic acid (Sigma-Aldrich, St. Louis, MI, USA). The AHL extraction from supernatant was performed twice with a vigorous shaking (30 min at room temperature). Extracts were dried by evaporation using a vacuum rotary evaporator at 30 °C (Buchi Rotavapor, R200, Fisher Scientific) and the dry mass was dissolved in DMSO for further analysis [45].
4.8. Fluorescence Assay
The overnight culture of the reporter strain P. putida F117 (pKR-C12) was diluted to the optical turbidity equivalent to 0.5 McFarland standard, after which it was ten times additionally diluted and incubated with WCS358 wild type and ΔrclS AHL extracts (1 mg/mL, final concentration). Cell suspensions with 3-oxo-C10-HSL and 3-oxo-C12-HSL (5 μM, final concentration) were used as a positive control. Fluorescence assay was monitored in black-walled clear-bottom 96-well microplates (Thermo Fisher Scientific). After 6 h of incubation (30 °C, 70 rpm), the green fluorescence (an excitation/emission wavelength detection at 474/515 nm) and cell density (OD600) were simultaneously measured with a Plate Reader Infinite 200 pro (MTX Lab Systems). The background fluorescence of the AHL biosensor strain was determined by incubation of the biosensor with caMH medium as a negative control. Specific fluorescence is defined as the relative fluorescence units corrected for autofluorescence per unit of OD600 [41]. The test was performed in sextuplicate with three independent repeats.
4.9. Biofilm Formation Assay
The biofilm formation ability of WCS358 wild type and ΔrclS mutant was performed according to the method described by Stepanović et al. (2007) [46], with modifications. Briefly, wells of 96-well microtiter plates (Sarstedt) were filled with 180 μL caMH broth medium and 20 μL of WCS358 wild type and ΔrclS overnight cultures (adjusted to the 0.5 McFarland standard) were added. Bacterial cultures were incubated aerobically for 24 or 48 h at 30 °C. Sterile medium was used as a negative control. After incubation and washing (three times with 1X phosphate-buffered saline, PBS), bacteria were fixed by drying at 65 °C for 30 min. Staining and visualization of biofilm was performed using 0.1% crystal violet (HiMedia Labs Pvt. Ltd., Mumbai, India) (30 min at room temperature). The stain was rinsed by washing three times with 1X PBS and then resolubilized with 96% ethanol and acetone (4:1). Quantification of biofilm formation was determined by measuring absorbance at 595 nm using Plate Reader Infinite 200 pro (MTX Lab Systems). Both strains were tested in sextuplicate with three independent repeats.
4.10. Isolation of Siderophore Pseudobactin 358
WCS358 wild type and ΔrclS mutant were cultivated in succinate medium [47] for 48 h at 30 °C, aerobically. After cultivation, the OD600 values of cultures were measured and bacterial cells were pelleted by centrifugation (4500× g, 2 min). Further, optical density at 400 nm was determined for obtained supernatants (Plate Reader Infinite 200 pro, MTX Lab Systems). Molar concentration of isolated pseudobactin 358 was calculated using the following equation:
where A represented OD400 value of supernatant, ε extinction coefficient specific for pseudobactin 358 and L optical path length. The experiment was done in triplicate.
C = A/ε × L
4.11. Cytotoxicity and Adhesion Assays
The cytotoxic capacity of WCS358 wild type and ΔrclS mutant was determined using human keratinocyte HaCaT cell line model system. HaCaT keratinocyte was cultivated in high glucose DMEM, supplemented with 2 mM L-glutamine, 10% fetal bovine serum, 100 U/mL penicillin and 100 μg/mL streptomycin (Gibco Life Technologies, Waltham, MA, USA). Prior to treatment, HaCaT cells (2 × 10⁵ cells/well) were plated in 24-well plates (Sarstedt) and incubated overnight at 37 °C with 5% CO2. Before adding the bacterial cells, the cells were washed in 1X PBS and suspended in the aforementioned medium without antibiotics.
WCS358 wild type and ΔrclS mutant were cultivated in caMH broth at 30 °C with shaking overnight. The cells (2 × 10⁷ CFU/mL) were harvested and washed in 1X PBS. After centrifugation (4500× g, 5 min), the obtained pellets were suspended in high glucose DMEM containing 2 mM L-glutamine and 10% FBS.
HaCaT keratinocyte cells were infected with WCS358 wild type or ΔrclS by addition of the bacterial cell suspension to a 24 well plate containing HaCaT cells (multiplicity of infection was 100). For cytotoxicity assay, co-incubation was performed at 30 °C with 5% CO2 for 24 h. Cytotoxicity level of analyzed strains was monitored by LDH Cytotoxicity Assay Kit according to the manufacturer’s protocol (Thermo Scientific). Non-treated HaCaT cells represented negative control. For adhesion assay, HaCaT cells were infected with bacterial cells at 30 °C with 5% CO2 for 1 h. After washing (three times with 1X PBS) to remove unattached bacteria, cells were treated with trypsin/EDTA solution (Gibco Life Technologies) to collect adherent bacterial cells. Serial dilutions of bacteria before and after adhesion assay were prepared and used for determination of adherent cells number by plating on Luria Bertani (LB) agar plates (30 °C, 24 h). The adhesion potential of WCS358 wild type and ΔrclS was expressed as ratio of adhered bacteria relative to number of added bacteria. The experiment was done in triplicate.
4.12. Statistical Analysis
The obtained results are presented as mean values ± standard deviations. Student’s t-test was performed to compare differences between WCS358 wild type and ΔrclS mutant strain. Values at p 0.05 or less were considered to be statistically significant.
5. Conclusions
This study enabled the identification of the three-component system RclSAR regulon in Pseudomonas capeferrum WCS358 using ΔrclS mutant. Transcriptome analysis revealed that the expression regulation mediated by sensor kinase RclS is growth phase dependent and more pronounced in the early rather than the late stages of growth. Enrichment analyses showed that RclS has been included in the regulation of the diverse metabolic and biocontrol processes in P. capeferrum WCS358. Moreover, phenotypic tests revealed that RclS sensor kinase mostly contributes to the elevation of antibiotic resistance (gentamicin, novobiocin, levofloxacine and tetracycline) as well as the production of AHLs, enhancing survival and intercommunication of WCS358 cells. In addition, the inactivation of the gene encoding RclS sensor kinase leads to increased levels of virulence factor production (such are siderophores and adhesion to host cells). Finally, this study enabled a more comprehensive understanding and the creation of a model of regulatory networks interconnection in P. capeferrum WCS358.
Supplementary Materials
The supporting information can be downloaded at: https://www.mdpi.com/article/10.3390/ijms23158232/s1. Reference [7] is cited in the supplementary materials.
Author Contributions
Conceptualization, K.N., M.K. and B.J.; Methodology, K.N., M.M. and M.D.; Validation, L.G.; Investigation, K.N., M.M. and M.D.; Data Curation, M.M.; Writing—Original Draft Preparation, K.N.; Writing—Review and Editing, M.M., M.D., L.G., M.K. and B.J.; Visualization, K.N., M.M. and M.K.; Supervision, M.K. and B.J.; Funding acquisition, M.K. and B.J. All authors have read and agreed to the published version of the manuscript.
Funding
This work was supported by the Ministry of Education, Science and Technological Development of the Republic of Serbia [Grant No. 451-03-68/2022-14/200042 and 451-03-68/2022-14/200178].
Conflicts of Interest
The authors declare no conflict of interest.
References
- Gooderham, W.J.; Hancock, R.E. Regulation of virulence and antibiotic resistance by two-component regulatory systems in Pseudomonas aeruginosa. FEMS Microbiol. Rev. 2009, 33, 279–294. [Google Scholar] [CrossRef] [PubMed] [Green Version]
- Jacob-Dubuisson, F.; Mechaly, A.; Betton, J.M.; Antoine, R. Structural insights into the signalling mechanisms of two-component systems. Nat. Rev. Microbiol. 2018, 16, 585–593. [Google Scholar] [CrossRef] [PubMed]
- Liu, C.; Sun, D.; Zhu, J.; Liu, W. Two-component signal transduction systems: A major strategy for connecting input stimuli to biofilm formation. Front. Microbiol. 2019, 9, 3279. [Google Scholar] [CrossRef] [PubMed]
- Merkel, T.J.; Barros, C.; Stibitz, S. Characterization of the bvgR locus of Bordetella pertussis. J. Bacteriol. 1998, 180, 1682–1690. [Google Scholar] [CrossRef] [Green Version]
- Kulasekara, H.D.; Ventre, I.; Kulasekara, B.R.; Lazdunski, A.; Filloux, A.; Lory, S. A novel two-component system controls the expression of Pseudomonas aeruginosa fimbrial cup genes. Mol. Microbiol. 2005, 55, 368–380. [Google Scholar] [CrossRef]
- Liu, C.; Yang, J.; Liu, L.; Li, B.; Yuan, H.; Liu, W. Sodium lactate negatively regulates Shewanella putrefaciens CN32 biofilm formation via a three-component regulatory system (LrbS-LrbA-LrbR). Appl. Environ. Microbiol. 2017, 83, e00712-17. [Google Scholar] [CrossRef] [Green Version]
- Novović, K.; Malešević, M.; Gardijan, L.; Kojić, M.; Jovčić, B. Novel RclSAR three-component system regulates expression of the intI1 gene in the stationary growth phase. Res. Microbiol. 2022, 173, 103885. [Google Scholar] [CrossRef]
- Silby, M.W.; Winstanley, C.; Godfrey, S.A.; Levy, S.B.; Jackson, R.W. Pseudomonas genomes: Diverse and adaptable. FEMS Microbiol. Rev. 2011, 35, 652–680. [Google Scholar] [CrossRef] [Green Version]
- Francis, V.I.; Stevenson, E.C.; Porter, S.L. Two-component systems required for virulence in Pseudomonas aeruginosa. FEMS Microbiol. Lett. 2017, 364, fnx104. [Google Scholar] [CrossRef]
- Balasubramanian, D.; Schneper, L.; Kumari, H.; Mathee, K. A dynamic and intricate regulatory network determines Pseudomonas aeruginosa virulence. Nucleic Acids Res. 2013, 41, 1–20. [Google Scholar] [CrossRef]
- Putrinš, M.; Ilves, H.; Lilje, L.; Kivisaar, M.; Hõrak, R. The impact of ColRS two-component system and Ttg ABC efflux pump on phenol tolerance of Pseudomonas putida becomes evident only in growing bacteria. BMC Microbiol. 2010, 10, 110. [Google Scholar] [CrossRef] [PubMed] [Green Version]
- Ainsaar, K.; Mumm, K.; Ilves, H.; Hõrak, R. The ColRS signal transduction system responds to the excess of external zinc, iron, manganese, and cadmium. BMC Microbiol. 2014, 14, 162. [Google Scholar] [CrossRef] [Green Version]
- Hõrak, R.; Ilves, H.; Pruunsild, P.; Kuljus, M.; Kivisaar, M. The ColR-ColS two-component signal transduction system is involved in regulation of Tn4652 transposition in Pseudomonas putida under starvation conditions. Mol. Microbiol. 2004, 54, 795–807. [Google Scholar] [CrossRef] [PubMed]
- Liu, P.; Chen, X.; Huang, Q.; Chen, W. The role of CzcRS two-component systems in the heavy metal resistance of Pseudomonas putida X4. Int. J. Mol. Sci. 2015, 16, 17005–17017. [Google Scholar] [CrossRef] [PubMed] [Green Version]
- Fernández-Pinar, R.; Ramos, J.L.; Rodríguez-Herva, J.J.; Espinosa-Urgel, M. A two-component regulatory system integrates redox state and population density sensing in Pseudomonas putida. J. Bacteriol. 2008, 190, 7666–7674. [Google Scholar] [CrossRef] [PubMed] [Green Version]
- Bertani, I.; Venturi, V. Regulation of the N-acyl homoserine lactone-dependent quorum-sensing system in rhizosphere Pseudomonas putida WCS358 and cross-talk with the stationary-phase RpoS sigma factor and the global regulator GacA. Appl. Environ. Microbiol. 2004, 70, 5493–5502. [Google Scholar] [CrossRef] [PubMed] [Green Version]
- Berendsen, R.L.; van Verk, M.C.; Stringlis, I.A.; Zamioudis, C.; Tommassen, J.; Pieterse, C.M.J.; Bakker, P.A.H.M. Unearthing the genomes of plant-beneficial Pseudomonas model strains WCS358, WCS374 and WCS417. BMC Genom. 2015, 16, 539. [Google Scholar] [CrossRef] [Green Version]
- Bhagirath, A.Y.; Li, Y.; Patidar, R.; Yerex, K.; Ma, X.; Kumar, A.; Duan, K. Two component regulatory systems and antibiotic resistance in Gram-negative pathogens. Int. J. Mol. Sci. 2019, 20, 1781. [Google Scholar] [CrossRef] [PubMed] [Green Version]
- Kivisaar, M. Narrative of a versatile and adept species Pseudomonas putida. J. Med. Microbiol. 2020, 69, 324–338. [Google Scholar] [CrossRef]
- Molina, L.; Udaondo, Z.; Duque, E.; Fernández, M.; Molina-Santiago, C.; Roca, A.; Porcel, M.; de la Torre, J.; Segura, A.; Plesiat, P.; et al. Antibiotic resistance determinants in a Pseudomonas putida strain isolated from a hospital. PLoS ONE 2014, 9, e81604. [Google Scholar] [CrossRef] [PubMed] [Green Version]
- Peter, S.; Oberhettinger, P.; Schuele, L.; Dinkelacker, A.; Vogel, W.; Dörfel, D.; Bezdan, D.; Ossowski, S.; Marschal, M.; Liese, J.; et al. Genomic characterisation of clinical and environmental Pseudomonas putida group strains and determination of their role in the transfer of antimicrobial resistance genes to Pseudomonas aeruginosa. BMC Genom. 2017, 18, 859. [Google Scholar] [CrossRef] [PubMed]
- Tan, G.; Xi, Y.; Yuan, P.; Sun, Z.; Yang, D. Risk factors and antimicrobial resistance profiles of Pseudomonas putida infection in Central China, 2010–2017. Medicine 2019, 98, e17812. [Google Scholar] [CrossRef] [PubMed]
- Fernández, M.; Porcel, M.; de la Torre, J.; Molina-Henares, M.A.; Daddaoua, A.; Llamas, M.A.; Roca, A.; Carriel, V.; Garzón, I.; Ramos, J.L.; et al. Analysis of the pathogenic potential of nosocomial Pseudomonas putida strains. Front. Microbiol. 2015, 6, 871. [Google Scholar] [CrossRef] [PubMed]
- Juan, C.; Zamorano, L.; Mena, A.; Albertí, S.; Pérez, J.L.; Oliver, A. Metallo-β-lactamase-producing Pseudomonas putida as a reservoir of multidrug resistance elements that can be transferred to successful Pseudomonas aeruginosa clones. J. Antimicrob. Chemother. 2010, 65, 474–478. [Google Scholar] [CrossRef] [PubMed] [Green Version]
- Cotter, P.D.; Emerson, N.; Gahan, C.G.; Hill, C. Identification and disruption of lisRK, a genetic locus encoding a two-component signal transduction system involved in stress tolerance and virulence in Listeria monocytogenes. J. Bacteriol. 1999, 181, 6840–6843. [Google Scholar] [CrossRef] [Green Version]
- Frederick, J.R.; Rogers, E.A.; Marconi, R.T. Analysis of a growth-phase-regulated two-component regulatory system in the periodontal pathogen Treponema denticola. J. Bacteriol. 2008, 190, 6162–6169. [Google Scholar] [CrossRef] [Green Version]
- Dhiman, A.; Bhatnagar, S.; Kulshreshtha, P.; Bhatnagar, R. Functional characterization of WalRK: A two-component signal transduction system from Bacillus anthracis. FEBS Open Bio 2014, 4, 65–76. [Google Scholar] [CrossRef] [Green Version]
- Yang, D.; Jiang, F.; Huang, X.; Li, G.; Cai, W. Transcriptomic and metabolomic profiling reveals that KguR broadly impacts the physiology of uropathogenic Escherichia coli under in vivo relevant conditions. Front. Microbiol. 2021, 12, 793391. [Google Scholar] [CrossRef]
- Hadjifrangiskou, M.; Kostakioti, M.; Chen, S.L.; Henderson, J.P.; Greene, S.E.; Hultgren, S.J. A central metabolic circuit controlled by QseC in pathogenic Escherichia coli. Mol. Microbiol. 2011, 80, 1516–1529. [Google Scholar] [CrossRef] [Green Version]
- Sonawane, A.M.; Singh, B.; Röhm, K.H. The AauR-AauS two-component system regulates uptake and metabolism of acidic amino acids in Pseudomonas putida. Appl. Environ. Microbiol. 2006, 72, 6569–6577. [Google Scholar] [CrossRef] [PubMed] [Green Version]
- Rodríguez, H.; Rico, S.; Díaz, M.; Santamaría, R.I. Two-component systems in Streptomyces: Key regulators of antibiotic complex pathways. Microb. Cell Factories 2013, 12, 127. [Google Scholar] [CrossRef] [PubMed] [Green Version]
- Alduina, R.; Tocchetti, A.; Costa, S.; Ferraro, C.; Cancemi, P.; Sosio, M.; Donadio, S. A two-component regulatory system with opposite effects on glycopeptide antibiotic biosynthesis and resistance. Sci. Rep. 2020, 10, 6200. [Google Scholar] [CrossRef] [PubMed]
- Qiao, L.; Li, X.; Ke, X.; Chu, J. A two-component system gene SACE_0101 regulates copper homeostasis in Saccharopolyspora erythraea. Bioresour. Bioprocess. 2020, 7, 12. [Google Scholar] [CrossRef] [Green Version]
- Bricio-Moreno, L.; Sheridan, V.H.; Goodhead, I.; Armstrong, S.; Wong, J.K.; Waters, E.M.; Sarsby, J.; Panagiotou, S.; Dunn, J.; Chakraborty, A.; et al. Evolutionary trade-offs associated with loss of PmrB function in host-adapted Pseudomonas aeruginosa. Nat. Commun. 2018, 9, 2635. [Google Scholar] [CrossRef]
- Marunga, J.; Goo, E.; Kang, Y.; Hwang, I. Mutations in the two-component GluS-GluR regulatory system confer resistance to β-lactam antibiotics in Burkholderia glumae. Front. Microbiol. 2021, 12, 721444. [Google Scholar] [CrossRef]
- Rampioni, G.; Bertani, I.; Pillai, C.R.; Venturi, V.; Zennaro, E.; Leoni, L. Functional characterization of the quorum sensing regulator RsaL in the plant-beneficial strain Pseudomonas putida WCS358. Appl. Environmen. Microbiol. 2012, 78, 726–734. [Google Scholar] [CrossRef] [PubMed] [Green Version]
- Zhou, T.; Huang, J.H.; Feng, Q.S.; Liu, Z.Q.; Lin, Q.Q.; Xu, Z.; Zhang, L.H. A two-component system FleS/FleR regulates multiple virulence-related traits in Pseudomonas aeruginosa. bioRxiv 2021. [Google Scholar] [CrossRef]
- Fothergill, J.L.; Neill, D.R.; Loman, N.; Winstanley, C.; Kadioglu, A. Pseudomonas aeruginosa adaptation in the nasopharyngeal reservoir leads to migration and persistence in the lungs. Nat. Commun. 2014, 5, 4780. [Google Scholar] [CrossRef] [Green Version]
- Hall, C.L.; Lee, V.T. Cyclic-di-GMP regulation of virulence in bacterial pathogens. Wiley Interdiscip. Rev. RNA 2018, 9, e1454. [Google Scholar] [CrossRef]
- Mikkelsen, H.; Sivaneson, M.; Filloux, A. Key two-component regulatory systems that control biofilm formation in Pseudomonas aeruginosa. Environ. Microbiol. 2011, 13, 1666–1681. [Google Scholar] [CrossRef]
- Steidle, A.; Sigl, K.; Schuhegger, R.; Ihring, A.; Schmid, M.; Gantner, S.; Stoffels, M.; Riedel, K.; Givskov, M.; Hartmann, A.; et al. Visualization of N-acyl homoserine lactone-mediated cell-cell communication between bacteria colonizing the tomato rhizosphere. Appl. Environ. Microbiol. 2001, 67, 5761–5770. [Google Scholar] [CrossRef] [PubMed] [Green Version]
- Hood, M.I.; Jacobs, A.C.; Sayood, K.; Dunman, P.M.; Skaar, E.P. Acinetobacter baumannii increases tolerance to antibiotics in response to monovalent cations. Antimicrob. Agents Chemother. 2010, 54, 1029–1041. [Google Scholar] [CrossRef] [PubMed] [Green Version]
- Langmead, B.; Salzberg, S.L. Fast gapped-read alignment with Bowtie 2. Nat. Methods 2012, 9, 357–359. [Google Scholar] [CrossRef] [PubMed] [Green Version]
- Livak, K.J.; Schmittgen, T.D. Analysis of relative gene expression data using real-time quantitative PCR and the 2−ΔΔCT method. Methods 2001, 25, 402–408. [Google Scholar] [CrossRef]
- Kojic, M.; Degrassi, G.; Venturi, V. Cloning and characterisation of the rpoS gene from plant growth-promoting Pseudomonas putida WCS358: RpoS is not involved in siderophore and homoserine lactone production. Biochim. Biophys. Acta 1999, 1489, 413–3420. [Google Scholar] [CrossRef]
- Stepanović, S.; Vuković, D.; Hola, V.; Bonaventura, G.D.; Djukić, S.; Ćirković, I.; Ruzicka, F. Quantification of biofilm in microtiter plates: Overview of testing conditions and practical recommendations for assessment of biofilm production by staphylococci. Apmis 2007, 115, 891–899. [Google Scholar] [CrossRef]
- Meyer, J.M.; Abdallah, M.A. The fluorescent pigment of Pseudomonas fluorescens: Biosynthesis, purification and physicochemical properties. Microbiology 1978, 107, 319–328. [Google Scholar] [CrossRef] [Green Version]
Figure 1.
Gene co-expression. Venn diagrams depicted number of common and uniquely expressed genes in WCS358 wild type and ΔrclS mutant (A) in exponential growth phase; (B) in stationary growth phase; (C) in exponential and stationary growth phase.
Figure 1.
Gene co-expression. Venn diagrams depicted number of common and uniquely expressed genes in WCS358 wild type and ΔrclS mutant (A) in exponential growth phase; (B) in stationary growth phase; (C) in exponential and stationary growth phase.
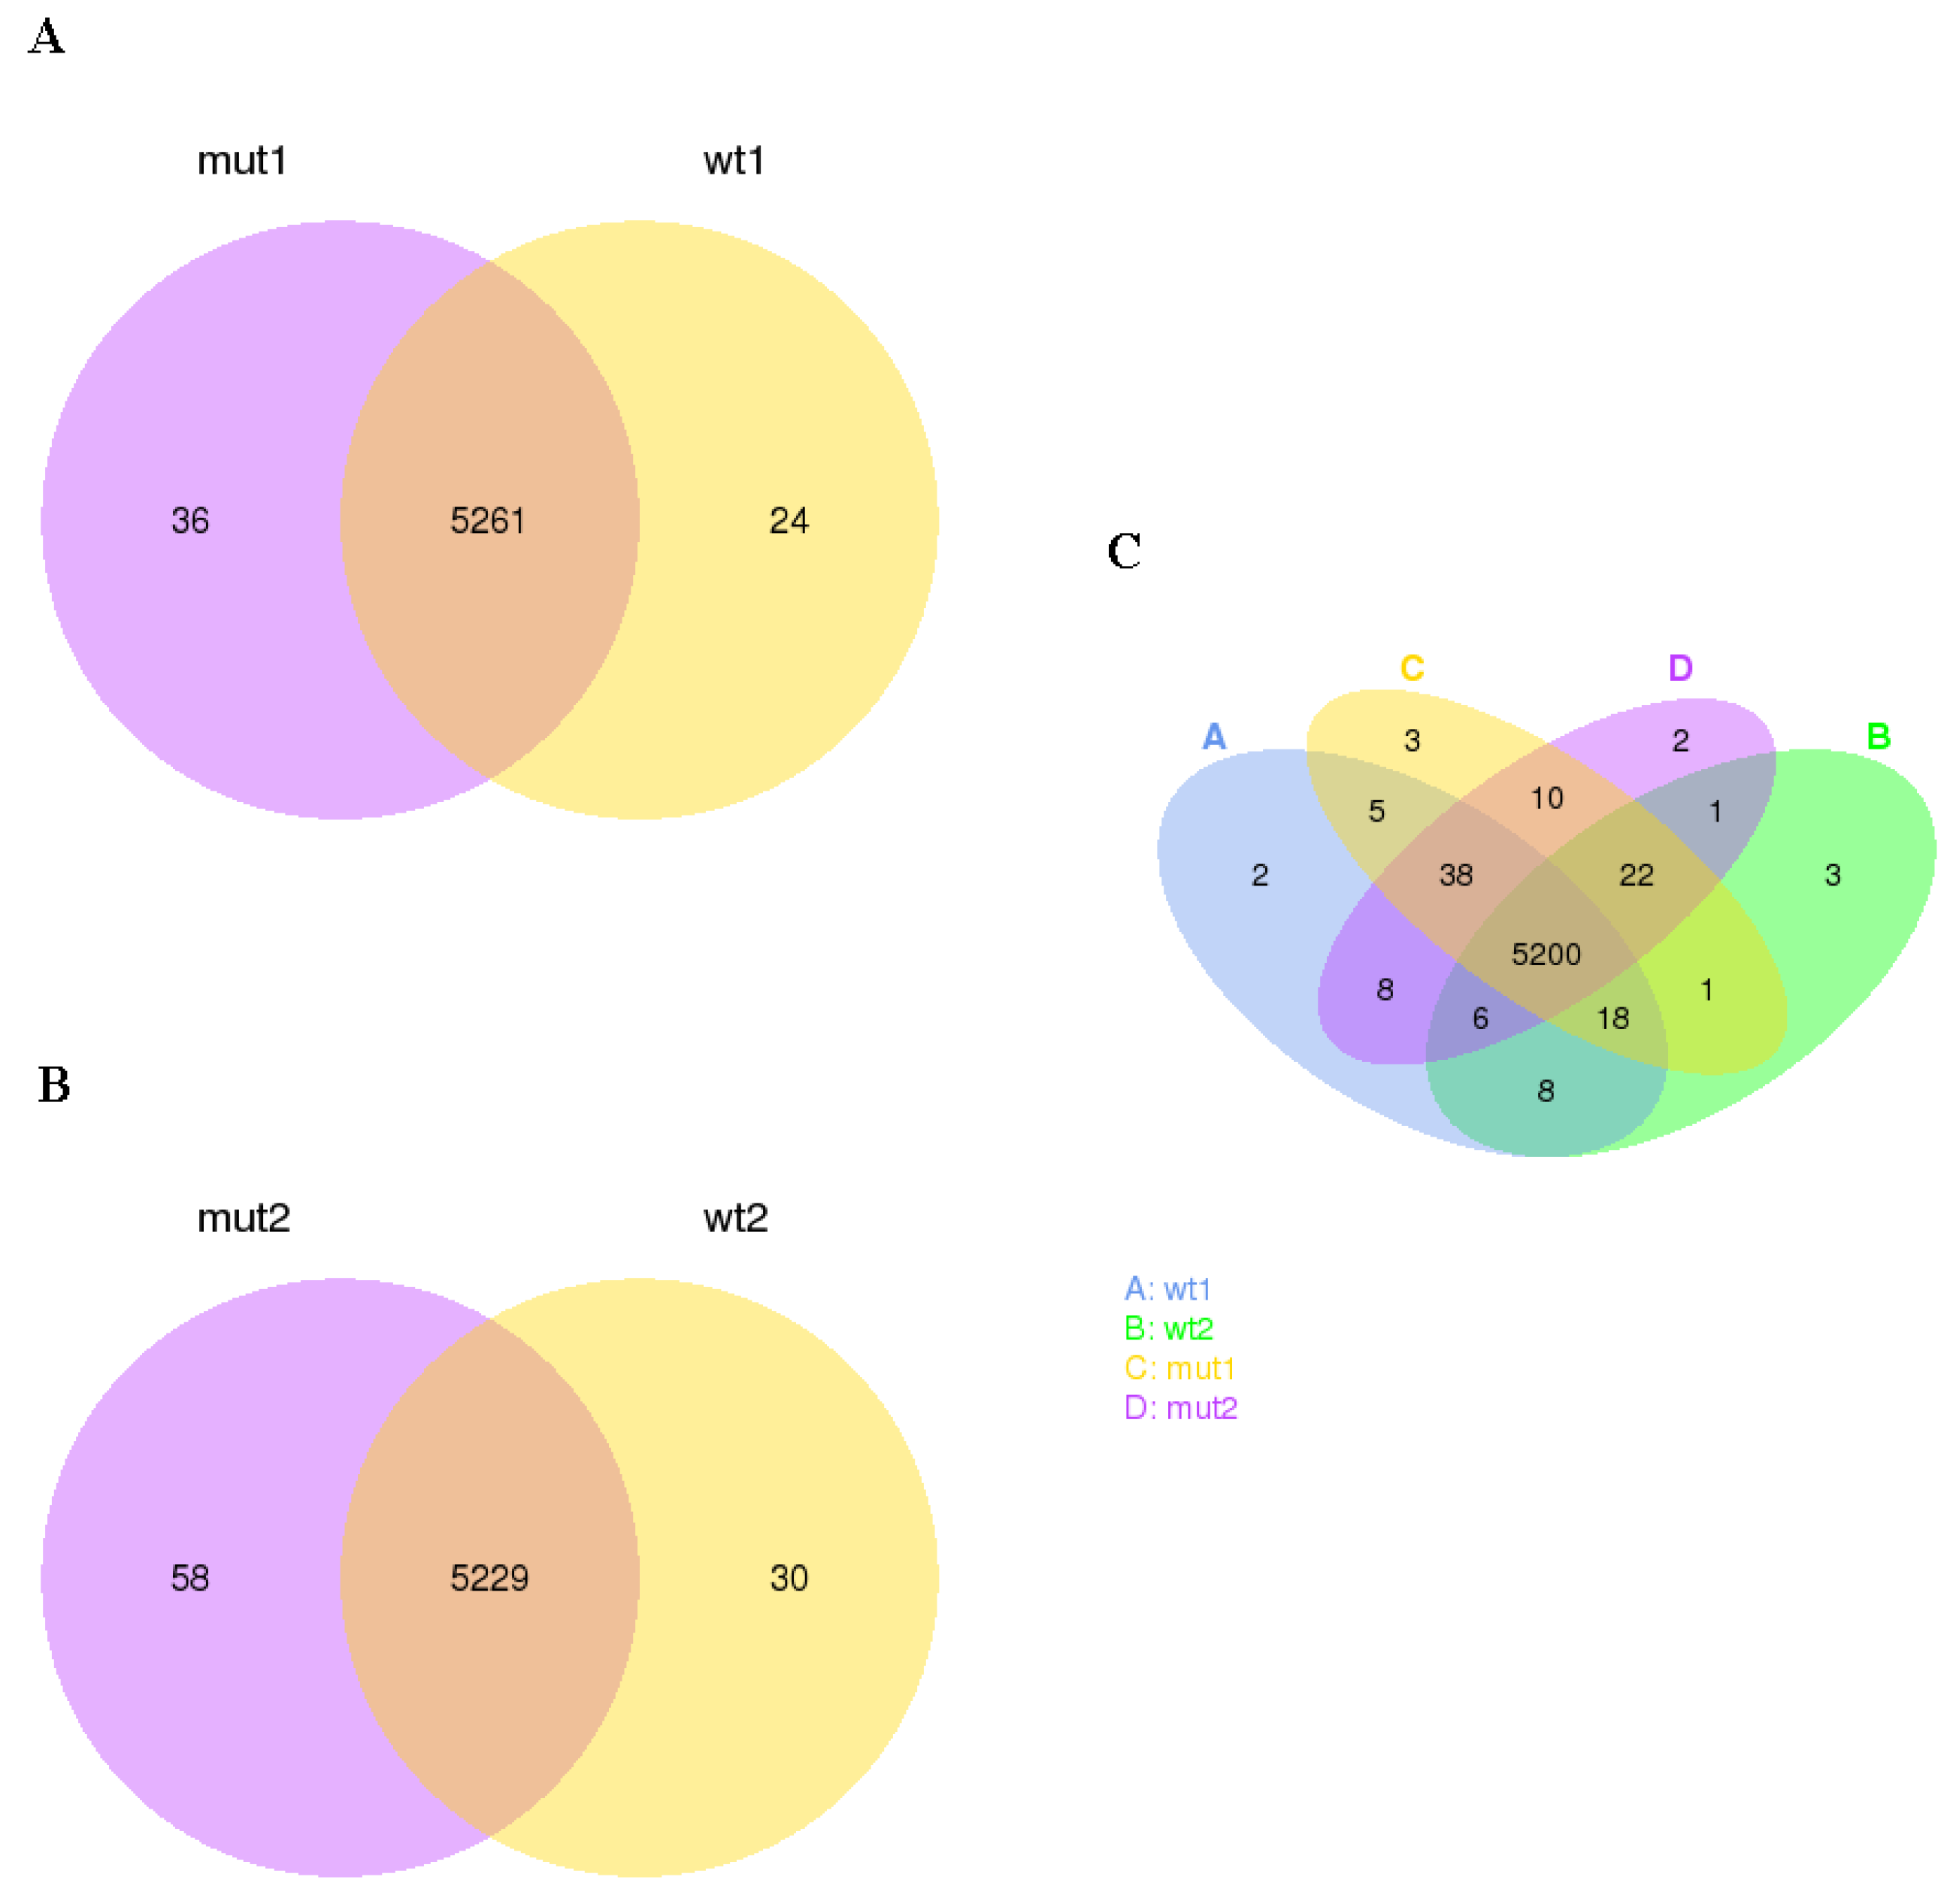
Figure 2.
Hierarchical clustering of DEGs detected in WCS358 wild type and ΔrclS mutant in exponential and stationary growth phase. Scaled log2 expression values are presented in red and blue indicating high and low expressions, respectively.
Figure 2.
Hierarchical clustering of DEGs detected in WCS358 wild type and ΔrclS mutant in exponential and stationary growth phase. Scaled log2 expression values are presented in red and blue indicating high and low expressions, respectively.
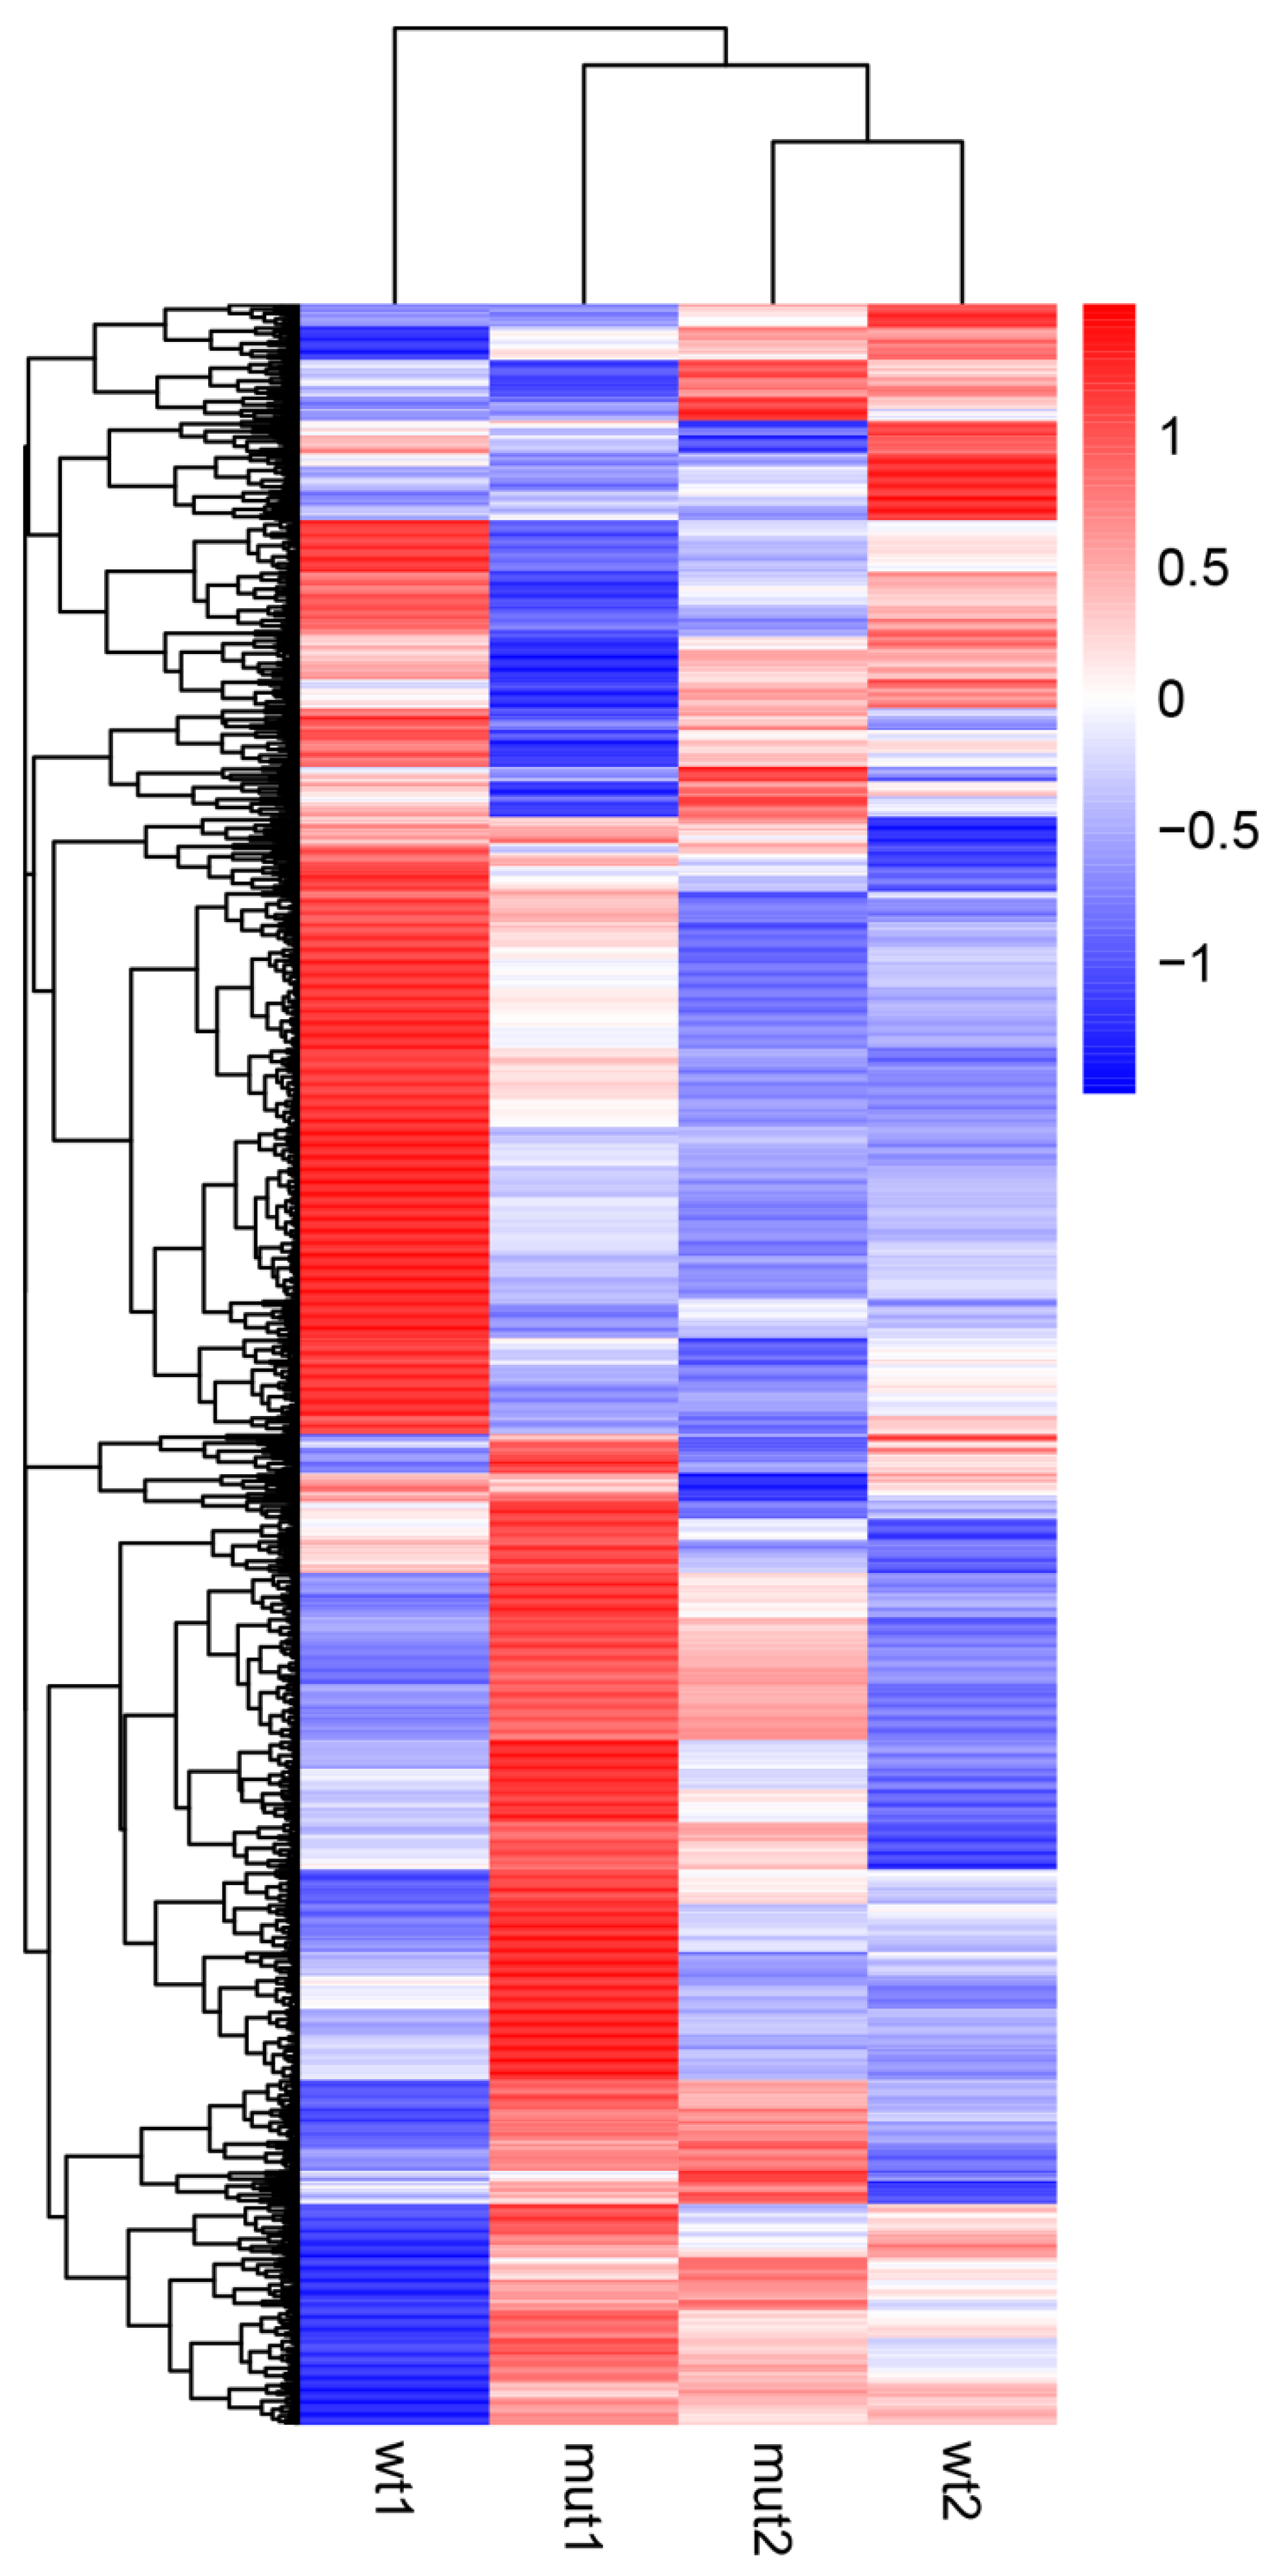
Figure 3.
Summarized GO enrichment analysis of detected DEGs. The 20 most enriched GO terms are represented for exponential (A) and stationary (B) growth phase. The length of bar charts indicates statistical significance of each GO term (* p < 0.05).
Figure 3.
Summarized GO enrichment analysis of detected DEGs. The 20 most enriched GO terms are represented for exponential (A) and stationary (B) growth phase. The length of bar charts indicates statistical significance of each GO term (* p < 0.05).

Figure 4.
KEGG enrichment analysis of detected DEGs. The top 20 enriched KEGG pathways of DEGs in exponential (A) and stationary (B) growth phase. The x-axis represents the gene ratio, ratio of DEGs in pathway to the total number of annotated genes in the pathway. The value of gene ratio is proportional to the degree of enrichment. The size of the dots indicates the number of DEGs in each pathway, while the dot color represents corrected p values. The color vicinity to red is proportional to the enrichment significance.
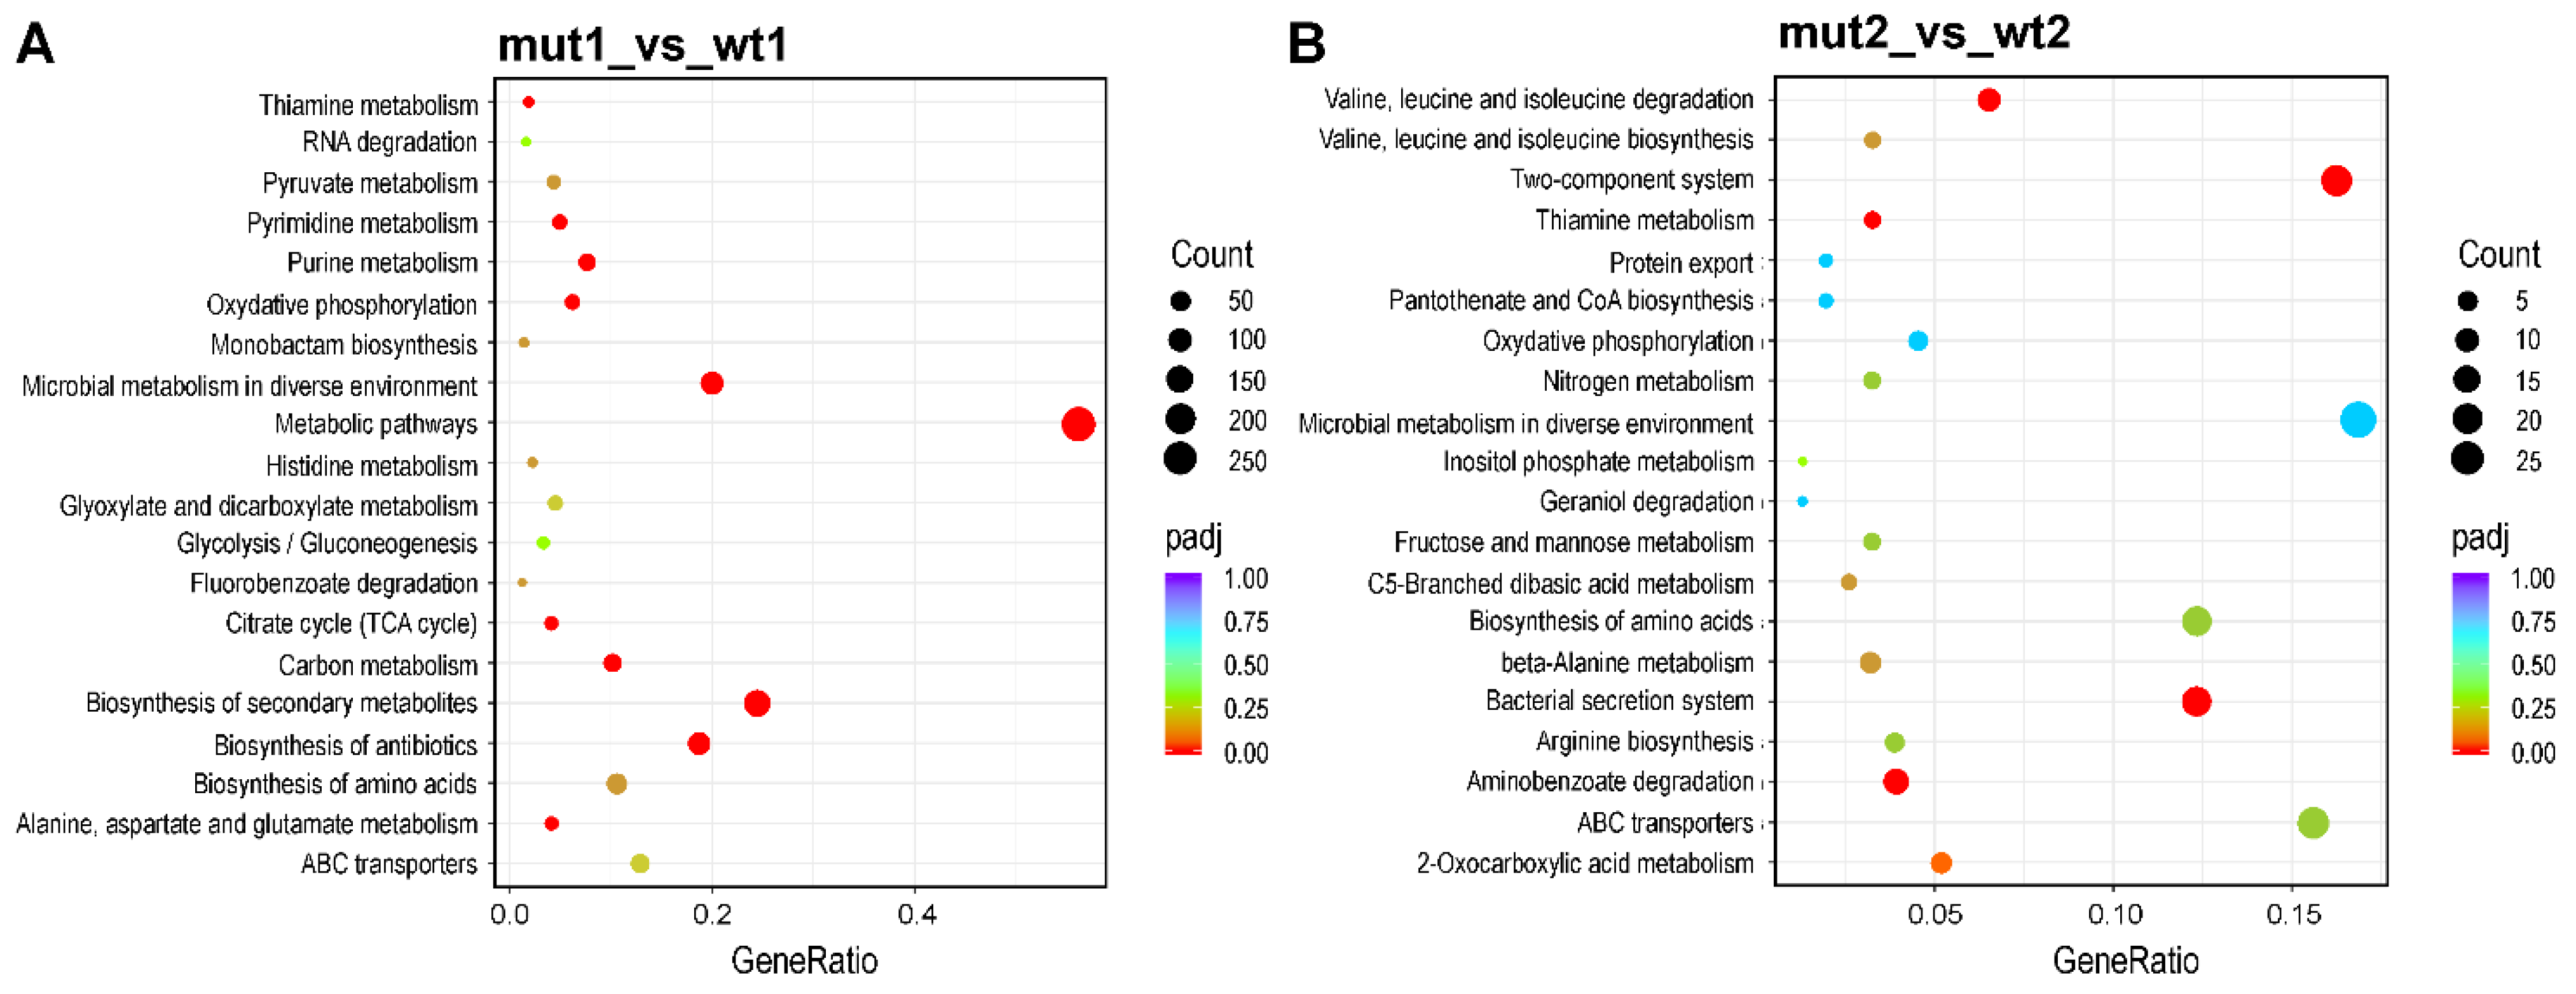
Figure 5.
RT-qPCR based validation of RNA-seq analysis. Transcriptional level of eight selected genes in WCS358 wild type and ΔrclS mutant at two time points (OD = 1 and OD = 2) is represented as FPKM value (RNA-seq) and relative expression value normalized against those obtained for wild type in exponential growth phase (RT-qPCR). RT-qPCR data is represented as mean values ± standard deviations for three biological replicates. Student’s t-test was employed to compare differences between wild type and ΔrclS mutant measured by RT-qPCR (* p < 0.05; ** p < 0.01; *** p < 0.001; **** p < 0.0001).
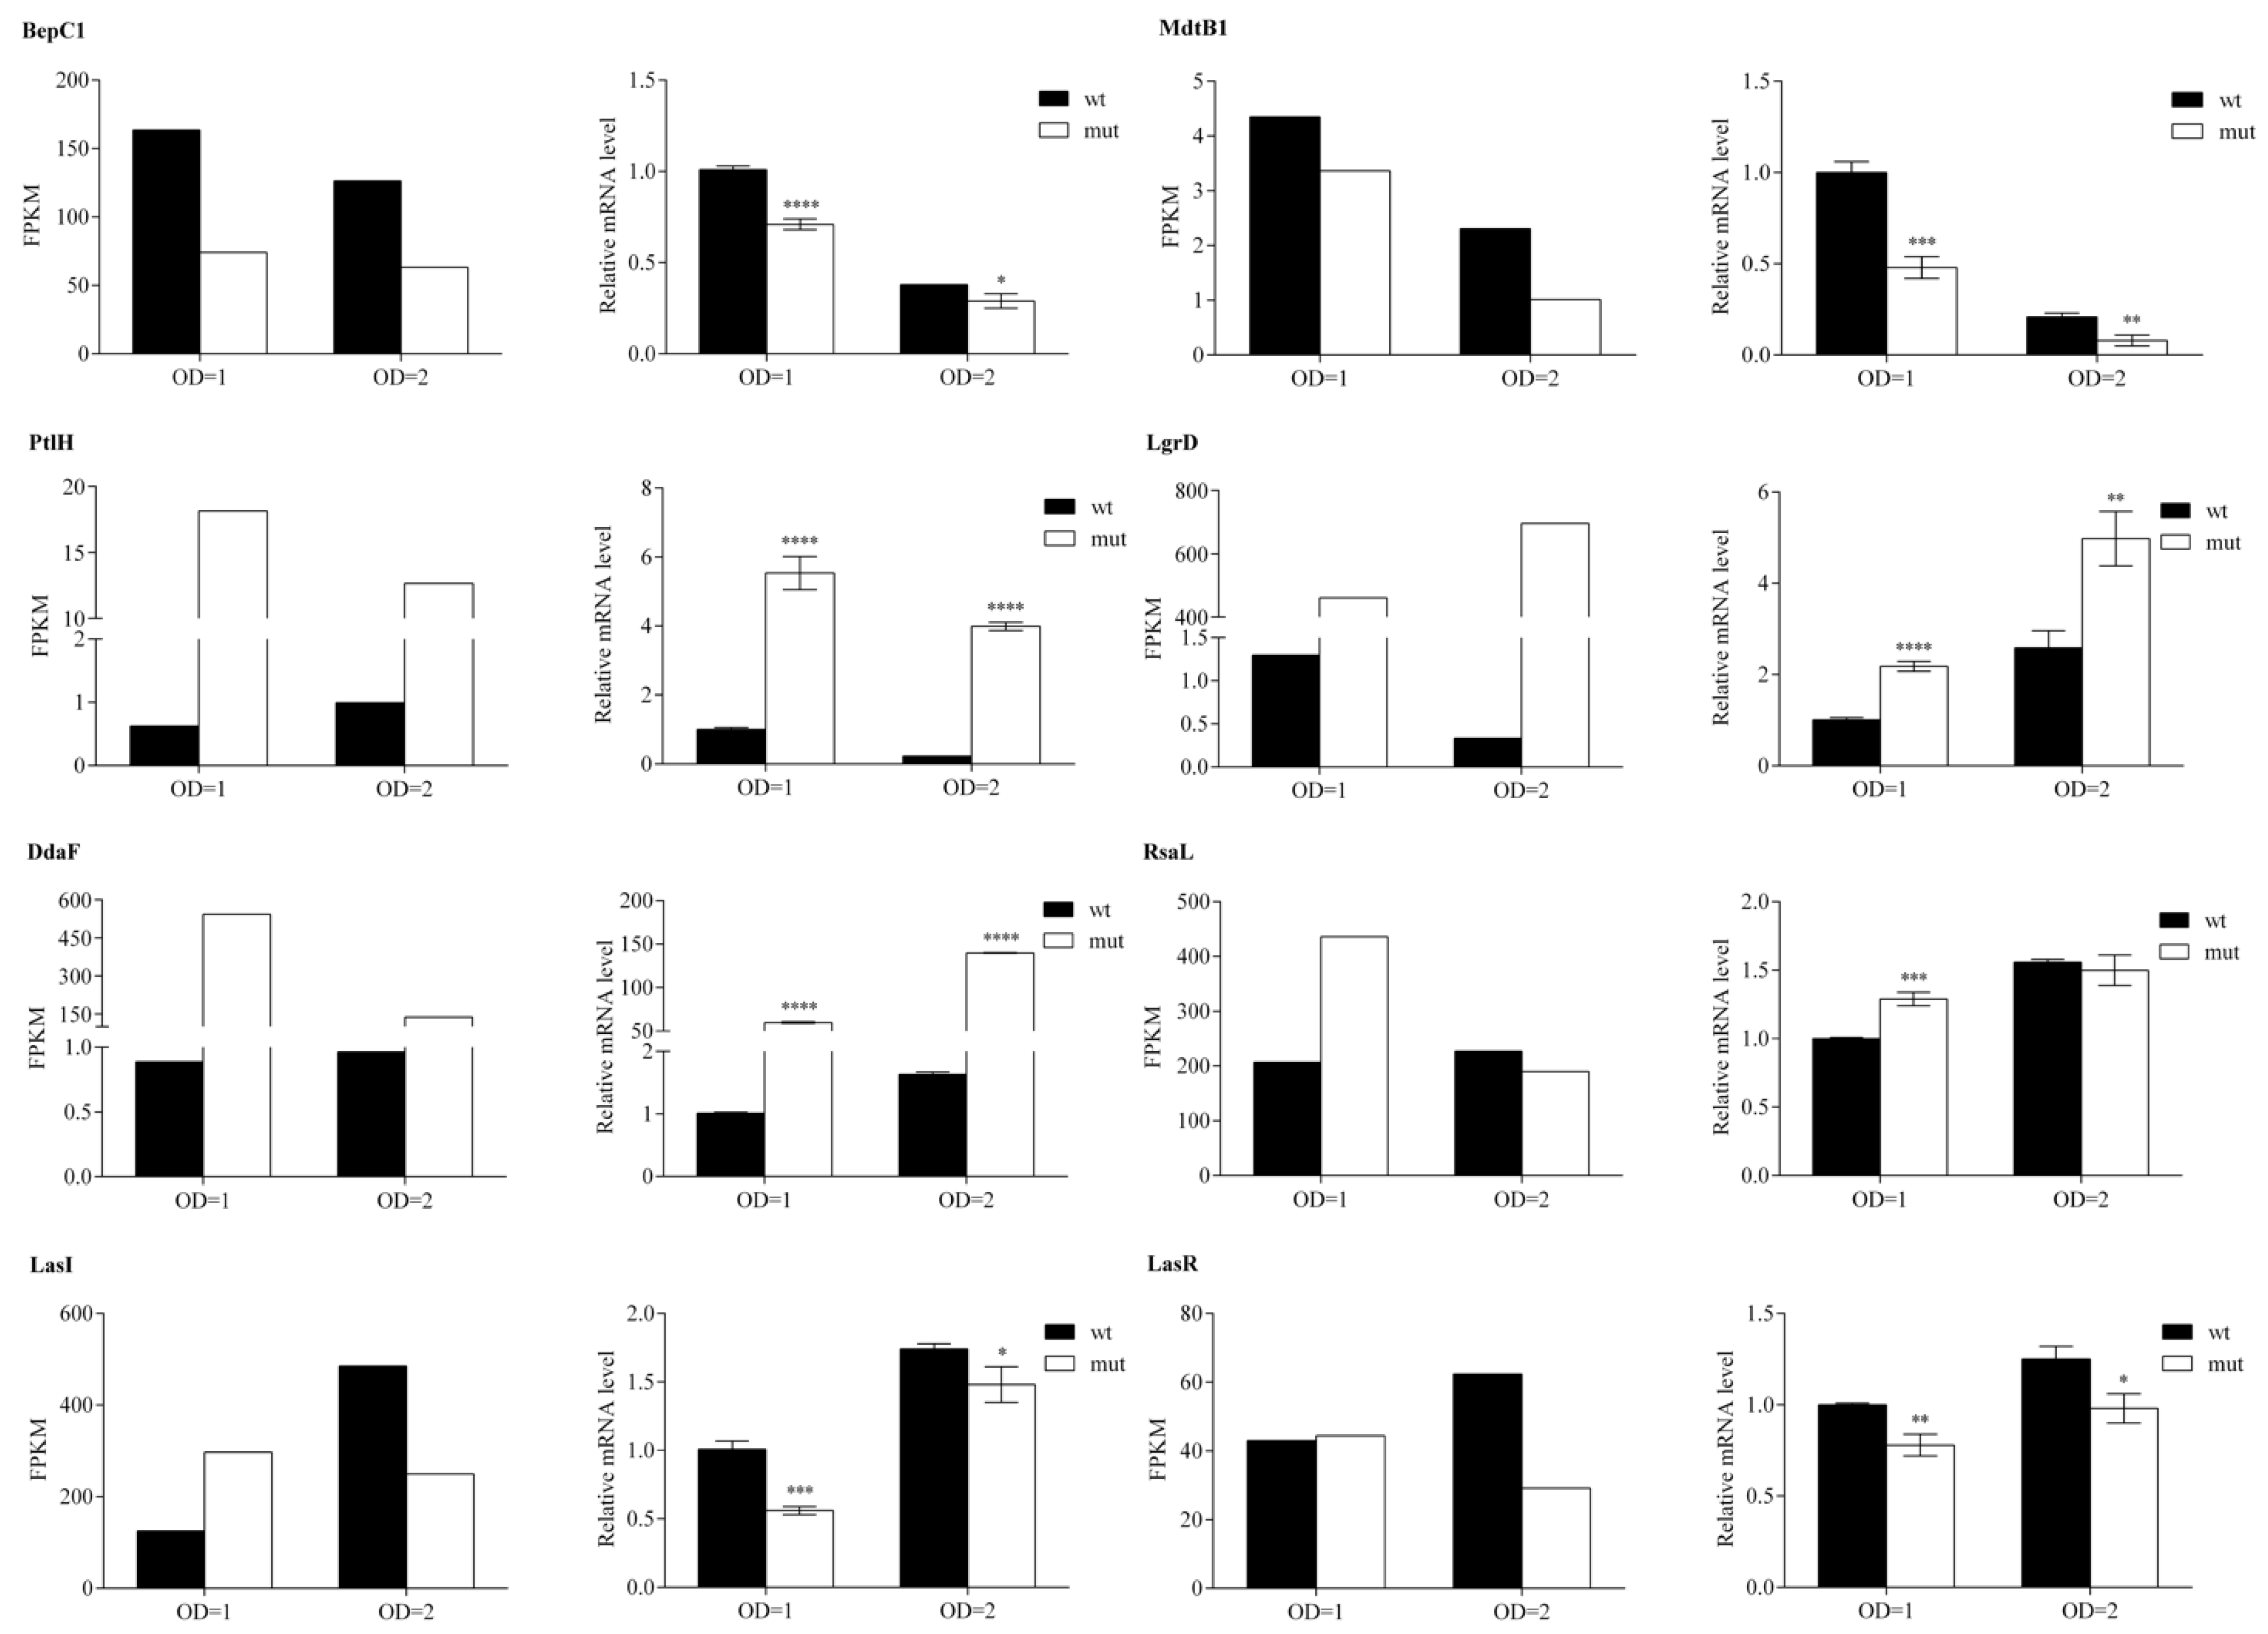
Figure 6.
The effect of RclS knock-out to AHL production and biofilm formation in WCS358. (A) Production of AHLs by WCS358 wild type and ΔrclS mutant is represented as relative fluorescence units corrected for autofluorescence per unit of OD600 (RFU per OD600). Cell suspensions with 3-oxo-C10-HSL and 3-oxo-C12-HSL were used as a positive control. (B) Biofilm formation of WCS358 wild type and ΔrclS mutant was quantified by measuring absorbance at 595 nm after 24 and 48 h of incubation. The tests were performed in sextuplicate with three independent repeats. The results are represented as mean values ± standard deviations. Student’s t-test was employed to compare differences between wild type and ΔrclS mutant (**** p < 0.0001).
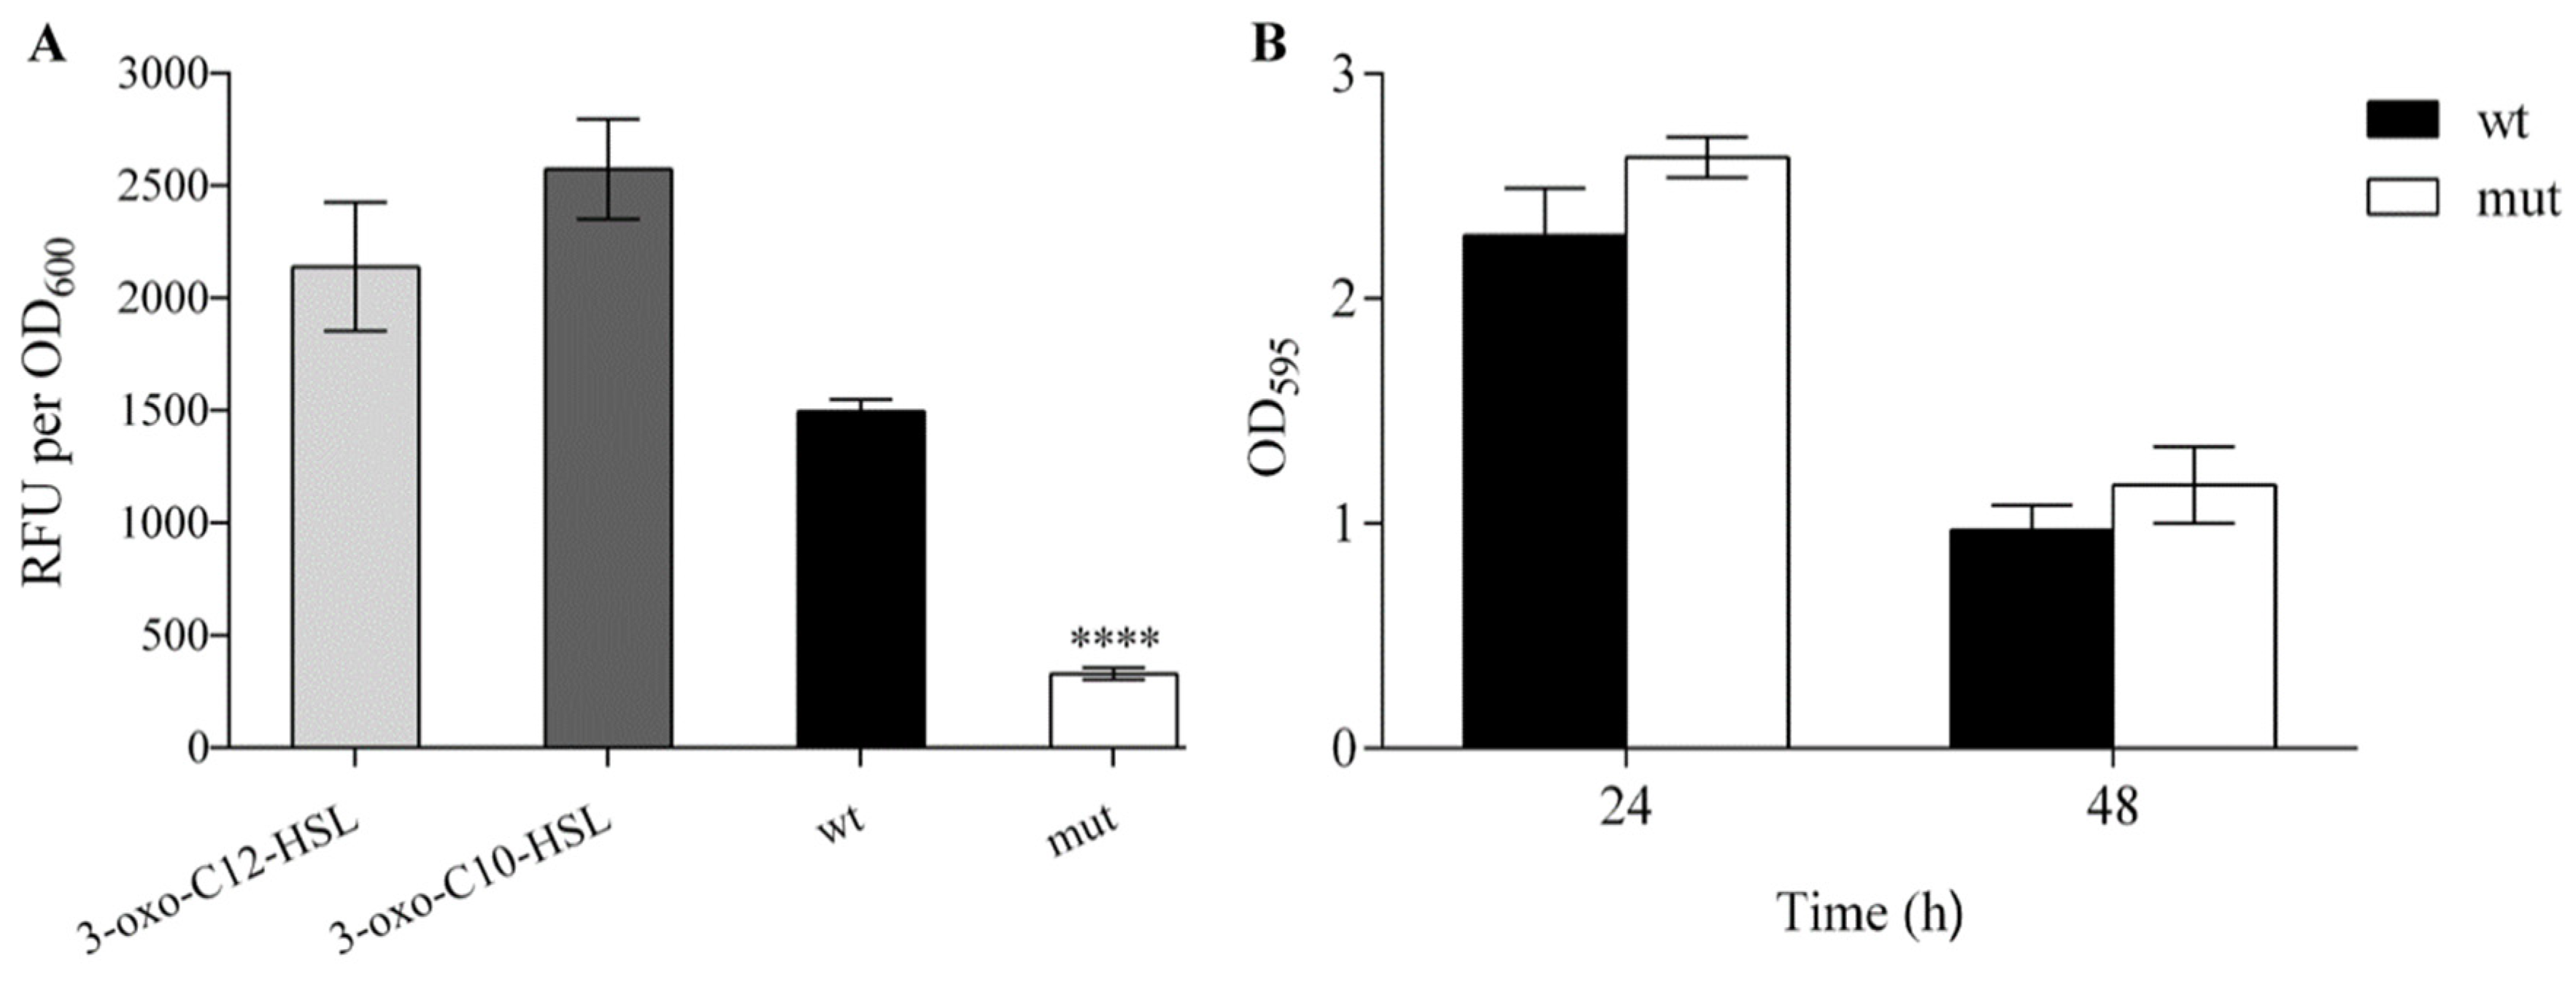
Figure 7.
Cytotoxic effect and adhesion ability of WCS358 wild type and ΔrclS mutant using HaCaT keratynocite cell line as a model system. (A) Cytotoxicity level (%) of wild type and ΔrclS mutant measured by LDH assay was expressed relative to negative control (0%). (B) Adhesion ability of wild type and ΔrclS mutant was expressed as a ratio of adhered bacteria relative to added bacteria (log CFU/mL). The results are represented as mean values ± standard deviations for three biological replicates. Student’s t-test was employed to compare differences between wild type and ΔrclS mutant (** p < 0.01).

Figure 8.
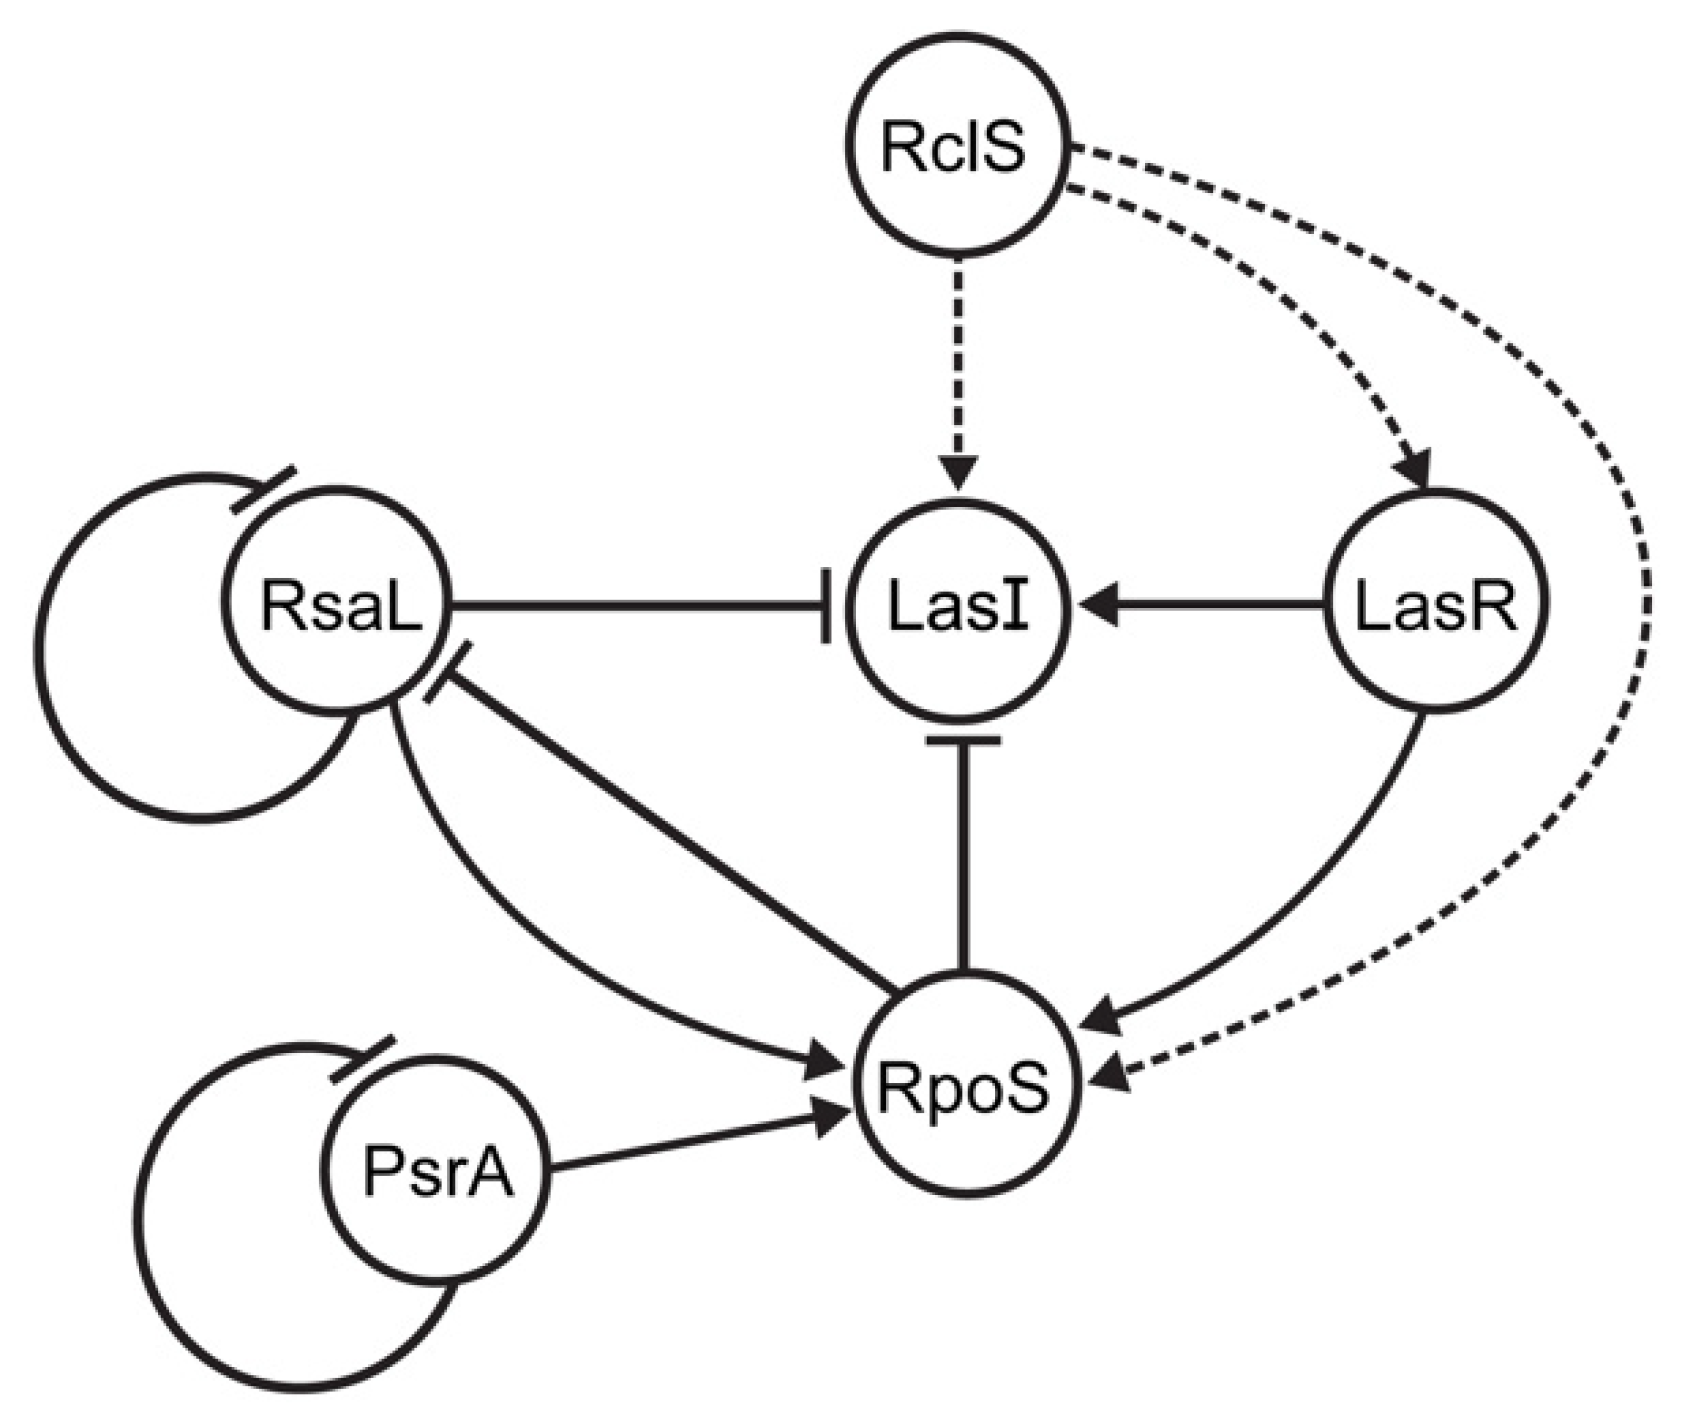
Improved interconnection model of P. capeferrum WCS358 regulatory systems (RclSAR, LasIR and RpoS) in stationary growth phase (improvement of model proposed by Bertani and Venturi (2004) [16], adapted with permission). Triggering of signal transduction pathway starting with RclS activation leads to increased expression of the lasI, lasR (this study) and rpoS genes [7]. Gene regulation network between RpoS, LasIR (PpuIR), RsaL and PsrA proteins were described in previous study [16]. Dashed lines indicate indirect gene regulation by RclS sensor kinase.
Figure 8.
Improved interconnection model of P. capeferrum WCS358 regulatory systems (RclSAR, LasIR and RpoS) in stationary growth phase (improvement of model proposed by Bertani and Venturi (2004) [16], adapted with permission). Triggering of signal transduction pathway starting with RclS activation leads to increased expression of the lasI, lasR (this study) and rpoS genes [7]. Gene regulation network between RpoS, LasIR (PpuIR), RsaL and PsrA proteins were described in previous study [16]. Dashed lines indicate indirect gene regulation by RclS sensor kinase.

Table 1.
Summary of RNA-seq data.
| Samples | wt1 | mut1 | wt2 | mut2 |
|---|---|---|---|---|
| Raw reads | 7,982,150 | 11,145,045 | 7,978,294 | 11,921,075 |
| Clean reads | 7,940,628 | 11,117,800 | 7,965,543 | 11,895,759 |
| Q20 (%) | 98.42 | 98.37 | 98.42 | 98.46 |
| Q30 (%) | 95.24 | 95.11 | 95.14 | 95.22 |
| GC content (%) | 60.96 | 57.76 | 55.87 | 55.73 |
| Total mapped (%) | 97.84 | 98.79 | 98.87 | 99.02 |
| Uniquely mapped (%) | 96.27 | 98.00 | 98.17 | 98.41 |
Table 2.
Antimicrobial susceptibility profiles of WCS358 wild type and ΔrclS mutant.
| Antibiotic | MIC (μg/mL) | |
|---|---|---|
| Wt | Mut | |
| Ampicillin | >800 | >800 |
| Ceftazidime | 5 | 10 |
| Chloramphenicol | 80 | 80 |
| Erythromycin | 800 | 800 |
| Gentamicin | 5 | 2.5 |
| Novobiocin | 800 | 400 |
| Levofloxacine | 1.25 | 0.625 |
| Tetracycline | 10 | 5 |
Publisher’s Note: MDPI stays neutral with regard to jurisdictional claims in published maps and institutional affiliations. |
© 2022 by the authors. Licensee MDPI, Basel, Switzerland. This article is an open access article distributed under the terms and conditions of the Creative Commons Attribution (CC BY) license (https://creativecommons.org/licenses/by/4.0/).
Share and Cite
MDPI and ACS Style
Novović, K.; Malešević, M.; Dinić, M.; Gardijan, L.; Kojić, M.; Jovčić, B. RclS Sensor Kinase Modulates Virulence of Pseudomonas capeferrum. Int. J. Mol. Sci. 2022, 23, 8232. https://doi.org/10.3390/ijms23158232
AMA Style
Novović K, Malešević M, Dinić M, Gardijan L, Kojić M, Jovčić B. RclS Sensor Kinase Modulates Virulence of Pseudomonas capeferrum. International Journal of Molecular Sciences. 2022; 23(15):8232. https://doi.org/10.3390/ijms23158232
Chicago/Turabian StyleNovović, Katarina, Milka Malešević, Miroslav Dinić, Lazar Gardijan, Milan Kojić, and Branko Jovčić. 2022. "RclS Sensor Kinase Modulates Virulence of Pseudomonas capeferrum" International Journal of Molecular Sciences 23, no. 15: 8232. https://doi.org/10.3390/ijms23158232
Note that from the first issue of 2016, this journal uses article numbers instead of page numbers. See further details here.