Article

Chronic Trazodone and Citalopram Treatments Increase Trophic Factor and Circadian Rhythm Gene Expression in Rat Brain Regions Relevant for Antidepressant Efficacy

Department of Pharmacy and Biotechnology, Alma Mater Studiorum University of Bologna, 40126 Bologna, Italy
*
Authors to whom correspondence should be addressed.
These authors contributed equally to this work.
Int. J. Mol. Sci. 2022, 23(22), 14041; https://doi.org/10.3390/ijms232214041
Submission received: 28 September 2022 / Revised: 8 November 2022 / Accepted: 11 November 2022 / Published: 14 November 2022
(This article belongs to the Special Issue State-of-the-Art Molecular Neurobiology in Italy)

Abstract

:
Trazodone is an efficacious atypical antidepressant acting both as an SSRI and a 5HT2A and 5HT2C antagonist. Antagonism to H1-histaminergic and alpha1-adrenergic receptors is responsible for a sleep-promoting action. We studied long-term gene expression modulations induced by chronic trazodone to investigate the molecular underpinning of trazodone efficacy. Rats received acute or chronic treatment with trazodone or citalopram. mRNA expression of growth factor and circadian rhythm genes was evaluated by qPCR in the prefrontal cortex (PFCx), hippocampus, Nucleus Accumbens (NAc), amygdala, and hypothalamus. CREB levels and phosphorylation state were evaluated using Western blotting. BDNF levels were significantly increased in PFCx and hippocampus by trazodone and in the NAc and hypothalamus by citalopram. Likewise, TrkB receptor levels augmented in the PFCx after trazodone and in the amygdala after citalopram. FGF-2 and FGFR2 levels were higher after trazodone in the PFCx. The CREB phosphorylation state was increased by chronic trazodone in the PFCx, hippocampus, and hypothalamus. Bmal1 and Per1 were increased by both antidepressants after acute and chronic treatments, while Per2 levels were specifically augmented by chronic trazodone in the PFCx and NAc, and by citalopram in the PFCx, amygdala, and NAc. These findings show that trazodone affects the expression of neurotrophic factors involved in antidepressant responses and alters circadian rhythm genes implicated in the pathophysiology of depression, thus shedding light on trazodone’s molecular mechanism of action.

1. Introduction

Trazodone is an efficacious antidepressant available for the treatment of major depressive disorder (MDD) with or without anxiety since the 1970s [1,2,3]. The efficacy is based on more than one mechanism of action, and the pharmacological profile has not been completely understood until now. Trazodone can inhibit serotonin transporters similarly to serotonin-selective re-uptake inhibitors (SSRIs). In addition, it belongs to the first dual acting antidepressants by also binding to 5HT2A and 5HT2C receptors with an antagonist profile [1,2,4]. Trazodone’s binding affinity for 5HT2A receptors is much higher in comparison with binding affinity for serotonin transporters, therefore at low doses the latter may not be adequately targeted [1]. Blocking of 5HT2B and 5HT1D also contribute to trazodone efficacy [3]. Trazodone actions on 5HT1A receptors and serotonin transporters are suggested to generate a synergistic effect, which potentiates antidepressant activity [4,5,6], possibly triggering a faster onset [7]. At antidepressant doses, no effects on cholinergic signalling are reported [1,3]. Moreover, trazodone is converted to an active metabolite endowed with agonistic properties for several serotonin receptors [1]. Furthermore, trazodone acts as an antagonist to H1 histaminergic receptors and alpha 1 adrenergic receptors. This profile is considered responsible for trazodone efficacy as a sleep-inducing agent. At low doses (100 mg) the sedative effect prevails, whereas higher doses (300 mg) are required for antidepressant efficacy [4,8].
In major depressive disorder, trazodone is effective in controlling most symptoms associated with the disease, such as anhedonia, feelings of sadness and hopelessness, low energy levels, and suicidal thoughts [2,3,6,9,10,11]. Tolerability is comparable to other second generation antidepressants [2,5,6,10]. However, characteristically beneficial effects have been demonstrated for trazodone by regularizing sleep parameters [3,12]. In addition, it is reported to be used as adjunct therapy to counteract insomnia, anxiety, and sexual dysfunction associated with SSRI administration [2,5]. Efficacy in insomnia has caused its widespread off-label use as hypnotic agent, especially in the presence of psychiatric or neurological disorders [2,3,5,13]. The effectiveness in improving sleep parameters in the presence of sleep disorders has been shown in Alzheimer’s disease patients [14], in association with delayed cognitive decline [15]. However, increased risk of suicide attempts has been reported for this indication [16].
Besides its therapeutic indication as antidepressant, trazodone is also effective in anxiety disorders such as generalised anxiety disorder, panic disorder, and post-traumatic stress disorder; in obsessive-compulsive disorder; in eating disorders; in substance use disorders; in pain conditions; and in sexual disorders [2,5,9,17].
The clinical response to SSRI and tricyclic antidepressants is reported to require a therapeutic latency period lasting 3–4 weeks before therapeutic benefits are perceived. Likewise, although trazodone inhibitory and antagonistic effects on transporters and neurotransmitter receptors happen within minutes of administration, antidepressant efficacy requires longer timelines. Therefore, it is assumed that long-term molecular adaptations in cellular pathways downstream to receptor binding are necessary to promote clinical responses. Differently from other antidepressants [18,19,20,21,22], very few studies investigated molecular changes caused by trazodone in brain regions involved in depressive symptoms.
Over the past 20 years, a wealth of research demonstrated a link between decreased neurotrophic factors in brain regions involved in limbic regions regulating mood and cognition in association with stress exposure and depression, while antidepressants could reverse these effects [23]. A most prominent role has been demonstrated for BDNF and its receptor TrkB [23]. Compelling evidence demonstrated a crucial role for BDNF signalling in different central nervous system disorders [24,25,26], including major depression, with reduced brain levels in depressive patients’ brains and peripheral tissues [20,27]. Moreover, increased BDNF expression is required to mediate efficacy of all available antidepressant therapies, both as medicines and as electroconvulsive treatment [20,27,28]. Within the signalling pathways involved in eliciting the antidepressant-mediated neuroplasticity responses required for therapeutic efficacy, a prominent role is exerted by the transcription factor CREB [21]. CREB-dependent transcription is activated when the transcription factor is phosphorylated on Ser133 by several protein kinases, and this phosphorylation is required for activation. Altered CREB phosphorylation after antidepressant treatment has been demonstrated in a region- and drug-dependent manner [21]. In parallel, more recent discoveries revealed a contribution to neuroplastic responses relevant for antidepressant effects by growth factors belonging to the FGF family [29,30,31,32]. Among those, decreased FGF-2 and FGFR2 expression were found in post-mortem brain of individuals with MDD [31]. In addition, antidepressant treatments can increase FGF-2 levels in cortical neurons in rats and in cultured cortical astrocytes [33,34].
Disruption of the circadian rhythm and derived sleep disturbances are reported to exert a significant influence to precipitate the onset of major depression disease episodes [35,36,37]. Indeed, the ability to rapidly modulate and reset the circadian clock has been associated to the rapid antidepressant response resulting from sleep deprivation or ketamine administration [38,39]. Bmal1, Per1, and Per2 belong to the transcriptional–translational feedback loop driving the 24 h rhythmicity of the molecular clock in cells [35]. Altered expression has been reported in peripheral blood cells of MDD patients following escitalopram treatment [40].
The objective of this investigation was to study long-term gene expression modulations induced by chronic trazodone treatment. The findings aim to increase the comprehension of the specific profile of this atypical and valuable antidepressant by revealing molecular mechanisms involved in its antidepressant efficacy. Molecular changes induced by trazodone have been compared with those exerted by citalopram, a typical SSRI agent, to collect data on the neurobiological effects specifically belonging to trazodone in addition to the common ability to bind and inhibit the serotonin transporter.

2. Results

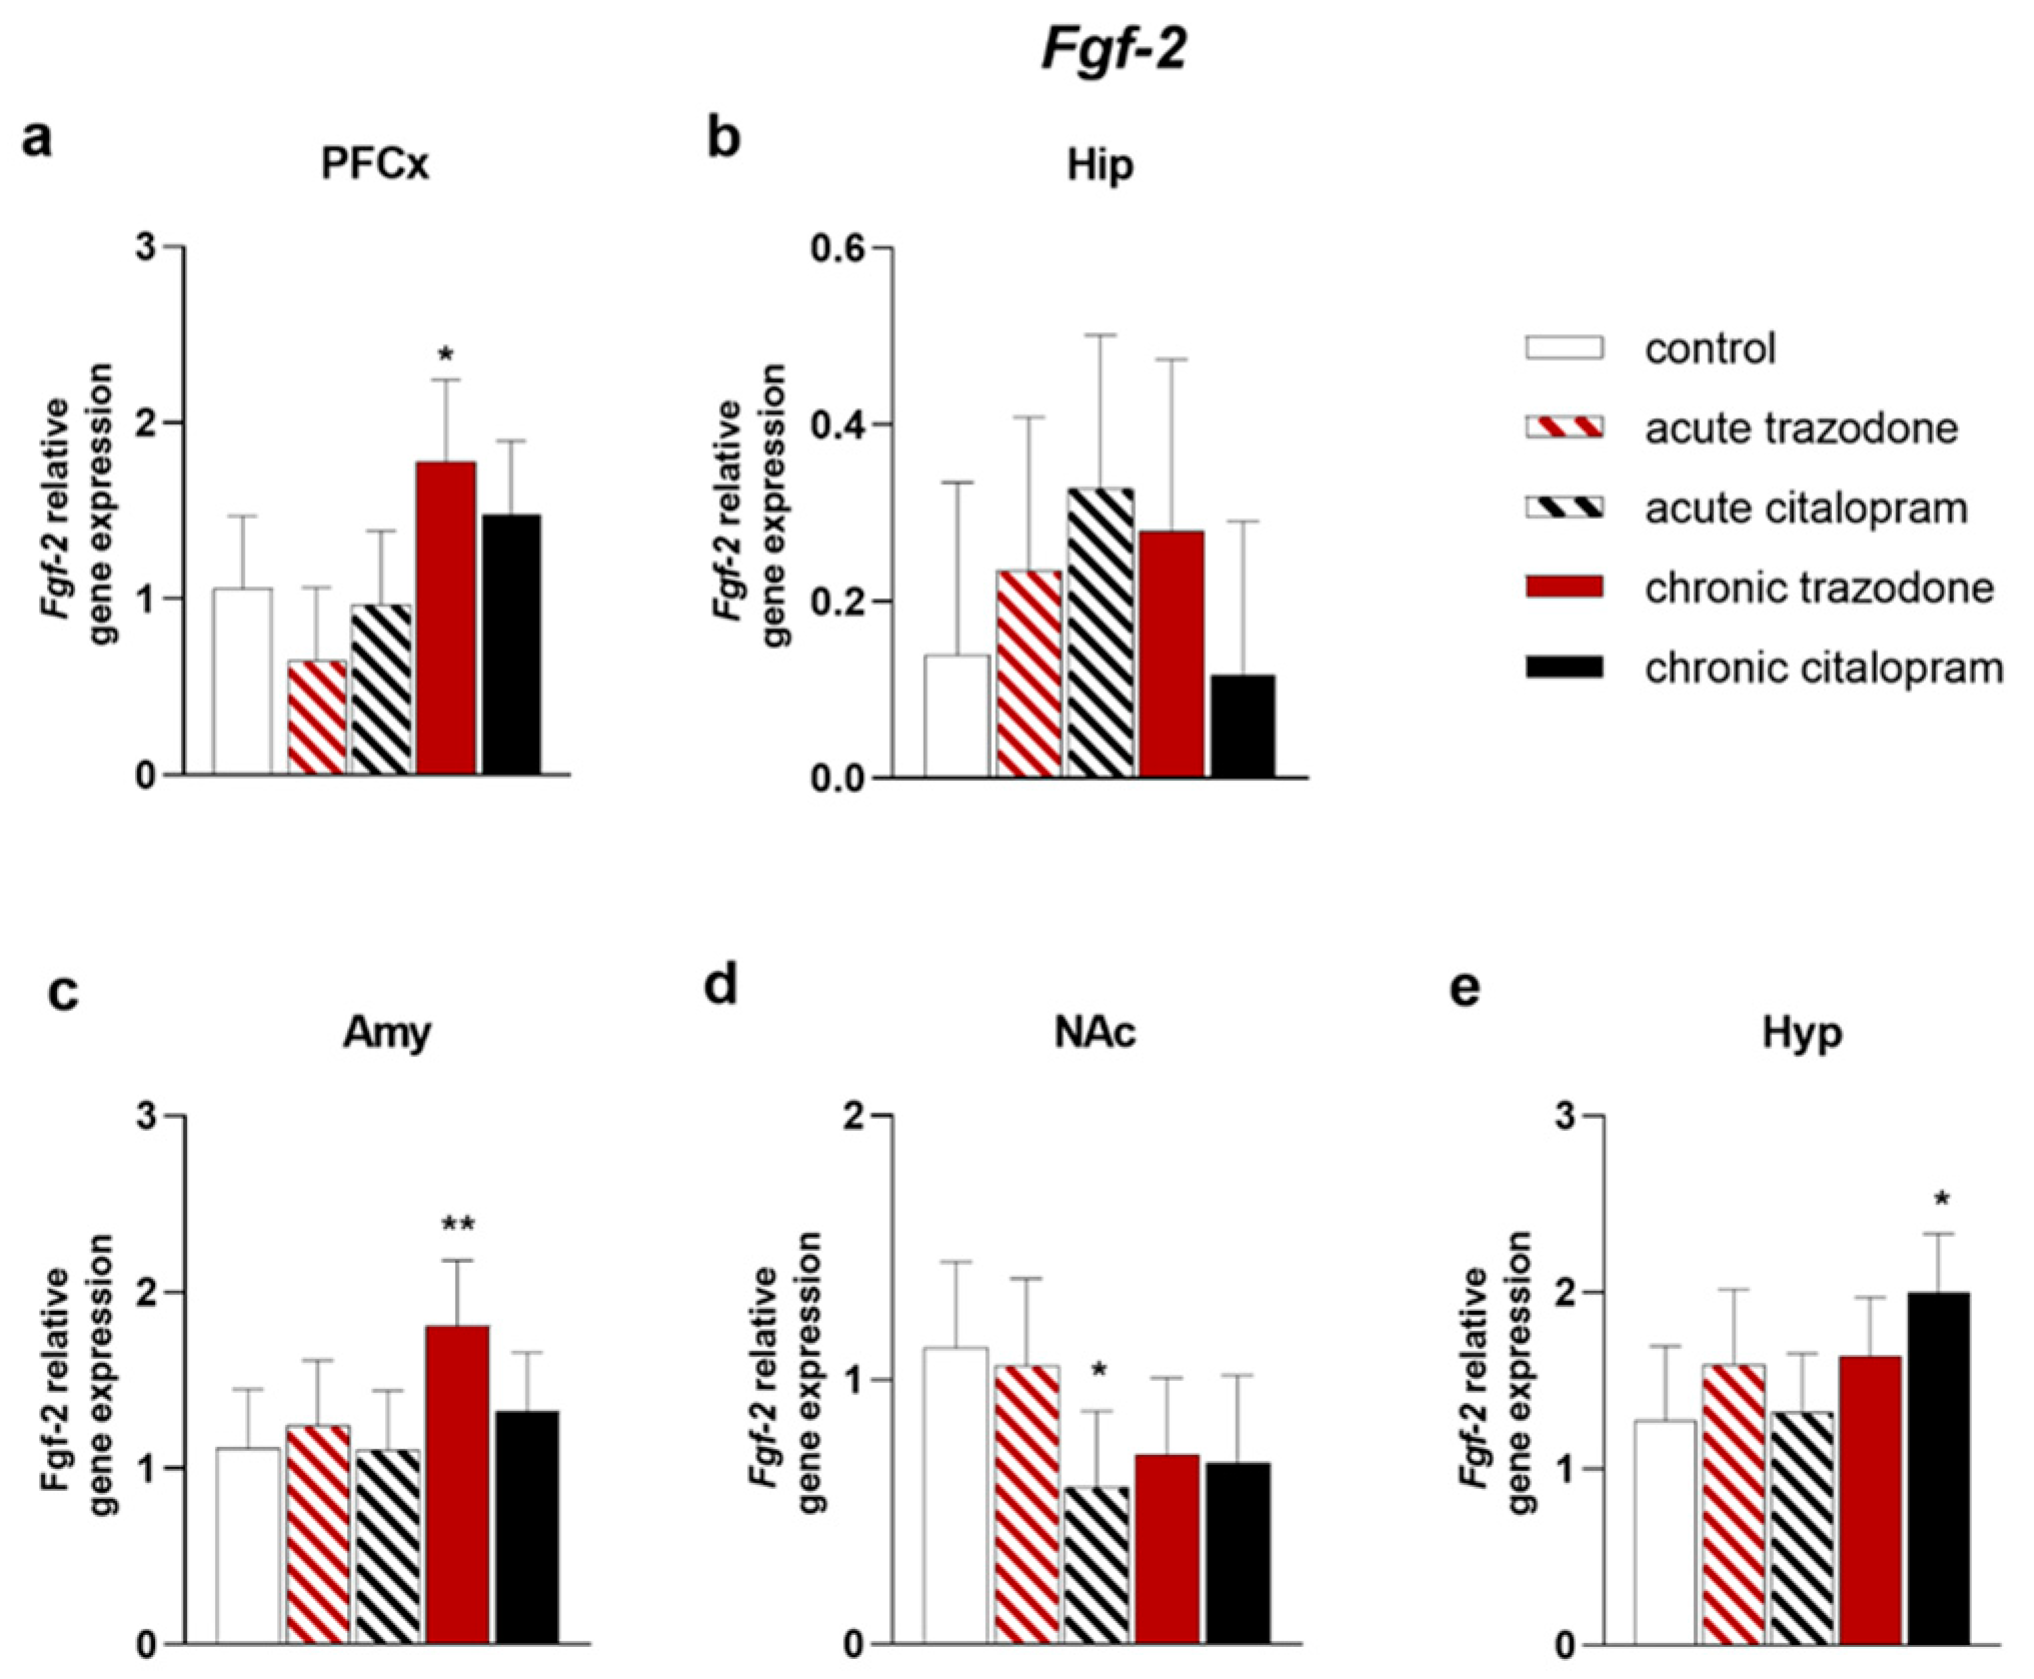
2.1. Trophic Factors

The expression of trophic factor genes involved in antidepressant efficacy and of their respective receptors was evaluated after treatment with chronic or acute trazodone or citalopram in comparison with control levels in brain regions relevant to MDD. Bdnf levels were significantly increased in the pre-frontal cortex (PFCx) (p = 0.042, Figure 1a) and in the hippocampus (Hip) (p = 0.0068, Figure 1b) after chronic trazodone. Chronic citalopram increased Bdnf expression in the Nucleus Accumbens (NAc) (p = 0.0018, Figure 1d) and in the hypothalamus (Hyp) (p = 0.012, Figure 1e). In the Hyp, Bdnf expression was similarly augmented by acute citalopram as well (p = 0.023, Figure 1e). Levels of the BDNF receptor TrkB were significantly higher in the PFCx of rats treated with chronic trazodone (p = 0.0025, Figure 2a); a trend towards decrease was observed in the Hip (p = 0.086, Figure 2b) and towards increase in the amygdala (Amy) (p = 0.058, Figure 2c). Chronic citalopram increased TrkB expression in the Amy (p = 0.019, Figure 2c).
After chronic trazodone, Fgf-2 levels were higher in the PFCx (p = 0.025, Figure 3a) and Amy (p = 0.0093, Figure 3c); a trend for decrease was detected in the NAc (p = 0.070, Figure 3d). Chronic citalopram augmented Fgf-2 expression in the Hyp (p = 0.011, Figure 3e). In contrast, in the NAc, acute citalopram significantly reduced Fgf-2 levels (p = 0.021, Figure 3d), while chronic treatment caused a trend for decrease similar to that observed after trazodone (p = 0.057, Figure 3d). Administration of both chronic trazodone and citalopram increased Fgfr2 levels in the PFCx (p = 0.037 for trazodone and p = 0.017 for citalopram, Figure 4a). A trend for reduced levels was detected in the Hyp after acute trazodone administration (p = 0.064). No significant changes were observed in other brain areas (Figure 4).
Creb expression was augmented by chronic citalopram treatment in the Amy (p = 0.048, Figure 5c), while no significant alterations were revealed in other brain regions (Figure 5). No significant changes were observed after trazodone administration (Figure 5). In contrast, the CREB phosphorylation state was significantly increased by chronic trazodone in the PFCx (p = 0.048, Figure 6a), Hip (p = 0.0059, Figure 6b), and Hyp (p = 0.017). CREB protein levels were not altered in any tested condition (Supplementary Figure S1).

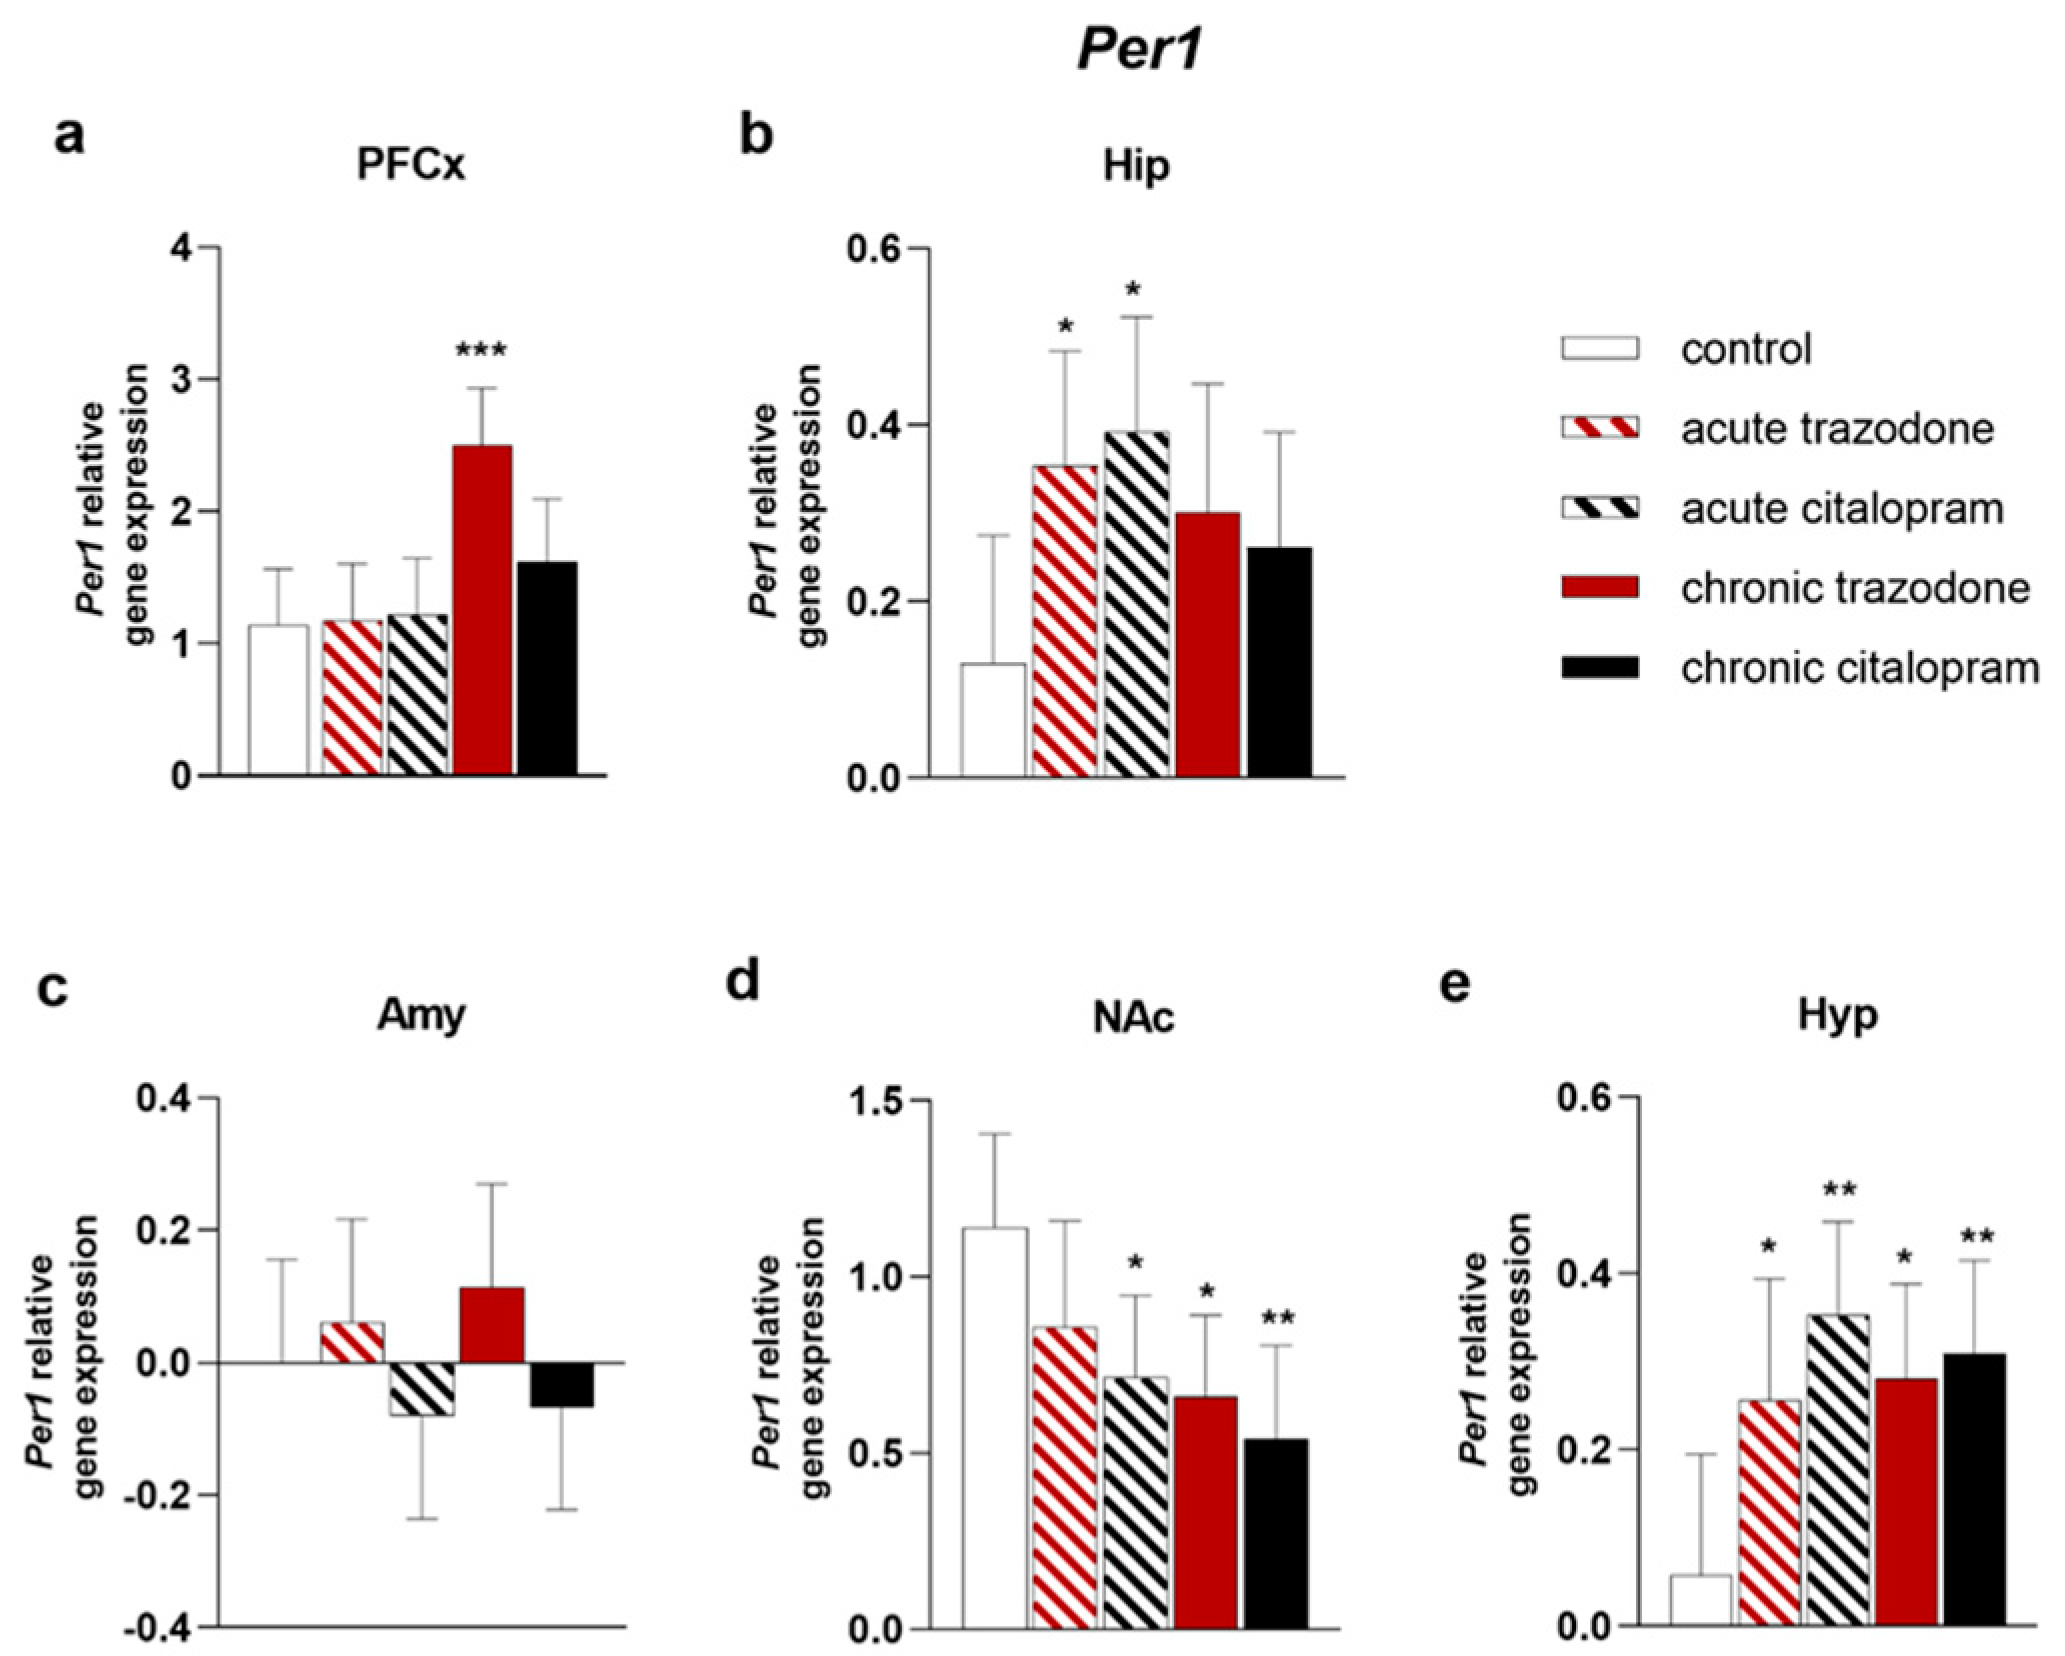
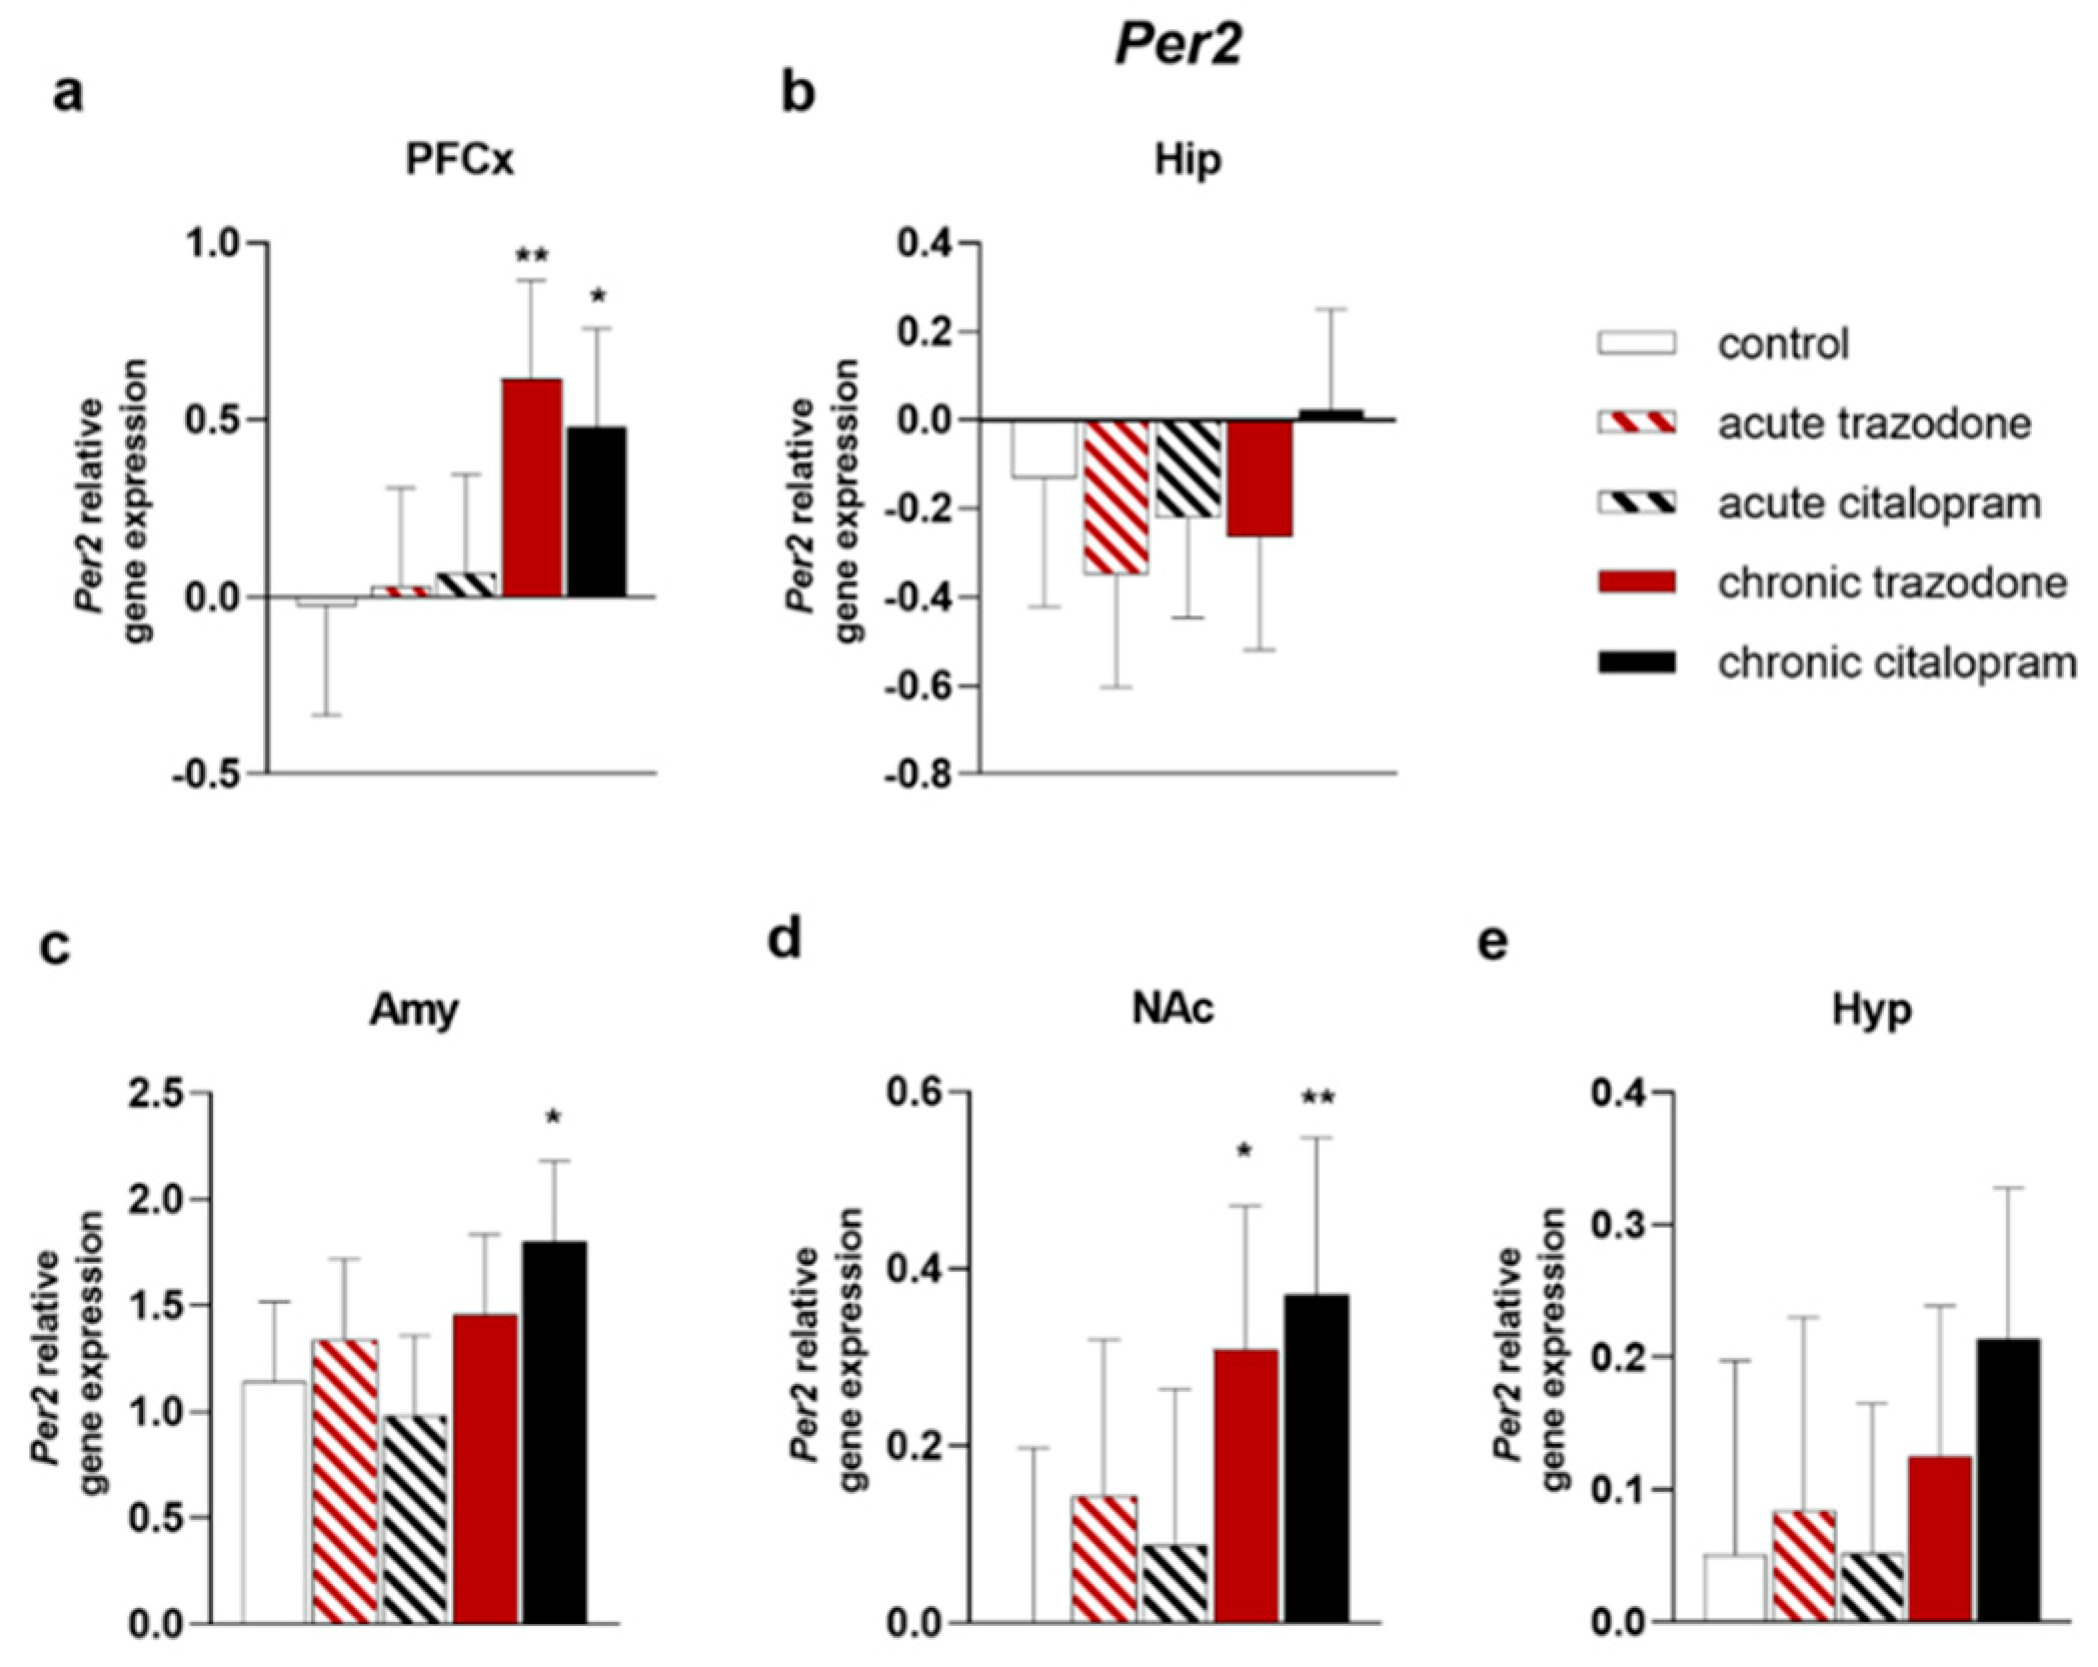
2.2. Circadian Rhythm Genes

Next, we analysed the impact of antidepressant treatments on the expression of circadian rhythm genes. In PFCx, both acute and chronic citalopram treatment augmented Bmal1 mRNA levels (p = 0.048, p = 0.0026, respectively; Figure 7a). Likewise, acute and chronic trazodone administrations increased Bmal1 levels (p = 0.016; p = 0.054, Figure 7a). Similarly, in the Hip, citalopram both acute and chronic treatments raised Bmal1 mRNA (p = 0.0086; p = 0.054, Figure 7b). Trazodone reproduced a similar pattern, with chronic treatment causing a significant increase (p = 0.038, Figure 7b). In contrast, Bmal1 reduction was observed in the NAc after acute or chronic trazodone (p = 0.0013; p = 0.062, Figure 7d) or after chronic citalopram (p = 0.012, Figure 7d). In the Hyp a specific response to citalopram was detected, with both acute and chronic treatments triggering increased Bmal1 levels (p = 0.017; p = 0.0076, Figure 7e).
Chronic trazodone treatment increased Per1 in the PFCx (p = 0.0001, Figure 8a). In the Hip, significant alterations were only detected after acute treatments; both antidepressants augmented Per1 levels (trazodone p = 0.026; citalopram p = 0.011, Figure 8b). Resembling Bmal1, in the NAc reduced Per1 levels were induced by antidepressant treatments (acute and chronic citalopram: p = 0.021; p = 0.0027, Figure 8d; chronic trazodone: p = 0.010, Figure 8d). In the Hyp, a generalised increase was brought about by antidepressant administration, with all treatments causing higher Per1 levels (acute trazodone p = 0.036; chronic trazodone p = 0.015; acute citalopram p = 0.0024; chronic citalopram p = 0.0075, Figure 8e).
In contrast, Per2 appeared to specifically respond to chronic treatments. In the PFCx, both chronic trazodone and citalopram induced Per2 increases (p = 0.0046; p = 0.021, Figure 9a), whereas in the Amy only chronic citalopram augmented Per2 (p = 0.018, Figure 9c). Like the PFCx, in the NAc, chronic trazodone and citalopram triggered higher Per2 levels (p = 0.020; p = 0.0086, Figure 9d).

2.3. Multivariate Analysis

As a further step, we carried out a multivariate analysis including all gene and protein levels measured in all brain regions after chronic antidepressant treatments and controls. Principal Components Analysis showed that a strong separation based on pharmacological treatment (chronic trazodone or chronic citalopram) was achieved by Principal Component 1 and Principal Component 2 (Figure 10). Variables providing stronger contributions to the Principal Component 1 were hypothalamic levels of Bmal1, Fgf-2, Per1, Per2, Creb, and TrkB, in addition to NAc levels of Per1, Bmal1, and Fgf-2 (Supplementary Table S1).

3. Discussion

This study aimed at contributing to the comprehension of the neurobiological basis of trazodone efficacy by studying molecular changes engendered by chronic treatment in brain regions relevant for MDD pathophysiology. Two neurotrophic factors involved in the regulation of neural plasticity responses relevant for antidepressant efficacy were our first object of investigation. Subsequently, the impact on the main regulators of circadian rhythms was examined. Overall, our findings show that trazodone increased neurotrophic factor responses, somehow resembling the effects induced by the classic SSRI citalopram, albeit with a number of gene and brain region specificities, mainly in the direction of a more widespread impact. Moreover, we discovered that both antidepressants could influence circadian genes after both acute and chronic administration. These results suggest that circadian gene modulation may exert a role in resetting circadian rhythms which are often dysregulated in MDD. More specifically, Per2 increase was altered only after chronic antidepressant treatment, implying that this response is possibly associated to therapeutic response. Furthermore, findings from multivariate analysis indicate that antidepressant influence on circadian gene transcription exerted a greater impact than gene expression changes of neurotrophic genes, thus underscoring the relevance of this mechanism for the neurobiological underpinning of the antidepressant response. As a caveat, to strengthen the case for the potential significance of these mechanisms in antidepressant efficacy, further research will be needed in rodent models of disease, since naïve rats were investigated in the present study.
Regarding neurotrophic factors, we found that chronic antidepressant treatments increased Bdnf levels. Compelling evidence shows that this growth factor is implicated in the response to antidepressants. Indeed, antidepressant behaviours are attenuated in transgenic mice bearing Bdnf deletion, whereas antidepressant-like responses are induced by BDNF injection [27,28]. BDNF function in the antidepressant response is linked to its ability to act as a regulator of synaptic plasticity, neuronal function, and survival in the adult brain [19]. Since chronic stress, a known precipitating factor for MDD, is responsible of causing neuronal atrophy in the hippocampal and prefrontal regions, trophic factor activity is deemed essential to counteract these impairments [19,41]. In this framework, the ability to elicit BDNF increase in forebrain regions can be associated with clinical efficacy. Interestingly, fast acting antidepressants are reported to be able to quickly increase BDNF levels, whereas chronic treatments are required for antidepressants generating delayed therapeutic responses [19]. In this study, we observed increased Bdnf expression in the PFCx and Hip after chronic (but not acute) trazodone, whereas citalopram augmented Bdnf in the NAc and Hyp. These results are in line with previous findings for what concerns citalopram, where generally no effects on forebrain BDNF were detected when treatments were carried out in naïve animals [42,43,44,45,46]. Contrasting reports described BDNF increase versus no change in the Hip after a definitely higher dose (10 mg/kg escitalopram, which is citalopram’s therapeutically active enantiomer) [47,48]. Citalopram’s influence typically unfolds as the ability to reverse stress-induced BDNF decreases in rodent models of depression based on stress exposure [43,46,49,50,51]. Similar patterns were observed for the BDNF protein [44,52,53,54]. Regarding trazodone, no previous data are available, except for a reported increase in BDNF levels induced by trazodone in human neural stem cells [55]. Although suggesting a similar ability to elicit neurotrophic responses, these results were derived in too different a model to allow a meaningful comparison.
BDNF receptor TrkB expression was also increased by chronic trazodone in the PFCx, whereas chronic citalopram augmented it in the Amy. TrkB has been implicated in antidepressant responses in pre-clinical models, both in consequence of BDNF-mediated activation, and as a result of direct binding and activation by the antidepressants themselves [56,57,58]. The most relevant brain areas implicated in this putative efficacy-related response are forebrain regions [28], thus suggesting a potential impact of trazodone-induced TrkB rise. Citalopram-stimulated increase in the Amy and a lack of effect in the Hip agree with previous data [48,59], whereas no prior information has been available until now about trazodone.
In addition to neurotrophins, dysregulations in Fibroblast Growth Factors pathways have more recently been involved in the neurobiological underpinnings of MDD [30]. FGFs have been firstly implied in neural development, but a crucial role in neurogenesis and in neuroplasticity in adulthood was subsequently discovered, suggesting neuromodulatory functions in anxiety-like and depression-like behaviours [29,30,31]. Indeed, recent studies in humans revealed altered levels of FGF family members in MDD patients, both in blood and in brain [32]. Moreover, blood FGF-2 protein levels contribute to a peripheral biomarker panel of escitalopram efficacy in MDD patients [60]. However, although available data point to the importance of this family of growth factors in MDD, the results are inconsistent and a clear comprehension of its role in MDD pathophysiology is still missing. Nevertheless, there is evidence that FGF-2 levels are decreased in MDD and increased by antidepressants [30,34,61,62] and that FGF-2 elicits antidepressant-like behaviours [63,64]. In line with these findings, we observed that both trazodone and citalopram were able to increase the expression of Fgf-2 and Fgfr2 in the PFCx, Amy, or Hyp.
To investigate a potential mechanism of the increased transcription of trophic factors, we analysed CREB protein phosphorylation on Ser133, which is required for CREB activity as a transcription factor. CREB-regulated gene expression has been demonstrated to be crucial for neuroplasticity and survival responses critical for antidepressant efficacy [21,65,66]. The detected increased CREB phosphorylation following chronic trazodone is consistent with proposing this mechanism as responsible of trophic factor responses.
Next, we investigated antidepressant influence on circadian genes. We discovered that both trazodone and citalopram augmented circadian gene expression. Although the increase emerged after both acute and chronic treatments for Bmal1 and Per1, only chronic administration affected Per2 expression in the PFCx, NAc, and Amy. A paucity of data exists on antidepressant effects on circadian genes. In depressed patients, escitalopram was able to restore Per2 and Bmal1 mRNA dysregulations in peripheral blood mononuclear cells, whereas Per1 was not affected [40]. In a similar clinical study, ramelteon, a melatonergic agonist antidepressant, could resynchronise altered Per1 and Per2 mRNA levels [67]. In rodent models of depression, dysregulation of circadian gene expression has been observed, with Bmal1 and Per2 as the more affected [68,69,70,71]; normal rhythms could be reinstated after imipramine or melatonin treatment [69,71]. However, no effect could be devised after imipramine treatments in naïve animals [69]. No data are available for other antidepressants, except for modulation by quetiapine, which is used as add-on therapy in MDD, although belonging to the class of antipsychotic agents [72]. Regarding trazodone, to our knowledge this is the first study reporting modifications of circadian genes. In line with our findings, clinical data in Alzheimer’s disease patients showed significant improvement in relative rhythm amplitude after two weeks of trazodone use [73].
In conclusion, trazodone is an efficacious antidepressant with a long clinical history and a specific therapeutic profile. Since its discovery, few data were generated about its long-term effect on brain transcriptional frame. These findings contribute to shed light on trazodone molecular mechanism of action, suggesting that an impact on growth factors and on circadian rhythm genes may contribute to its efficacy.

4. Materials and Methods

4.1. Animals

Male (n = 32) Sprague–Dawley rats (150 g body weight) were purchased from Envigo, Italy. Rats were housed 3–4/cage at a constant room temperature of 21 ± 1 °C and maintained on a 12:12 h light/dark cycle with lights on at 7.30 a.m. with freely available food and water. The experiment started one week after arrival to let the animals acclimatise. The Italian Health Ministry Ethical Committee for Protection of Animals approved the study (approval number: 6/2018-PR) and all procedures were conducted in accordance with the European Communities Council Directive 2010/63/EU and the national D.Lgs 4 March 2014, no. 26. Efforts were performed to reduce the number of animals and minimise their suffering. This study is compliant with ARRIVE guidelines [74].

4.2. Treatments

The experimental design encompassed five groups (n = 6–7 rats/group) treated by intraperitoneal route. Rats receiving chronic treatments were administered either 28 mg/kg trazodone (Merck Life Science, Milano, Italy) or 6 mg/kg citalopram (Elopram, Lundbeck Italia, Padova, Italy) for 21 days in 2 mL/kg saline solution (Supplementary Figure S3). Doses were selected to correspond [75] to upper limits of human antidepressant therapy ranges (300 mg daily for trazodone and 40 mg daily for citalopram). Acute treatments were carried out by administering saline for 20 days followed by a single administration of either 28 mg/kg trazodone or 6 mg/kg citalopram on day 21st. Controls were treated with saline for 21 days. Rats were sacrificed by guillotine and brain regions were dissected, immediately frozen in dry ice, and stored at −80 °C.

4.3. Gene Expression

The real-time quantitative PCR experiments were carried out following previously published methods [76], with some modifications. RNA extraction was performed with the Aurum total RNA fatty and fibrous tissue kit (Bio-Rad, Hercules, CA, USA), which includes a DNase I digestion step, following manufacturer’s instructions. RNA levels were quantified by UV absorbance in a NanoDrop 2000c spectrophotometer (Thermo Fisher Scientific, Waltham, MA, USA). cDNA was synthesised from 1 µg RNA using the iScript Advanced cDNA synthesis Kit (Bio-Rad, Hercules, CA, USA). Real-time PCR was performed by Sybr Green technology in a 7900HT Fast Real-Time PCR System (Applied Biosystems, Thermo Fisher Scientific, Waltham, MA, USA) with SSO Advanced Universal SYBR Green Supermix (Bio-Rad, Hercules, CA, USA) in 20 µL according to this protocol: stage 1: 95 °C, 20 s; stage 2: 40 × (95 °C, 3 s; 60 °C, 30 s). Primers were selected using the Primer-BLAST tool from NCBI or from a previous publication [25]. Primers were obtained from Eurofins Italia, Torino, Italy; sequences are displayed in Table 1. Data were analysed using the Delta-Delta-Ct method, and were converted to a relative ratio (2−DDCt) for statistical analysis [77] by normalizing to the endogenous reference gene Gapdh, following previous studies [25]. The specificity of amplification products was evaluated by building a dissociation curve in the 60–95 °C range.

4.4. Protein Levels

Dissected brain regions were homogenised in N-Per Neuronal Protein Extraction Reagent (Thermo Fisher Scientific, Waltham, MA, USA) added with Pierce Protease and Phosphatase Inhibitor Mini Tablets (Thermo Fisher Scientific, Waltham, MA, USA) in glass homogenisers, incubated 10 min on ice and centrifuged at 10,000 g for 10 min at 4 °C. Protein concentration was measured on supernatants with the BCA assay kit (Thermo Fisher Scientific, Waltham, MA, USA). Twenty µg proteins were separated on 4–15% precast polyacrylamide gels (Bio-Rad, Hercules, CA, USA) in Mini-Protean Electrophoresis Cells (Bio-Rad, Hercules, CA, USA), transferred on Immun-Blot PVDF membranes (Bio-Rad, Hercules, CA, USA) in Mini Trans-Blot Transfer Cells (Bio-Rad, Hercules, CA, USA), and blocked in 5% skimmed milk in 0.1% Tween20 Tris-buffered saline (Merck). Incubation with primary antibodies was carried out overnight at 4 °C (Table 2); membranes were washed, incubated with the secondary antibody (Table 2), and revealed and quantified by enhanced chemiluminescence (Clarity ECL Substrate, Bio-Rad, Hercules, CA, USA) in a ChemiDoc instrument (Bio-Rad, Hercules, CA, USA) using the Quantity One 1-D Analysis software (Bio-Rad, Hercules, CA, USA).

4.5. Statistical Analysis

Group size was 6–7 rats/group. The results were analysed using a 1-way ANOVA approach with treatment as the factor of interest, followed by Planned Comparisons of the predicted means. The data were log-transformed when needed in order to stabilise the variance and satisfy the parametric assumptions. An additional blocking factor Plate was also included in the model to account for any plate-to-plate variability as samples were analysed in different plates using a complete block design [78]; the same approach was adopted for Western blot gels. The data are shown as least square predicted means with 95% confidence intervals. A value of p < 0.05 was considered statistically significant. Multivariate analysis was carried out with Principal Components Analysis (PCA) with the objective of explaining most variability with a reduced number of components identified in unsupervised manner. All analyses were performed using the InVivoStat v4.4.0 software [78,79].

Supplementary Materials

The following supporting information can be downloaded at: https://www.mdpi.com/article/10.3390/ijms232214041/s1.

Author Contributions

Conceptualization, L.C. and P.R.; formal analysis, L.C.; investigation, L.C., L.R., F.F.C., S.S. and S.C.; writing—original draft preparation, L.C.; writing—review and editing, L.C., L.R., F.F.C., S.S., S.C. and P.R.; visualization, L.R.; funding acquisition, L.C., S.C. and P.R. All authors have read and agreed to the published version of the manuscript.

Funding

This research was funded by the Italian Ministry of University and Research (FFABR2017) and Alma Mater Studiorum University of Bologna (RFO18) to L.C., to P.R. and to S.C.

Institutional Review Board Statement

The animal study protocol was approved by the Italian Health Ministry Ethical Committee for Protection of Animals (approval number: 6/2018-PR).

Data Availability Statement

Data is contained within the article or Supplementary Material.

Acknowledgments

We thank Barbara Monti for helpful suggestions on antibody choice.

Conflicts of Interest

The authors declare no conflict of interest. The funders had no role in the design of the study; in the collection, analyses, or interpretation of data; in the writing of the manuscript; or in the decision to publish the results.

References

  1. Stahl, S.M. Mechanism of action of trazodone: A multifunctional drug. CNS Spectr. 2009, 14, 536–546. [Google Scholar] [CrossRef] [PubMed]
  2. Khouzam, H.R. A review of trazodone use in psychiatric and medical conditions. Postgrad. Med. 2017, 129, 140–148. [Google Scholar] [CrossRef] [PubMed]
  3. Cuomo, A.; Bianchetti, A.; Cagnin, A.; De Berardis, D.; Di Fazio, I.; Incalzi, R.A.; Marra, C.; Neviani, F.; Laurenzi, P.F.; Nicoletti, F. Trazodone: A multifunctional antidepressant. evaluation of its properties and real-world use. J. Gerontol. Geriatr. 2021, 69, 120–129. [Google Scholar] [CrossRef]
  4. Fagiolini, A.; Comandini, A.; Dell’Osso, M.C.; Kasper, S. Rediscovering trazodone for the treatment of major depressive disorder. CNS Drugs 2012, 26, 1033–1049. [Google Scholar] [CrossRef] [PubMed] [Green Version]
  5. Bossini, L.; Coluccia, A.; Casolaro, I.; Benbow, J.; Amodeo, G.; De Giorgi, R.; Fagiolini, A. Off-Label Trazodone Prescription: Evidence, Benefits and Risks. Curr. Pharm. Des. 2015, 21, 3343–3351. [Google Scholar] [CrossRef]
  6. Goracci, A.; Forgione, R.N.; De Giorgi, R.; Coluccia, A.; Cuomo, A.; Fagiolini, A. Practical guidance for prescribing trazodone extended-release in major depression. Expert Opin. Pharmacother. 2016, 17, 433–441. [Google Scholar] [CrossRef]
  7. Opal, M.D.; Klenotich, S.C.; Morais, M.; Bessa, J.; Winkle, J.; Doukas, D.; Kay, L.J.; Sousa, N.; Dulawa, S.M. Serotonin 2C receptor antagonists induce fast-onset antidepressant effects. Mol. Psychiatry 2014, 19, 1106–1114. [Google Scholar] [CrossRef]
  8. Sheehan, D.V.; Croft, H.A.; Gossen, E.R.; Levitt, R.J.; Brullé, C.; Bouchard, S.; Rozova, A. Extended-release trazodone in major depressive disorder: A randomized, double-blind, placebo-controlled study. Psychiatry 2009, 6, 20–33. [Google Scholar]
  9. Bossini, L.; Casolaro, I.; Koukouna, D.; Cecchini, F.; Fagiolini, A. Off-label uses of trazodone: A review. Expert Opin. Pharmacother. 2012, 13, 1707–1717. [Google Scholar] [CrossRef]
  10. Cipriani, A.; Furukawa, T.A.; Salanti, G.; Chaimani, A.; Atkinson, L.Z.; Ogawa, Y.; Leucht, S.; Ruhe, H.G.; Turner, E.H.; Higgins, J.P.T.; et al. Comparative efficacy and acceptability of 21 antidepressant drugs for the acute treatment of adults with major depressive disorder: A systematic review and network meta-analysis. Lancet 2018, 391, 1357–1366. [Google Scholar] [CrossRef] [Green Version]
  11. Saletu-Zyhlarz, G.M.; Anderer, P.; Arnold, O.; Saletu, B. Confirmation of the neurophysiologically predicted therapeutic effects of trazodone on its target symptoms depression, anxiety and insomnia by postmarketing clinical studies with a controlled-release formulation in depressed outpatients. Neuropsychobiology 2003, 48, 194–208. [Google Scholar] [CrossRef] [PubMed]
  12. Zheng, Y.; Lv, T.; Wu, J.; Lyu, Y. Trazodone changed the polysomnographic sleep architecture in insomnia disorder: A systematic review and meta-analysis. Sci. Rep. 2022, 12, 14453. [Google Scholar] [CrossRef] [PubMed]
  13. Jaffer, K.Y.; Chang, T.; Vanle, B.; Dang, J.; Steiner, A.J.; Loera, N.; Abdelmesseh, M.; Danovitch, I.; Ishak, W.W. Trazodone for Insomnia: A Systematic Review. Innov. Clin. Neurosci. 2017, 14, 24–34. [Google Scholar] [PubMed]
  14. Camargos, E.F.; Louzada, L.L.; Quintas, J.L.; Naves, J.O.S.; Louzada, F.M.; Nóbrega, O.T. Trazodone improves sleep parameters in Alzheimer disease patients: A randomized, double-blind, and placebo-controlled study. Am. J. Geriatr. Psychiatry 2014, 22, 1565–1574. [Google Scholar] [CrossRef]
  15. La, A.L.; Walsh, C.M.; Neylan, T.C.; Vossel, K.A.; Yaffe, K.; Krystal, A.D.; Miller, B.L.; Karageorgiou, E. Long-Term Trazodone Use and Cognition: A Potential Therapeutic Role for Slow-Wave Sleep Enhancers. J. Alzheimer’s Dis. 2019, 67, 911–921. [Google Scholar] [CrossRef] [Green Version]
  16. Lavigne, J.E.; Hur, K.; Kane, C.; Au, A.; Bishop, T.M.; Pigeon, W.R. Prescription Medications for the Treatment of Insomnia and Risk of Suicide Attempt: A Comparative Safety Study. J. Gen. Intern. Med. 2019, 34, 1554–1563. [Google Scholar] [CrossRef]
  17. Pyke, R.E. Trazodone in Sexual Medicine: Underused and Overdosed? Sex. Med. Rev. 2020, 8, 206–216. [Google Scholar] [CrossRef]
  18. Harmer, C.J.; Duman, R.S.; Cowen, P.J. How do antidepressants work? New perspectives for refining future treatment approaches. Lancet Psychiatry 2017, 4, 409–418. [Google Scholar] [CrossRef] [Green Version]
  19. Duman, R.S.; Deyama, S.; Fogaça, M.V. Role of BDNF in the pathophysiology and treatment of depression: Activity-dependent effects distinguish rapid-acting antidepressants. Eur. J. Neurosci. 2021, 53, 126–139. [Google Scholar] [CrossRef]
  20. Castrén, E.; Kojima, M. Brain-derived neurotrophic factor in mood disorders and antidepressant treatments. Neurobiol. Dis. 2017, 97, 119–126. [Google Scholar] [CrossRef] [Green Version]
  21. Tardito, D.; Perez, J.; Tiraboschi, E.; Musazzi, L.; Racagni, G.; Popoli, M. Signaling pathways regulating gene expression, neuroplasticity, and neurotrophic mechanisms in the action of antidepressants: A critical overview. Pharmacol. Rev. 2006, 58, 115–134. [Google Scholar] [CrossRef]
  22. Carboni, L.; Nguyen, T.-P.; Caberlotto, L. Systems biology integration of proteomic data in rodent models of depression reveals involvement of the immune response and glutamatergic signaling. Proteom. Clin. Appl. 2016, 10, 1254–1263. [Google Scholar] [CrossRef] [PubMed]
  23. Duman, R.S.; Monteggia, L.M. A Neurotrophic Model for Stress-Related Mood Disorders. Biol. Psychiatry 2006, 59, 1116–1127. [Google Scholar] [CrossRef]
  24. Caputi, F.F.; Rullo, L.; Stamatakos, S.; Candeletti, S.; Romualdi, P. Modulation of the Negative Affective Dimension of Pain: Focus on Selected Neuropeptidergic System Contributions. Int. J. Mol. Sci. 2019, 20, 4010. [Google Scholar] [CrossRef] [Green Version]
  25. Caputi, F.F.; Stopponi, S.; Rullo, L.; Palmisano, M.; Ubaldi, M.; Candeletti, S.; Ciccocioppo, R.; Romualdi, P. Dysregulation of Nociceptin/Orphanin FQ and Dynorphin Systems in the Extended Amygdala of Alcohol Preferring Marchigian Sardinian (msP) Rats. Int. J. Mol. Sci. 2021, 22, 2448. [Google Scholar] [CrossRef]
  26. Carboni, L.; Lattanzio, F.; Candeletti, S.; Porcellini, E.; Raschi, E.; Licastro, F.; Romualdi, P. Peripheral leukocyte expression of the potential biomarker proteins Bdnf, Sirt1, and Psen1 is not regulated by promoter methylation in Alzheimer’s disease patients. Neurosci. Lett. 2015, 605, 44–48. [Google Scholar] [CrossRef] [PubMed]
  27. Castrén, E.; Monteggia, L.M. Brain-Derived Neurotrophic Factor Signaling in Depression and Antidepressant Action. Biol. Psychiatry 2021, 90, 128–136. [Google Scholar] [CrossRef]
  28. Björkholm, C.; Monteggia, L.M. BDNF—A key transducer of antidepressant effects. Neuropharmacology 2016, 102, 72–79. [Google Scholar] [CrossRef] [Green Version]
  29. Aurbach, E.L.; Inui, E.G.; Turner, C.A.; Hagenauer, M.H.; Prater, K.E.; Li, J.Z.; Absher, D.; Shah, N.; Blandino, P.; Bunney, W.E.; et al. Fibroblast growth factor 9 is a novel modulator of negative affect. Proc. Natl. Acad. Sci. USA 2015, 112, 11953–11958. [Google Scholar] [CrossRef] [Green Version]
  30. Turner, C.A.; Watson, S.J.; Akil, H. The Fibroblast Growth Factor Family: Neuromodulation of Affective Behavior. Neuron 2012, 76, 160–174. [Google Scholar] [CrossRef] [Green Version]
  31. Turner, C.A.; Eren-Koçak, E.; Inui, E.G.; Watson, S.J.; Akil, H. Dysregulated fibroblast growth factor (FGF) signaling in neurological and psychiatric disorders. Semin. Cell Dev. Biol. 2016, 53, 136–143. [Google Scholar] [CrossRef] [PubMed]
  32. Wu, C.; Tseng, P.; Chen, Y.; Tu, K.; Lin, P. Significantly higher peripheral fibroblast growth factor-2 levels in patients with major depressive disorder: A preliminary meta-analysis under MOOSE guidelines. Medicine 2016, 95, e4563. [Google Scholar] [CrossRef] [PubMed]
  33. Kajitani, N.; Hisaoka-Nakashima, K.; Morioka, N.; Okada-Tsuchioka, M.; Kaneko, M.; Kasai, M.; Shibasaki, C.; Nakata, Y.; Takebayashi, M. Antidepressant acts on astrocytes leading to an increase in the expression of neurotrophic/growth factors: Differential regulation of FGF-2 by noradrenaline. PLoS ONE 2012, 7, e51197. [Google Scholar] [CrossRef] [PubMed] [Green Version]
  34. Mallei, A.; Shi, B.; Mocchetti, I. Antidepressant treatments induce the expression of basic fibroblast growth factor in cortical and hippocampal neurons. Mol. Pharmacol. 2002, 61, 1017–1024. [Google Scholar] [CrossRef] [Green Version]
  35. Walker, W.H.; Walton, J.C.; DeVries, A.C.; Nelson, R.J. Circadian rhythm disruption and mental health. Transl. Psychiatry 2020, 10, 28. [Google Scholar] [CrossRef] [Green Version]
  36. Logan, R.W.; McClung, C.A. Rhythms of life: Circadian disruption and brain disorders across the lifespan. Nat. Rev. Neurosci. 2019, 20, 49–65. [Google Scholar] [CrossRef]
  37. McClung, C.A. How might circadian rhythms control mood? Let me count the ways. Biol. Psychiatry 2013, 74, 242–249. [Google Scholar] [CrossRef] [Green Version]
  38. Sato, S.; Bunney, B.; Mendoza-Viveros, L.; Bunney, W.; Borrelli, E.; Sassone-Corsi, P.; Orozco-Solis, R. Rapid-acting antidepressants and the circadian clock. Neuropsychopharmacology 2022, 47, 805–816. [Google Scholar] [CrossRef]
  39. Bunney, B.G.; Li, J.Z.; Walsh, D.M.; Stein, R.; Vawter, M.P.; Cartagena, P.; Barchas, J.D.; Schatzberg, A.F.; Myers, R.M.; Watson, S.J.; et al. Circadian dysregulation of clock genes: Clues to rapid treatments in major depressive disorder. Mol. Psychiatry 2015, 20, 48–55. [Google Scholar] [CrossRef] [Green Version]
  40. Li, S.X.; Liu, L.J.; Xu, L.Z.; Gao, L.; Wang, X.F.; Zhang, J.T.; Lu, L. Diurnal alterations in circadian genes and peptides in major depressive disorder before and after escitalopram treatment. Psychoneuroendocrinology 2013, 38, 2789–2799. [Google Scholar] [CrossRef]
  41. Gray, J.D.; Milner, T.A.; McEwen, B.S. Dynamic plasticity: The role of glucocorticoids, brain-derived neurotrophic factor and other trophic factors. Neuroscience 2013, 239, 214–227. [Google Scholar] [CrossRef] [PubMed]
  42. Alboni, S.; Benatti, C.; Capone, G.; Corsini, D.; Caggia, F.; Tascedda, F.; Mendlewicz, J.; Brunello, N. Time-dependent effects of escitalopram on brain derived neurotrophic factor (BDNF) and neuroplasticity related targets in the central nervous system of rats. Eur. J. Pharmacol. 2010, 643, 180–187. [Google Scholar] [CrossRef] [PubMed]
  43. Burstein, O.; Franko, M.; Gale, E.; Handelsman, A.; Barak, S.; Motsan, S.; Shamir, A.; Toledano, R.; Simhon, O.; Hirshler, Y.; et al. Escitalopram and NHT normalized stress-induced anhedonia and molecular neuroadaptations in a mouse model of depression. PLoS ONE 2017, 12, e0188043. [Google Scholar] [CrossRef] [PubMed] [Green Version]
  44. Jacobsen, J.P.R.; Mørk, A. The effect of escitalopram, desipramine, electroconvulsive seizures and lithium on brain-derived neurotrophic factor mRNA and protein expression in the rat brain and the correlation to 5-HT and 5-HIAA levels. Brain Res. 2004, 1024, 183–192. [Google Scholar] [CrossRef] [PubMed]
  45. Russo-Neustadt, A.A.; Alejandre, H.; Garcia, C.; Ivy, A.S.; Chen, M.J. Hippocampal brain-derived neurotrophic factor expression following treatment with reboxetine, citalopram, and physical exercise. Neuropsychopharmacology 2004, 29, 2189–2199. [Google Scholar] [CrossRef] [Green Version]
  46. Saadati, N.; Bananej, M.; Khakpai, F.; Zarrindast, M.R.; Alibeik, H. Synergistic antidepressant effects of citalopram and SB-334867 in the REM sleep-deprived mice: Possible role of BDNF. Pharmacol. Biochem. Behav. 2022, 219, 173449. [Google Scholar] [CrossRef]
  47. Rogóż, Z.; Kamińska, K.; Pańczyszyn-Trzewik, P.; Sowa-Kućma, M. Repeated co-treatment with antidepressants and risperidone increases BDNF mRNA and protein levels in rats. Pharmacol. Rep. 2017, 69, 885–893. [Google Scholar] [CrossRef]
  48. Kozisek, M.E.; Middlemas, D.; Bylund, D.B. The differential regulation of BDNF and TrkB levels in juvenile rats after four days of escitalopram and desipramine treatment. Neuropharmacology 2008, 54, 251–257. [Google Scholar] [CrossRef]
  49. Seo, M.K.; Lee, J.G.; Park, S.W. Effects of escitalopram and ibuprofen on a depression-like phenotype induced by chronic stress in rats. Neurosci. Lett. 2019, 696, 168–173. [Google Scholar] [CrossRef]
  50. Arunrut, T.; Alejandre, H.; Chen, M.; Cha, J.; Russo-Neustadt, A. Differential behavioral and neurochemical effects of exercise, reboxetine and citalopram with the forced swim test. Life Sci. 2009, 84, 584–589. [Google Scholar] [CrossRef] [Green Version]
  51. Dionisie, V.; Ciobanu, A.M.; Toma, V.A.; Manea, M.C.; Baldea, I.; Olteanu, D.; Sevastre-Berghian, A.; Clichici, S.; Manea, M.; Riga, S.; et al. Escitalopram targets oxidative stress, caspase-3, bdnf and mecp2 in the hippocampus and frontal cortex of a rat model of depression induced by chronic unpredictable mild stress. Int. J. Mol. Sci. 2021, 22, 7483. [Google Scholar] [CrossRef]
  52. Gong, W.G.; Wang, Y.J.; Zhou, H.; Li, X.L.; Bai, F.; Ren, Q.G.; Zhang, Z.J. Citalopram Ameliorates Synaptic Plasticity Deficits in Different Cognition-Associated Brain Regions Induced by Social Isolation in Middle-Aged Rats. Mol. Neurobiol. 2017, 54, 1927–1938. [Google Scholar] [CrossRef] [PubMed]
  53. Doron, R.; Lotan, D.; Versano, Z.; Benatav, L.; Franko, M.; Armoza, S.; Kately, N.; Rehavi, M. Escitalopram or novel herbal mixture treatments during or following exposure to stress reduce anxiety-like behavior through corticosterone and BDNF modifications. PLoS ONE 2014, 9, e91455. [Google Scholar] [CrossRef] [PubMed]
  54. Cooke, J.D.; Grover, L.M.; Spangler, P.R. Venlafaxine treatment stimulates expression of brain-derived neurotrophic factor protein in frontal cortex and inhibits long-term potentiation in hippocampus. Neuroscience 2009, 162, 1411–1419. [Google Scholar] [CrossRef] [PubMed]
  55. Daniele, S.; Da Pozzo, E.; Zappelli, E.; Martini, C. Trazodone treatment protects neuronal-like cells from inflammatory insult by inhibiting NF-κB, p38 and JNK. Cell. Signal. 2015, 27, 1609–1629. [Google Scholar] [CrossRef] [PubMed]
  56. Rantamäki, T.; Hendolin, P.; Kankaanpää, A.; Mijatovic, J.; Piepponen, P.; Domenici, E.; Chao, M.V.; Männistö, P.T.; Castrén, E. Pharmacologically diverse antidepressants rapidly activate brain-derived neurotrophic factor receptor TrkB and induce phospholipase-Cγ signaling pathways in mouse brain. Neuropsychopharmacology 2007, 32, 2152–2162. [Google Scholar] [CrossRef] [Green Version]
  57. Rantamäki, T. TrkB neurotrophin receptor at the core of antidepressant effects, but how? Cell Tissue Res. 2019, 377, 115–124. [Google Scholar] [CrossRef] [Green Version]
  58. Casarotto, P.C.; Girych, M.; Fred, S.M.; Kovaleva, V.; Moliner, R.; Enkavi, G.; Biojone, C.; Cannarozzo, C.; Sahu, M.P.; Kaurinkoski, K.; et al. Antidepressant drugs act by directly binding to TRKB neurotrophin receptors. Cell 2021, 184, 1299–1313.e19. [Google Scholar] [CrossRef]
  59. Kusmider, M.; Faron-Górecka, A.; Solich, J.; Pabian, P.; Dziedzicka-Wasylewska, M. Time-course of changes in key catecholaminergic receptors and trophic systems in rat brain after antidepressant administration. Neurochem. Int. 2020, 141, 104885. [Google Scholar] [CrossRef]
  60. Xu, Y.; Wei, H.; Zhu, Y.; Zhu, Y.; Zhang, N.; Qin, J.; Zhu, X.; Yu, M.; Li, Y. Potential serum biomarkers for the prediction of the efficacy of escitalopram for treating depression. J. Affect. Disord. 2019, 250, 307–312. [Google Scholar] [CrossRef]
  61. Bachis, A.; Mallei, A.; Cruz, M.I.; Wellstein, A.; Mocchetti, I. Chronic antidepressant treatments increase basic fibroblast growth factor and fibroblast growth factor-binding protein in neurons. Neuropharmacology 2008, 55, 1114–1120. [Google Scholar] [CrossRef] [PubMed]
  62. Calabrese, F.; Molteni, R.; Gabriel, C.; Mocaer, E.; Racagni, G.; Riva, M.A. Modulation of neuroplastic molecules in selected brain regions after chronic administration of the novel antidepressant agomelatine. Psychopharmacology 2011, 215, 267–275. [Google Scholar] [CrossRef] [PubMed]
  63. Wang, L.; Li, X.X.; Chen, X.; Qin, X.Y.; Kardami, E.; Cheng, Y. Antidepressant-Like Effects of Low- And High-Molecular Weight FGF-2 on Chronic Unpredictable Mild Stress Mice. Front. Mol. Neurosci. 2018, 11, 377. [Google Scholar] [CrossRef] [Green Version]
  64. Elsayed, M.; Banasr, M.; Duric, V.; Fournier, N.M.; Licznerski, P.; Duman, R.S. Antidepressant Effects of Fibroblast Growth Factor-2 in Behavioral and Cellular Models of Depression. Biol. Psychiatry 2012, 72, 258–265. [Google Scholar] [CrossRef] [PubMed] [Green Version]
  65. Carlezon, W.A.; Duman, R.S.; Nestler, E.J. The many faces of CREB. Trends Neurosci. 2005, 28, 436–445. [Google Scholar] [CrossRef]
  66. Malberg, J.E.; Blendy, J.A. Antidepressant action: To the nucleus and beyond. Trends Pharmacol. Sci. 2005, 26, 631–638. [Google Scholar] [CrossRef]
  67. Satyanarayanan, S.K.; Chien, Y.C.; Chang, J.P.C.; Huang, S.Y.; Guu, T.W.; Su, H.; Su, K.P. Melatonergic agonist regulates circadian clock genes and peripheral inflammatory and neuroplasticity markers in patients with depression and anxiety. Brain. Behav. Immun. 2020, 85, 142–151. [Google Scholar] [CrossRef]
  68. Christiansen, S.L.; Bouzinova, E.V.; Fahrenkrug, J.; Wiborg, O. Altered expression pattern of clock genes in a rat model of depression. Int. J. Neuropsychopharmacol. 2016, 19, 1–13. [Google Scholar] [CrossRef] [Green Version]
  69. Erburu, M.; Cajaleon, L.; Guruceaga, E.; Venzala, E.; Muñoz-Cobo, I.; Beltrán, E.; Puerta, E.; Tordera, R.M. Chronic mild stress and imipramine treatment elicit opposite changes in behavior and in gene expression in the mouse prefrontal cortex. Pharmacol. Biochem. Behav. 2015, 135, 227–236. [Google Scholar] [CrossRef]
  70. Savalli, G.; Diao, W.; Schulz, S.; Todtova, K.; Pollak, D.D. Diurnal oscillation of Amygdala clock gene expression and loss of synchrony in a mouse model of depression. Int. J. Neuropsychopharmacol. 2015, 18, 1–11. [Google Scholar] [CrossRef] [Green Version]
  71. Nagy, A.D.; Iwamoto, A.; Kawai, M.; Goda, R.; Matsuo, H.; Otsuka, T.; Nagasawa, M.; Furuse, M.; Yasuo, S. Melatonin adjusts the expression pattern of clock genes in the suprachiasmatic nucleus and induces antidepressant-like effect in a mouse model of seasonal affective disorder. Chronobiol. Int. 2015, 32, 447–457. [Google Scholar] [CrossRef] [PubMed]
  72. Moriya, S.; Tahara, Y.; Sasaki, H.; Hamaguchi, Y.; Kuriki, D.; Ishikawa, R.; Ishigooka, J.; Shibata, S. Effect of quetiapine on Per1, Per2, and Bmal1 clock gene expression in the mouse amygdala and hippocampus. J. Pharmacol. Sci. 2014, 125, 329–332. [Google Scholar] [CrossRef] [PubMed] [Green Version]
  73. Grippe, T.C.; Gonçalves, B.S.B.; Louzada, L.L.; Quintas, J.L.; Naves, J.O.S.; Camargos, E.F.; Nóbrega, O.T. Circadian rhythm in Alzheimer disease after trazodone use. Chronobiol. Int. 2015, 32, 1311–1314. [Google Scholar] [CrossRef] [PubMed]
  74. Du Sert, N.P.; Ahluwalia, A.; Alam, S.; Avey, M.T.; Baker, M.; Browne, W.J.; Clark, A.; Cuthill, I.C.; Dirnagl, U.; Emerson, M.; et al. Reporting Animal Research: Explanation and Elaboration for the Arrive Guidelines 2.0. PLoS Biol. 2020, 18, e3000411. [Google Scholar] [CrossRef]
  75. FDA Estimating the Maximum Safe Starting Dose in Initial Clinical Trials for Therapeutics in Adult Healthy Volunteers. Available online: https://www.fda.gov/regulatory-information/search-fda-guidance-documents/estimating-maximum-safe-starting-dose-initial-clinical-trials-therapeutics-adult-healthy-volunteers (accessed on 1 March 2018).
  76. Carboni, L.; Pischedda, F.; Piccoli, G.; Lauria, M.; Musazzi, L.; Popoli, M.; Mathé, A.A.; Domenici, E. Depression-Associated Gene Negr1-Fgfr2 Pathway Is Altered by Antidepressant Treatment. Cells 2020, 9, 1818. [Google Scholar] [CrossRef]
  77. Livak, K.J.; Schmittgen, T.D. Analysis of relative gene expression data using real-time quantitative PCR and the 2(-Delta Delta C(T)) Method. Methods 2001, 25, 402–408. [Google Scholar] [CrossRef]
  78. Bate, S.T.; Clark, R.A. The Design and Statistical Analysis of Animal Experiments; Cambridge University Press: Cambridge, UK, 2014; ISBN 978-1-107-69094-3. [Google Scholar]
  79. Clark, R.A.; Shoaib, M.; Hewitt, K.N.; Stanford, S.C.; Bate, S.T. A comparison of InVivoStat with other statistical software packages for analysis of data generated from animal experiments. J. Psychopharmacol. 2012, 26, 1136–1142. [Google Scholar] [CrossRef]
Figure 1. mRNA levels of Bdnf in the PFCx (a), Hip (b), Amy (c), NAc (d), and Hyp (e) after acute or chronic treatment with trazodone, citalopram, or vehicle. The least square predicted means with 95% confidence intervals are plotted. Data were log-transformed when required to stabilise the variance and satisfy the parametric assumptions (a,d,e). **: p < 0.01; *: p < 0.05 in the Planned Comparison vs. control. n = 6/group.
Ijms 23 14041 g001
Figure 2. mRNA levels of TrkB in the PFCx (a), Hip (b), Amy (c), Nac (d), and Hyp (e) after acute or chronic treatment with trazodone, citalopram, or vehicle. The least square predicted means with 95% confidence intervals are plotted. Data were log-transformed when required to stabilise the variance and satisfy the parametric assumptions (b,e). **: p < 0.01; *: p < 0.05 in the Planned Comparison vs. control. n = 6/group.
Ijms 23 14041 g002
Figure 3. mRNA levels of Fgf-2 in the PFCx (a), Hip (b), Amy (c), NAc (d), and Hyp (e) after acute or chronic treatment with trazodone, citalopram, or vehicle. The least square predicted means with 95% confidence intervals are plotted. **: p < 0.01; *: p < 0.05 in the Planned Comparison vs. control. n = 6/group.
Ijms 23 14041 g003
Figure 4. mRNA levels of Fgfr2 in the PFCx (a), Hip (b), Amy (c), NAc (d), and Hyp (e) after acute or chronic treatment with trazodone, citalopram, or vehicle. The least square predicted means with 95% confidence intervals are plotted. Data were log-transformed when required to stabilise the variance and satisfy the parametric assumptions (b,d). *: p < 0.05 in the Planned Comparison vs. control. n = 6/group.
Ijms 23 14041 g004
Figure 5. mRNA levels of Creb in the PFCx (a), Hip (b), Amy (c), NAc (d), and Hyp (e) after acute or chronic treatment with trazodone, citalopram, or vehicle. The least square predicted means with 95% confidence intervals are plotted. Data were log-transformed when required to stabilise the variance and satisfy the parametric assumptions (b,e). *: p < 0.05 in the Planned Comparison vs. control. n = 6/group.
Ijms 23 14041 g005
Figure 6. Protein levels of phospho-CREB/total CREB in the PFCx (a), Hip (b), Amy (c), NAc (d), and Hyp (e) after acute or chronic treatment with trazodone, citalopram, or vehicle. The least square predicted means with 95% confidence intervals are plotted. Data were log-transformed when required to stabilise the variance and satisfy the parametric assumptions (a,d). Representative blots are shown in each panel; blot images are displayed in Supplementary Figure S2. *: p < 0.05 in the Planned Comparison vs. control. n = 6/group.
Ijms 23 14041 g006
Figure 7. mRNA levels of Bmal1 in the PFCx (a), Hip (b), Amy (c), NAc (d), and Hyp (e) after acute or chronic treatment with trazodone, citalopram, or vehicle. The least square predicted means with 95% confidence intervals are plotted. Data were log-transformed when required to stabilise the variance and satisfy the parametric assumptions (b,d). **: p < 0.01; *: p < 0.05 in the Planned Comparison vs. control. n = 6/group.
Ijms 23 14041 g007
Figure 8. mRNA levels of Per1 in the PFCx (a), Hip (b), Amy (c), NAc (d), and Hyp (e) after acute or chronic treatment with trazodone, citalopram, or vehicle. The least square predicted means with 95% confidence intervals are plotted. Data were log-transformed when required to stabilise the variance and satisfy the parametric assumptions (c). ***: p < 0.001; **: p < 0.01; *: p < 0.05 in the Planned Comparison vs. control. n = 6/group.
Ijms 23 14041 g008
Figure 9. mRNA levels of Per2 in the PFCx (a), Hip (b), Amy (c), NAc (d), and Hyp (e) after acute or chronic treatment with trazodone, citalopram, or vehicle. The least square predicted means with 95% confidence intervals are plotted. Data were log-transformed when required to stabilise the variance and satisfy the parametric assumptions (a,b,d,e). **: p < 0.01; *: p < 0.05 in the Planned Comparison vs. control. n = 6/group.
Ijms 23 14041 g009
Figure 10. PCA of mRNA or protein levels of all genes/proteins investigated after chronic trazodone, chronic citalopram, or chronic vehicle (control) treatment. A clear separation by antidepressant versus vehicle treatment (circled) is observed by adopting an unsupervised approach.
Ijms 23 14041 g010
Table 1. Primer sequences.
GeneForward PrimerReverse PrimerTmProduct Size
Bmal1TGCCACTGACTACCAAGAAAGTTGTCCCGACGCCTCTTTTCA59.56
61.75
134
BdnfAAGTCTGCATTACATTCCTCGAGTTTTCTGAAAGAGGGACAGTTTAT57.53
57.49
138 [25]
CrebCAGACAACCAGCAGAGTGGACTGGACTGTCTGCCCATTG59.61
58.14
176
Fgf-2GCGAACCGGTACCTGGCTATGCCCAGTTCGTTTCAGTGCC62.02
62.13
160
Fgfr2CCGGCCCTCCTTCAGTTTAGTTCAACATGCAGCGCAACTC60.11
60.04
132
GapdhAGACAGCCGCATCTTCTTGTCTTGCCGTGGGTAGAGTCAT59.68
59.46
207 [25]
Per1GCGTTGCAAACGGGATGTGCAGGCGAGATGGTGTAGTAGA59.36
61.59
101
Per2TGACGGGTCGAGCAAAGGACCCACGTCTTCCTGGAGCACA62.43
62.10
163
TrkBAAGTTCTACGGTGTCTGTGTGTTCTCTCCTACCAAGCAGTTC57.91
57.04
257 [25]
Table 2. Antibody list.
AntibodyDilutionCat. NumberRRIDReactivityManufacturer
anti-phospho CREB Ser 1331:100006-519AB_310153mouse, rat, hamster, humanMillipore, Burlington, MA, USA
anti-CREB1:10009197AB_331277human, mouse, rat, monkey, D. melanogasterCell Signaling, Danvers, MA, USA
anti-Gapdh1:1000MA5-15738AB_10977387bacteria, canine, chicken, hamster, human, insect, mouse, rabbit, rat, yeastThermo Fisher Scientific, Waltham, MA, USA
Donkey Anti-rabbit IgG1:3000NA934AB_772206rabbitGE Healthcare, Chicago, IL, USA
Publisher’s Note: MDPI stays neutral with regard to jurisdictional claims in published maps and institutional affiliations.

