Article

Analysis of Intrinsic Breast Cancer Subtypes: The Clinical Utility of Epigenetic Biomarkers and TP53 Mutation Status in Triple-Negative Cases

by
Ieva Sadzeviciene
1,
Kristina Snipaitiene
1,2,
Asta Scesnaite-Jerdiakova
1,2,
Kristina Daniunaite
1,
Rasa Sabaliauskaite
2,
Aida Laurinaviciene
3,
Monika Drobniene
2,
Valerijus Ostapenko
2 and
Sonata Jarmalaite
1,2,*
1
Institute of Biosciences, Life Sciences Center, Vilnius University, Sauletekio Ave. 7, LT-10257 Vilnius, Lithuania
2
National Cancer Institute, Santariskiu St. 1, LT-08406 Vilnius, Lithuania
3
National Center of Pathology, Affiliate of Vilnius University Hospital Santaros Clinics, P. Baublio St. 5, LT-08406 Vilnius, Lithuania
*
Author to whom correspondence should be addressed.
Int. J. Mol. Sci. 2022, 23(23), 15429; https://doi.org/10.3390/ijms232315429
Submission received: 6 October 2022 / Revised: 21 November 2022 / Accepted: 2 December 2022 / Published: 6 December 2022
(This article belongs to the Special Issue Molecular Biology of Breast Cancer)

Abstract

:
This study aimed at analyzing the DNA methylation pattern and TP53 mutation status of intrinsic breast cancer (BC) subtypes for improved characterization and survival prediction. DNA methylation of 17 genes was tested by methylation-specific PCR in 116 non-familial BRCA mutation-negative BC and 29 control noncancerous cases. At least one gene methylation was detected in all BC specimens and a 10-gene panel statistically significantly separated tumors from noncancerous breast tissues. Methylation of FILIP1L and MT1E was predominant in triple-negative (TN) BC, while other BC subtypes were characterized by RASSF1, PRKCB, MT1G, APC, and RUNX3 hypermethylation. TP53 mutation (TP53-mut) was found in 38% of sequenced samples and mainly affected TN BC cases (87%). Cox analysis revealed that TN status, age at diagnosis, and RUNX3 methylation are independent prognostic factors for overall survival (OS) in BC. The combinations of methylated biomarkers, RUNX3 with MT1E or FILIP1L, were also predictive for shorter OS, whereas methylated FILIP1L was predictive of a poor outcome in the TP53-mut subgroup. Therefore, DNA methylation patterns of specific genes significantly separate BC from noncancerous breast tissues and distinguishes TN cases from non-TN BC, whereas the combination of two-to-three epigenetic biomarkers can be an informative tool for BC outcome predictions.

1. Introduction

In 2020, breast cancer (BC) was the leading cause of women’s cancer worldwide, while the mortality from BC was in fifth place [1]. Triple-negative (TN) BC accounts for approximately 10–15% of all diagnosed BC and, in comparison to estrogen- and progesterone receptor-positive (i.e., hormone receptor-positive, ER+ and PR+, respectively) BC cases have the most aggressive course of the disease and the worst prognosis [2]. In contrast to the hormonal or HER2 (human epidermal growth factor receptor) positive BC, the specific molecular pathophysiology of TN BC remains poorly understood, resulting in a lack of efficient target therapies [3].
Nowadays, immunohistochemistry is mainly used for BC subtype classification but the addition of genetic and epigenetic biomarkers could increase the sensitivity and specificity of disease diagnosis, prognosis, and prediction of treatment outcome. Because BC is a multiform disease and there is no particular cause or gene mutation to lead the breast cell to cancer, it is important to find an informative biomarker system to identify and predict the disease development and response to treatment.
TP53 mutation is the most frequent mutation in invasive BC, occurring in about 30–35% of all cases, and approximately 80% of them are found in TN tumors [4]. TP53 is activated in response to DNA damage, oncogene activation, hypoxia, or cellular stress and is involved in cell-cycle arrest, apoptosis, senescence, or autophagy modulation processes [5]. Therefore, the TP53 mutation is a marker for resistance to chemotherapy and radiotherapy and, consequently, a poor prognosis of the disease [6].
DNA methylation is a stable and reversible molecular alteration of DNA that changes the gene expression patterns but does not affect DNA sequences. In humans, methylation of cytosine occurs mainly in CpG dinucleotides (75%) [7]. Normally, unmethylated CpG islands in cancer cells may become methylated, resulting in the silencing of important genes involved in various cellular processes, including cell-cycle regulation, DNA repair, cellular homeostasis, apoptosis, cell adhesion, and invasion. Epigenetic change is an early event in tumor formation and also can be the second “Knudson’s hit” in cell tumorigenesis [8]. DNA methylation biomarkers can increase the accuracy of the disease diagnosis, prognosis, and prediction of treatment outcome; therefore, for our study biomarkers, which are involved in cell cycle regulation (P14ARF, later P14 and P16INK4A, and later P16), cellular signaling pathways (ESR1 (two different regions), RARB, RASSF1, and PRKCB), programmed cell death (DAPK1), cell adhesion (APC), angiogenesis process (ADAMTS12 and FILIP1L), maintenance of genome stability (MGMT), xenobiotic metabolism (GSTP1), heavy metal binding (MT1E, MT1F, and MT1G) and gene expression (RUNX3), were selected.
The aim of the present study was to investigate the DNA methylation pattern of intrinsic BC subtypes, especially of the TN BC, in association with TP53 mutation status, and to identify biomarkers for the disease outcome predictions.

2. Results

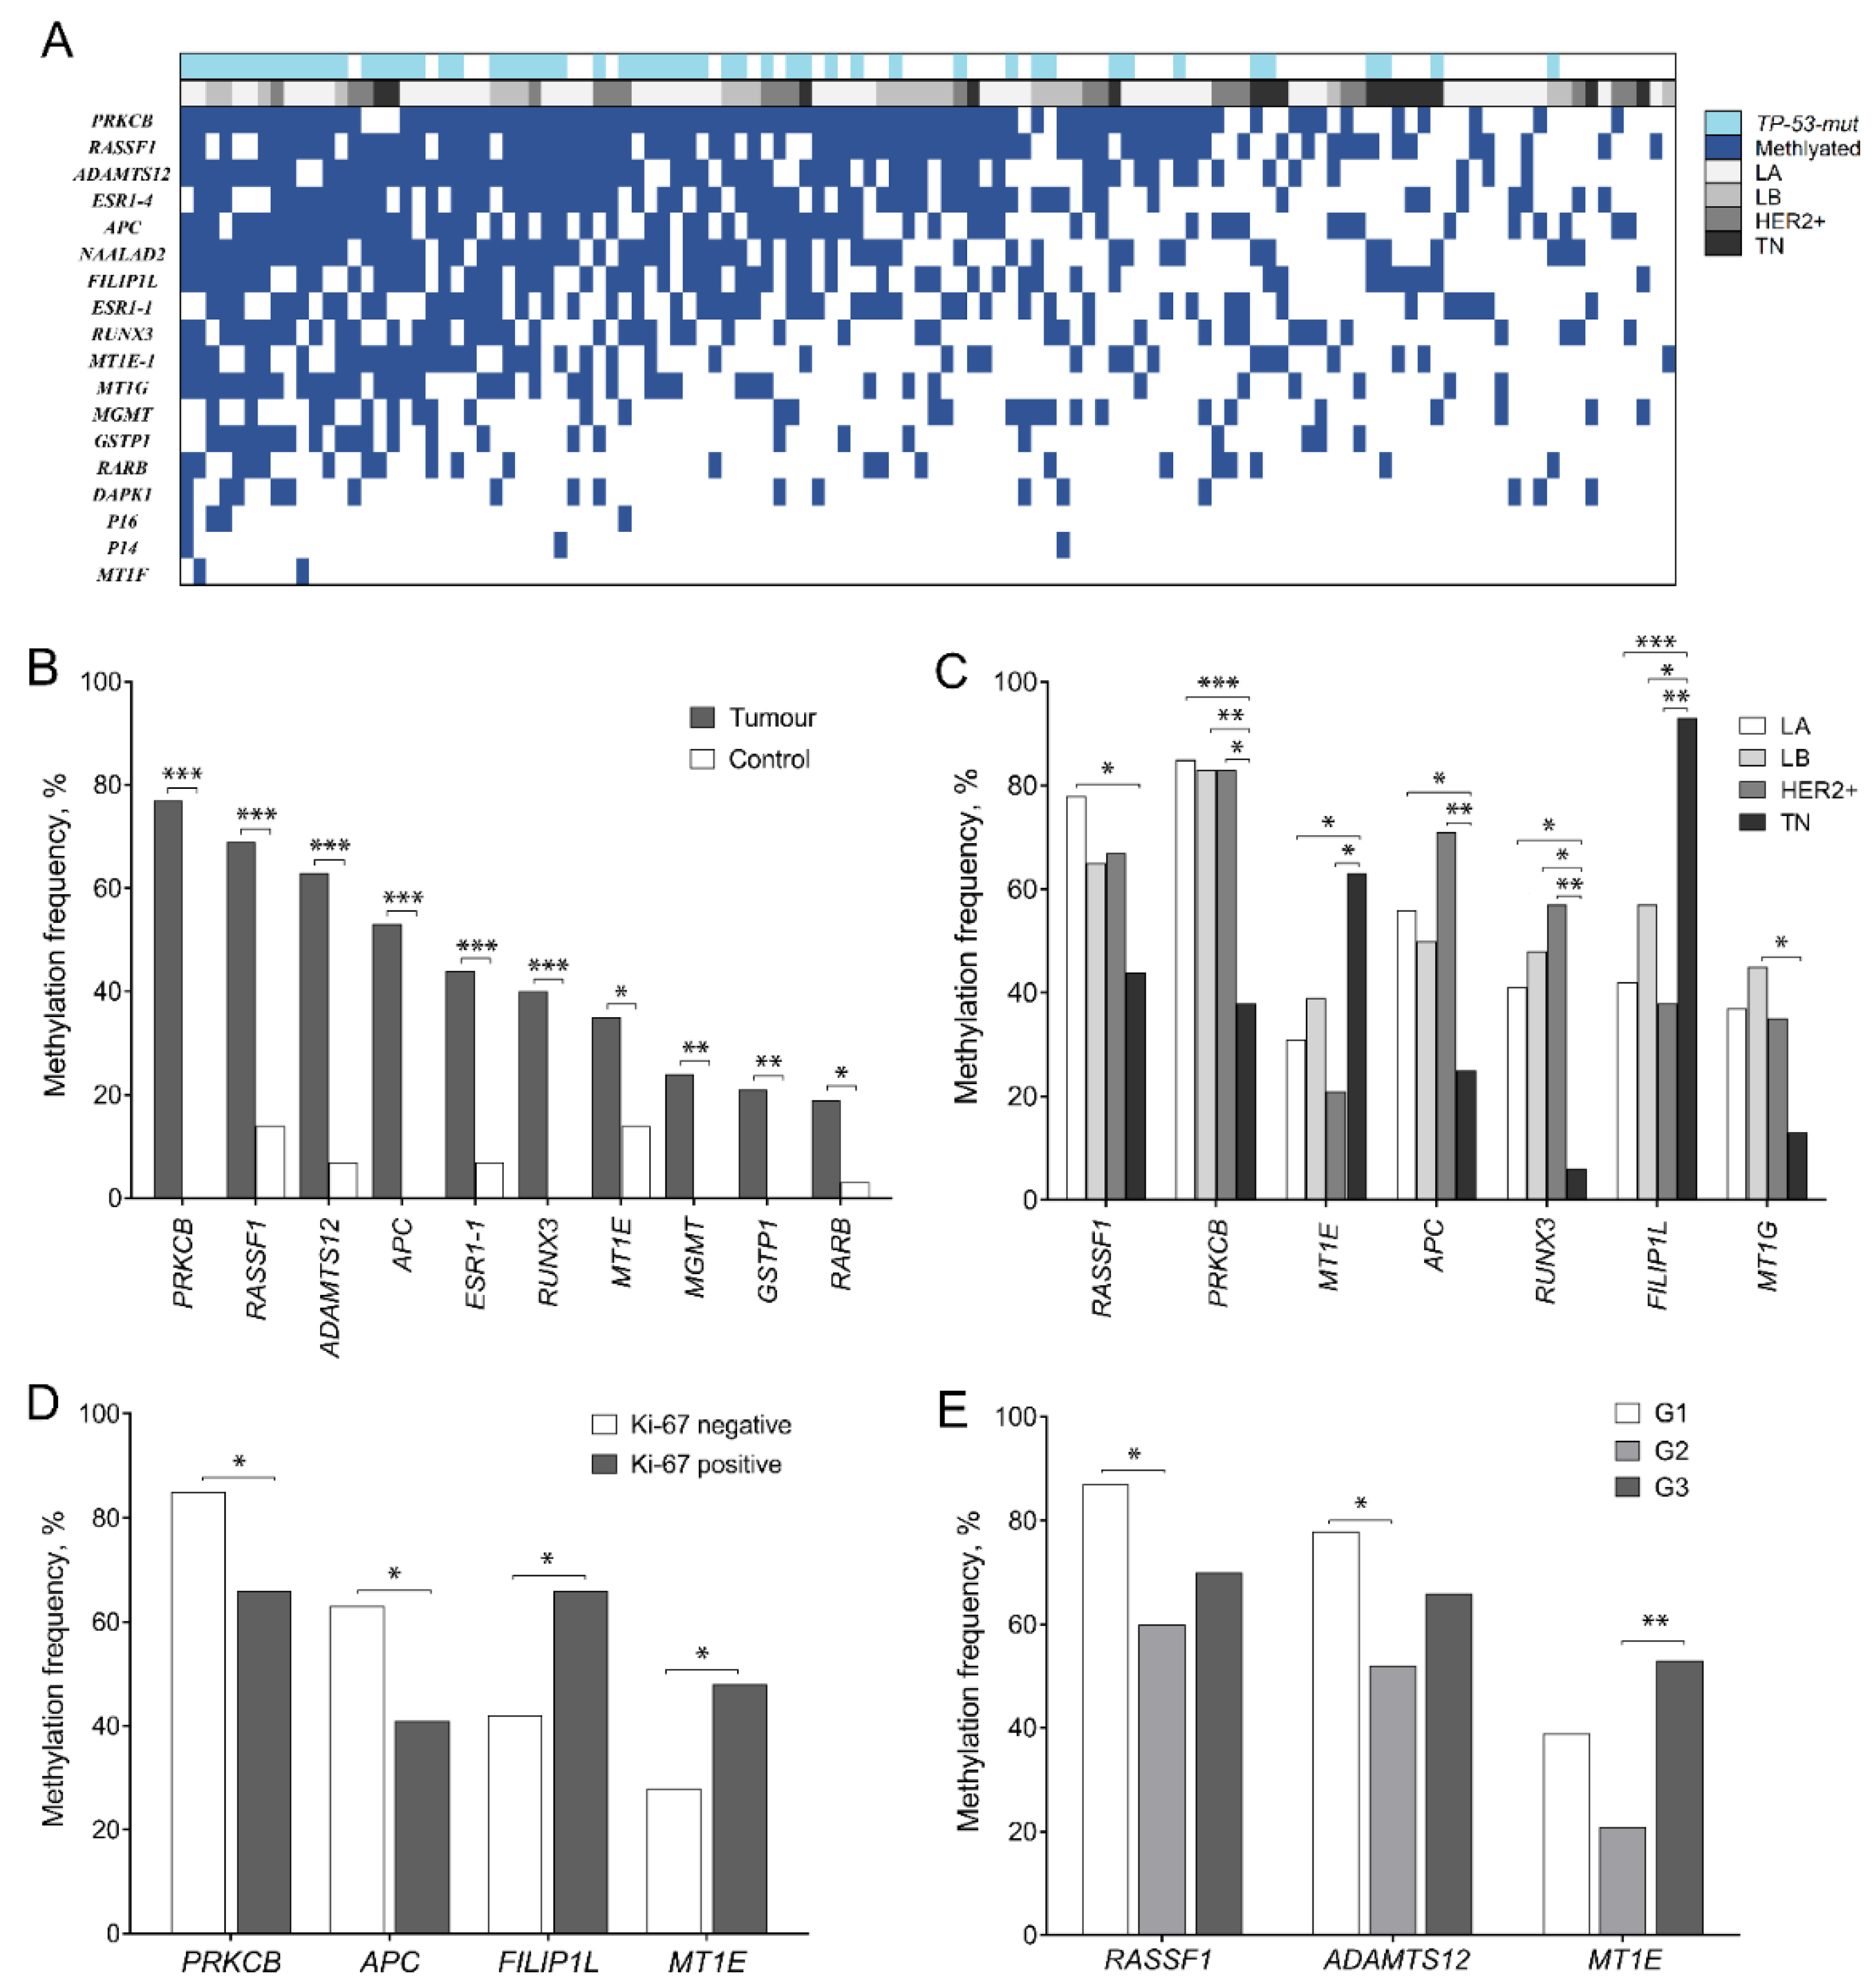
2.1. DNA Methylation Spectrum

DNA methylation status of selected tumor suppressor genes (P14, P16, MGMT, RARB, RASSF1, DAPK1, GSTP1, ESR1-1, ESR1-4, PRKCB, MT1E, MT1F, MT1G, APC, ADAMTS12, RUNX3, NAALAD2, and FILIP1L) was analyzed in 116 BC and 29 control samples. At least one methylated gene was detected in every sample (Figure 1A).
In BC samples, promoter hypermethylation was the most frequently detected in PRKCB (86/111, 77%), RASSF1 (79/115, 69%), ADAMTS12 (67/107, 63%), APC (61/115, 53%), and RUNX3 (46/114, 40%) genes and significantly differentiated BC from the control group (0%, 14%, 7%, 0%, and 0%, respectively; all p < 0.0001). Hypermethylation of ESR1-1, RARB, GSTP1, MGMT, and MT1E genes was detected in 19–44% of BC samples and the changes were significantly different as compared to the controls (0–14%, all p < 0.05; Figure 1B). Hypermethylation frequency of MT1F, P14, P16, DAPK1, MT1G, FILIP1L, NAALAD2, and ESR1-4 was quite variable (2–57%) and the differences from controls (methylated 0–64%) were not statistically significant (p > 0.05) (The detailed information on biomarker sensitivity and specificity is given in Supplementary Table S1).
Methylation of FILIP1L and MT1E was predominant in TN BC, while other subtypes were characterized by frequent methylation of RASSF1, PRKCB, MT1G, APC, and RUNX3 (p < 0.05; Figure 1C). Analysis of separate molecular biomarkers confirmed the same changes as in subtype analysis according to hormone receptor status: ER+ cases more frequently had methylated PRKCB (86% vs. 40%) and RUNX3 (46% vs. 18%) than ER negative, while FILIP1L promoter hypermethylation was dominating in ER and PR negative BC (84% vs. 45% and 76% vs. 47%, respectively; in all cases p < 0.05). In addition, MT1E and FILIP1L were more frequently hypermethylated in Ki-67+ cases (48% vs. 28% and 66% vs. 42%; p < 0.05); however, no statistically significant association with the HER2 receptor was detected (Figure 1D).
The comparison of promoter hypermethylation between ductal and lobular BC revealed more frequent MT1E methylation in ductal BC (40% vs. 7%; p = 0.018). Tumor stage analysis showed that the P16 promoter was methylated only in stage T2 tumors (8% vs. 0%; p = 0.041), while promoter hypermethylation of RUNX3 was significantly more common in cases with affected nodes (52% vs. 31%; p = 0.032). Analysis of associations between biomarkers and tumor grading revealed statistically significant differences in promoter hypermethylation of RASSF1, ADAMTS12 (G1 vs. G2), and MT1E (G2 vs. G3) (p < 0.05; Figure 1E). Promoter methylation frequencies of ADAMTS12 (64%), ESR1-4 (53%), MT1E (40%), and DAPK1 (15%) were higher in the younger patients’ group (p < 0.05). Detailed methylation distribution between subtypes and other clinical–pathological variables is provided in Supplementary Table S1.

2.2. TP53 Mutation Spectrum

In total, 86 tumors were analyzed for TP53 mutations (TP53-mut), out of which sequence alterations were identified in 33 cases (38%,), while 53 BC had wild-type TP53 (62%, TP53-wt). After 84 samples were analyzed by using the single-strand conformation polymorphism (SSCP) method, 29 TP53-mut cases were detected and further validated by Sanger sequencing (SS). Thirty-eight samples were selected for more detailed analysis using next-generation sequencing (NGS), out of which two samples were not previously analyzed either by SSCP or by SS (Figure 2A,B). Three samples, previously determined as negative by SSCP and SS methods were identified as TP53-mut positive by NGS analysis.
Out of 33 TP53-mut BC cases, pathogenic TP53 sequence alterations were detected in 27 BC, 78% (21/27) of which occurred in the DNA binding domain, and 22% (6/27) in introns. According to the mutation type, about a half (52%, 14/27) of pathogenic mutations were missense, 19% (5/27) splice, 11% (3/27) frameshift, 11% (3/27) nonsense, and 4% (1/27) intronic. Out of pathogenic mutations: 26% were AT:GC; 19% were GC:AT at CpG sites, and 15% were not at CpG sites; 11% were GC:TA. Deletions in the studied TP53 gene region were quite common and accounted for 15% of all alterations (range 1–23 nt). The largest, 23-nucleotide (nt) deletion g.7578546_7578568del (23 nt deleted) was found in the fourth intron by the NGS method and affected the splicing site. The detailed TP53 mutation data are provided in Supplementary Table S2.

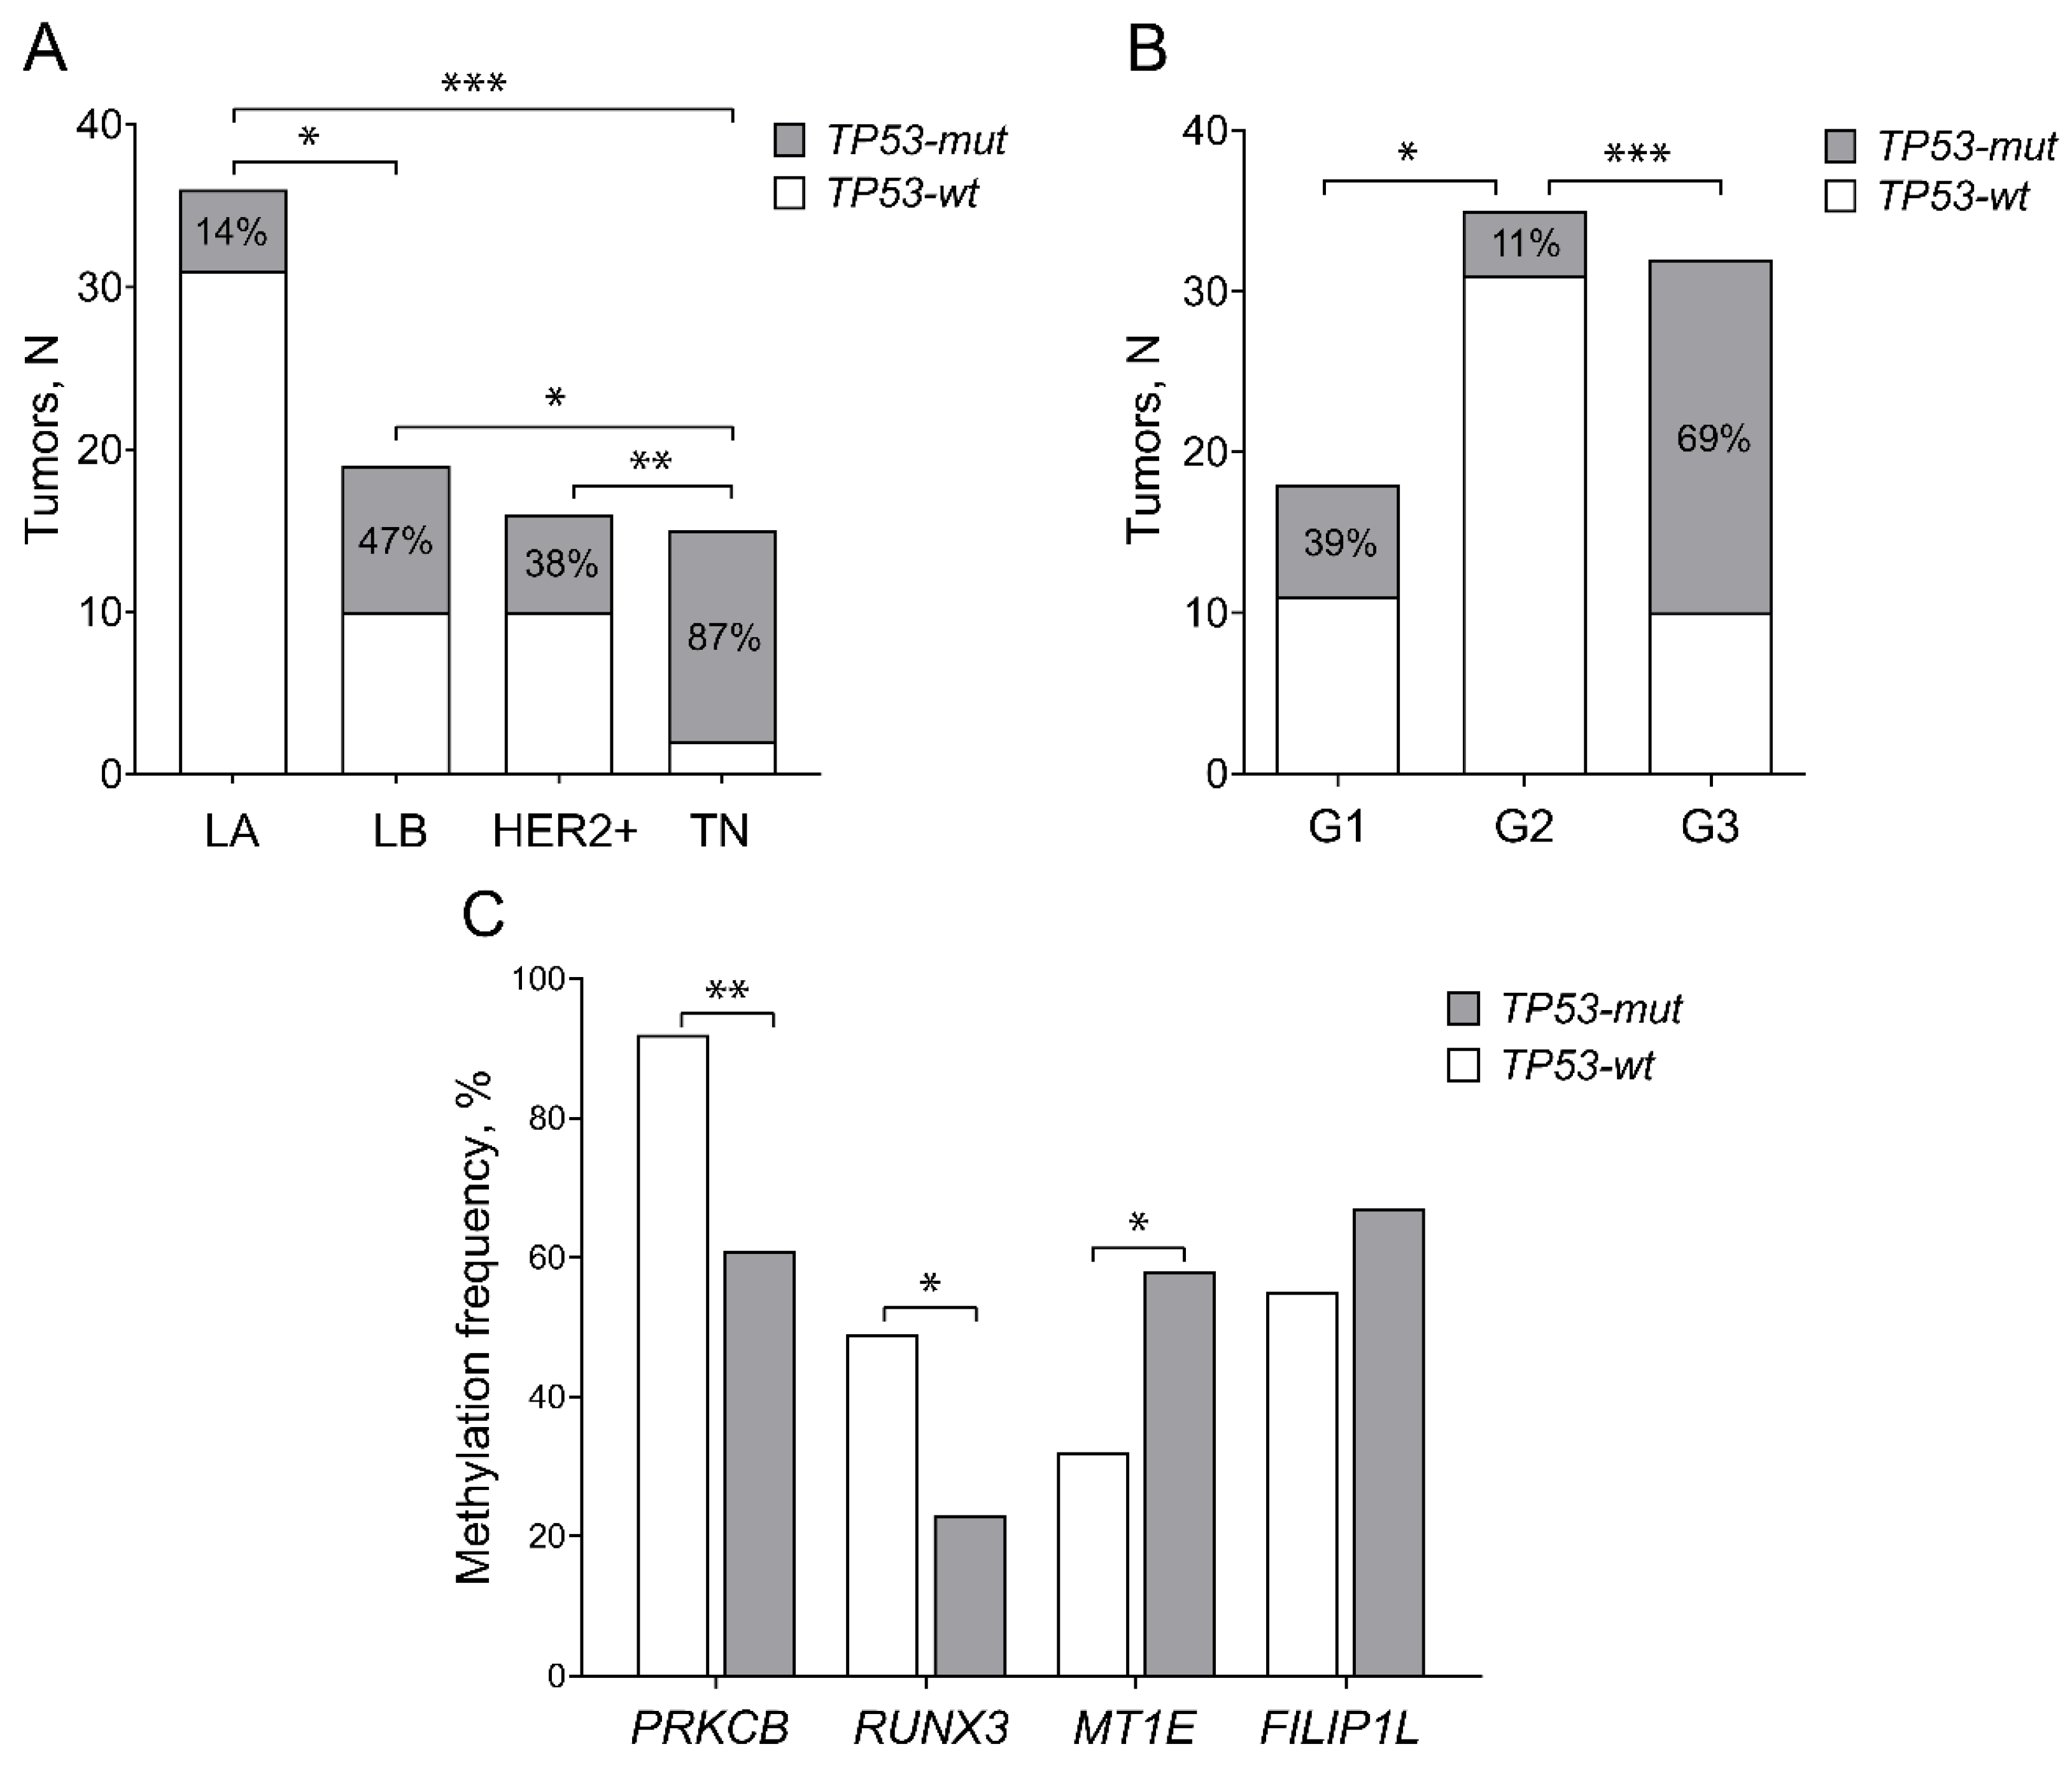
2.3. TP53 Mutations Predominate in TN BC Subtype

TP53-mut cases were frequently negative for ER and/or PR (79%, p < 0.0001 and 57%, p = 0.006, respectively); consequently, the TP53 gene alterations were predominant in the TN BC subtype (81%) and were relatively rare in HER2+ (26%), LB (39%), and LA (9%) BC subtypes (all p < 0.05; Figure 3A). Additionally, TP53-mut tumors had a significantly higher expression of Ki-67 (p < 0.0001); however, no associations were found with HER2 (p > 0.05).
Analysis of other clinical–pathological variables revealed that poorly differentiated BC tumors (G3; 67%) were more frequently mutated than moderately differentiated tumors (G2; 11%; p < 0.0001; Figure 3B). The detailed comparison of clinical–pathological characteristics of patients according to TP53 mutation status is presented in Table 1. According to TP53 mutation status, almost two times more frequent methylation of MT1E was identified in TP53-mut than in TP53-wt BC cases (58% vs. 32%; p = 0.024), whereas methylation frequencies of PRKCB and RUNX3 were significantly higher in the TP53-wt subgroup (92% vs. 61%, p < 0.001, and 49% vs. 23%, p = 0.021, respectively; Figure 3C).

2.4. Prediction of Overall Survival

Univariate and multivariate Cox proportional hazards regression analyses were performed to analyze the associations between the biomarkers and the overall survival (OS) of BC cases. In univariate analysis, older age and TN subtype were significantly associated with shorter OS (p < 0.05). Out of the analyzed genetic biomarkers, only the hypermethylation of FILIPL1 tended to be associated with OS (HR = 3.3, 95% CI 0.9–12.0, p = 0.067; Table 2; presented are only the genes demonstrating HR > 1.0).
In multivariate analyses, by applying the inclusion criteria of HR>1.0 and p<0.2, the joint analysis consisting of FILIP1L, P16, RUNX3, age, G, N status, and TN subtype (underlined in Table 2) revealed that age (HR = 1.07, 95% CI (1.02–1.12); p = 0.010), TN status (HR = 13.92, 95% CI (2.97–65.20); p = 0.010), and RUNX3 methylation (HR = 4.64, 95% CI (1.15–18.75); p = 0.032; Table 2) are independent prognostic factors for OS.
In the Kaplan–Meier survival analysis, various combinations of biomarkers were predictive for the outcome: RUNX3 combinations with MT1E or FILIP1L (p = 0.045 and p = 0.039, respectively; Figure 4A,B) or all three biomarkers also significantly predicted the poor outcome (p = 0.031; Figure 4C). In addition, FILIP1L methylation was predictive of poor outcomes in the TP53-mut subgroup (p = 0.045; Figure 4D).

3. Discussion

The heterogeneity of BC is reflected by gene expression patterns known as intrinsic BC subtypes, which nowadays are classified according to IHC biomarkers; however, these subtypes further vary in the abundance of genetic mutations and epigenetic alterations. The luminal and HER2 receptor-expressing BC can be treated using modern targeted therapy, unlike the TN subtype, which is the most heterogeneous group of BC lacking efficient diagnostic and treatment modalities [9]. Early BC diagnostics, especially the TN subtype, could improve BC survival rates; therefore, the traditional IHC-based diagnostic methods may benefit from supplementing by genetic and epigenetic biomarkers.
DNA methylation changes of selected genes were identified in all BC, and the methylation pattern of 10 out of 17 tested genes statistically significantly separated tumors from noncancerous breast tissues. DNA methylation in some of the genes was predominant in less aggressive G1 (RASSF1 and ADAMTS12) or Ki-67 negative (PRKCB and APC) tumors, indicating an early occurrence of epigenetic events. Moreover, specific DNA methylation patterns were characteristic of intrinsic BC subtypes in our and other studies [10,11]. For instance, luminal subtypes harbor subtype-specific methylation biomarkers like RASSF1, GSTP1, APC, ADAMTS12, and PRKCB [10,12]. In our study, the biomarker set of PRKCB, RASSF1, and APC was found to be hypermethylated in a majority of BC samples with the highest specificity to BC and was specific to hormonal and HER2+ BC subtypes as well, significantly distinguishing from the TN BC subtype. On the contrary, studies show that TN tumors have fewer DNA methylation changes than non-TN [13] but TN BC is the most heterogenous BC intrinsic subtype, molecularly subcategorized into smaller subgroups [14]. TN BC is diverse and difficult to study and therefore there is only a handful of studies assigning specific biomarkers to TN BC [15,16]. In our study, the increased DNA methylation rate of MT1E and FILIP1L significantly distinguished the TN BC subtype from luminal and HER2+ BC subtypes with twice higher hypermethylation frequency, and both showed an association with Ki-67 expression. Differences in DNA methylation patterns between and even within BC intrinsic subtypes demonstrate high biological variability of these tumors and show the need for further subclassification of BC for cost-effective treatment personalization.
Because of the high heterogeneity and limited treatment options, the survival of TN BC is well known to be the lowest; however, the complete picture of molecular pathways affected in TN BC remains unclear and targets for efficient treatment are yet to be found. Some of the studies reveal the significance of epigenetic factors in TN BC pathogenesis [17]. It has been demonstrated [18] that the hypomethylated profile TN has a better survival than hypermethylated, however, survival of TN BC cases of the medium methylated cluster was shown to be the worst. Genes hypermethylated in TN BC are involved in various cellular pathways and could be used to predict survival outcomes and response to treatment [15,16]. In our study, despite relatively low DNA methylation frequencies detected in TN BC, the hypermethylation of RUNX3, MT1E, and FILIP1L was highly specific to this subtype and associated with a shorter OS when analyzed alone (RUNX3) or in combinations (RUNX3, FILIP1L, and MT1E). RUNX3 encodes a tumor suppressor which regulates cell growth, survival, differentiation, angiogenesis, and invasion [19]; FILIP1L is a protein that inhibits metastases and chemoresistance [20]; MT1E is a cytoskeleton-modifying protein, involved in cell migration and invasion [21]. All these newly identified biomarkers of TN BC demonstrate the potential to accompany classic diagnostic methods and become a part of companion diagnostics for novel therapies, including combined treatment schemes that involve epigenetic drugs.
The TN BC subtype differs from luminal and HER2+ subtypes in a genetic and epigenetic manner. TP53 mutation is found in approximately 80% of TN BC cases [4,22] and is associated with poor prognosis [6]. Similarly, in our study, TP53 mutation predominantly occurred in TN BC (87%) but was rarely observed in other BC subtypes. In addition, our research showed that in TN BC, more than two-thirds of TP53 mutations occurred among poorly differentiated tumors and were associated with higher Ki-67 expression. In our study, more than half of TP53 alterations were missense mutations, which, according to Sousse and colleagues [23], result in a stable p53 protein that lacks its specific DNA-binding activity, accumulates in the cellular nucleus where, by interacting with oncogenes, causes cell transformations [24]. Although TP53 mutations are predominant in the TN subtype, they can also be associated with ER+ patients’ survival, affecting their response to endocrine therapy [25]. Taken together, TP53 is an important player in breast carcinogenesis and a significant target for specific treatment development.
Despite this study being performed by investigating both genetic and epigenetic alterations of BC, several shortcomings can be discussed. The study cohort included all BC subtypes and the TN BC part comprised only 14% of all cases; therefore, further analysis of TN BC-specific biomarkers should be extended to a larger independent TN BC cohort. As this study was started some years ago, more extensive use of the NGS method now is possible and looks more informative for TP53 mutations analysis. While different studies show that TP53 mutations could be associated with a poor, good, or neutral outcome, mainly, TP53-mut tumors are associated with worse OS [26]; however, in the current study, a TP53-mut association with worse OS was not demonstrated. Additionally, follow-up data were missing for some patients, which could have affected the OS statistics.

4. Materials and Methods

4.1. Patients and Samples

In total, 116 BC patients and 29 control cases with fibroadenoma (all white Caucasian race females) treated at the National Cancer Institute of Lithuania enrolled in the study in 2007–2009. The Bioethics Committee approved the study (2007-08-03 No. 33) and informed consent was obtained from every case before entering the study. All investigated BC cases were BRCA-negative non-familial cases. The mean age of BC patients was 57 years (range 27–84 yrs.), and 42 years for controls (range 20–62 yrs.); p < 0.05. All patients were diagnosed with invasive BC of early stages T1 (n = 63) and T2 (n = 53). The analyzed BC types were ductal (n = 101), lobular (n = 13) and apocrine (n = 2) breast carcinomas. The intrinsic subtypes of BC were identified based on the IHC status of pathology biomarkers: estrogen (ER) and progesterone (PR) receptors, human epidermal growth factor receptor-2 (HER2), and marker of tumor proliferation (Ki-67). Ki-67 cut-off in our study was 15%; therefore, >15% was considered as Ki-67 positive and, on the contrary, <15% of Ki-67 was considered as Ki-67 negative. In addition, 47% were of luminal A (LA, n = 55), 21% of luminal B (LB, n = 24), 18% were HER2+ (n = 21, out of which 16 and 5 cases were LBHER2 and HER2, respectively), and 14% were triple-negative (TN, n = 16) BC cases. Follow-up data were available for 78 of 116 (67%) BC cases and the average follow-up time was 91 (range 3–113) months. Out of 78 patients whose outcomes were known, 21 cases were deceased, 1 relapsed, and 56 were in remission. Detailed information on demographic and clinical–pathological variables according to intrinsic BC subtypes is provided in Table 3.

4.2. DNA Extraction

DNA was extracted by the standard phenol-chloroform purification and ethanol precipitation method and using ZR Viral DNA/RNA Kit™ (Zymo Research, Irvine, CA, USA) from fresh-frozen and ground tumor tissue specimens (n = 79) after digestion with proteinase K and from formalin-fixed paraffin-embedded (FFPE) tissues (n = 45) after the deparaffinization. DNA concentration and quality parameters were evaluated spectrophotometrically by using NanoDropTM 2000 (Thermo Scientific, Thermo Fisher Scientific (TFS), Waltham, MA, USA).

4.3. DNA Methylation Assay

Isolated DNA (400 ng) was first modified with sodium bisulfite using EZ DNA Methylation™ Kit (Zymo Research, Irvine, CA, USA) according to the manufacturer’s recommendations. For DNA methylation assessment, the pairs of primers specific to methylated (M) and unmethylated (U) sequences within the 5‘region of P14, P16, MGMT, RARB, RASSF1, DAPK1, GSTP1, ESR1 (two 5′ regions of the ESR1 gene, one in promoter region and one intragenic sequence, were included into this study and marked as ESR1-1 and ESR1-4, respectively), PRKCB, MT1E, MT1F, MT1G, APC, ADAMTS12, and RUNX3. Genes were designed using Methyl Primer Express v1.0 software (Applied Biosystems (ABI), TFS) or selected based on BC specificity and diagnostic and/or outcome prediction capabilities from our previous studies [27,28,29] (see Supplementary Table S3). Methylation-specific PCR (MSP) mix of the final volume of 25 µL contained 10 ng of bisulfite-modified DNA template, PCR buffer, 1.6 mM of each dNTP, 2.5 mM of MgCl2, 1 µM of each primer, enhancer, and 0.5 U of Gold polymerase (ABI, TFS). PCR was performed in a thermocycler at the conditions provided in Supplementary Table S4. Each PCR run was performed by using two kinds of DNA methylation controls, methylated and unmethylated; in both cases, leukocyte DNA from healthy donors was used and, respectively, treated or untreated with CpG Methylase SssI (New England BioLabs) before the bisulfite modification. In addition, a non-template control (NTC), a reaction with water instead of a DNA template, was performed alongside each PCR run. Reaction products were analyzed electrophoretically in 3% agarose gel, stained with ethidium bromide, and visualized under UV illumination (GelDoc-It®310 Imaging system, Fisher Scientific, TFS) using visualization and analysis software VisionWorks®LS (UVP, Upland, CA, USA).

4.4. TP53 Mutation Analysis

TP53 mutation status (exons 4–8) was evaluated by means of single-strand conformation analysis (SSCP; N = 84) and validated with Sanger sequencing (N = 29) and/or next-generation sequencing (NGS; N = 38). Mutation analysis was performed using IARC TP53 (https://www.iarc.who.int/ (accessed on 20 July 2017)) [30] and The Catalogue of Somatic Mutations in Cancer (COSMIC; https://cancer.sanger.ac.uk/cosmic (accessed on 20 July 2017)) [31] databases.
Single-strand conformation polymorphism (SSCP) analysis was performed to analyze 5–9th TP53 exons. DNA was amplified by PCR, using primers labeled with fluorescent dyes: a forward primer with 6-FAM (6-carboxyfluorescein) and reverse-with HEX (4,7,2’,4’,5’,7’-hexachloro-6-carboxyfluorescein). Final PCR mix volume was 20 µL and consisted of 200 ng DNA template, GeneAmp 10 × PCR Buffer, 25 nM MgCl2, 4 mM dNTP mix, 5U/µL AmpliTaq GoldTM DNA polymerase (Applied Biosystems (ABI), TFS), 20 µM of each 6-FAM and HEX primers, DMSO, and deionized H2O. SSCP mix contained 0.5 µL PCR product, 0.5 µL GeneScan-500 LIZ size standard (ABI, TFS), and 15 µL HiDi formamide. T24 cell line DNA was used as a positive and healthy donor’s leukocyte DNA as a negative control. SSCP reactions were carried out on ABI PRISM 3130® Genetic Analyzer and the results were analyzed by using GeneMapperTM software (both from ABI, TFS), by which the displacements or alterations in the electropherogram peaks were recorded as mutations.
Sanger sequencing (SS) was used to confirm mutations detected by SSCP. Analyzed 5–9th TP53 exons of SSCP-positive samples were first amplified by PCR, consisting of 200 ng DNA templates and the same reaction components as were used for SSCP analysis, which is described above. The sequencing reaction (20 µL), contained 5 µL PCR product, BigDye Terminator v3.1 Ready Reaction mix (ABI, TFS), 5× Sequencing Buffer, sense and antisense primers, and H2O. Sequencing reactions were carried out on ABI Prism 3130® Genetic Analyzer and analyzed with SeqScapeTM software (ABI, TFS). Results were compared with reference TP53 sequence from GenBank® database. SSCP and SS methods were adapted from Holmila and Husgafvel-Pursiainen [32].
Next-generation sequencing (NGS) was performed using GS Junior 454 Sequencer (Roche Diagnostics by 454 Life science corp. Branford, CT, USA). A healthy female leukocyte DNA was used as a reference. All fragments were sequenced in both directions. DNA was amplified in 24 µL reaction mix, which contained 1x Phusion HF buffer, 0.2 mM of each dNTP, 0.3 µM of each primer, 0.5 U/µL HiFi Phusion polymerase, and 25 ng of DNA template (see details in Supplementary Table S5) Amplicons were purified with AMPure XP magnetic beads (TFS). Reaction products were fluorometrically analyzed using the Quant-ItTM PicoGreen dsDNA Assay kit (TFS) and the QuantiFluor system® (Promega, Madison, WI, USA). Standard curve value was not less than R2 > 0.98. Emulsion PCR was performed using the emPCR Kit according to manufacturer’s instructions. Amplicons were mixed with capture beads using 10 uL of DNA library (at 1.33 molecules per bead concentration) for each forward and reverse strand amplification by emPCR and collected with the GS Junior Titanium emPCR Oil and Breaking Kit. For the sequencing procedure, The GS Titanium Sequencing Kit and GS Junior Titanium series protocol were followed (Roche). Sequencing data analysis was performed using GS Amplicon Variant Analyzer (AVA) (Roche). TP53 sequence NC_000017.10 (NCBI37/hg19; Chr17:7571720…7590868) was used as the reference sequence (corresponding transcript and protein IDs are ENST00000269305.4 and P04637, respectively).

4.5. Statistical Analysis

The two-sided Fisher’s exact test was used for analysis of gene methylation status and other categorical clinical variables (for patients’ age, two groups of < 50 and > 50 yrs. were compared). Mann–Whitney testing was applied to continuous data. Cox proportional hazards regression (with backward variable selection) and Kaplan–Meier analysis (with multiple testing correction (Bonferroni) and additionally corrected p-values) were used to assess the associations between clinical parameters and survival. Calculations were performed by using GraphPad Prism 8.01 (GraphPad Software, Inc., San Diego, CA, USA) and MedCalc 12.7.0.0 (MedCalc Software Ltd., Ostend, Belgium). In all cases, p ≤ 0.05 was considered statistically significant.

5. Conclusions

DNA methylation of RASSF1, PRKCB, APC, and RUNX3 significantly separates BC from noncancerous specimens and also is more frequently found in non-TN BC cases, while higher methylation frequency of MT1E and FILIP1L is associated with TN BC. The combination of two-to-three epigenetic biomarkers (FILIP1L, RUNX3, and MT1E) is an informative tool for BC-outcome predictions. Further investigations of these DNA methylation biomarkers are needed, especially for improved characterization of the TN BC subtype.

Supplementary Materials

The supporting information can be downloaded at: https://www.mdpi.com/article/10.3390/ijms232315429/s1.

Author Contributions

Conception and design of the study: S.J., I.S. and K.D. Data acquisition: I.S., A.L., R.S., and K.D. Data analysis and interpretation: I.S., K.S., K.D., A.S.-J., R.S. and A.L. Manuscript draft: I.S. Manuscript editing and revision: I.S., K.S. and S.J. Final approval of manuscript: I.S., K.S., A.S.-J., K.D., R.S., A.L., M.D., V.O. and S.J. All authors have read and agreed to the published version of the manuscript.

Funding

This research was funded by the former Lithuanian State Science and Studies Foundation, grant No. C03/2007 and partially supported by the Research Council of Lithuania, grant No. MIP-109/2010.

Institutional Review Board Statement

This study was conducted according to the guidelines of the Declaration of Helsinki and approved by the Lithuanian Bioethics Committee (2007-08-03 No. 33).

Informed Consent Statement

Informed consent from all participants was gained before entering the study.

Data Availability Statement

The datasets analyzed during the current study are available from the corresponding author upon reasonable request.

Acknowledgments

We are grateful to the patients who agreed to contribute to the study. We also thank Ruta Maleckaite, Justina Gaizevska, Kristina Zukauskaite, Mark Bavirsa, Saule Zagreckaite, Rita Banciul, and Agne Sestokaite for the technical assistance.

Conflicts of Interest

The authors declare that they have no competing interests.

References

  1. Sung, H.; Ferlay, J.; Siegel, R.L.; Laversanne, M.; Soerjomataram, I.; Jemal, A.; Bray, F. Global Cancer Statistics 2020: GLOBOCAN Estimates of Incidence and Mortality Worldwide for 36 Cancers in 185 Countries. CA A Cancer J. Clin. 2021, 71, 209–249. [Google Scholar] [CrossRef] [PubMed]
  2. Lebert, J.M.; Lester, R.; Powell, E.; Seal, M.; McCarthy, J. Advances in the systemic treatment of triple-negative breast cancer. Curr. Oncol. 2018, 25, 142–150. [Google Scholar] [CrossRef] [PubMed] [Green Version]
  3. Waks, A.G.; Winer, E.P. Breast Cancer Treatment: A review. JAMA 2019, 321, 288–300. [Google Scholar] [CrossRef] [PubMed]
  4. Duffy, M.J.; Synnott, N.C.; Crown, J. Mutant p53 in breast cancer: Potential as a therapeutic target and biomarker. Breast Cancer Res. Treat. 2018, 170, 213–219. [Google Scholar] [CrossRef]
  5. Zilfou, J.T.; Lowe, S.W. Tumor Supressive Functions of p53. Cold Spring Harb. Perspect. Biol. 2009, 1, a001883. [Google Scholar] [CrossRef] [PubMed]
  6. Huszno, J.; Grzybowska, E. TP53 mutations and SNPs as prognostic and predictive factors in patients with breast cancer. Oncol. Lett. 2018, 16, 34–40. [Google Scholar] [CrossRef] [PubMed] [Green Version]
  7. Jovanovic, J.; Ronneberg, J.A.; Tost, J.; Kristensen, V. The epigenetics of breast cancer. Mol. Oncol. 2010, 4, 242–254. [Google Scholar] [CrossRef] [Green Version]
  8. Lo, P.K.; Sukumar, S. Epigenomics and breast cancer. Pharmacogenomics 2008, 9, 1879–1902. [Google Scholar] [CrossRef] [PubMed] [Green Version]
  9. Sporikova, Z.; Koudelakova, V.; Trojanec, R.; Hajduch, M. Genetic Markers in Triple-Negative Breast Cancer. Clin. Breast Cancer 2018, 18, e841–e850. [Google Scholar] [CrossRef]
  10. Holm, K.; Hegardt, C.; Staaf, J.; Vallon-Christersson, J.; Jonsson, G.; Olsson, H.; Borg, A.; Ringner, M. Molecular subtypes of breast cancer are associated with characteristic DNA methylation patterns. Breast Cancer Res. 2010, 12, R36. [Google Scholar] [CrossRef]
  11. Titus, A.J.; Way, G.P.; Johnson, K.C.; Christensen, B.C. Deconvolution of DNA methylation identifies differentially methylated gene regions on 1p36 across breast cancer subtypes. Sci. Rep. 2017, 7, 11594. [Google Scholar] [CrossRef] [PubMed] [Green Version]
  12. Sunami, E.; Shinozaki, M.; Sim, M.; Nguyen, S.; Vu, A.; Giuliano, A.; Hoon, D. Estrogen receptor and HER2/neu status affect epigenetic differences of tumor-related genes in primary breast tumors. Breast Cancer Res. 2008, 10, R46. [Google Scholar] [CrossRef] [PubMed] [Green Version]
  13. Fang, F.; Turcan, S.; Rimner, A.; Kaufman, A.; Giri, D.; Morris, L.G.T.; Shen, R.; Seshan, V.; Mo, Q.; Heguy, A.; et al. Breast cancer methylomes establish an epigenomic foundation for metastasis. Sci. Transl. Med. 2011, 3, 75ra25. [Google Scholar] [CrossRef] [PubMed] [Green Version]
  14. Yin, L.; Duan, J.J.; Bian, X.W.; Yu, S.C. Triple-negative breast cancer molecular subtyping and treatment progress. Breast Cancer Res. 2020, 22, 61. [Google Scholar] [CrossRef] [PubMed]
  15. Temian, D.C.; Pop, L.A.; Irimie, A.J.; Berindan-Neagoe, I. The Epigenetics of Triple-Negative and Basal-Like Breast Cancer: Current Knowledge. J. Breast Cancer 2018, 21, 233–243. [Google Scholar] [CrossRef] [PubMed]
  16. Pineda, B.; Diaz-Lagares, A.; Perez-Fidalgo, J.A.; Burgues, O.; Gonzalez-Barrallo, I.; Crujeiras, A.B.; Sandoval, J.; Esteller, M.; Lluch, A.; Eroles, P. A two-gene epigenetic signature for the prediction of response to neoadjuvant chemotherapy in triple-negative breast cancer patients. Clin. Epigenetics 2019, 11, 33. [Google Scholar] [CrossRef]
  17. Liu, X.P.; Hou, J.; Chen, C.; Guan, L.; Hu, H.K.; Li, S. A DNA Methylation-Based Panel for the Prognosis and Diagnosis of Patients with Breast Cancer and Its Mechanisms. Front. Mol. Biosci. 2020, 7, 118. [Google Scholar] [CrossRef] [PubMed]
  18. Stirzaker, C.; Zotenko, E.; Song, J.Z.; Qu, W.; Nair, S.S.; Locke, W.J.; Stone, A.; Armstrong, N.J.; Robinson, M.D.; Dobrovic, A.; et al. Methylome sequencing in triple-negative breast cancer reveals distinct methylation clusters with prognostic value. Nat. Commun. 2015, 6, 5899. [Google Scholar] [CrossRef] [Green Version]
  19. Lu, D.; Ma, Y.; Zhu, A.; Han, Y. An early biomarker and potential therapeutic target of RUNX3 hyper methylation in breast cancer, a system review and meta-analysis. Oncotarget 2017, 8, 22166–22174. [Google Scholar] [CrossRef] [Green Version]
  20. Kwon, M.; Kim, J.H.; Rybak, Y.; Luna, A.; Choi, C.H.; Chung, J.Y.; Hewitt, S.M.; Adem, A.; Tubridy, E.; Lin, J.; et al. Reduced expression of FILIP1L, a novel WNT pathway inhibitor, is associated with poor survival, progression and chemoresistance in ovarian cancer. Oncotarget 2016, 7, 77052–77070. [Google Scholar] [CrossRef] [PubMed]
  21. Ryu, H.; Jung, S.; Jung, T.; Moon, K.; Kim, I.; Jeong, Y.; Jin, S.; Pei, J.; Wen, M.; Jang, W. Role of metallothionein 1E in the migration and invasion of human glioma cell lines. Int. J. Oncol. 2012, 41, 1305–1313. [Google Scholar] [CrossRef] [PubMed] [Green Version]
  22. Li, J.P.; Zhang, X.M.; Zhang, Z.; Zheng, L.H.; Jindal, S.; Liu, Y.J. Association of p53 expression with poor prognosis in patients with triple-negative breast invasive ductal carcinoma. Medicine 2019, 98, e15449. [Google Scholar] [CrossRef] [PubMed]
  23. Soussi, T. p53 alterations in human cancer: More questions than answers. Oncogene 2007, 26, 2145–2156. [Google Scholar] [CrossRef] [Green Version]
  24. Zhou, W.; Muggerud, A.A.; Vu, P.; Due, E.U.; Sorlie, T.; Borresen-Dale, A.L.; Warnberg, F.; Langerod, A. Full sequencing of TP53 identifies identical mutations within in situ and invasive components in breast cancer suggesting clonal evolution. Mol. Oncol. 2009, 3, 214–219. [Google Scholar] [CrossRef] [PubMed] [Green Version]
  25. Hainaut, P.; Pfeifer, G.P. Somatic TP53 Mutations in the Era of Genome Sequencing. Cold Spring Harb. Perspect. Med. 2016, 6, a026179. [Google Scholar] [CrossRef] [PubMed] [Green Version]
  26. Shahbandi, A.; Nguyen, H.D.; Jackson, J.G. TP53 Mutations and Outcomes in Breast Cancer: Reading beyond the Headlines. Trends Cancer 2020, 6, 98–110. [Google Scholar] [CrossRef]
  27. Daniunaite, K.; Bakavicius, A.; Zukauskaite, K.; Rauluseviciute, I.; Lazutka, J.R.; Ulys, A.; Jankevicius, F.; Jarmalaite, S. Promoter Methylation of PRKCB, ADAMTS12, and NAALAD2 Is Specific to Prostate Cancer and Predicts Biochemical Disease Recurrence. Int. J. Mol. Sci. 2021, 22, 6091. [Google Scholar] [CrossRef]
  28. Serenaite, I.; Daniunaite, K.; Jankevicius, F.; Laurinavicius, A.; Petroska, D.; Lazutka, J.R.; Jarmalaite, S. Heterogeneity of DNA methylation in multifocal prostate cancer. Virchows Arch. 2015, 466, 53–59. [Google Scholar] [CrossRef] [PubMed]
  29. Maleckaite, R.; Zalimas, A.; Bakavicius, A.; Jankevicius, F.; Jarmalaite, S.; Daniunaite, K. DNA methylation of metallothionein genes is associated with the clinical features of renal cell carcinoma. Oncol. Rep. 2019, 41, 3535–3544. [Google Scholar] [CrossRef]
  30. Bouaoun, L.; Sonkin, D.; Ardin, M.; Hollstein, M.; Byrnes, G.; Zavadil, J.; Olivier, M. TP53 Variations in Human Cancers: New Lessons from the IARC TP53 Database and Genomics Data. Hum. Mutat. 2016, 37, 865–876. [Google Scholar] [CrossRef]
  31. Tate, J.G.; Bamford, S.; Jubb, H.C.; Sondka, Z.; Beare, D.M.; Bindal, N.; Boutselakis, H.; Cole, C.C.; Creatore, C.; Dawson, E.; et al. COSMIC: The Catalogue of Somatic Mutations in Cancer. Nucleic Acids Res. 2019, 47, D941–D947. [Google Scholar] [CrossRef] [Green Version]
  32. Holmila, R.; Husgafvel-Pursiainen, K. Analysis of TP53 gene mutations in human lung cancer: Comparison of capillary electrophoresis single strand conformation polymorphism assay with denaturing gradient gel electrophoresis and direct sequencing. Cancer Detect. Prev. 2006, 38, 1–6. [Google Scholar] [CrossRef]
Figure 1. Promoter methylation frequencies of the analyzed genes in breast cancer (BC): heatmap of entire BC cohort (A), tumors vs. controls (B), BC cases according to the intrinsic subtypes (C), tumor Ki-67 status (D), and differentiation grade (E). G1—good, G2—moderate, G3—poor differentiation grade; HER2+−HER2 positive and Luminal B HER2 positive; LA—Luminal A; LB—Luminal B; TN—triple-negative BC; TP53-mutTP53 mutated; * p < 0.05; ** p < 0.01; *** p < 0.001.
Ijms 23 15429 g001
Figure 2. The schematic view of TP53 sequencing analysis: the workflow (A), and Venn diagram depicting samples overlapping between different methodologies for mutation detection (B); NGS—next-generation sequencing; SS—Sanger sequencing; SSCP—single-strand conformation polymorphism.
Ijms 23 15429 g002
Figure 3. TP53 mutation distribution among breast cancer (BC) patients grouped according to intrinsic subtypes (A), tumor differentiation grades G (B), and methylation status of analyzed genes (C). G1—good, G2—moderate, G3—poor differentiation; HER2+—HER2 positive and LB HER2 positive; LA—Luminal A; LB—Luminal B; TN—triple-negative BC; TP53-mutTP53 mutated and TP53-wtwild type TP53 gene status; * p < 0.05; ** p < 0.01; *** p < 0.001.
Ijms 23 15429 g003
Figure 4. Overall survival prediction using RUNX3 in combination with MT1E (N = 9 vs. 27; corrected p = 0.180) (A) and FILIP1L (N = 14 vs. 22; corrected p = 0.156) (B), three biomarkers combination (N = 6 vs. 13; corrected p = 0.124) (C), and FILIP1L in the TP53-mut BC subgroup (N = 15 vs. 8; corrected p = 0.180) (D). CI: confidence interval; HR: hazard ratio; M—methylated and U—unmethylated status of biomarker; TP53-mutTP53 mutated.
Ijms 23 15429 g004
Table 1. Clinical parameters of TP53 mutation-positive (TP53-mut) and negative (TP53-wt) BC cases.
VariablesCharacteristicsTP53-mut,
N (%)
TP53-wt,
N (%)
p-Value
BC patients, N 3353
Median age at BC diagnosisyrs. (IQR)55 (24)61 (19)0.377
Histological typeDuctal; N (%)32 (38)46 (55)0.396
Lobular; N (%)1 (1)5 (6)
Pathological stageT1; N (%)15 (17)24 (28)1.0
T2; N (%)18 (21)29 (34)
Lymph node metastasisNo (N0); N (%)21 (25)25 (29)0.186
Yes (N1); N (%)12 (14)27 (32)
Tumor differentiation gradeG1; N (%)7 (8)11 (13)(G1 vs. G2) 0.032
(G1 vs. G3) 0.072.
(G2 vs. G3) < 0.0001
G2; N (%)4 (5)31 (36)
G3; N (%)22 (26)10 (12)
Intrinsic BC subtypeLA; N (%)5 (6)31 (36)(LA vs. LB) 0.010
(LA vs. HER2+) 0.073
(LA vs. TN) < 0.0001
(LB vs. HER2+) 0.734
(LB vs. TN) 0.030
(HER2 + vs. TN) 0.010
LB; N (%)9 (10)10 (12)
Her2+; N (%)6 (7)10 (12)
TN; N (%)13 (15)2 (2)
ER statusNegative; N (%)15 (18)4 (5)<0.0001
Positive; N (%)18 (21)48 (56)
PR statusNegative; N (%)16 (19)12 (14)0.018
Positive; N (%)17 (20)41 (48)
HER2 statusNegative; N (%)28 (33)43 (50)0.775
Positive; N (%)5 (6)10 (12)
Ki-67Negative; N (%)8 (9)39 (46)<0.0001
Positive; N (%)24 (28)14 (16)
SurvivalRemission; N (%)18 (31)24 (41)0.773
Death; N (%)6 (10)10 (17)
Abbreviations: ER—estrogen receptor; G1—good, G2—moderate, G3—poor differentiation grade; HER2—human epidermal growth factor receptor 2; HER2+—HER2 positive and Luminal B HER2 positive; IQR—interquartile range; LA—Luminal A; LB—Luminal B; N—lymph node affection; PR—progesterone receptor; T—tumor stage; TP53-mutTP53 mutated and TP53-wt—wild type TP53 gene status; TN—triple negative BC. The bolded p < 0.05.
Table 2. Univariate and multivariate Cox proportional hazards regression analysis for overall survival.
CovariateUnivariate AnalysisMultivariate Analysis
HR (95% CI)p-ValueHR (95% CI)p-Value
Methylated: yes/noFILIP1L3.33 (0.92−11.97)0.067
P163.14 (0.72−13.67)0.128
RUNX32.07 (0.7−5.50)0.1474.64 (1.15−18.75)0.032
P142.14 (0.29−16.03)0.462
MT1F2.02 (0.27−15.15)0.497
ADAMTS121.42 (0.51−3.98)0.502
DAPK11.34 (0.39−4.62)0.643
MT1E1.20 (0.47−3.11)0.704
NAALAD21.15 (0.43−3.11)0.779
Clinical–pathological charact.Age (cont.)1.04 (1.00−1.09)0.0491.07 (1.02−1.12)0.010
T (1 vs. 2)1.06 (0.42−2.69)0.897
N (yes/no)2.15 (0.84−5.53)0.113
G (≤2 vs. 3)1.55 (0.62−3.88)0.357
TN subtype (yes/no)2.91 (1.04−8.18)0.04413.92 (2.97−65.20)0.010
Molecular biomarkers (high/low):
ER0.61 (0.22−1.71)0.349
PR0.68 (0.26−1.74)0.422
HER20.25 (0.03−1.86)0.177
Ki-671.02 (0.40−2.58)0.963
TP53-mut (yes/no)0.95 (0.34−2.65)0.919
Abbreviations: CI: confidence interval; ER—estrogen receptor; G1—good, G2—moderate, G3—poor differentiation grade; HER2—human epidermal growth factor receptor 2; HR: hazard ratio; N—lymph node affection; PR—progesterone receptor; T—tumor stage; TP53-mutTP53 mutated; TN—triple-negative BC. Underlined are variables included in multivariate analysis. The bolded p < 0.05.
Table 3. Demographic and clinical–pathological characteristics of breast cancer (BC) patients distributed by breast cancer (BC) subtypes.
BC FeaturesBC Subtypes
LALBHER2+ *TNTotal BC Cases
N = 55 (%)N = 24 (%)N = 21 (%)N = 16 (%)N = 116 (%)
Median age at BC diagnosisyrs. (IQR)61 (19)58 (22)55 (23)52 (26)
HistologyDuctal; N (%)45 (82)22 (92)18 (86)16 (100)101 (87)
Lobular; N (%)8 (15)2 (8)3 (14)0 (0)13 (11)
Apocrine; N (%)2 (3)0 (0)0 (0)0 (0)2 (2)
Tumor stage T1; N (%)33 (60)13 (54)11 (52)6 (38)63 (54)
T2; N (%)22 (40)11 (46)10 (48)10 (63)53 (46)
Spread to lymph nodesN0; N (%)33 (54)13 (54)11 (52)10 (63)67 (58)
N1; N (%)21 (61)11 (46)10 (48)6 (38)48 (42)
GradeG1; N (%)16 (29)3 (13)2 (10)2 (13)23 (20)
G2; N (%)35 (64)7 (29)9 (43)1 (6)52 (45)
G3; N (%)4 (7)14 (58)10 (48)13 (81)41 (35)
Ki-67 expressionKi-67 neg; N (%)53 (96)0 (0)15 (71)0 (0)68 (59)
Ki-67 pos; N (%)2 (4)24 (100)6 (29)16 (100)48 (41)
Survival
(N = 78)
Remission; N (%)25 (71)13 (68)12 (92)6 (55)56 (72)
Death; N (%)10 (29)5 (26)1 (8)5 (45)21 (27)
Relapse; N (%)0 (0)1 (5)0 (0)0 (0)1 (1)
5-year survival (%)25 (71)16 (94)11 (92)6 (55)58 (74)
* LBHER2 and HER2; the count is 16 and 5, respectively. Abbreviations: G1—good, G2—moderate, G3—poor differentiation; HER2+—HER2 positive and Luminal B HER2 positive; IQR—interquartile range; LA—Luminal A; LB—Luminal B; N—lymph node affection; T—tumor stage; TN—triple-negative BC.
Publisher’s Note: MDPI stays neutral with regard to jurisdictional claims in published maps and institutional affiliations.

