
Comparative Transcriptome Analysis Unravels the Response Mechanisms of Fusarium oxysporum f.sp. cubense to a Biocontrol Agent, Pseudomonas aeruginosa Gxun-2
 ,
,
Abstract
:1. Introduction
2. Results
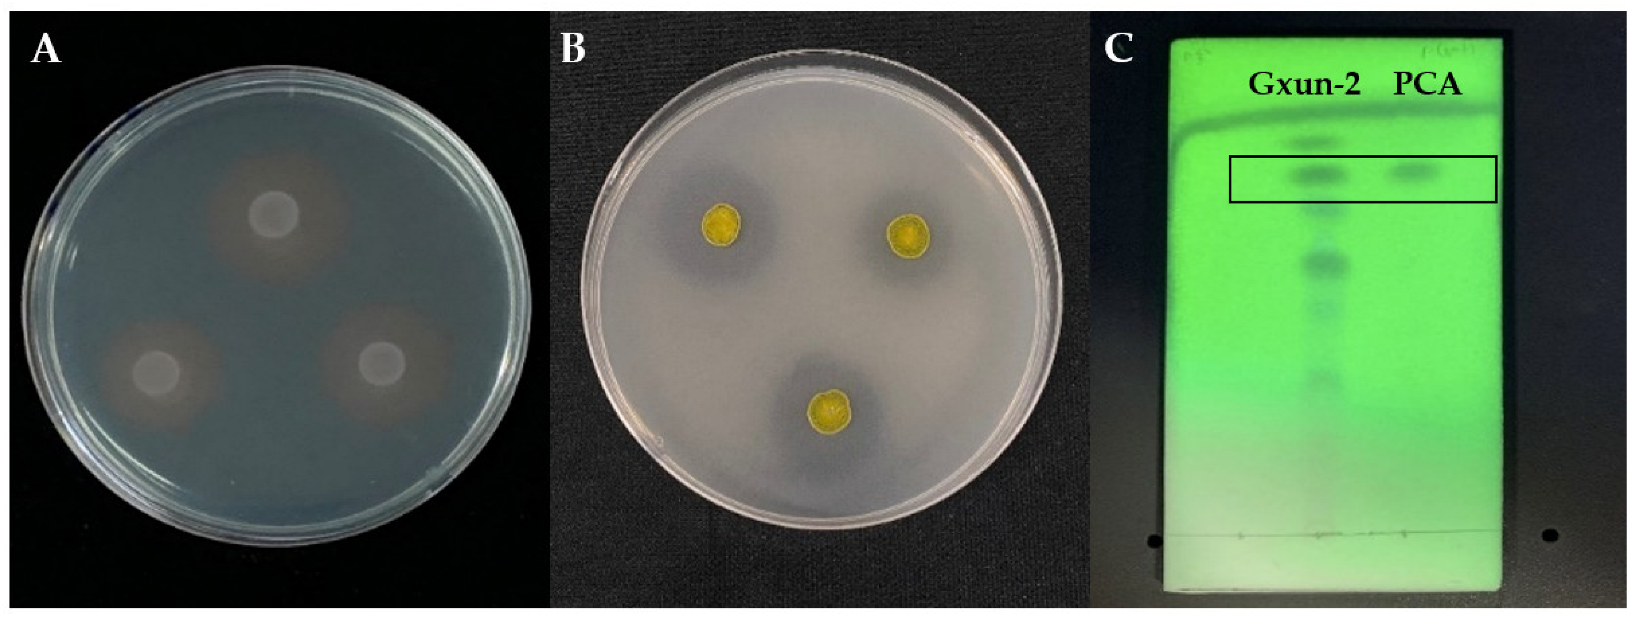
2.1. Effects of P. aeruginosa Gxun-2 on the Growth and Morphology of FOC TR4
2.2. Response Pattern of FOC TR4 to P. aeruginosa Gxun-2 Stress
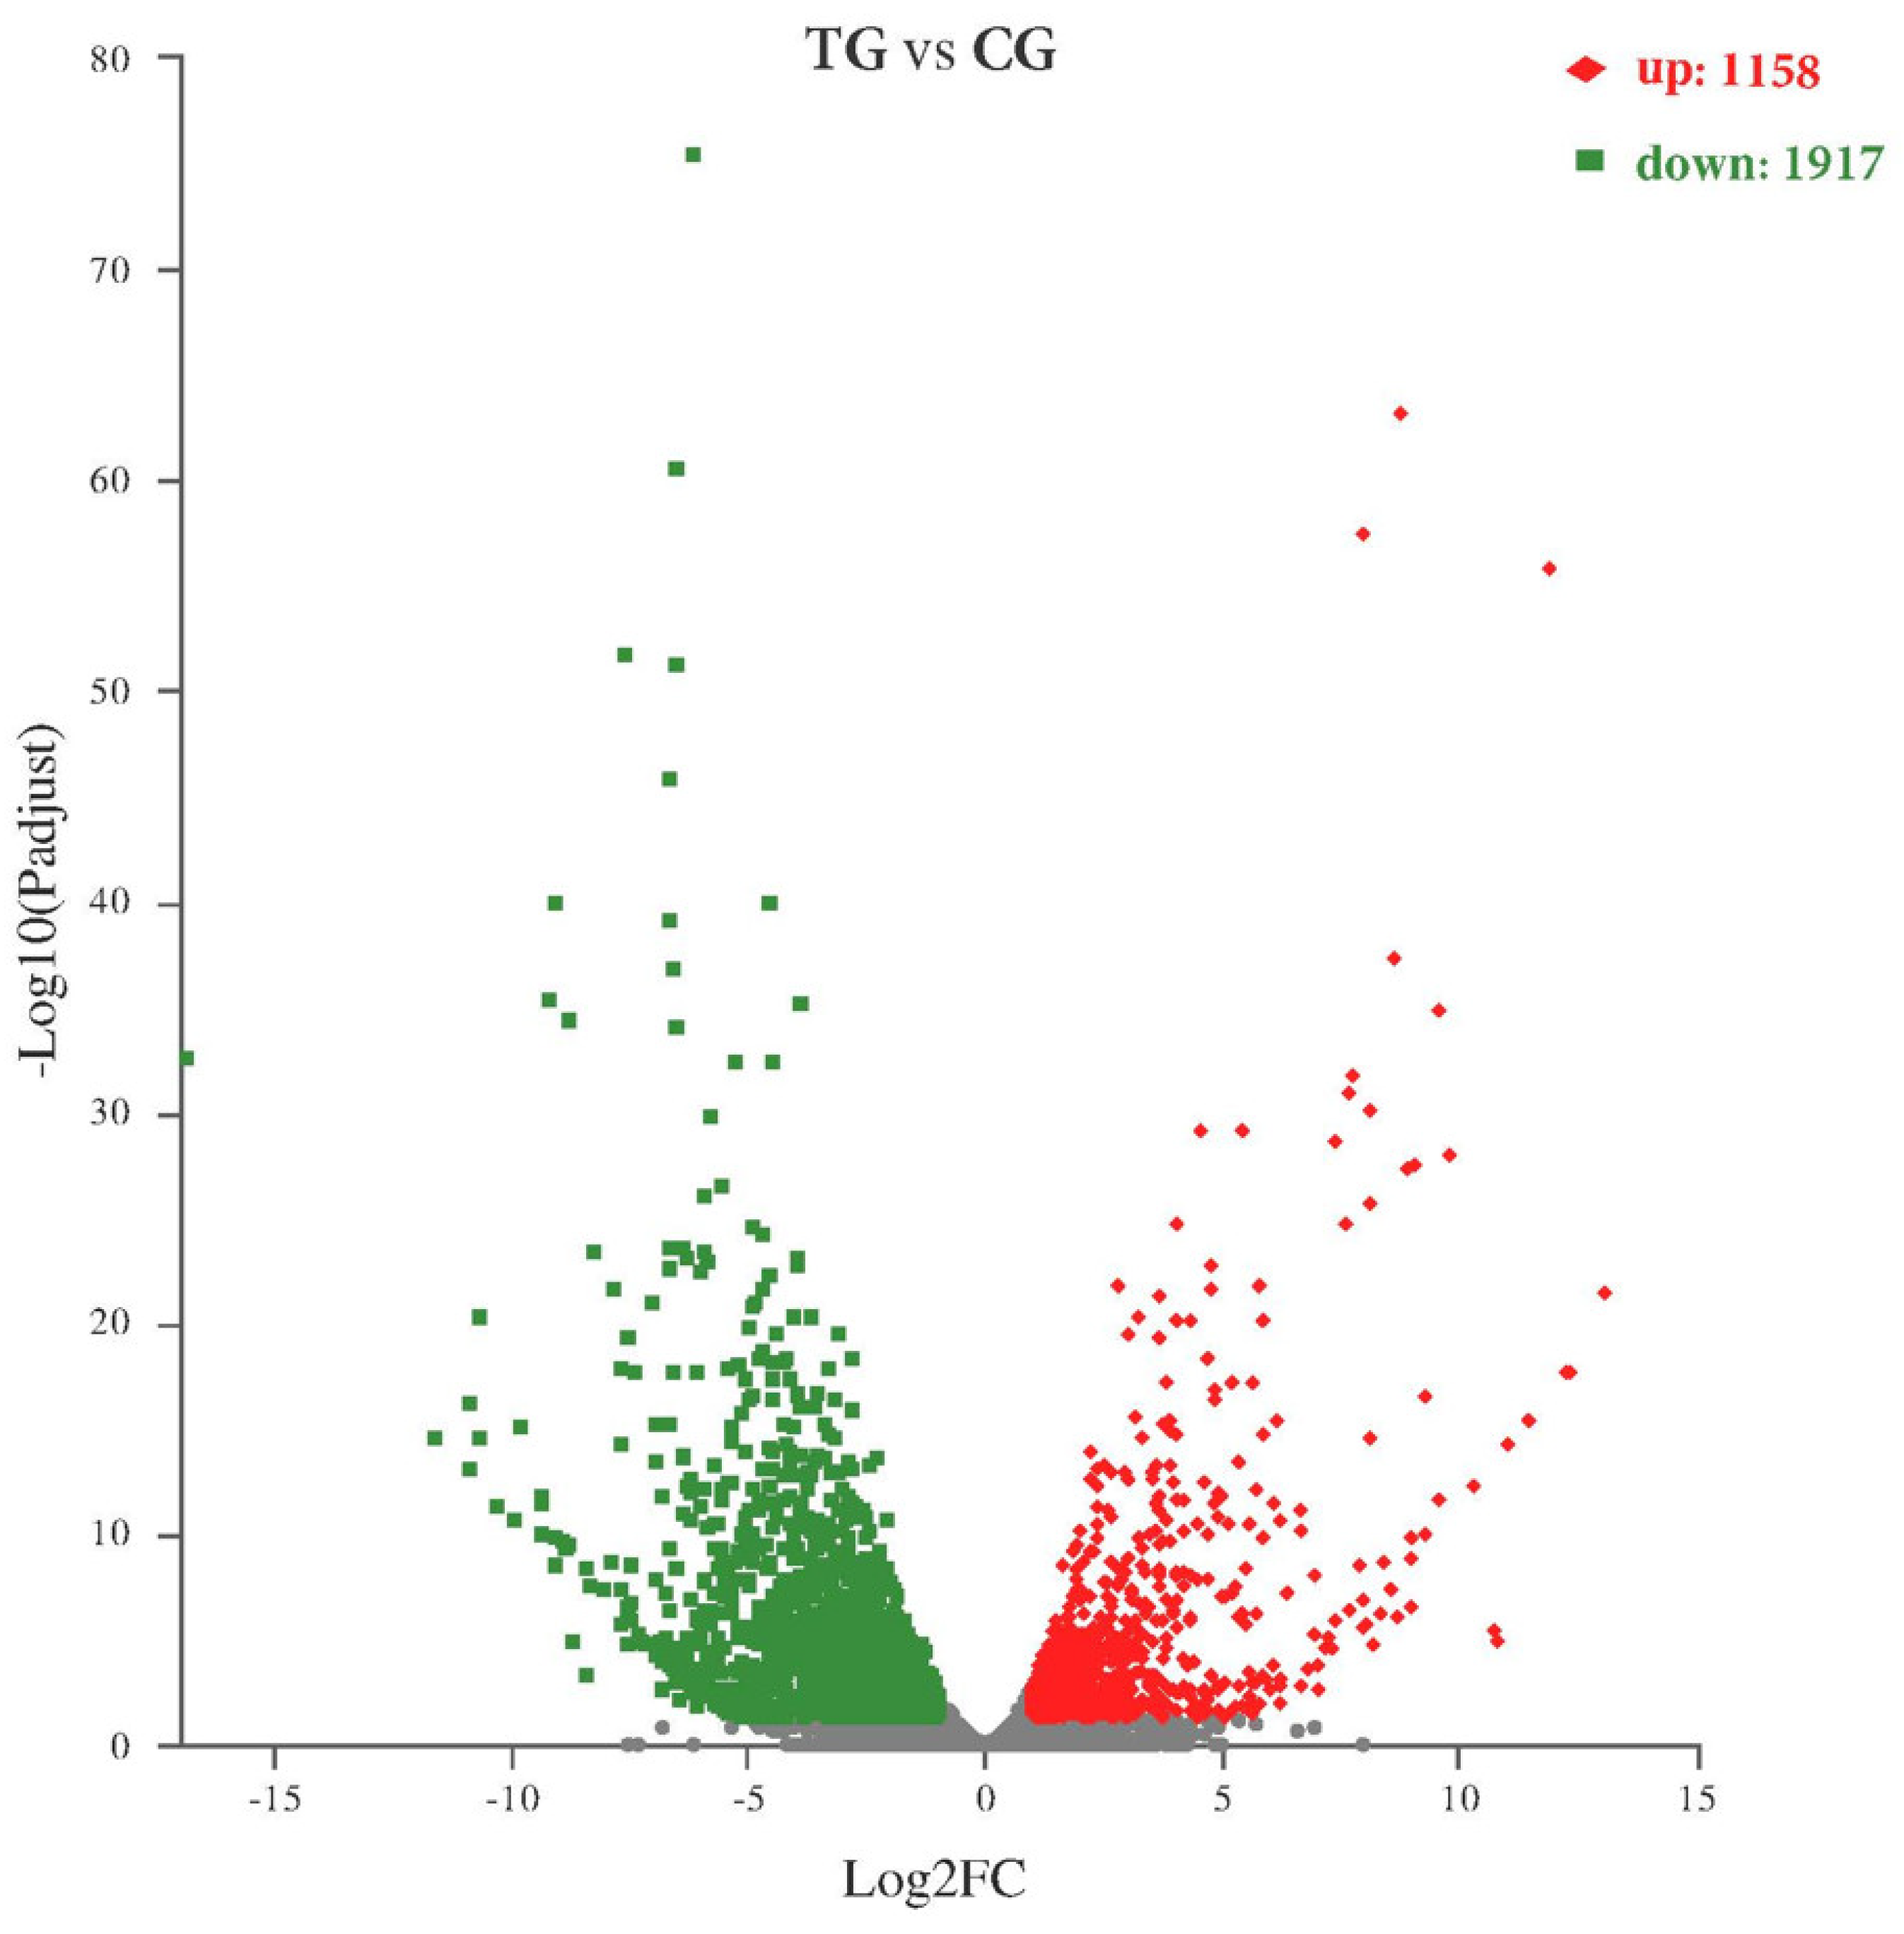
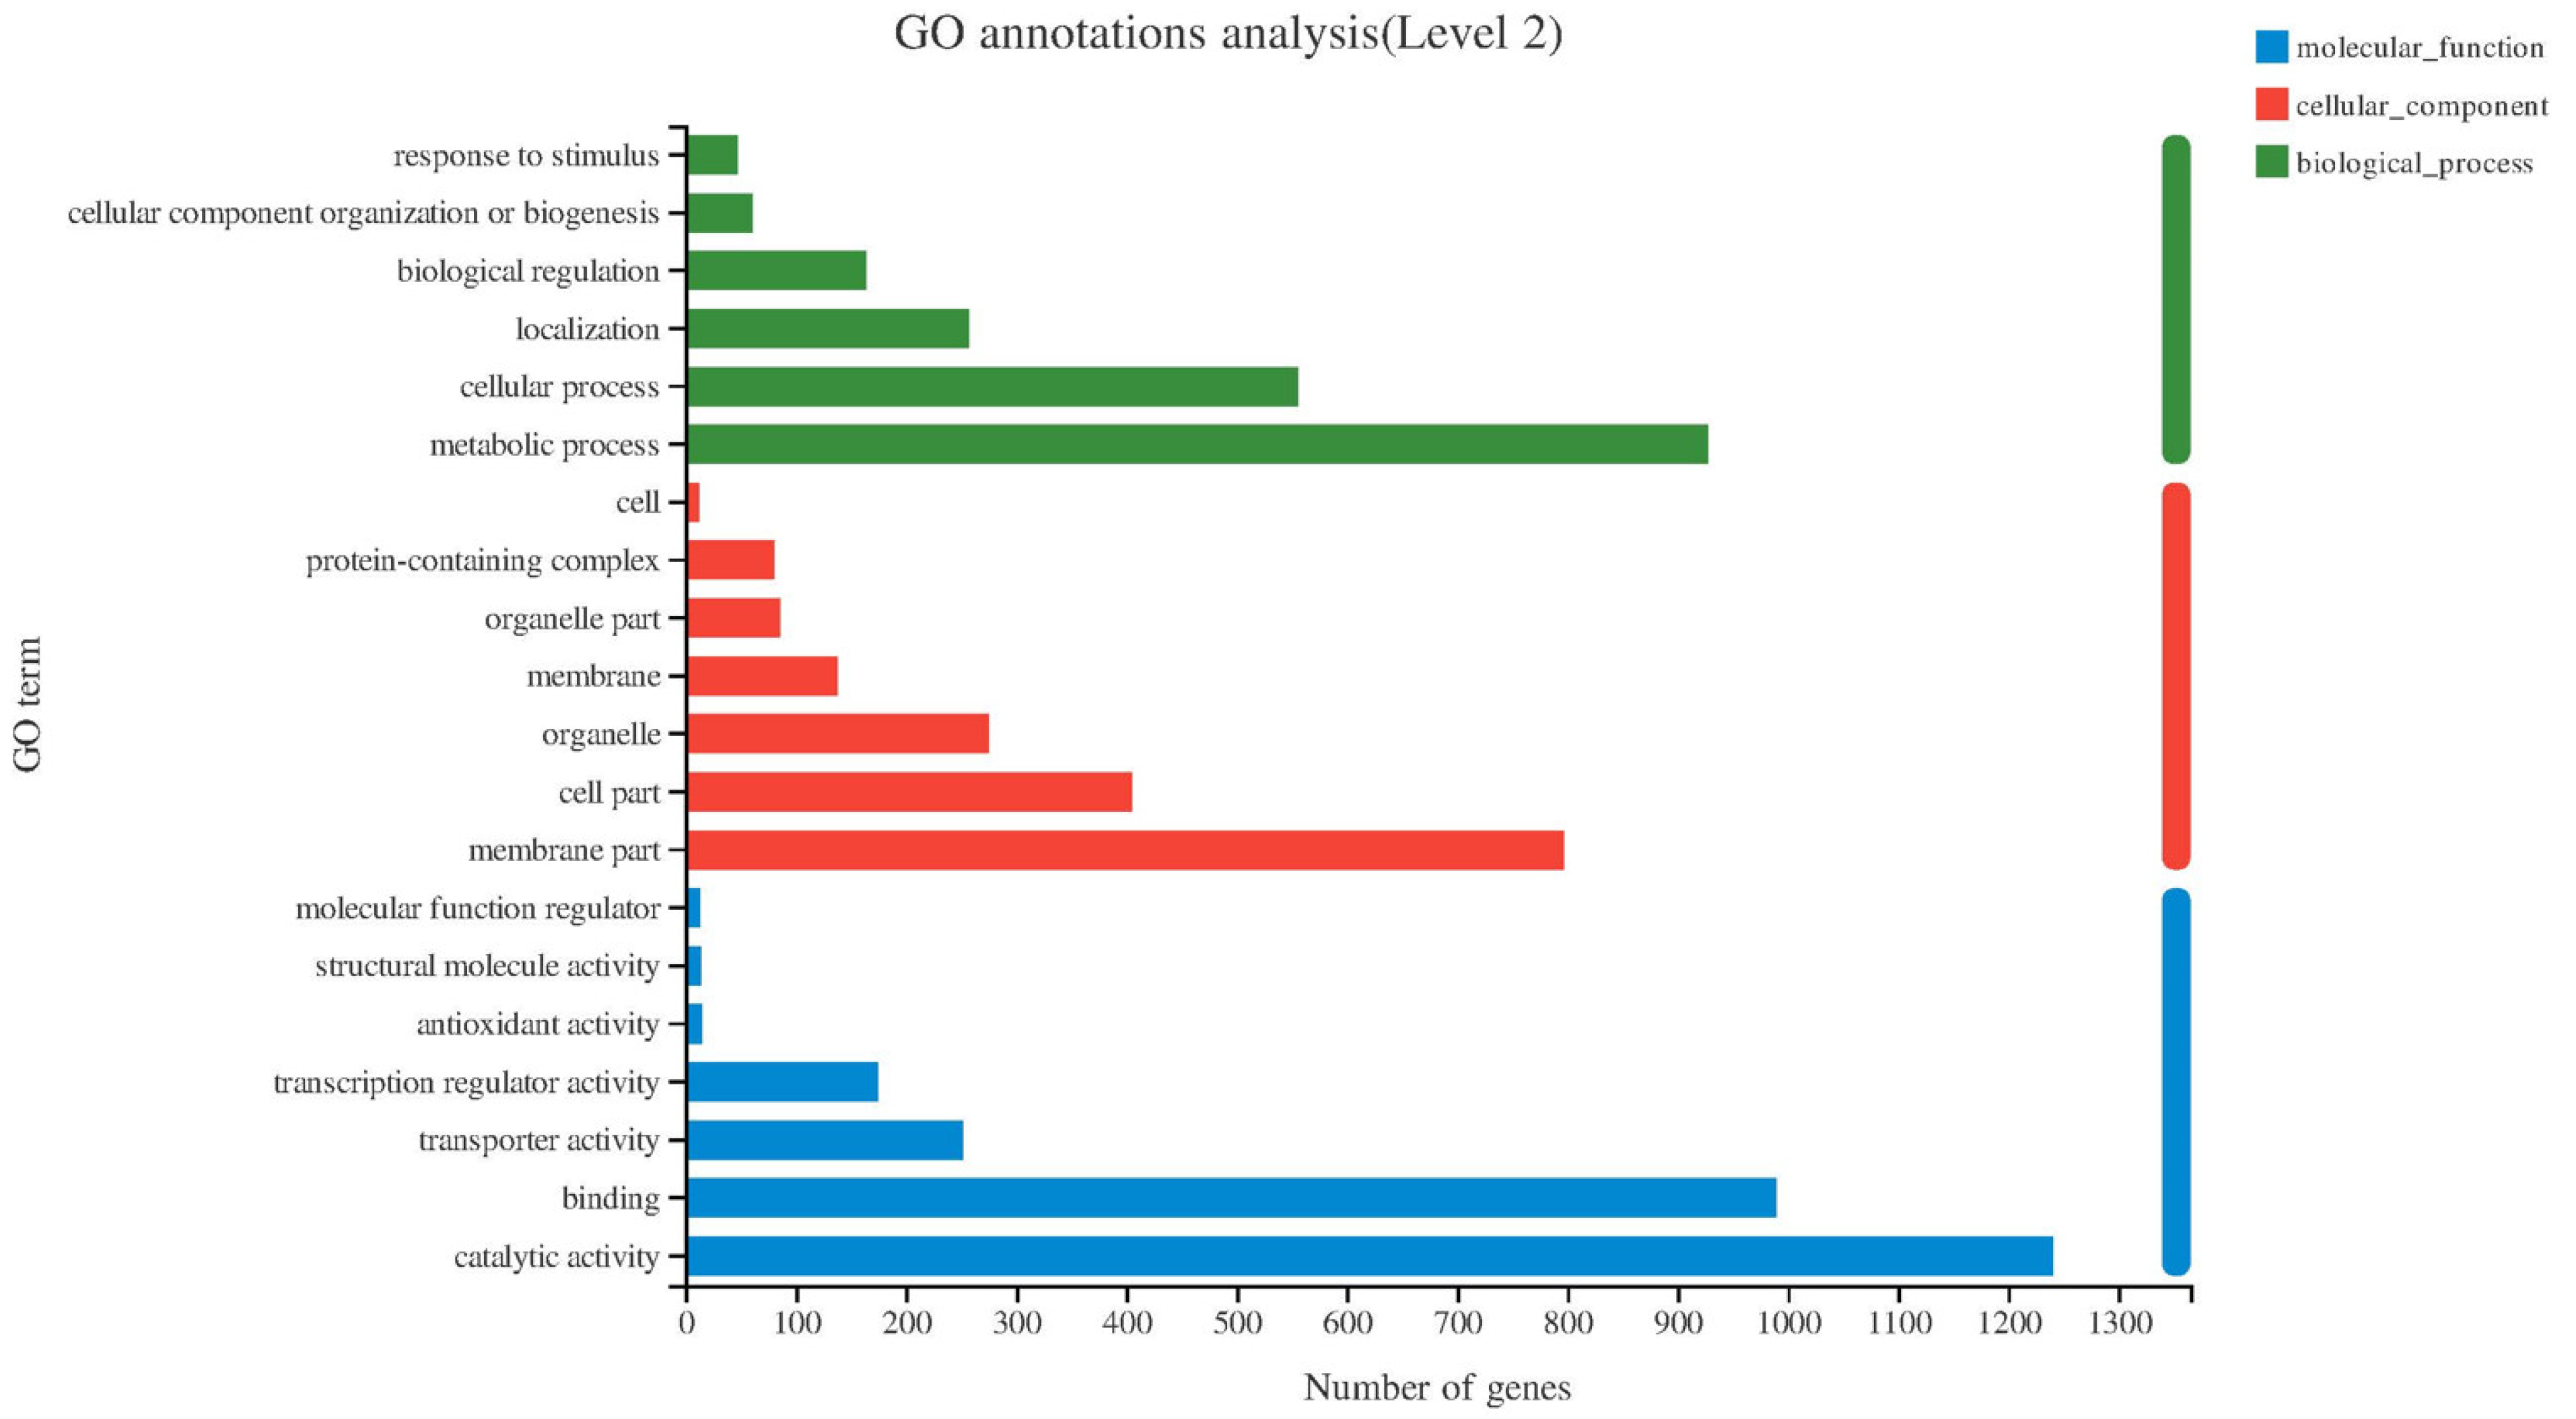
2.3. Differential Expression Analysis and GO, KEGG Enrichment Analysis
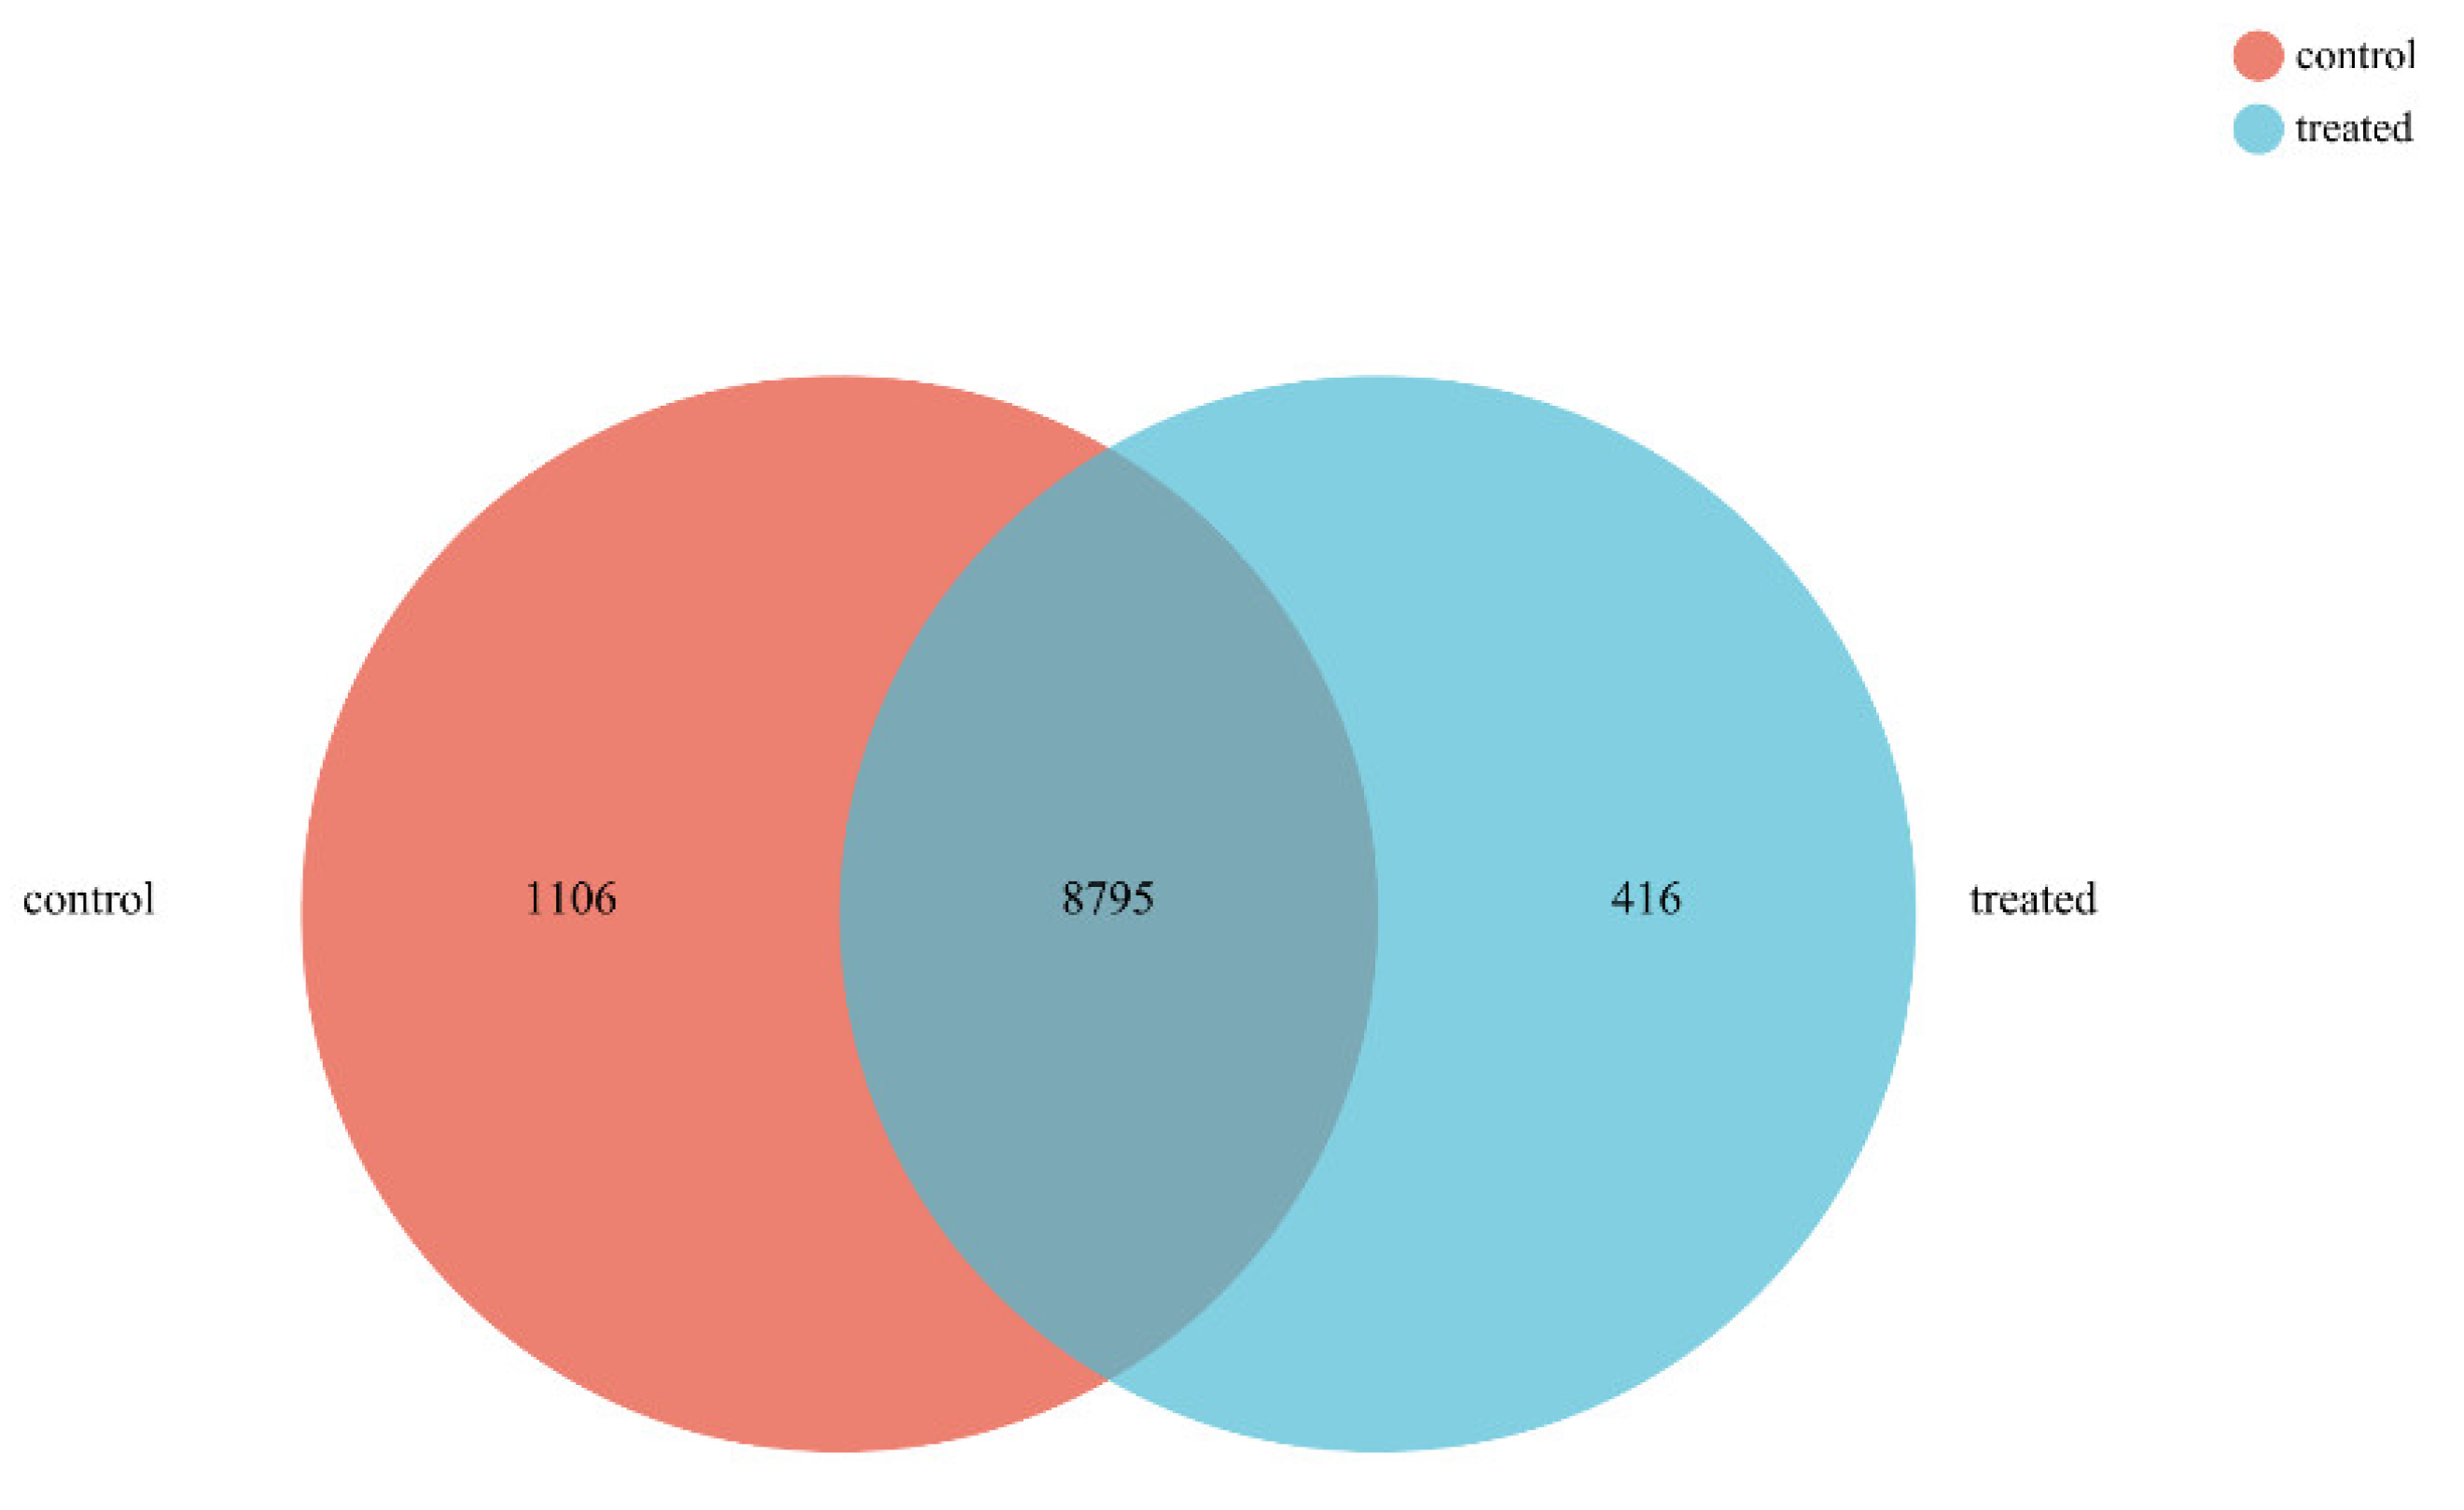
2.4. Comparative Analysis of DEGs
2.4.1. Antioxidant Activity-Related DEGs
2.4.2. Cell Wall Synthesis-Related DEGs
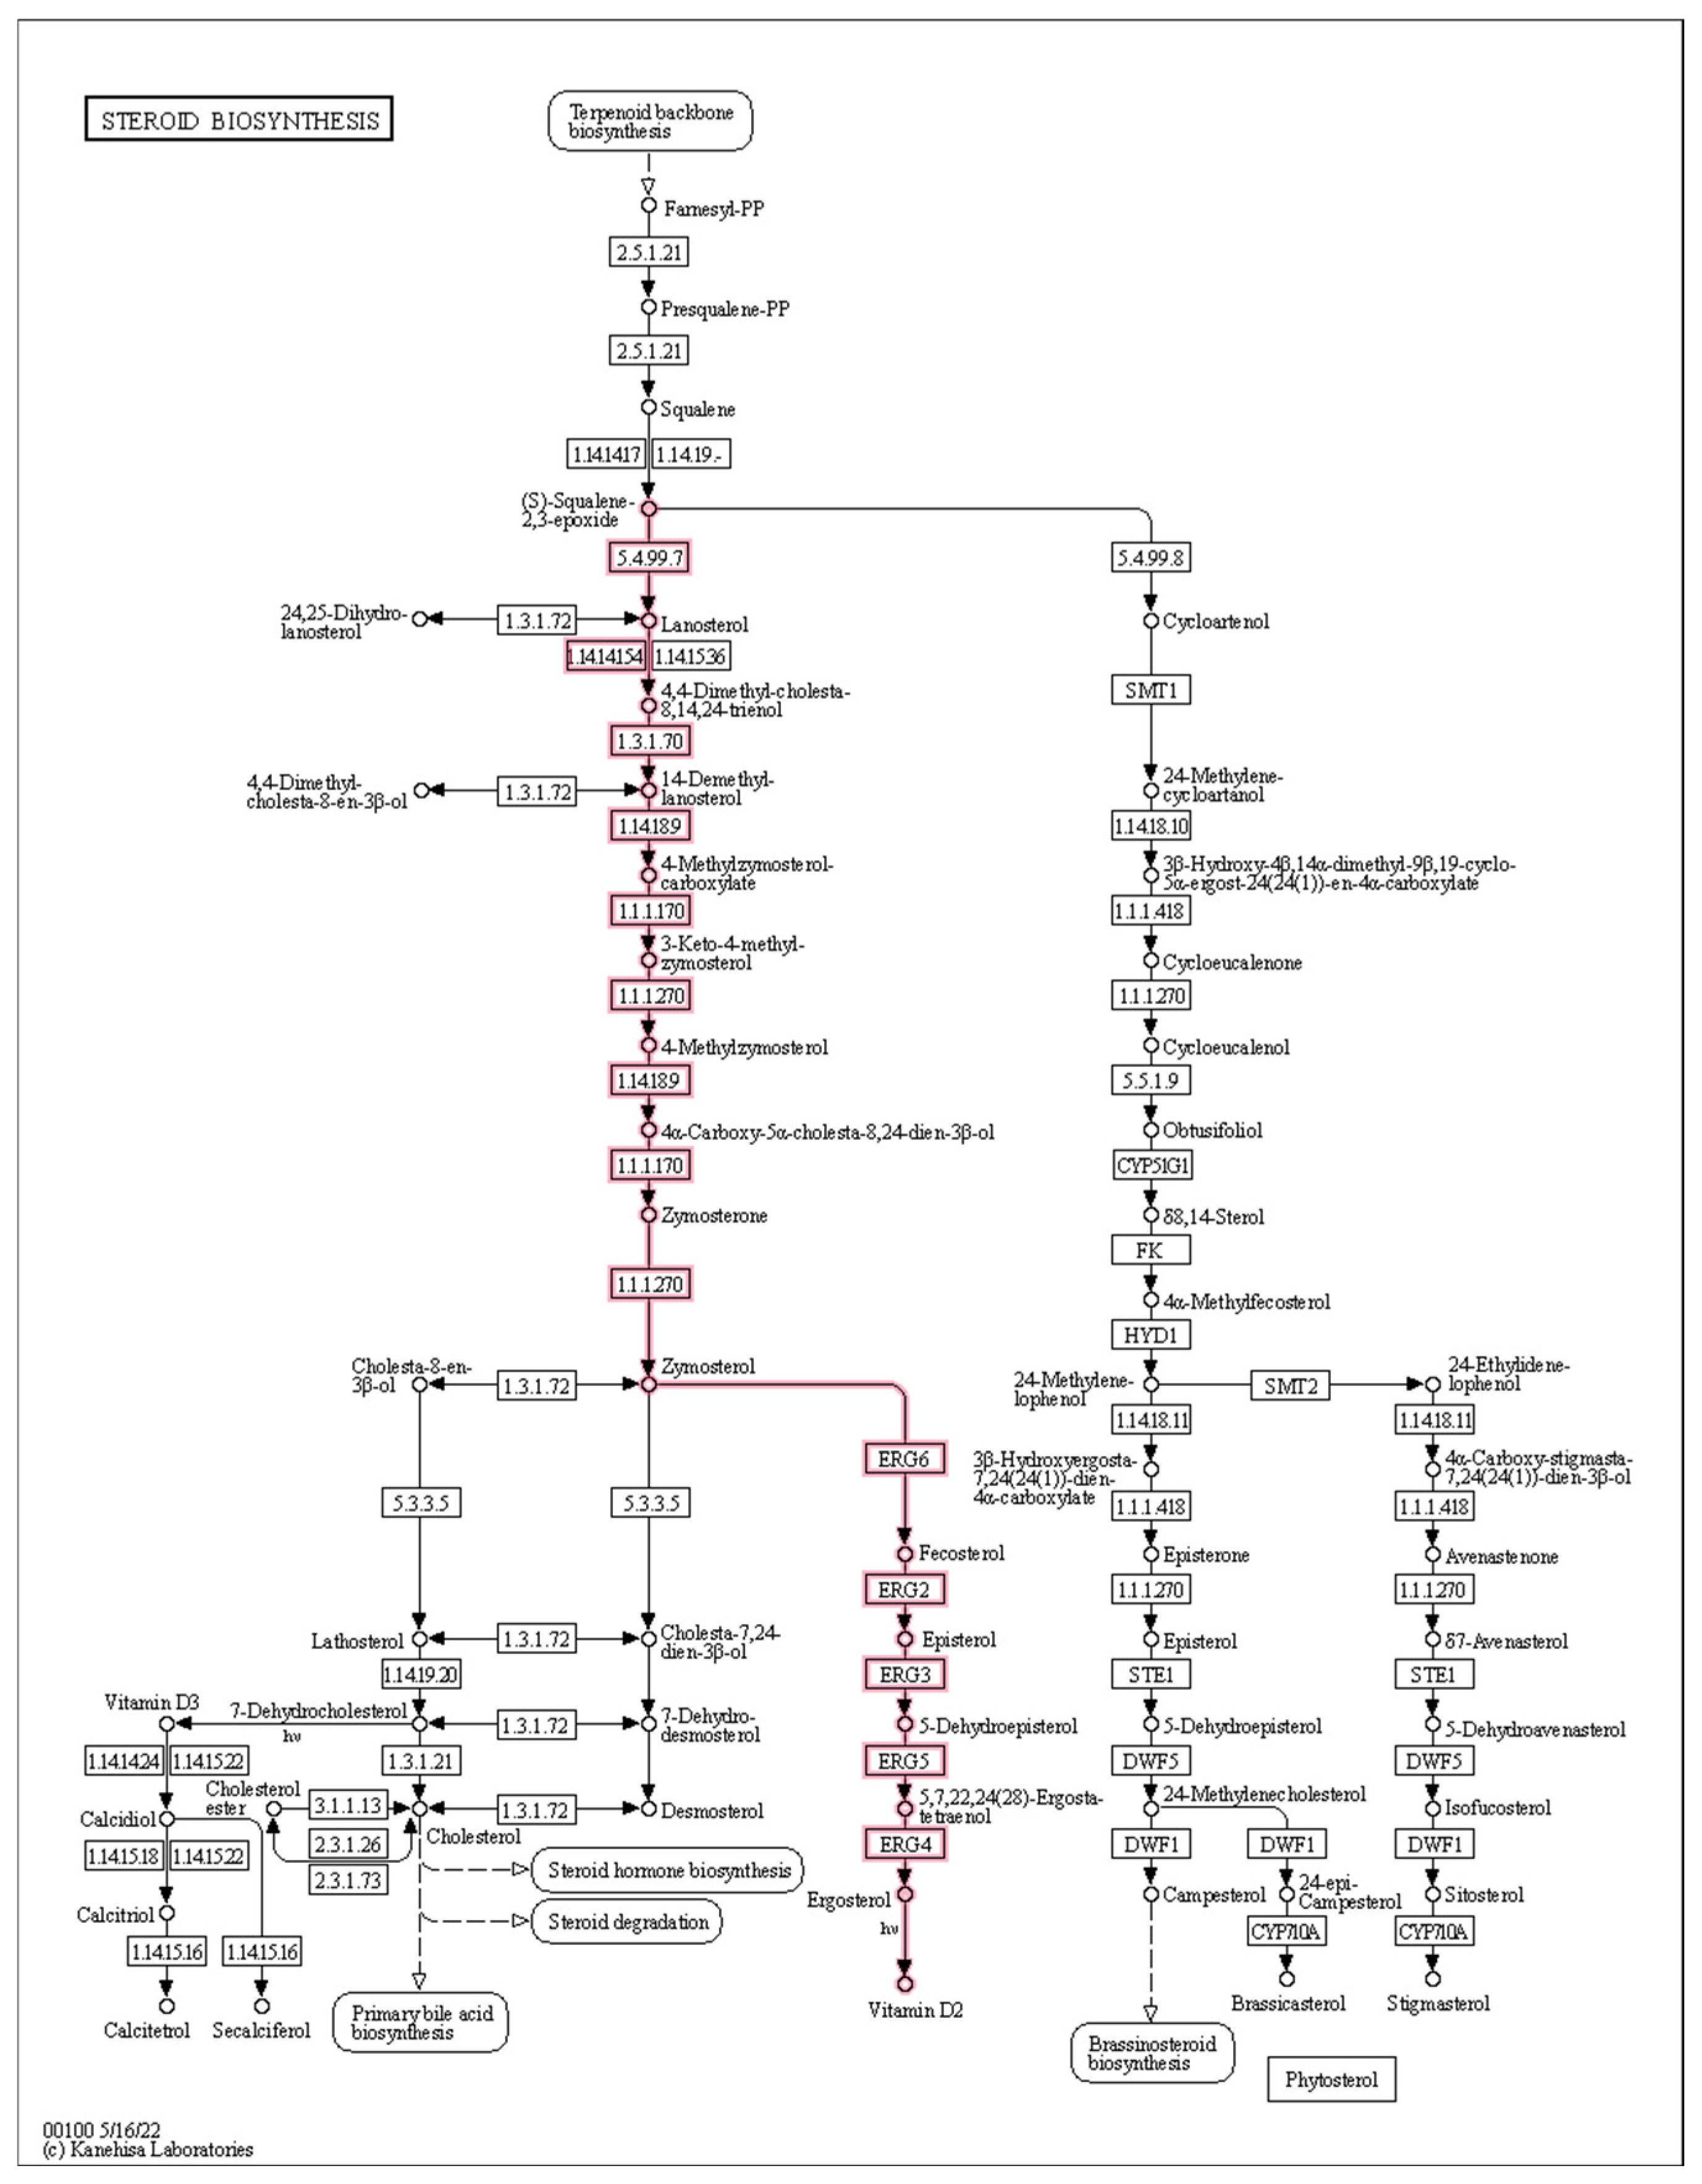
2.4.3. Cell Membrane Synthesis-Related DEGs
2.4.4. Autophagy-Related DEGs
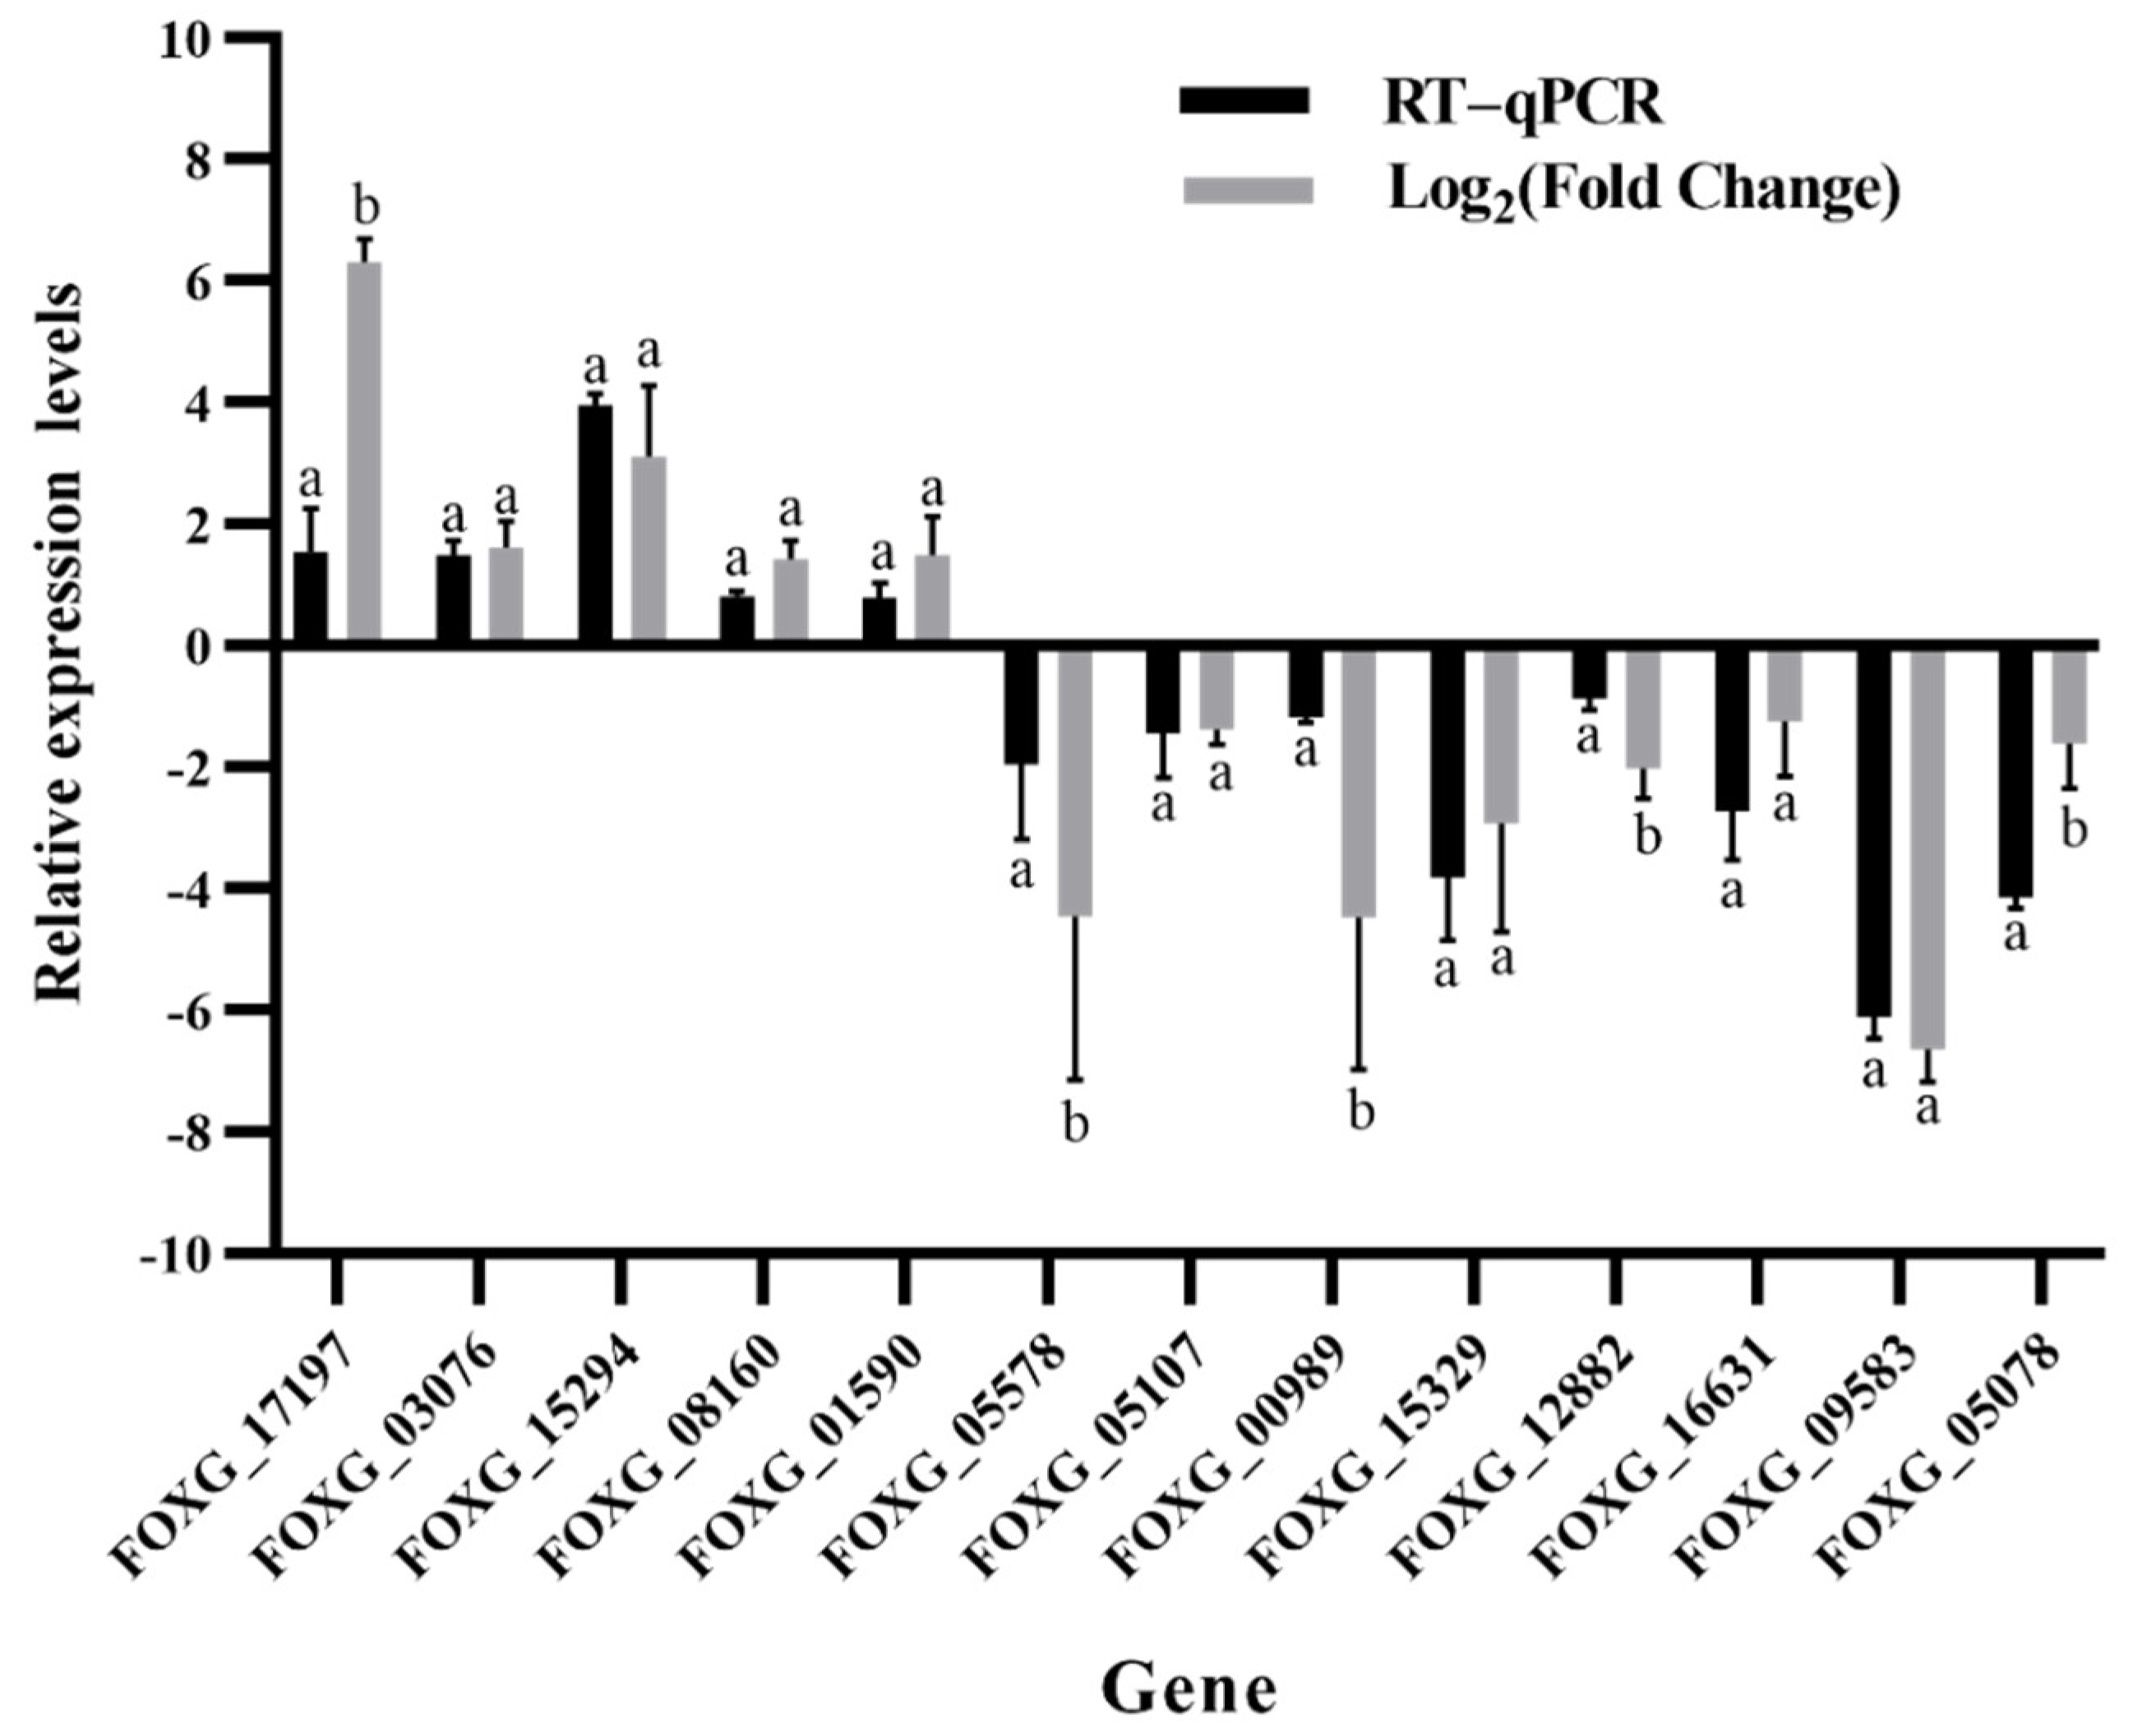
2.5. Validation of RNA-Seq Sequencing
3. Discussion
4. Materials and Methods
4.1. Strains and Culture Conditions
4.2. Inhibition of P. aeruginosa Gxun-2 to F. oxysporum and Its Mechanism
4.3. Preparation of FOC TR4 Mycelium and RNA Extraction
4.4. Preparation of FOC TR4 Mycelium and RNA Extraction
4.5. Differential Expression Analysis, GO, and KEGG Enrichment Analysis
4.6. RT-qPCR Assay
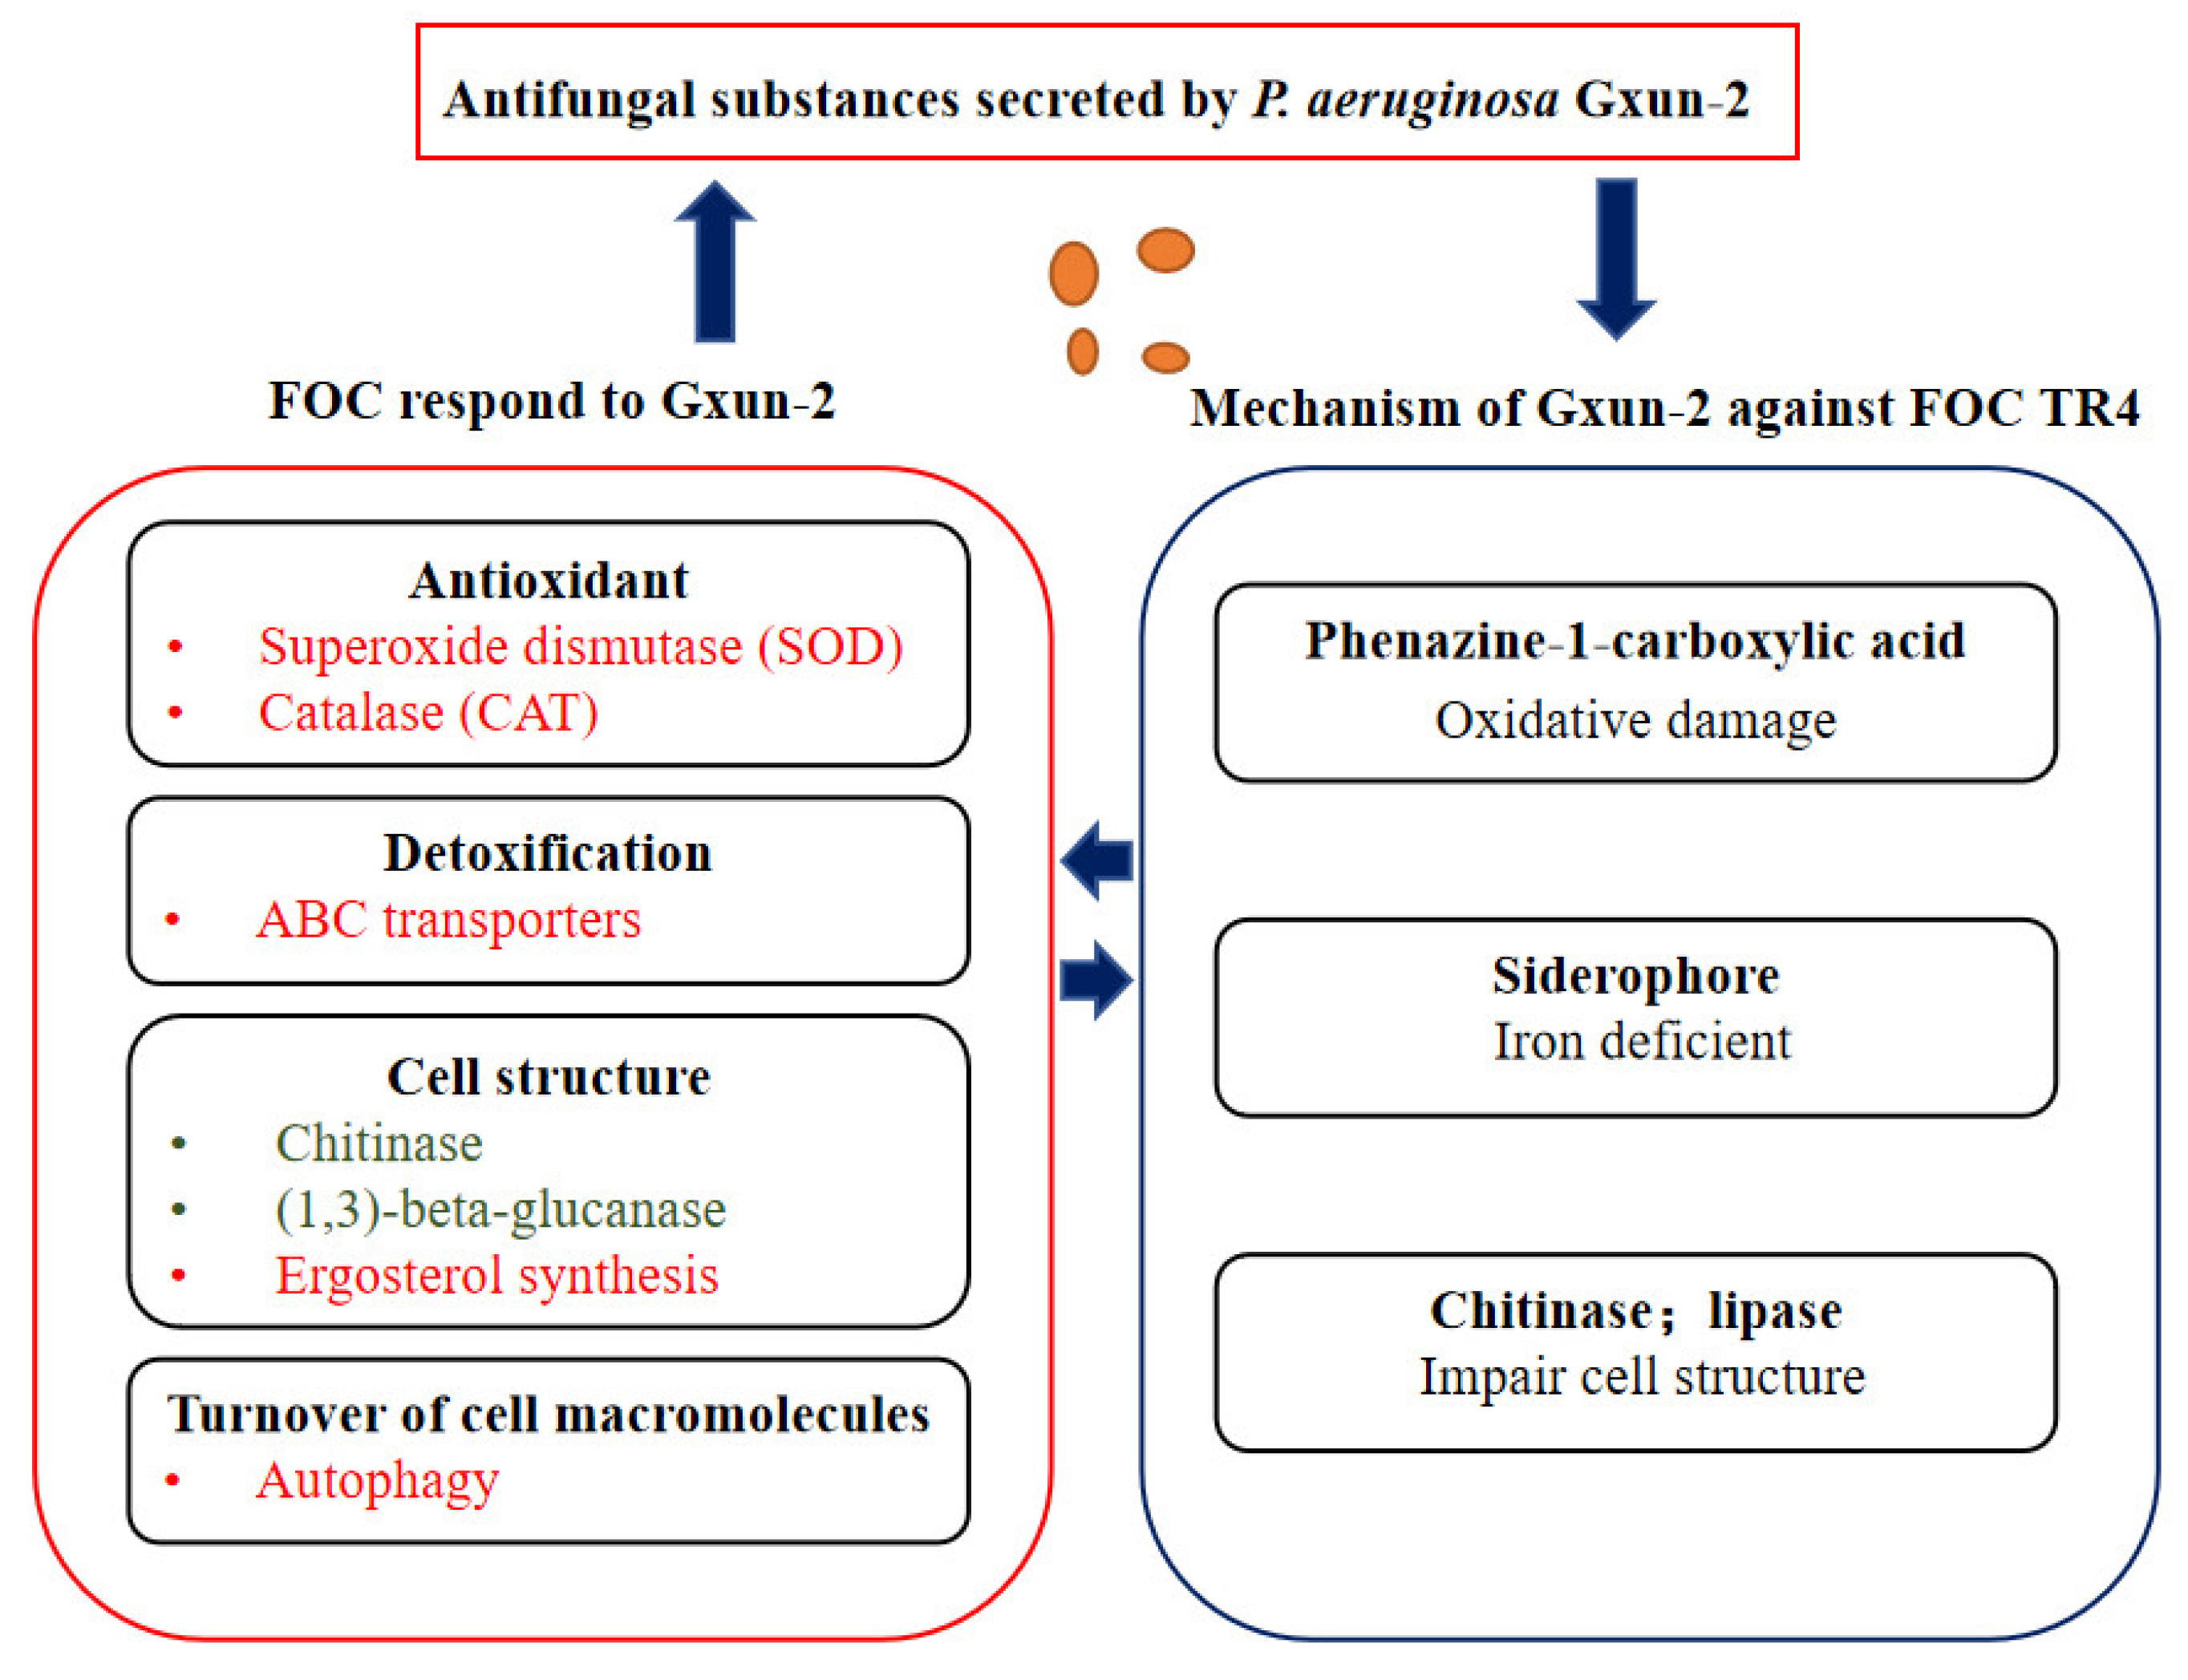
5. Conclusions
Supplementary Materials
Author Contributions
Funding
Institutional Review Board Statement
Informed Consent Statement
Data Availability Statement
Conflicts of Interest
References
- Siamak, S.B.; Zheng, S. Banana Fusarium Wilt (Fusarium oxysporum f. sp. cubense) Control and resistance, in the context of developing Wilt-resistant bananas within sustainable production systems. Hortic. Plant J. 2018, 4, 208–218. [Google Scholar] [CrossRef]
- Pegg, K.G.; Coates, L.M.; O’Neill, W.T.; Turner, D.W. The epidemiology of Fusarium wilt of banana. Front. Plant Sci. 2019, 10, 1395. [Google Scholar] [CrossRef] [Green Version]
- Li, C.; Mostert, G.; Zuo, C.; Beukes, I.; Yang, Q.; Sheng, O.; Kuang, R.; We, Y.; Hu, C.; Rose, L.; et al. Diversity and distribution of the banana wilt pathogen Fusarium oxysporum f. sp. cubense in China. Fungal Genom. Biol. 2013, 3, 1–6. [Google Scholar] [CrossRef]
- Yadav, K.; Damodaran, T.; Dutt, K.; Singh, A.; Muthukumar, M.; Rajan, S.; Gopal, R.; Sharma, P.C. Effective biocontrol of banana fusarium wilt tropical race 4 by a bacillus rhizobacteria strain with antagonistic secondary metabolites. Rhizosphere 2021, 18, 100341. [Google Scholar] [CrossRef]
- Kumar, K.; Pal, G.; Verma, A.; Verma, S.K. Role of rhizospheric bacteria in disease suppression during seedling formation in millet. In Plant, Soil and Microbes in Tropical Ecosystems; Springer: Singapore, 2021; pp. 263–274. [Google Scholar]
- Morrison, C.K.; Arseneault, T.; Novinscak, A.; Filion, M. Phenazine-1-carboxylic acid production by Pseudomonas fluorescens LBUM636 alters Phytophthora infestans growth and late blight development. Phytopathology 2017, 107, 273–279. [Google Scholar] [CrossRef] [Green Version]
- Salazar, B.; Ortiz, A.; Keswani, C.; Minkina, T.; Mandzhieva, S.; Pratap Singh, S.; Rekadwad, B.; Borriss, R.; Jain, A.; Singh, H. Bacillus spp. as bio-factories for antifungal secondary metabolites: Innovation beyond whole organism formulations. Microb. Ecol. 2022, 1–24. [Google Scholar] [CrossRef]
- Pal, K.K.; Gardener, B.M. Biological control of plant pathogens. Biol. Control Plant Pathog. 2006, 1–25. [Google Scholar] [CrossRef] [Green Version]
- Bhattacharyya, P.N.; Jha, D.K. Biotechnology: Plant growth-promoting rhizobacteria (PGPR): Emergence in agriculture. World J. Microbiol. Biotechnol. 2012, 28, 1327–1350. [Google Scholar] [CrossRef]
- Liu, C.; Fan, D.; Li, Y.; Chen, Y.; Huang, L.; Yan, X. Transcriptome analysis of Valsa mali reveals its response mechanism to the biocontrol actinomycete Saccharothrix yanglingensis Hhs. 015. BMC Microbiol. 2018, 18, 90. [Google Scholar] [CrossRef]
- Sun, P.; Zhang, L.; Li, Z. Comparative transcriptome analysis unravels the response mechanisms of Cytospora mali QH2 to a biocontrol agent, Bacillus velezensis L-1. Eur. J. Plant Pathol. 2022, 164, 463–477. [Google Scholar] [CrossRef]
- Thomashow, L.S.; Weller, D.M.; Bonsall, R.F.; Pierson III, L.S. Production of the antibiotic phenazine-1-carboxylic acid by fluorescent Pseudomonas species in the rhizosphere of wheat. Appl. Environ. Microbiol. 1990, 56, 908–912. [Google Scholar] [CrossRef] [PubMed] [Green Version]
- Pierson III, L.S.; Thomashow, L.S. Cloning and heterologous expression of the phenazine biosynthetic locus from Pseudomonas aureofaciens 30-84. Mol. Plant-Microbe Interact. 1992, 5, 330–339. [Google Scholar] [CrossRef]
- Liu, H.; He, Y.; Jiang, H.; Peng, H.; Huang, X.; Zhang, X.; Thomashow, L.S.; Xu, Y. Characterization of a phenazine-producing strain Pseudomonas chlororaphis GP72 with broad-spectrum antifungal activity from green pepper rhizosphere. Curr. Protoc. 2007, 54, 302–306. [Google Scholar] [CrossRef] [PubMed]
- Lamont, I.L.; Martin, L.W. Identification and characterization of novel pyoverdine synthesis genes in Pseudomonas aeruginosa. Microbiology 2003, 149, 833–842. [Google Scholar] [CrossRef] [Green Version]
- McCord, J.M.; Fridovich, I. Superoxide dismutase: An enzymic function for erythrocuprein (hemocuprein). J. Biol. Chem. 1969, 244, 6049–6055. [Google Scholar] [CrossRef]
- Wallace, D.C.; Murdock, D.G. Mitochondria and dystonia: The movement disorder connection? Proc. Natl. Acad. Sci. USA 1999, 96, 1817–1819. [Google Scholar] [CrossRef] [Green Version]
- Meyer, V.; Damveld, R.A.; Arentshorst, M.; Stahl, U.; Van Den Hondel, C.A.; Ram, A.F. Survival in the presence of antifungals: Genome-wide expression profiling of Aspergillus niger in response to sublethal concentrations of caspofungin and fenpropimorph. J. Biol. Chem. 2007, 282, 32935–32948. [Google Scholar] [CrossRef] [Green Version]
- Bowman, S.M.; Free, S.J. The structure and synthesis of the fungal cell wall. Bioessays 2006, 28, 799–808. [Google Scholar] [CrossRef]
- Garcia-Rubio, R.; Oliveira, H.C.; Rivera, J.; Trevijano-Contador, N. The fungal cell wall: Candida, Cryptococcus, and Aspergillus species. Front. Microbiol. 2020, 10, 2993. [Google Scholar] [CrossRef]
- Rella, A.; Farnoud, A.M.; Del Poeta, M. Plasma membrane lipids and their role in fungal virulence. Prog. Lipid Res. 2016, 61, 63–72. [Google Scholar] [CrossRef]
- Spiegel, S.; Merrill, A.H., Jr. Sphingolipid metabolism and cell growth regulation. FASEB J. 1996, 10, 1388–1397. [Google Scholar] [CrossRef] [PubMed]
- Alvarez, F.J.; Douglas, L.M.; Konopka, J.B. Sterol-rich plasma membrane domains in fungi. Eukaryot. Cell 2007, 6, 755–763. [Google Scholar] [CrossRef] [PubMed] [Green Version]
- Cheng, X.; Smith, J.C. Biological Membrane Organization and Cellular Signaling. Chem. Rev. 2019, 119, 5849–5880. [Google Scholar] [CrossRef] [PubMed]
- Pollack, J.K.; Harris, S.D.; Marten, M.R. Autophagy in filamentous fungi. Fungal Genet. Biol. 2009, 46, 1–8. [Google Scholar] [CrossRef]
- Kerr, J.; Taylor, G.; Rutman, A.; Høiby, N.; Cole, P.; Wilson, R. Pseudomonas aeruginosa pyocyanin and 1-hydroxyphenazine inhibit fungal growth. J. Clin. Pathol. 1999, 52, 385–387. [Google Scholar] [CrossRef] [Green Version]
- Dimkić, I.; Janakiev, T.; Petrović, M.; Degrassi, G.; Fira, D. Plant-associated Bacillus and Pseudomonas antimicrobial activities in plant disease suppression via biological control mechanisms—A review. Physiol. Mol. Plant Pathol. 2022, 117, 101754. [Google Scholar] [CrossRef]
- Gupta, C.; Kumar, B.; Dubey, R.; Maheshwari, D.J. Chitinase-mediated destructive antagonistic potential of Pseudomonas aeruginosa GRC1 against Sclerotinia sclerotiorum causing stem rot of peanut. BioControl 2006, 51, 821–835. [Google Scholar] [CrossRef]
- Peng, R.; Lin, J.; Wei, D.Z. Purification and characterization of an organic solvent-tolerant lipase from Pseudomonas aeruginosa CS-2. Appl. Biochem. Biotechnol. 2010, 162, 733–743. [Google Scholar] [CrossRef]
- Sharon, C.; Furugoh, S.; Yamakido, T.; Ogawa, H.; Kato, Y. Purification and characterization of a lipase from Pseudomonas aeruginosa KKA-5 and its role in castor oil hydrolysis. J. Ind. Microbiol. Biotechnol. 1998, 20, 304–307. [Google Scholar] [CrossRef]
- Jukic, E.; Blatzer, M.; Posch, W.; Steger, M.; Binder, U.; Lass-Flörl, C.; Wilflingseder, D. Oxidative stress response tips the balance in Aspergillus terreus amphotericin B resistance. Antimicrob. Agents Chemother. 2017, 61, e00670-17. [Google Scholar] [CrossRef]
- Kim, J.H.; Faria, N.C.; Martins, M.D.L.; Chan, K.L.; Campbell, B.C. Enhancement of antimycotic activity of amphotericin B by targeting the oxidative stress response of Candida and Cryptococcus with natural dihydroxybenzaldehydes. Front. Microbiol. 2012, 3, 261. [Google Scholar] [CrossRef] [PubMed] [Green Version]
- Sokol-Anderson, M.L.; Brajtburg, J.; Medoff, G. Amphotericin B-induced oxidative damage and killing of Candida albicans. J. Infect. Dis. 1986, 154, 76–83. [Google Scholar] [CrossRef] [PubMed]
- De Duve, C.; Baudhuin, P. Peroxisomes (microbodies and related particles). Physiol. Rev. 1966, 46, 323–357. [Google Scholar] [CrossRef] [PubMed]
- Smith, R.A.; Kelso, G.; Blaikie, F.H.; Porteous, C.; Ledgerwood, E.; Hughes, G.; James, A.M.; Ross, M.F.; Asin-Cayuela, J.; Cocheme, H.M.; et al. Using mitochondria-targeted molecules to study mitochondrial radical production and its consequences. Biochem. Soc. Trans. 2003, 31, 1295–1299. [Google Scholar] [CrossRef] [Green Version]
- Chen, W.; Cao, P.; Liu, Y.; Yu, A.; Wang, D.; Chen, L.; Sundarraj, R.; Yuchi, Z.; Gong, Y.; Merzendorfer, H.; et al. Structural basis for directional chitin biosynthesis. Nature 2022, 610, 402–408. [Google Scholar] [CrossRef]
- Ruiz-Herrera, J.; Ortiz-Castellanos, L. Cell wall glucans of fungi. A review. Cell Surf. 2019, 21, 100022. [Google Scholar] [CrossRef]
- Cota, J.; Alvarez, T.M.; Citadini, A.P.; Santos, C.R.; de Oliveira Neto, M.; Oliveira, R.R.; Pastore, G.M.; Ruller, R.; Prade, R.A.; Murakami, M.T.; et al. Mode of operation and low-resolution structure of a multi-domain and hyperthermophilic endo-β-1, 3-glucanase from Thermotoga petrophila. Biochem. Biophys. Res. Commun. 2011, 406, 590–594. [Google Scholar] [CrossRef]
- Siah, A.; Deweer, C.; Duyme, F.; Sanssené, J.; Durand, R.; Halama, P.; Reignault, P.J. Correlation of in planta endo-beta-1, 4-xylanase activity with the necrotrophic phase of the hemibiotrophic fungus Mycosphaerella graminicola. Plant Pathol. 2010, 59, 661–670. [Google Scholar] [CrossRef]
- Briard, B.; Rasoldier, V.; Bomme, P.; ElAouad, N.; Guerreir, C.; Chassagne, P.; Muszkieta, L.; Latgé, J.P.; Mulard, L.; Beauvais, A. Dirhamnolipids secreted from Pseudomonas aeruginosa modify anjpegungal susceptibility of Aspergillus fumigatus by inhibiting β1,3 glucan synthase activity. ISME J. 2017, 11, 1578–1591. [Google Scholar] [CrossRef] [Green Version]
- Qiu, X.; Xie, X.; Meesapyodsuk, D. Molecular mechanisms for biosynthesis and assembly of nutritionally important very long chain polyunsaturated fatty acids in microorganisms. Prog. Lipid Res. 2020, 79, 101047. [Google Scholar] [CrossRef] [PubMed]
- Liu, J.F.; Xia, J.J.; Nie, K.L.; Wang, F.; Deng, L.J. Outline of the biosynthesis and regulation of ergosterol in yeast. World J. Microbiol. Biotechnol. 2019, 35, 98. [Google Scholar] [CrossRef] [PubMed]
- Sant, D.; Tupe, S.; Ramana, C.; Deshpande, M.J. Fungal cell membrane—Promising drug target for antifungal therapy. J. Appl. Microbiol. 2016, 121, 1498–1510. [Google Scholar] [CrossRef] [PubMed] [Green Version]
- Braud, A.; Geoffroy, V.; Hoegy, F.; Mislin, G.L.; Schalk, I.J. Presence of the siderophores pyoverdine and pyochelin in the extracellular medium reduces toxic metal accumulation in Pseudomonas aeruginosa and increases bacterial metal tolerance. Environ. Microbiol. Rep. 2010, 2, 419–425. [Google Scholar] [CrossRef] [PubMed]
- Shakoury-Elizeh, M.; Protchenko, O.; Berger, A.; Cox, J.; Gable, K.; Dunn, T.M.; Prinz, W.A.; Bard, M.; Philpott, C.C. Metabolic response to iron deficiency in Saccharomyces cerevisiae. J. Biol. Chem. 2010, 285, 14823–14833. [Google Scholar] [CrossRef] [Green Version]
- Noda, N.N. Atg2 and Atg9: Intermembrane and interleaflet lipid transporters driving autophagy. Biochim. Biophys. Acta Mol. Cell Biol. Lipids 2021, 1866, 158956. [Google Scholar] [CrossRef]
- Yorimitsu, T.; Zaman, S.; Broach, J.R.; Klionsky, D.J. Protein kinase A and Sch9 cooperatively regulate induction of autophagy in Saccharomyces cerevisiae. Mol. Biol. Cell 2007, 18, 4180–4189. [Google Scholar] [CrossRef] [Green Version]
- Pinar, M.; Pantazopoulou, A.; Penalva, M.A. Live-cell imaging of Aspergillus nidulans autophagy: RAB1 dependence, Golgi independence and ER involvement. Autophagy 2013, 9, 1024–1043. [Google Scholar] [CrossRef] [Green Version]
- Abeliovich, H.; Klionsky, D.J. Autophagy in yeast: Mechanistic insights and physiological function. Microbiol. Mol. Biol. Rev. 2001, 65, 463–479. [Google Scholar] [CrossRef] [Green Version]
- Boutouja, F.; Stiehm, C.M.; Mastalski, T.; Brinkmeier, R.; Reidick, C.; El Magraoui, F.; Platta, H.W. Vps10-mediated targeting of Pep4 determines the activity of the vacuole in a substrate-dependent manner. Sci. Rep. 2019, 9, 10557. [Google Scholar] [CrossRef] [Green Version]
- Zhang, J.; Zhu, W.; Goodwin, P.H.; Lin, Q.; Xia, M.; Xu, W.; Sun, R.; Liang, J.; Wu, C.; Li, H.J. Response of Fusarium pseudograminearum to biocontrol agent Bacillus velezensis YB-185 by phenotypic and transcriptome analysis. J. Fungi 2022, 8, 763. [Google Scholar] [CrossRef]
- Chen, Y.; Zhou, D.; Qi, D.; Gao, Z.; Xie, J.; Luo, Y.J. Growth promotion and disease suppression ability of a Streptomyces sp. CB-75 from banana rhizosphere soil. Front. Microbiol. 2018, 8, 2704. [Google Scholar] [CrossRef] [PubMed]
- Wang, Z.S.; Li, Y.; Zhuang, L.B.; Yu, Y.; Liu, J.; Zhang, L.X.; Gao, Z.J.; Wu, Y.F.; Gao, W.; Ding, G.C.; et al. A rhizosphere-derived consortium of Bacillus subtilis and Trichoderma harzianum suppresses common scab of potato and increases yield. Comput. Struct. Biotechnol. J. 2019, 17, 645–653. [Google Scholar] [CrossRef] [PubMed]
- Schwyn, B.; Neilands, J.B. Universal chemical assay for the detection and determination of siderophores. Anal. Biochem. 1987, 160, 47–56. [Google Scholar] [CrossRef]
- Arnow, L.E. Colorimetric determination of the components of 3, 4-dihydroxyphenylalanine-tyrosine mixtures. J. Biol. Chem. 1937, 118, 531–537. [Google Scholar] [CrossRef]
- Leong, S.A.; Neilands, J.B. Siderophore production by phytopathogenic microbial species. J. Biol. Chem. 1982, 218, 351–359. [Google Scholar] [CrossRef]
- Palchevskaya, Y.S. Studying phenazine derivatives from Pseudomonas aeruginosa. Adv. Mater. Res. 2015, 1097, 69–72. [Google Scholar] [CrossRef]
- Meena, B.R.; Meena, S.; Chittora, D.; Sharma, K. Antifungal efficacy of Thevetia peruviana leaf extract against Alternaria solani and characterization of novel inhibitory compounds by Gas Chromatography-Mass Spectrometry analysis. Biochem. Biophys. Rep. 2021, 25, 100914. [Google Scholar] [CrossRef]
- Arocho, A.; Chen, B.; Ladanyi, M.; Pan, Q.J. Validation of the 2−ΔΔCt calculation as an alternate method of data analysis for quantitative PCR of BCR-ABL P210 transcripts. Diagn. Mol. Pathol. 2006, 15, 56–61. [Google Scholar] [CrossRef]


| Gene ID | Function | Primer Sequence (5′ to 3′) | Product Size (bp) |
|---|---|---|---|
| FOXG_01590 | C-8 sterol isomerase | F: GCTCCTCCTGGTTCTCGGTCTC R: TCCTCTCCGTGCTTAGCGATGG | 144 |
| FOXG_05578 | Arylsulfatase | F: CCGATGACCTTGGCTTCAGTGATG R: GCCTGAGCGGTATGGAAGTTGG | 115 |
| FOXG_05107 | Conserved hypothetical protein | F: CTGACATCAAGCCTGAGGACTTCAC R: GGAGCGGTCTGTGGGTAGGTAG | 104 |
| FOXG_08160 | Hypothetical protein similar to mitochondrial RNA splicing protein | F: CACAGCTCTACAGTTCCTCGCATAC R: GACCAGCAGCAAAGCCACCAG | 119 |
| FOXG_00989 | Arylsulfatase | F: CGATGATGGTCCAGCAGCCTTG R: TTCCTCGCCGACTCAGCCTTC | 147 |
| FOXG_15329 | Conserved hypothetical protein | F: CGGGCGTCATGGTGCTAAGTG R: CGTATCAGCGTCGTCATAGCCTATC | 137 |
| FOXG_12882 | Endochitinase 1 precursor | F: GCCTACGATTATGCTGGGTCTTGG R: TGGCGGCGGATGTAGAGAAGG | 106 |
| FOXG_16631 | Conserved hypothetical protein | F: TGGACCAGTGCAGAGCGATTTATTG R: CTGAAGCCAACCAGCAACAATCTG | 134 |
| FOXG_09583 | Chitinase 1 precursor | F: CTGAGGAGGCGACGGGTAGTG R: GTCAGTTGCGATGCGGGAAGG | 100 |
| FOXG_05078 | Chitin synthase class I | F: ATACCAAGACCAACCGCAACAAGG R: GCAGAACTGGAGGAACAGGACAATC | 113 |
| FOXG_17197 | Conserved hypothetical protein | F: GTTGGACATACCTGGCGTGGATTC R: TCCTCCGTGGCTGTTCCGTAG | 102 |
| FOXG_03076 | Superoxide dismutase | F: CTTCCGCTGGTCCTCACTTCAAC R: GGTGACAGAGCCCTTAGCATTTCC | 128 |
| FOXG_15294 | conserved hypothetical protein | F: AGGGATCTGTGGAGGAGAGTCTTTG R: AGGAGCAGGTGTACCAGCCAAG | 90 |
Publisher’s Note: MDPI stays neutral with regard to jurisdictional claims in published maps and institutional affiliations. |
© 2022 by the authors. Licensee MDPI, Basel, Switzerland. This article is an open access article distributed under the terms and conditions of the Creative Commons Attribution (CC BY) license (https://creativecommons.org/licenses/by/4.0/).
Share and Cite
Li, S.; Ma, J.; Li, S.; Chen, F.; Song, C.; Zhang, H.; Jiang, M.; Shen, N. Comparative Transcriptome Analysis Unravels the Response Mechanisms of Fusarium oxysporum f.sp. cubense to a Biocontrol Agent, Pseudomonas aeruginosa Gxun-2. Int. J. Mol. Sci. 2022, 23, 15432. https://doi.org/10.3390/ijms232315432
Li S, Ma J, Li S, Chen F, Song C, Zhang H, Jiang M, Shen N. Comparative Transcriptome Analysis Unravels the Response Mechanisms of Fusarium oxysporum f.sp. cubense to a Biocontrol Agent, Pseudomonas aeruginosa Gxun-2. International Journal of Molecular Sciences. 2022; 23(23):15432. https://doi.org/10.3390/ijms232315432
Chicago/Turabian StyleLi, Shuyan, Junpeng Ma, Shiyong Li, Fuhui Chen, Chaodong Song, Hongyan Zhang, Mingguo Jiang, and Naikun Shen. 2022. "Comparative Transcriptome Analysis Unravels the Response Mechanisms of Fusarium oxysporum f.sp. cubense to a Biocontrol Agent, Pseudomonas aeruginosa Gxun-2" International Journal of Molecular Sciences 23, no. 23: 15432. https://doi.org/10.3390/ijms232315432