
Structure–Activity Relationship of Synthetic Ginkgolic Acid Analogs for Treating Type 2 Diabetes by PTPN9 Inhibition

 , ,
, ,
Abstract
:1. Introduction
2. Results
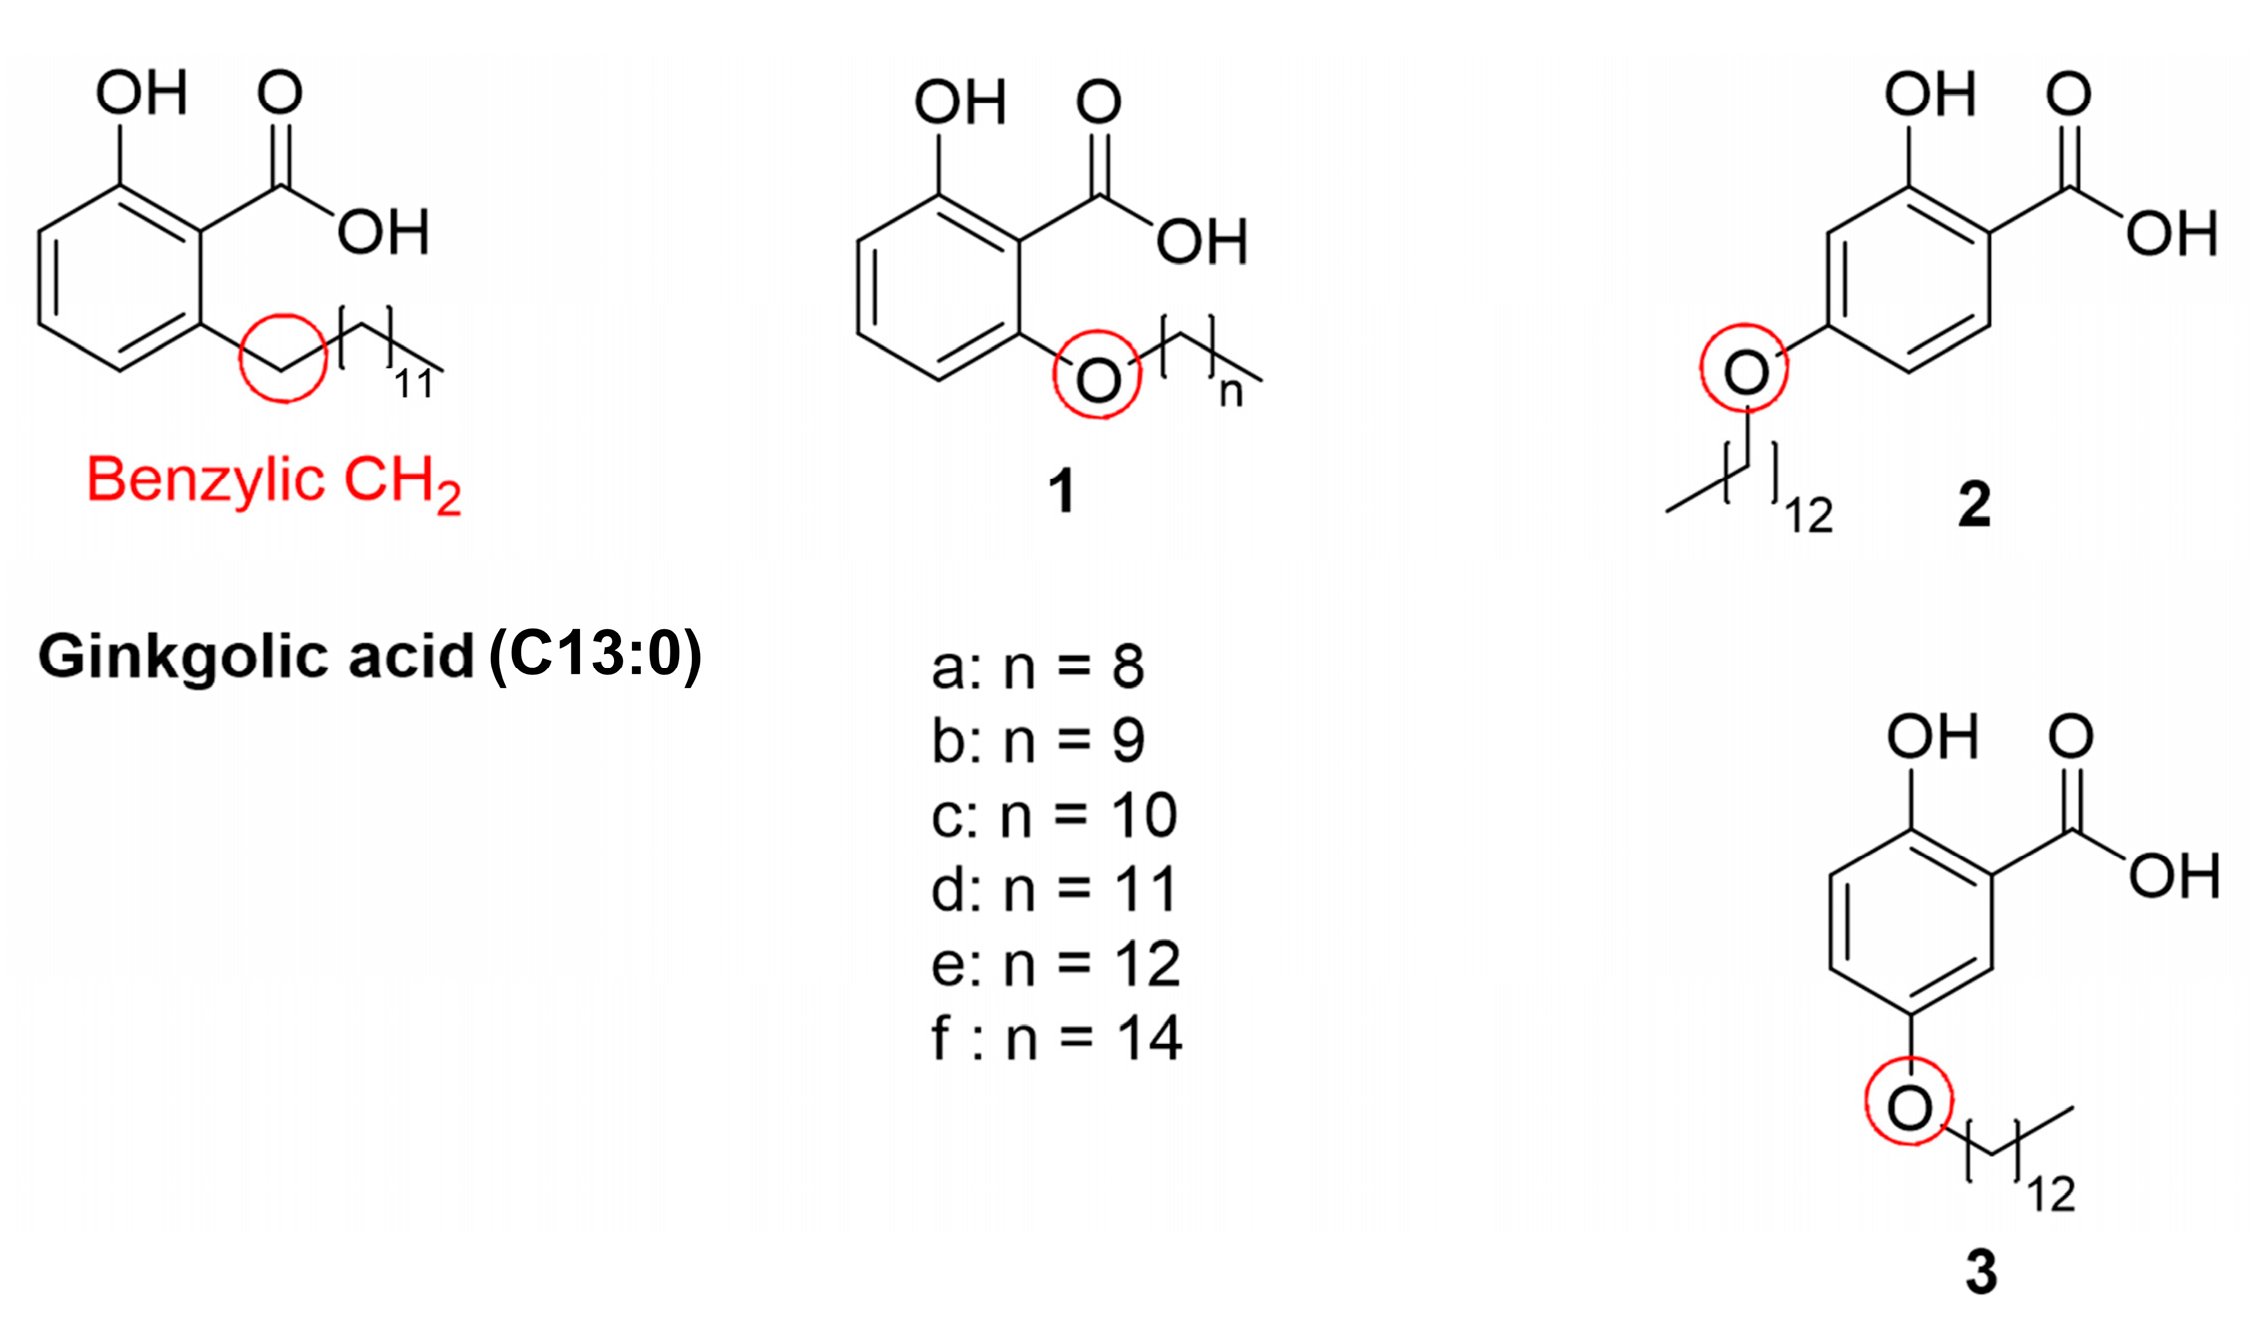
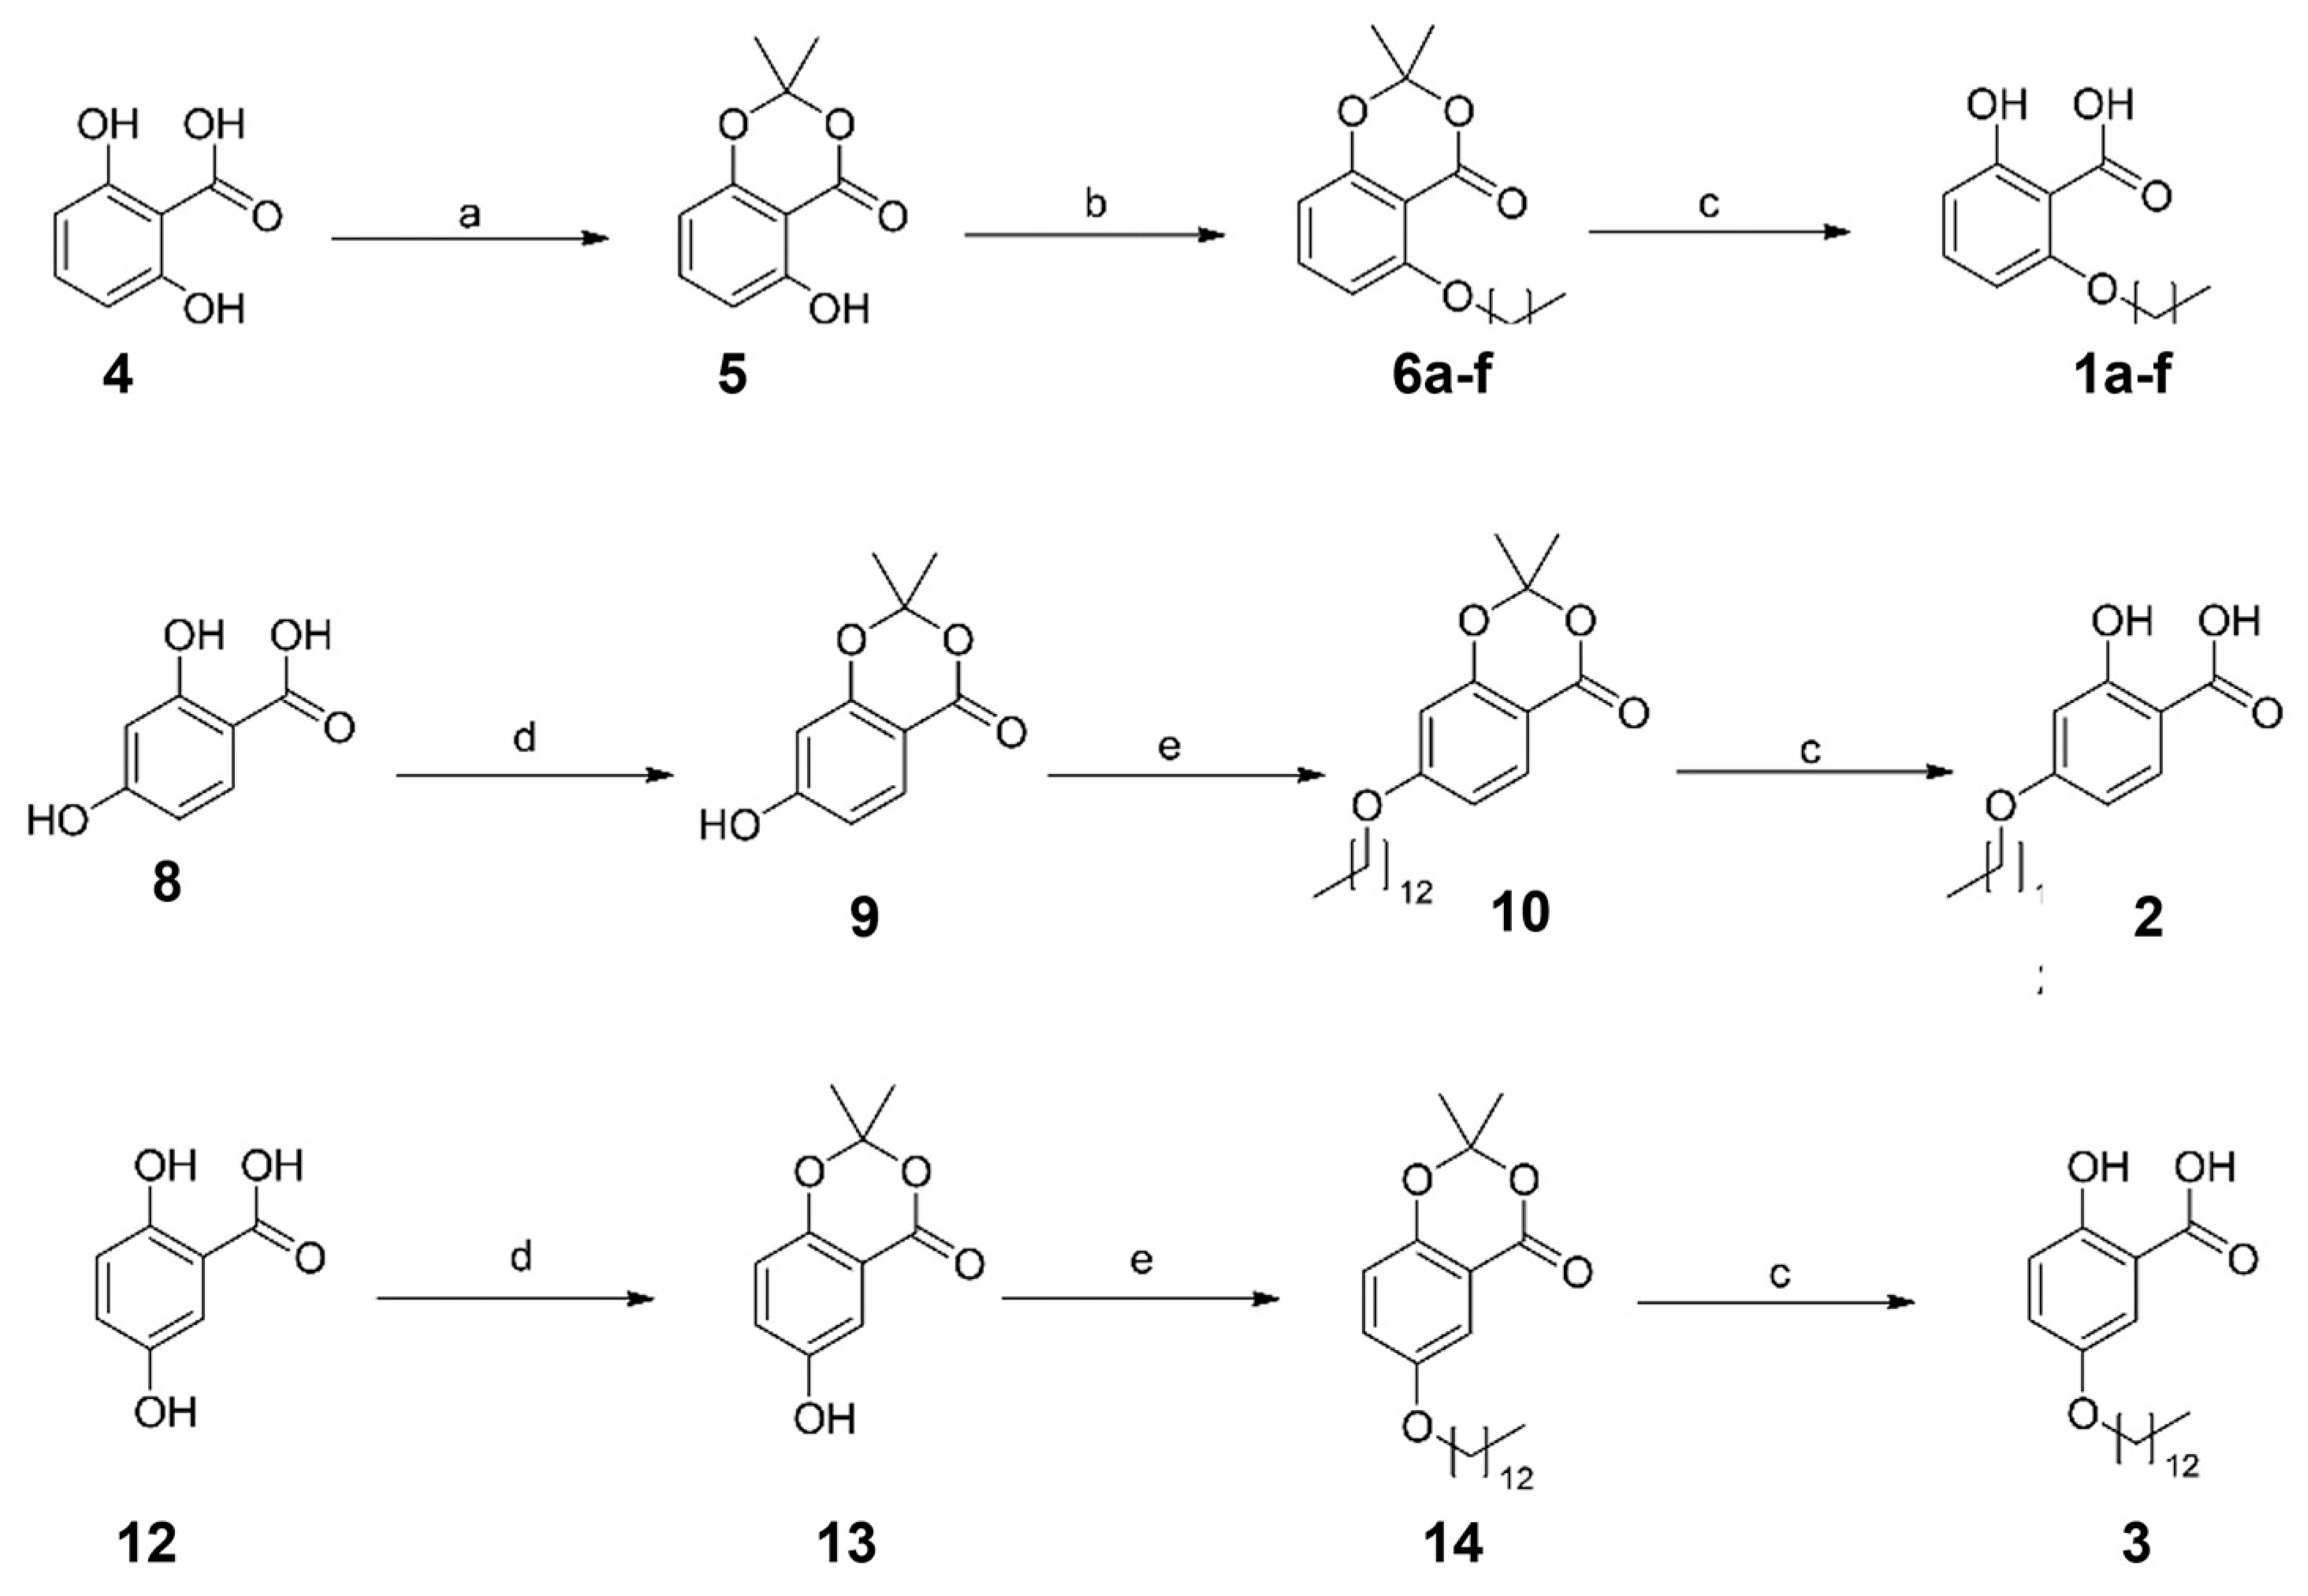
2.1. Synthesis of the Designed Compounds
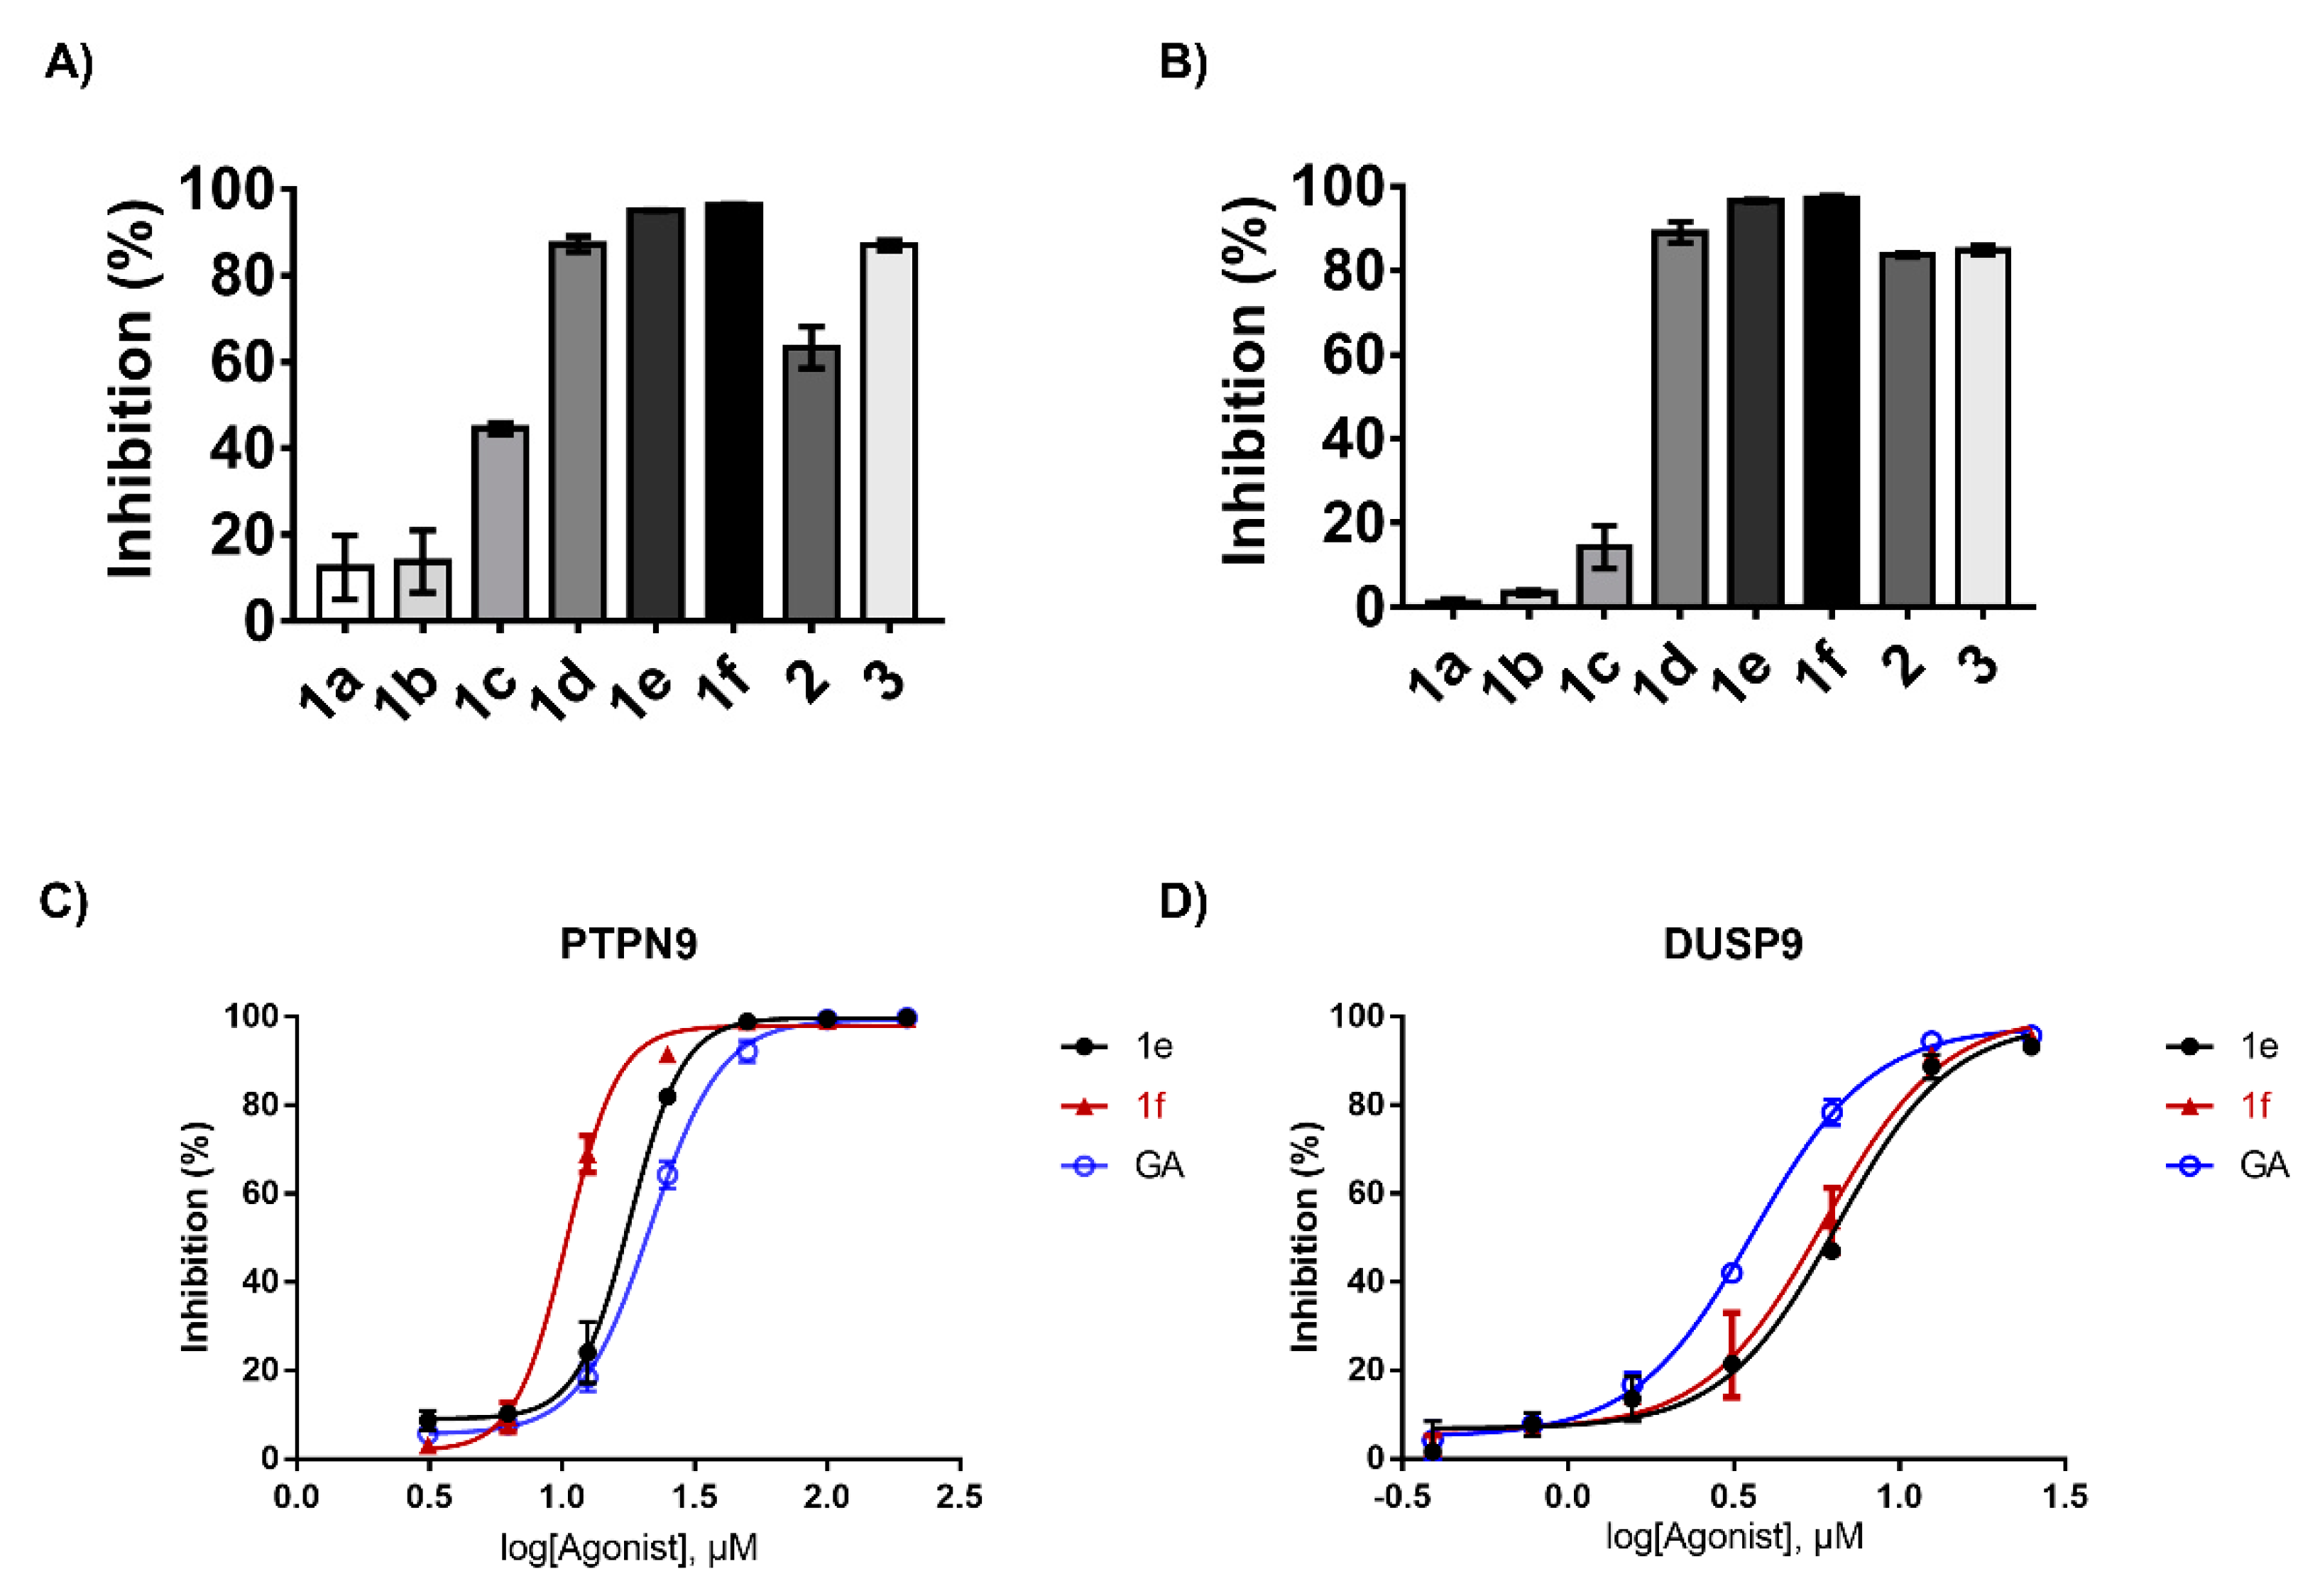
2.2. Structure–Activity Relation of the Synthesized GA Analogs with Respect to PTPN9 and DUSP9 Inhibition
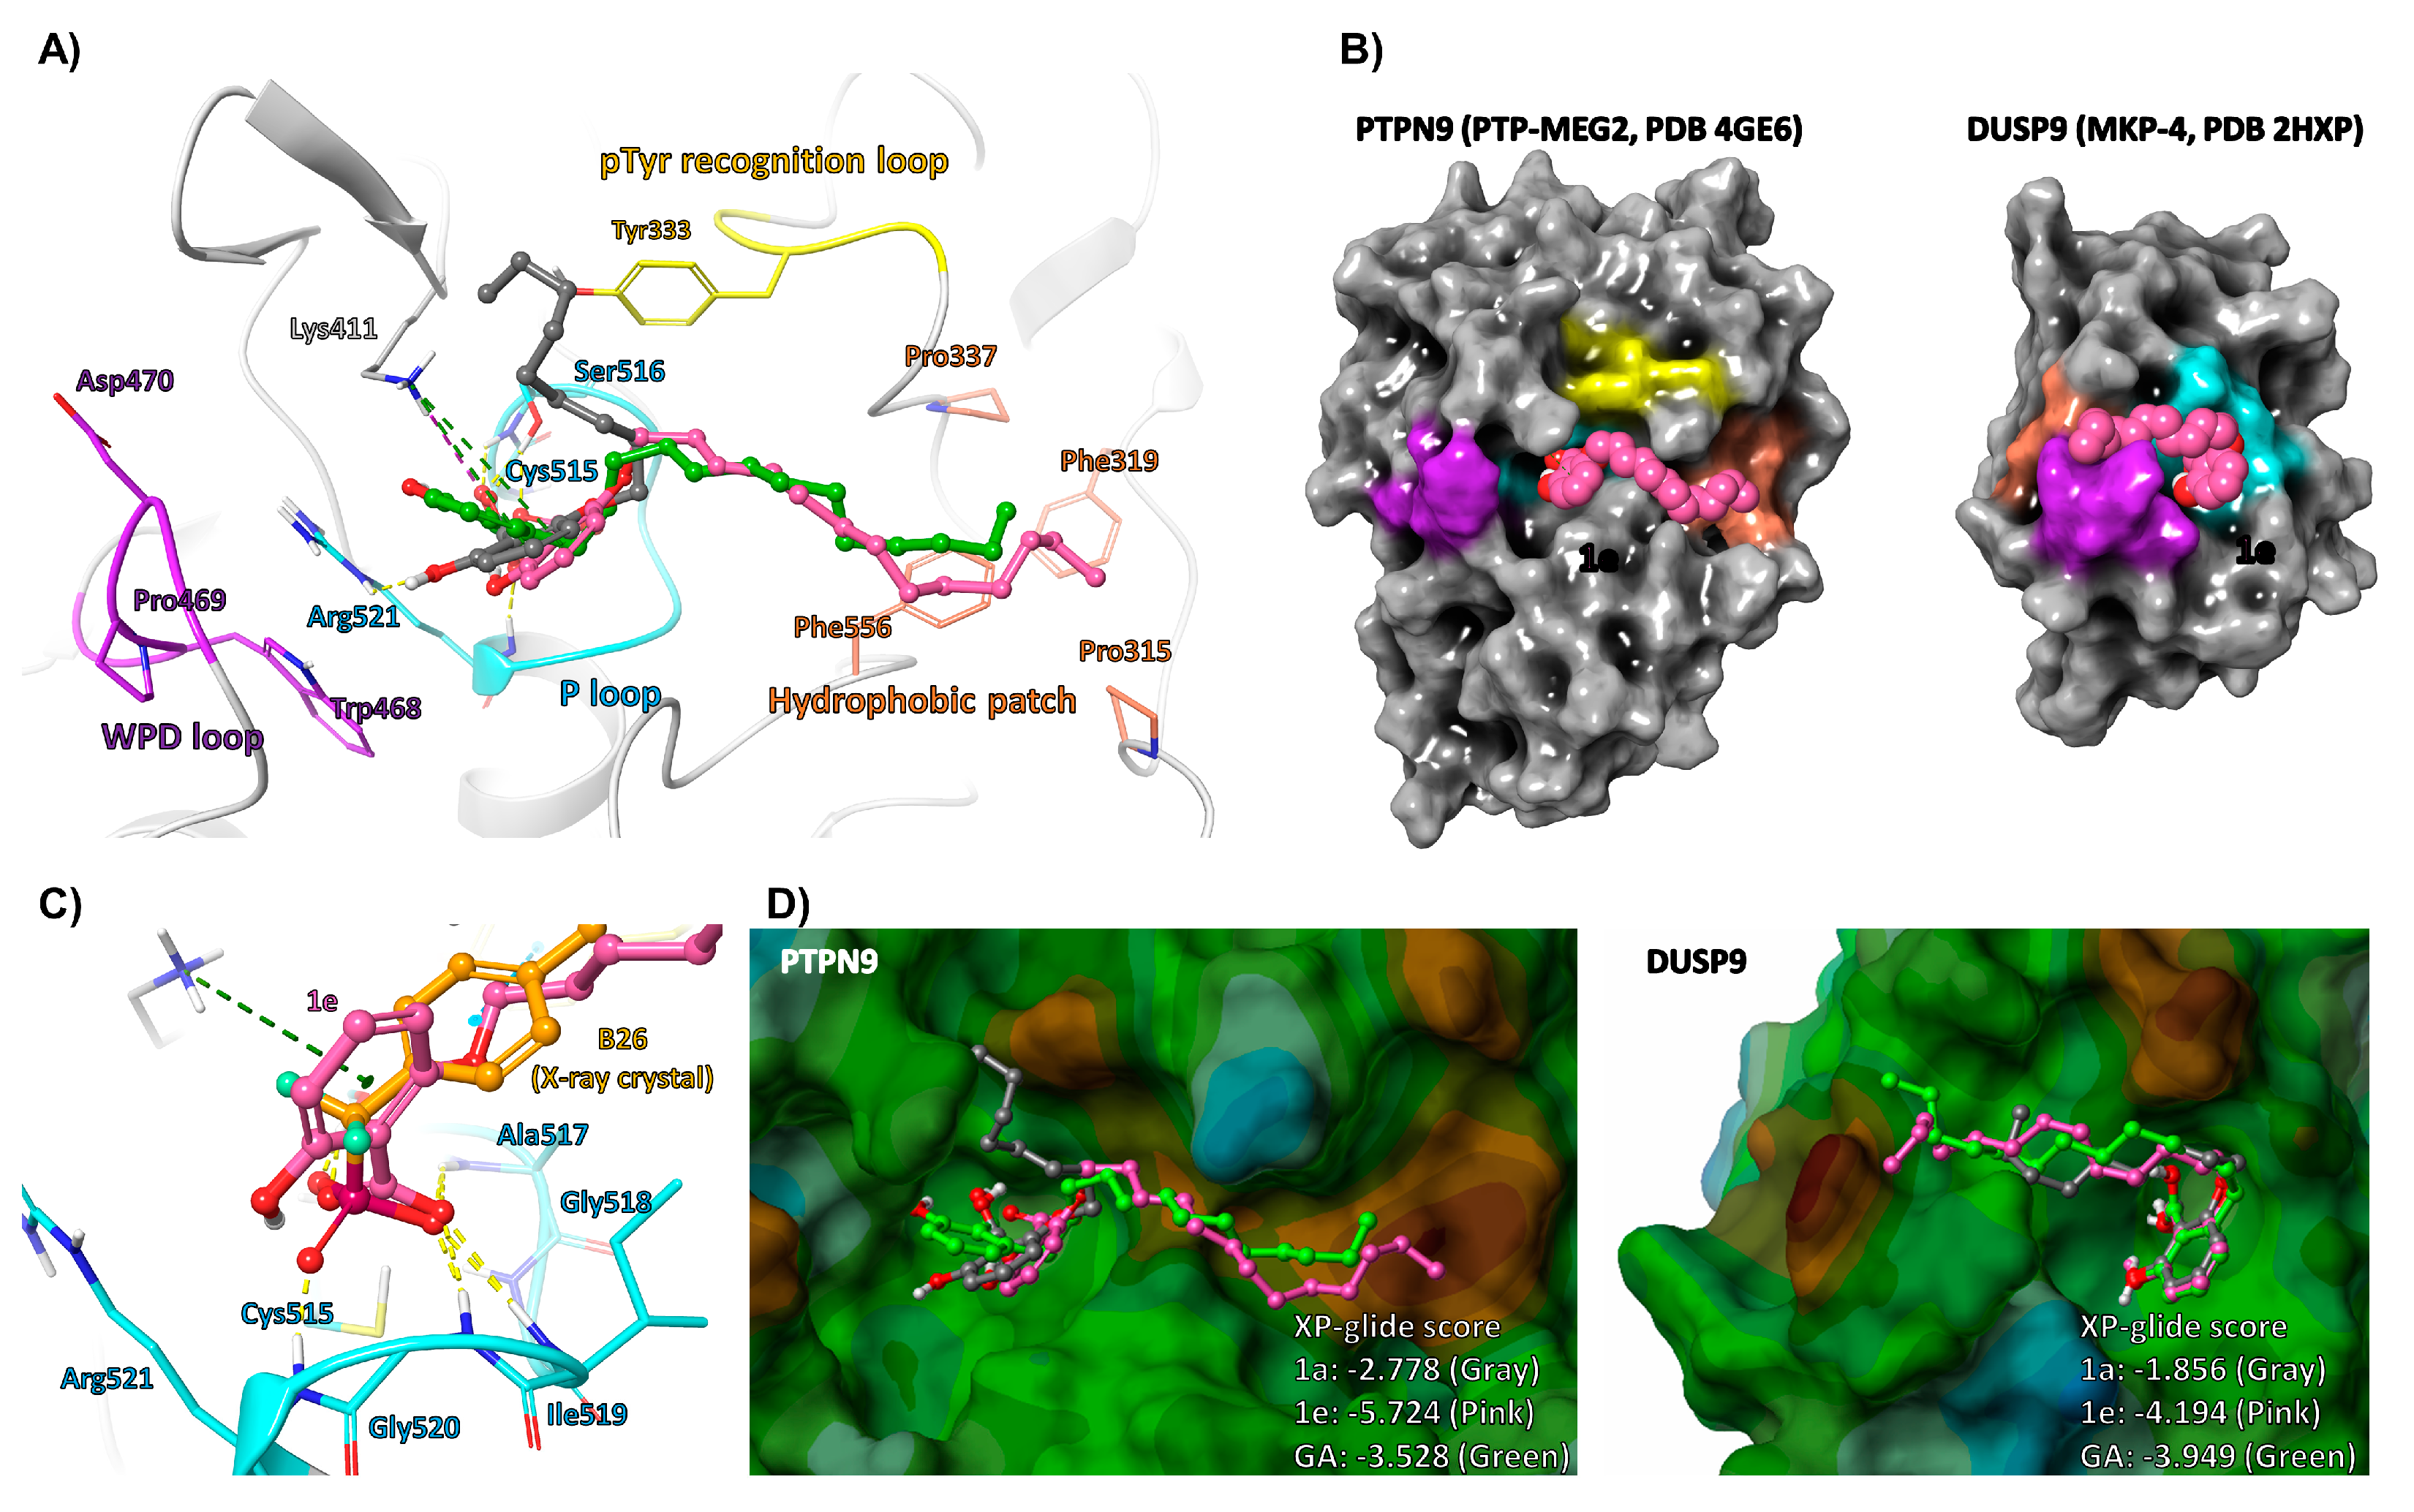
2.3. Molecular Docking Analysis of GA and Its Analogs
2.4. Compound 1e Increases Glucose Uptake in Mature 3T3-L1 Adipocytes and C2C12 Myotubes
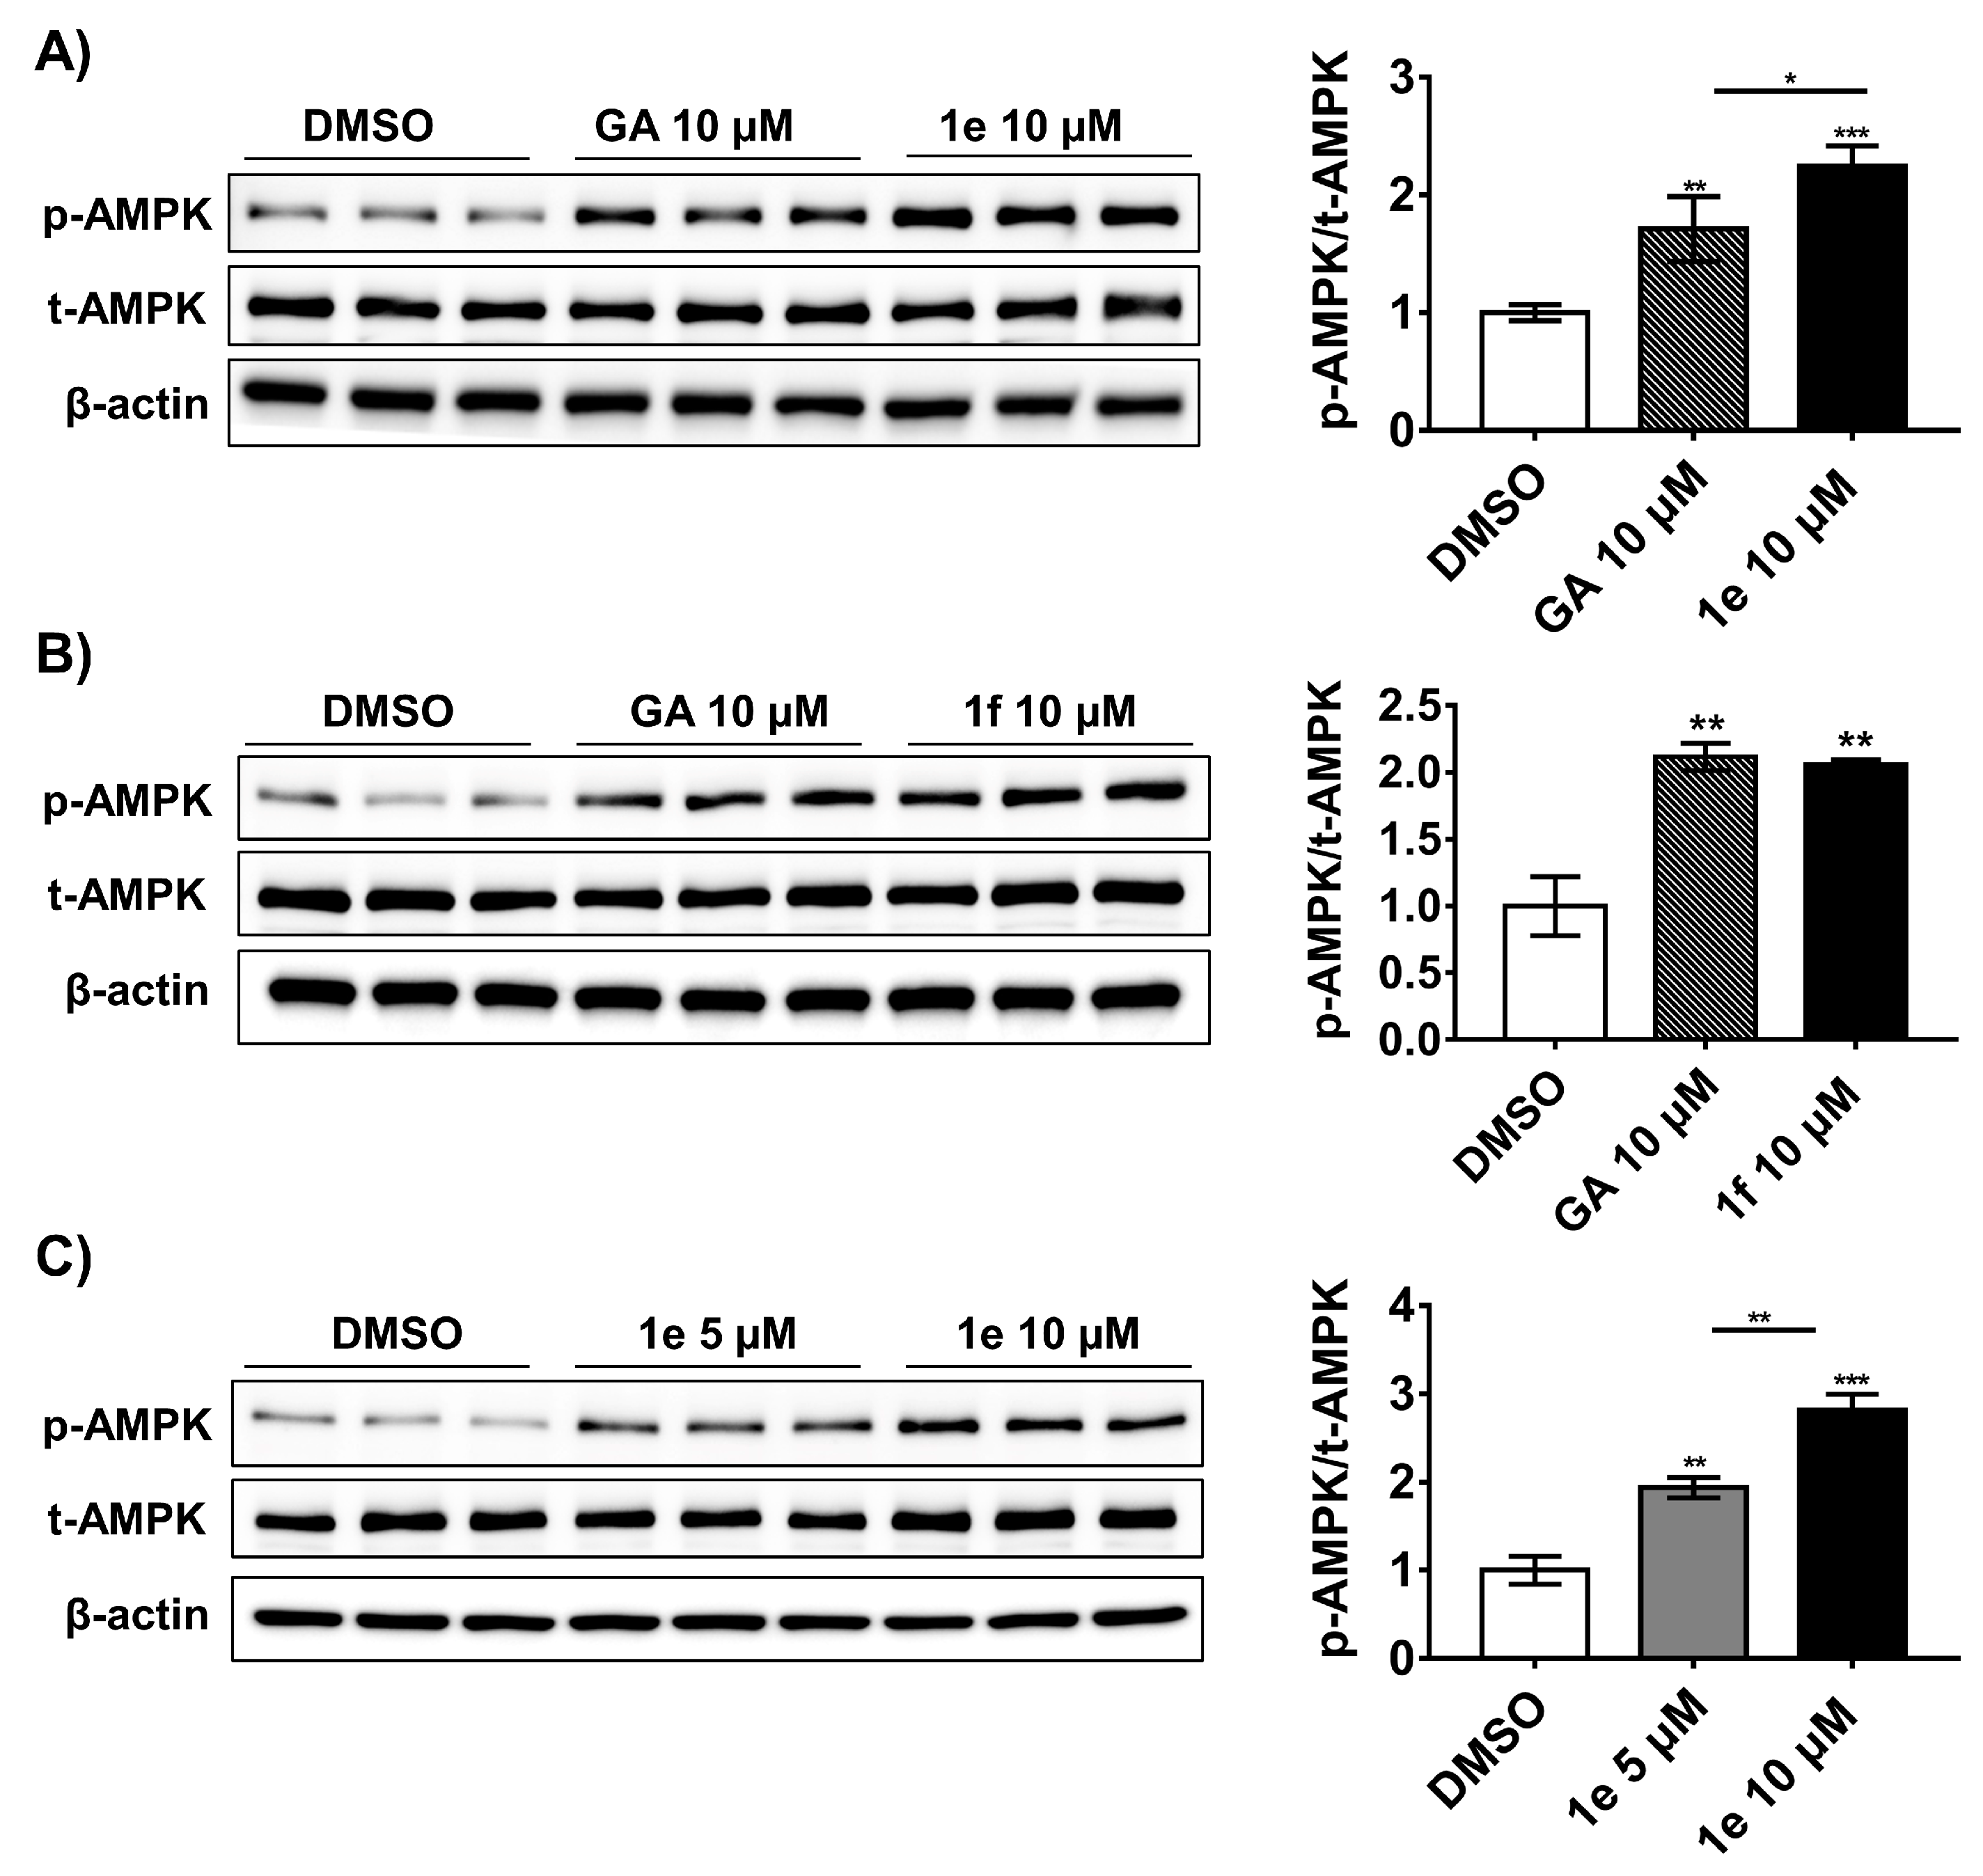
2.5. Compound 1e Activates Ampk in 3t3-L1 Adipocytes
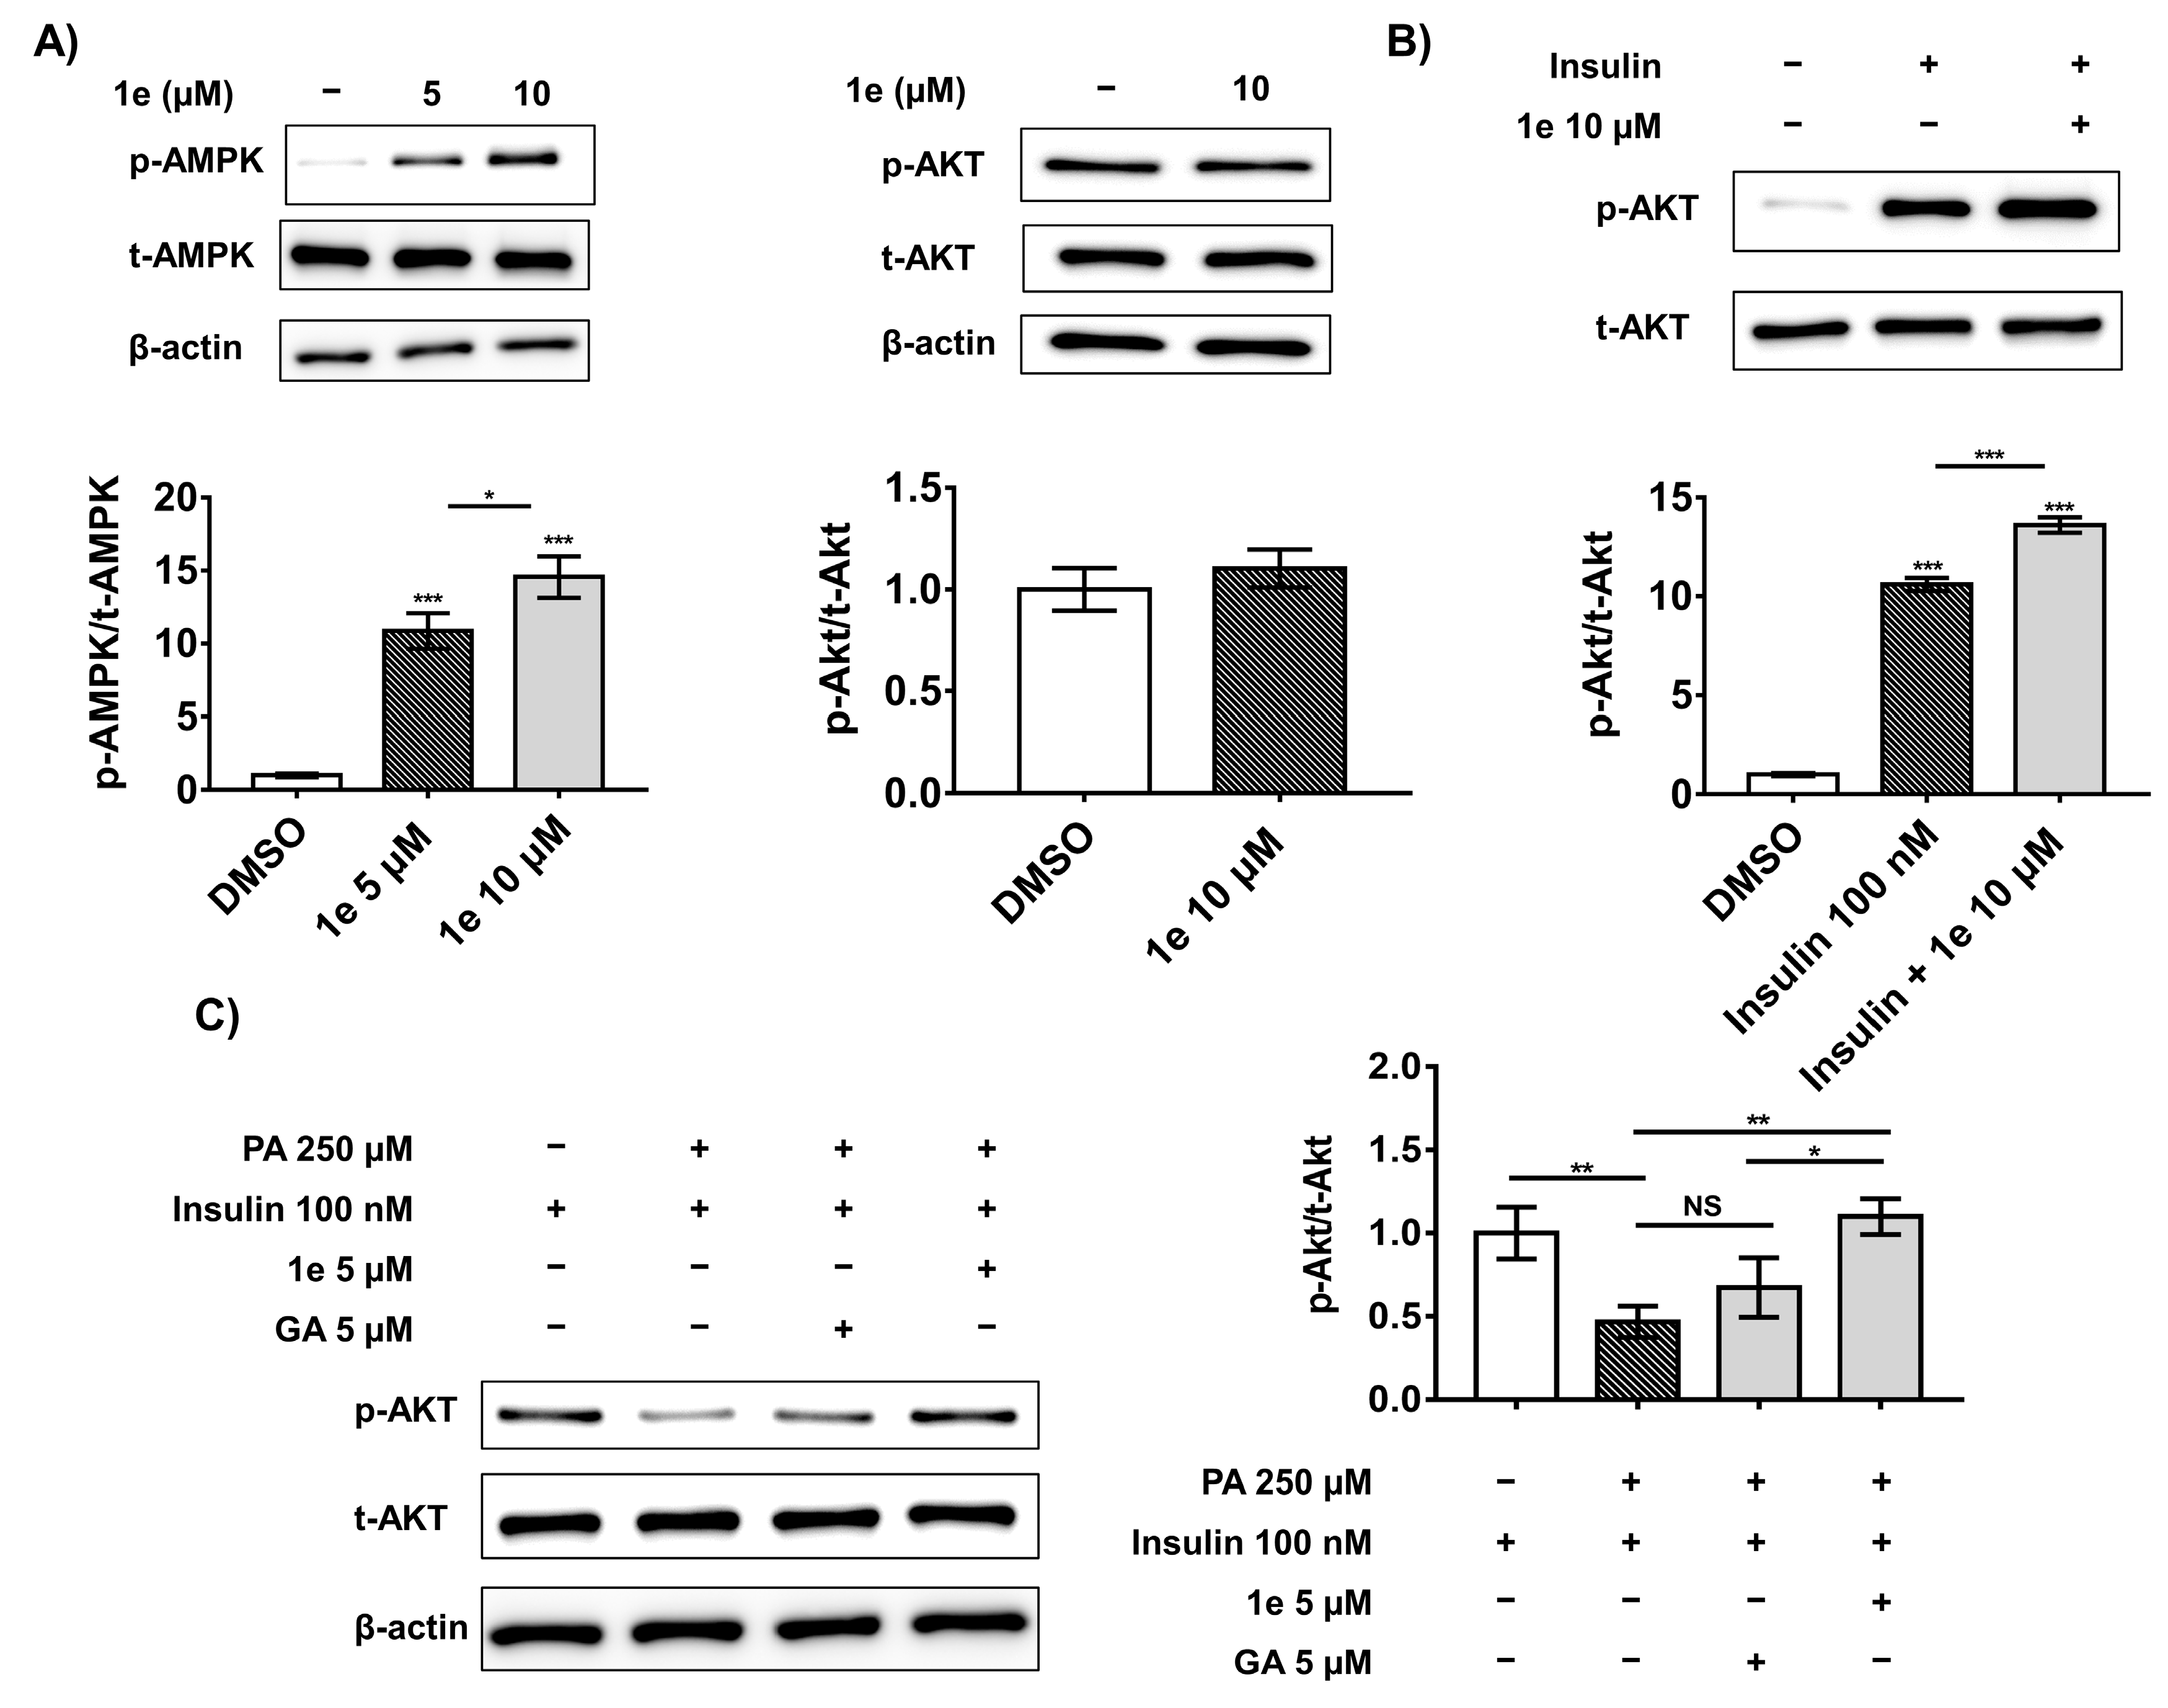
2.6. Compound 1e Attenuates Palmitic Acid (PA)-Induced Insulin Resistance in C2C12 Muscle Cells via the Insulin-Dependent Akt Pathway
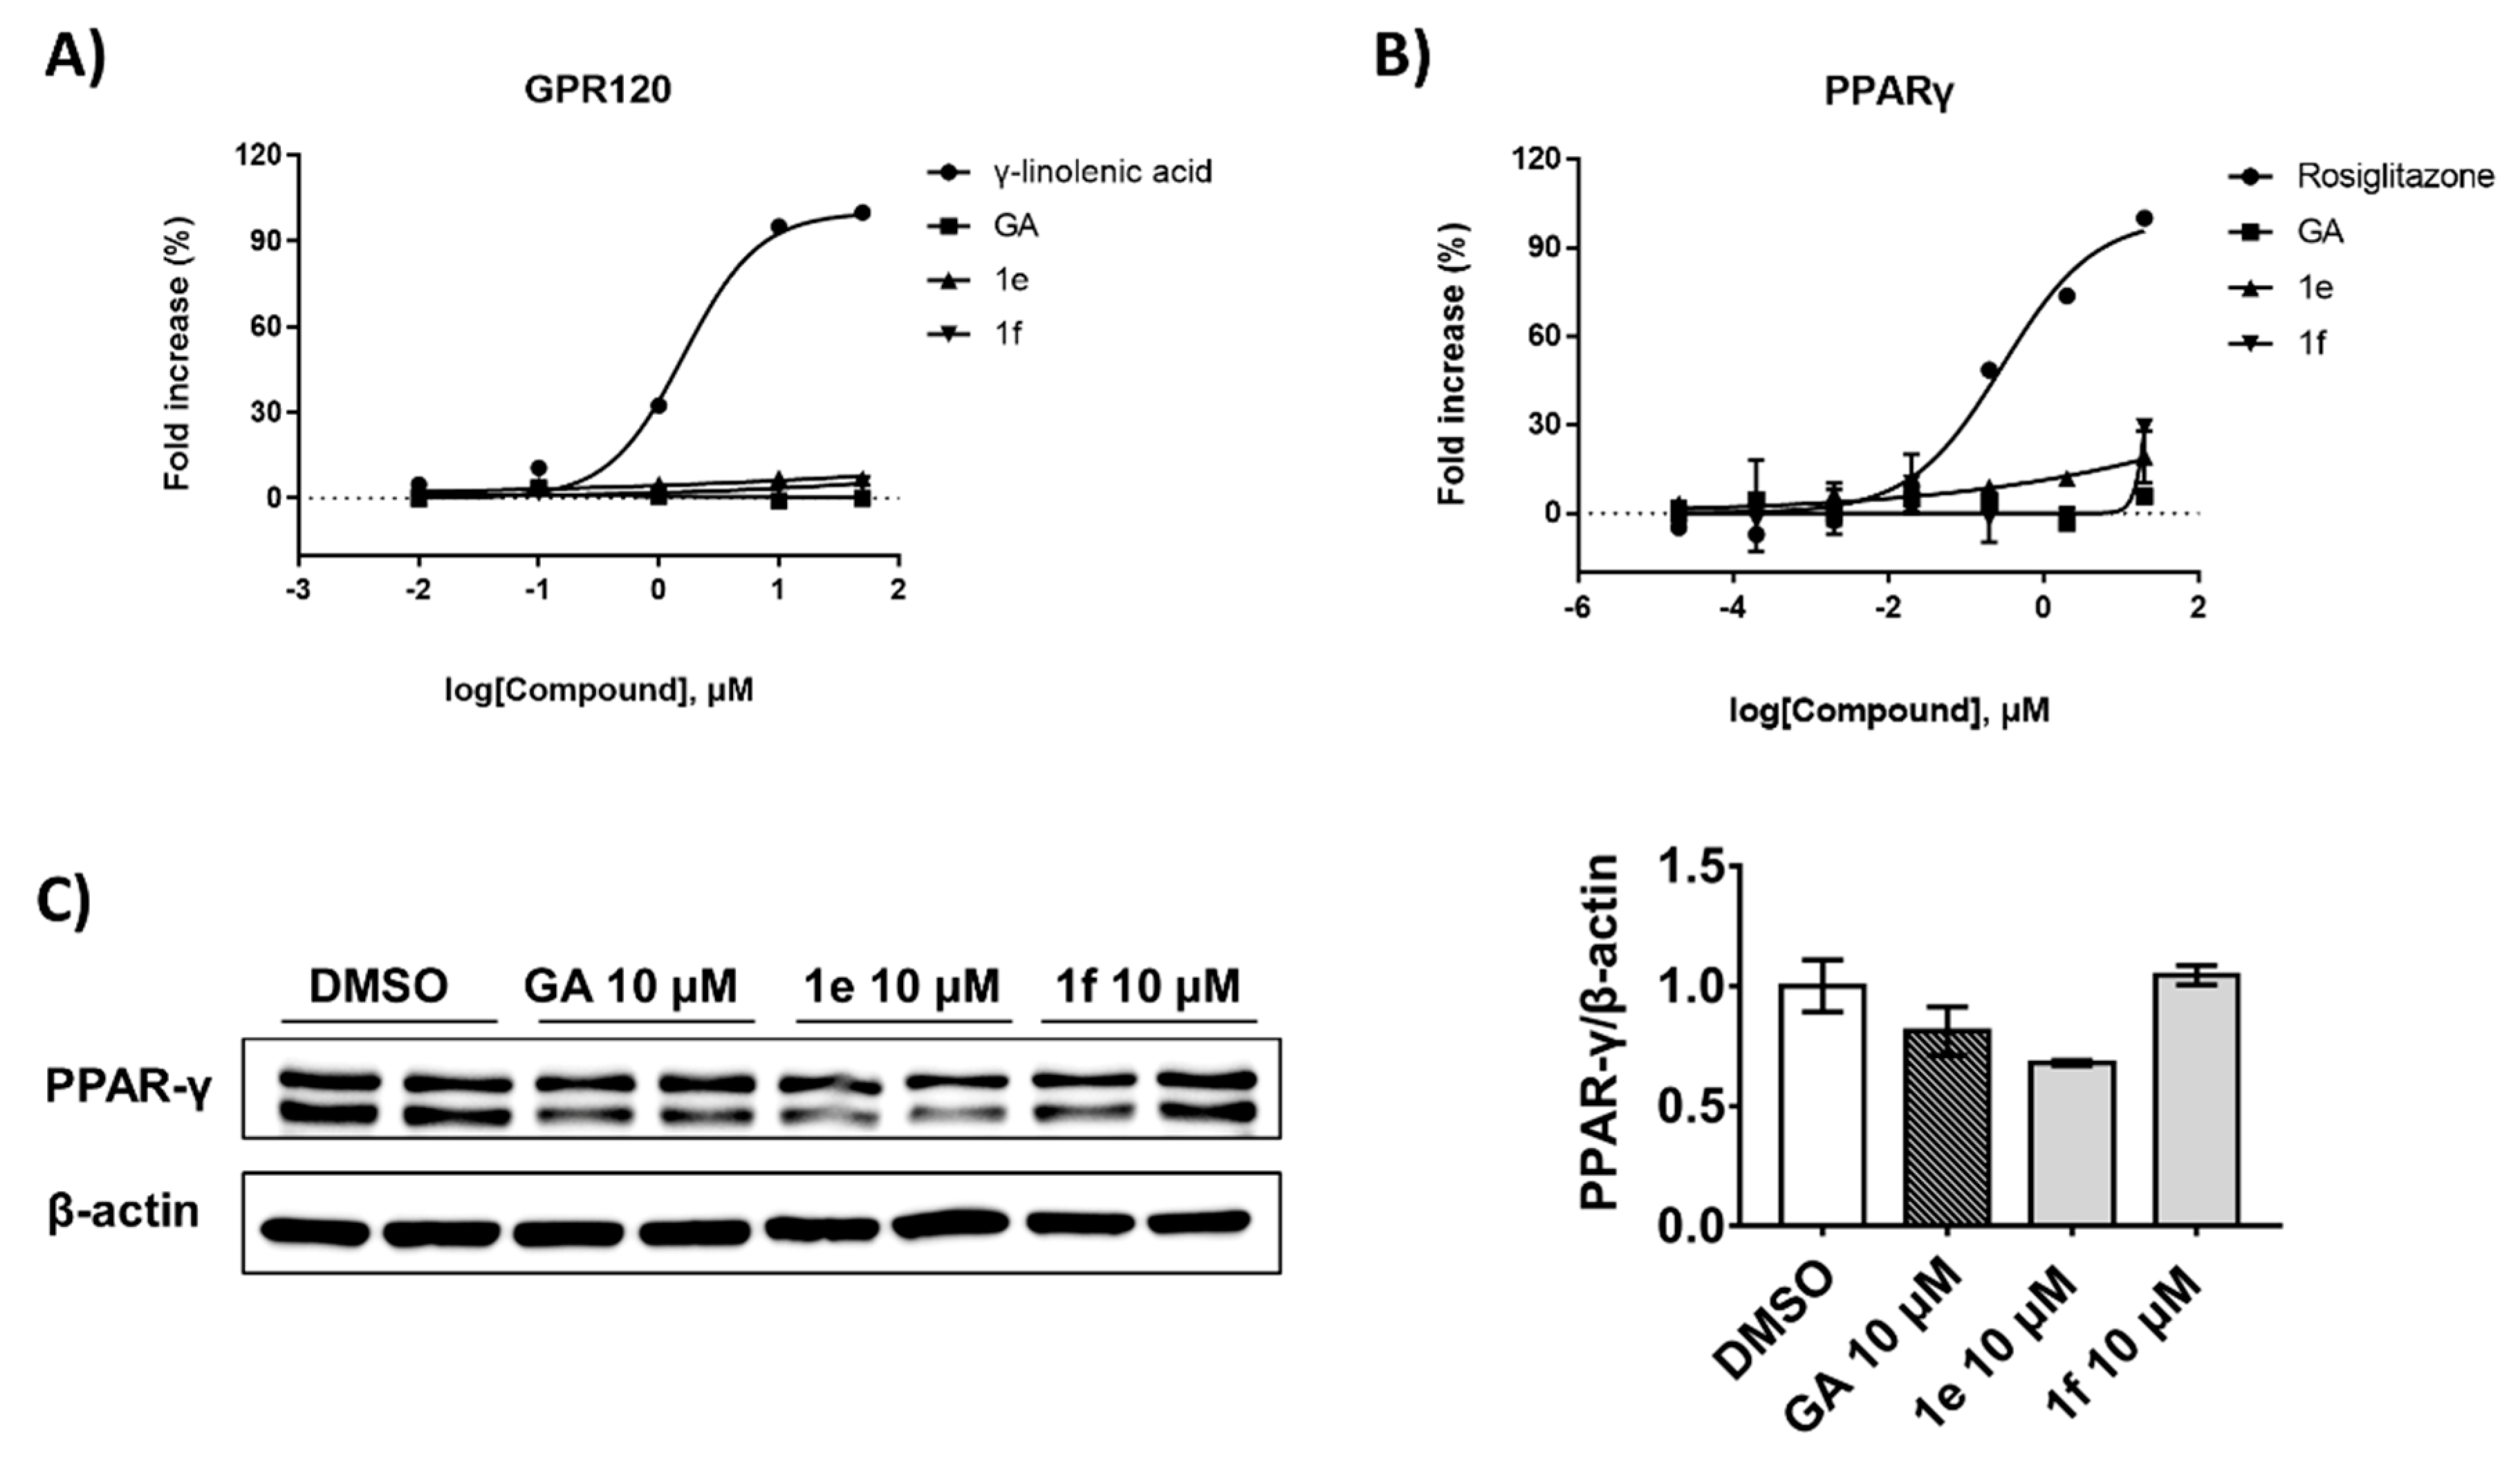
2.7. Compound 1e Improves Glucose Uptake by Inhibiting PTPN9 without Activating other Related Receptors
3. Discussion
4. Materials and Methods
4.1. Overexpression and Purification of Recombinant PTPN9 and DUSP9
4.2. Half-Maximal Inhibitory Concentration (IC50) Determination
4.3. Molecular Modeling
4.4. Cell Culture and Differentiation
4.5. Western Blotting
4.6. Glucose Uptake Assay
4.7. Palmitate-Induced Insulin Resistance in C2C12 Myotubes
4.8. Reporter Gene Assay
4.9. Statistical Analysis
Supplementary Materials
Author Contributions
Funding
Institutional Review Board Statement
Informed Consent Statement
Data Availability Statement
Acknowledgments
Conflicts of Interest
References
- Olokoba, A.B.; Obateru, O.A.; Olokoba, L.B. Type 2 Diabetes Mellitus: A Review of Current Trends. Oman Med. J. 2012, 27, 269–273. [Google Scholar] [CrossRef]
- Pappachan, J.M.; Fernandez, C.J.; Chacko, E.C. Diabesity and antidiabetic drugs. Mol. Asp. Med. 2019, 66, 3–12. [Google Scholar] [CrossRef] [PubMed]
- Cho, N.H.; Shaw, J.E.; Karuranga, S.; Huang, Y.; da Rocha Fernandes, J.D.; Ohlrogge, A.W.; Malanda, B. IDF Diabetes Atlas: Global estimates of diabetes prevalence for 2017 and projections for 2045. Diabetes Res. Clin. Pract. 2018, 138, 271–281. [Google Scholar] [CrossRef] [PubMed]
- Lin, X.; Xu, Y.; Pan, X.; Xu, J.; Ding, Y.; Sun, X.; Song, X.; Ren, Y.; Shan, P.F. Global, regional, and national burden and trend of diabetes in 195 countries and territories: An analysis from 1990 to 2025. Sci. Rep. 2020, 10, 14790. [Google Scholar] [CrossRef] [PubMed]
- Tonks, N.K. Protein tyrosine phosphatases: From genes, to function, to disease. Nat. Rev. Mol. Cell Biol. 2006, 7, 833–846. [Google Scholar] [CrossRef]
- Cho, C.Y.; Koo, S.-H.; Wang, Y.; Callaway, S.; Hedrick, S.; Mak, P.A.; Orth, A.P.; Peters, E.C.; Saez, E.; Montminy, M.; et al. Identification of the tyrosine phosphatase PTP-MEG2 as an antagonist of hepatic insulin signaling. Cell Metab. 2006, 3, 367–378. [Google Scholar] [CrossRef] [Green Version]
- Møller, N.P.H.; Møller, K.B.; Lammers, R.; Kharitonenkov, A.; Hoppe, E.; Wiberg, F.C.; Sures, I.; Ullrich, A. Selective down-regulation of the insulin receptor signal by protein-tyrosine phosphatases α and ϵ. J. Biol. Chem. 1995, 270, 23126–23131. [Google Scholar] [CrossRef] [Green Version]
- Koren, S.; Fantus, I.G. Inhibition of the protein tyrosine phosphatase PTP1B: Potential therapy for obesity, insulin resistance and type-2 diabetes mellitus. Best Pract. Res. Clin. Endocrinol. Metab. 2007, 21, 621–640. [Google Scholar] [CrossRef]
- Pandey, S.K.; Yu, X.X.; Watts, L.M.; Michael, M.; Sloop, K.W.; Rivard, A.R.; Leedom, T.A.; Manchem, V.P.; Samadzadeh, L.; McKay, R.A.; et al. Reduction of Low Molecular Weight Protein-tyrosine Phosphatase Expression Improves Hyperglycemia and Insulin Sensitivity in Obese Mice. J. Biol. Chem. 2007, 282, 14291–14299. [Google Scholar] [CrossRef] [Green Version]
- Li, P.-M.; Zhang, W.-R.; Goldstein, B.J. Suppression of insulin receptor activation by overexpression of the protein-tyrosine phosphatase LAR in hepatoma cells. Cell. Signal. 1996, 8, 467–473. [Google Scholar] [CrossRef]
- Dodd, G.T.; Lee-Young, R.S.; Brüning, J.C.; Tiganis, T. TCPTP Regulates Insulin Signaling in AgRP Neurons to Coordinate Glucose Metabolism With Feeding. Diabetes 2018, 67, 1246–1257. [Google Scholar] [CrossRef] [PubMed] [Green Version]
- Hayashi, K.; Shibata, K.; Morita, T.; Iwasaki, K.; Watanabe, M.; Sobue, K. Insulin Receptor Substrate-1/SHP-2 Interaction, a Phenotype-dependent Switching Machinery of Insulin-like Growth Factor-I Signaling in Vascular Smooth Muscle Cells. J. Biol. Chem. 2004, 279, 40807–40818. [Google Scholar] [CrossRef] [PubMed] [Green Version]
- Joyeux, M.; Lobstein, A.; Anton, R.; Mortier, F. Comparative antilipoperoxidant, antinecrotic and scavenging properties of terpenes and biflavones from Ginkgo and some flavonoids. Planta Med. 1995, 61, 126–129. [Google Scholar] [CrossRef] [PubMed]
- Ngan, N.T.T.; Quang, T.H.; Tai, B.H.; Song, S.B.; Lee, D.; Kim, Y.H. Anti-inflammatory and PPAR Transactivational Effects of Components from the Stem Bark of Ginkgo biloba. J. Agric. Food Chem. 2012, 60, 2815–2824. [Google Scholar] [CrossRef] [PubMed]
- Maitra, I.; Marcocci, L.; Droy-Lefaix, M.T.; Packer, L. Peroxyl radical scavenging activity of Ginkgo biloba extract EGb 761. Biochem. Pharmacol. 1995, 49, 1649–1655. [Google Scholar] [CrossRef]
- Mashayekh, A.; Pham, D.L.; Yousem, D.M.; Dizon, M.; Barker, P.B.; Lin, D.D.M. Effects of Ginkgo biloba on cerebral blood flow assessed by quantitative MR perfusion imaging: A pilot study. Neuroradiology 2010, 53, 185–191. [Google Scholar] [CrossRef] [Green Version]
- Zheng, X.; Gao, Q.; Liang, S.; Zhu, G.; Wang, D.; Feng, Y. Cardioprotective Properties of Ginkgo Biloba Extract 80 via the Activation of AKT/GSK3beta/beta-Catenin Signaling Pathway. Front. Mol. Biosci. 2021, 8, 771208. [Google Scholar] [CrossRef]
- Tang, Y.; Zhou, G.; Yao, L.; Xue, P.; Yu, D.; Xu, R.; Shi, W.; Yao, X.; Yan, Z.; Duan, J.A. Protective effect of Ginkgo biloba leaves extract, EGb761, on myocardium injury in ischemia reperfusion rats via regulation of TLR-4/NF-kappaB signaling pathway. Oncotarget 2017, 8, 86671–86680. [Google Scholar] [CrossRef] [Green Version]
- Yang, Y.; Li, Y.; Wang, J.; Sun, K.; Tao, W.; Wang, Z.; Xiao, W.; Pan, Y.; Zhang, S.; Wang, Y. Systematic Investigation of Ginkgo Biloba Leaves for Treating Cardio-cerebrovascular Diseases in an Animal Model. ACS Chem. Biol. 2017, 12, 1363–1372. [Google Scholar] [CrossRef]
- Zhang, Y.; Chen, A.Y.; Li, M.; Chen, C.; Yao, Q. Ginkgo biloba Extract Kaempferol Inhibits Cell Proliferation and Induces Apoptosis in Pancreatic Cancer Cells. J. Surg. Res. 2008, 148, 17–23. [Google Scholar] [CrossRef] [Green Version]
- Yoon, S.-Y.; Lee, J.H.; Kwon, S.J.; Kang, H.J.; Chung, S.J. Ginkgolic acid as a dual-targeting inhibitor for protein tyrosine phosphatases relevant to insulin resistance. Bioorgan. Chem. 2018, 81, 264–269. [Google Scholar] [CrossRef] [PubMed]
- Hamdoun, S.; Efferth, T. Ginkgolic acids inhibit migration in breast cancer cells by inhibition of NEMO sumoylation and NF-κB activity. Oncotarget 2017, 8, 35103. [Google Scholar] [CrossRef] [PubMed] [Green Version]
- Fu, Y.; Hong, S.; Li, D.; Liu, S. Novel Chemical Synthesis of Ginkgolic Acid (13:0) and Evaluation of Its Tyrosinase Inhibitory Activity. J. Agric. Food Chem. 2013, 61, 5347–5352. [Google Scholar] [CrossRef] [PubMed]
- Brackett, C.M.; García-Casas, A.; Castillo-Lluva, S.; Blagg, B.S.J. Synthesis and Evaluation of Ginkgolic Acid Derivatives as SUMOylation Inhibitors. ACS Med. Chem. Lett. 2020, 11, 2221–2226. [Google Scholar] [CrossRef]
- Habegger, K.M.; Hoffman, N.; Ridenour, C.M.; Brozinick, J.T.; Elmendorf, J.S. AMPK Enhances Insulin-Stimulated GLUT4 Regulation via Lowering Membrane Cholesterol. Endocrinology 2012, 153, 2130–2141. [Google Scholar] [CrossRef]
- Khoubai, F.Z.; Grosset, C.F. DUSP9, a Dual-Specificity Phosphatase with a Key Role in Cell Biology and Human Diseases. Int. J. Mol. Sci. 2021, 22, 11538. [Google Scholar] [CrossRef]
- Sharma, C.; Kim, Y.; Ahn, D.; Chung, S.J. Protein tyrosine phosphatases (PTPs) in diabetes: Causes and therapeutic opportunities. Arch. Pharmacal Res. 2021, 44, 310–321. [Google Scholar] [CrossRef]
- Barr, A.J.; Ugochukwu, E.; Lee, W.H.; King, O.; Filippakopoulos, P.; Alfano, I.; Savitsky, P.; Burgess-Brown, N.A.; Müller, S.; Knapp, S. Large-Scale Structural Analysis of the Classical Human Protein Tyrosine Phosphatome. Cell 2009, 136, 352–363. [Google Scholar] [CrossRef] [Green Version]
- Wen, Y.; Yang, S.; Wakabayashi, K.; Svensson, M.N.; Stanford, S.M.; Santelli, E.; Bottini, N. RPTPα phosphatase activity is allosterically regulated by the membrane-distal catalytic domain. J. Biol. Chem. 2020, 295, 4923–4936. [Google Scholar] [CrossRef]
- Zhang, S.; Liu, S.; Tao, R.; Wei, D.; Chen, L.; Shen, W.; Yu, Z.-H.; Wang, L.; Jones, D.R.; Dong, X.C.; et al. A Highly Selective and Potent PTP-MEG2 Inhibitor with Therapeutic Potential for Type 2 Diabetes. J. Am. Chem. Soc. 2012, 134, 18116–18124. [Google Scholar] [CrossRef] [Green Version]
- Huang, X.; Liu, G.; Guo, J.; Su, Z. The PI3K/AKT pathway in obesity and type 2 diabetes. Int. J. Biol. Sci. 2018, 14, 1483–1496. [Google Scholar] [CrossRef] [PubMed] [Green Version]
- O’neill, H.M. AMPK and exercise: Glucose uptake and insulin sensitivity. Diabetes Metab. J. 2013, 37, 1–21. [Google Scholar] [CrossRef] [PubMed] [Green Version]
- Friedrichsen, M.; Mortensen, B.; Pehmøller, C.; Birk, J.B.; Wojtaszewski, J.F. Exercise-induced AMPK activity in skeletal muscle: Role in glucose uptake and insulin sensitivity. Mol. Cell. Endocrinol. 2013, 366, 204–214. [Google Scholar] [CrossRef] [PubMed]
- Wu, Z.; Xie, Y.; Morrison, R.F.; Bucher, N.L.; Farmer, S.R. PPARgamma induces the insulin-dependent glucose transporter GLUT4 in the absence of C/EBPalpha during the conversion of 3T3 fibroblasts into adipocytes. J. Clin. Investig. 1998, 101, 22–32. [Google Scholar] [CrossRef] [Green Version]
- Oh, D.Y.; Talukdar, S.; Bae, E.J.; Imamura, T.; Morinaga, H.; Fan, W.Q.; Li, P.; Lu, W.J.; Watkins, S.M.; Olefsky, J.M. GPR120 Is an Omega-3 Fatty Acid Receptor Mediating Potent Anti-inflammatory and Insulin-Sensitizing Effects. Cell 2010, 142, 687–698. [Google Scholar] [CrossRef] [Green Version]
- Husted, A.S.; Trauelsen, M.; Rudenko, O.; Hjorth, S.A.; Schwartz, T.W. GPCR-Mediated Signaling of Metabolites. Cell Metab. 2017, 25, 777–796. [Google Scholar] [CrossRef] [Green Version]
- Hussein, Z.; Wentworth, J.M.; Nankervis, A.J.; Proietto, J.; Colman, P.G. Effectiveness and side effects of thiazolidinediones for type 2 diabetes: Real-life experience from a tertiary hospital. Med. J. Aust. 2004, 181, 536–539. [Google Scholar] [CrossRef]
- Kerru, N.; Singh-Pillay, A.; Awolade, P.; Singh, P. Current anti-diabetic agents and their molecular targets: A review. Eur. J. Med. Chem. 2018, 152, 436–488. [Google Scholar] [CrossRef]
- Barrett, E.J.; Eggleston, E.M.; Inyard, A.C.; Wang, H.; Li, G.; Chai, W.; Liu, Z. The vascular actions of insulin control its delivery to muscle and regulate the rate-limiting step in skeletal muscle insulin action. Diabetologia 2009, 52, 752–764. [Google Scholar] [CrossRef] [Green Version]
- Mårin, P.; Rebuffé-Scrive, M.; Smith, U.; Björntorp, P. Glucose uptake in human adipose tissue. Metabolism 1987, 36, 1154–1160. [Google Scholar] [CrossRef]
- Emanuelli, B.; Eberlé, D.; Suzuki, R.; Kahn, C.R. Overexpression of the dual-specificity phosphatase MKP-4/DUSP-9 protects against stress-induced insulin resistance. Proc. Natl. Acad. Sci. USA 2008, 105, 3545–3550. [Google Scholar] [CrossRef] [PubMed] [Green Version]
- Lee, S.Y.; Kim, W.; Lee, Y.G.; Kang, H.J.; Lee, S.-H.; Park, S.Y.; Min, J.-K.; Lee, S.-R.; Chung, S.J. Identification of sennoside A as a novel inhibitor of the slingshot (SSH) family proteins related to cancer metastasis. Pharmacol. Res. 2017, 119, 422–430. [Google Scholar] [CrossRef] [PubMed]
- Hara, Y.; Dong, J.; Ueda, H. Open-sandwich immunoassay for sensitive and broad-range detection of a shellfish toxin gonyautoxin. Anal. Chim. Acta 2013, 793, 107–113. [Google Scholar] [CrossRef] [PubMed]
- New Features. Schrödinger Release 2019-4; Schrödinger, LLC: New York, NY, USA, 2019. [Google Scholar]
- Almo, S.C.; Bonanno, J.B.; Sauder, J.M.; Emtage, S.; DiLorenzo, T.P.; Malashkevich, V.; Wasserman, S.R.; Swaminathan, S.; Eswaramoorthy, S.; Agarwal, R.; et al. Structural genomics of protein phosphatases. J. Struct. Funct. Genom. 2007, 8, 121–140. [Google Scholar] [CrossRef] [PubMed] [Green Version]
- Cho, Y.L.; Park, J.G.; Kang, H.J.; Kim, W.; Cho, M.J.; Jang, J.H.; Kwon, M.G.; Kim, S.; Lee, S.H.; Lee, J.; et al. Ginkgetin, a biflavone from Ginkgo biloba leaves, prevents adipogenesis through STAT5-mediated PPARgamma and C/EBPalpha regulation. Pharmacol. Res. 2019, 139, 325–336. [Google Scholar] [CrossRef]
- Yoon, S.-Y.; Yu, J.S.; Hwang, J.Y.; So, H.M.; Seo, S.O.; Kim, J.K.; Jang, T.S.; Chung, S.J.; Kim, K.H. Phloridzin Acts as an Inhibitor of Protein-Tyrosine Phosphatase MEG2 Relevant to Insulin Resistance. Molecules 2021, 26, 1612. [Google Scholar] [CrossRef]
- Haim, T.E.; Wang, W.; Flagg, T.P.; Tones, M.A.; Bahinski, A.; Numann, R.E.; Nichols, C.G.; Nerbonne, J.M. Palmitate attenuates myocardial contractility through augmentation of repolarizing Kv currents. J. Mol. Cell. Cardiol. 2010, 48, 395–405. [Google Scholar] [CrossRef] [Green Version]
- Zhao, X.; Yoon, D.-O.; Yoo, J.; Park, H.-J. Structure–Activity Relationship Study and Biological Evaluation of 2-(Disubstituted phenyl)-indole-5-propanoic Acid Derivatives as GPR40 Full Agonists. J. Med. Chem. 2021, 64, 4130–4149. [Google Scholar] [CrossRef]


| Compound | Structure | Partition Coefficient (log p) a | IC50 (μM) (PTPN9) b | IC50 (μM) (DUSP9) c |
|---|---|---|---|---|
| GA |  | 6.7 | 0.45 | 0.11 |
| 1a | 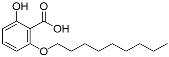 | 4.4 | NA | NA |
| 1b | 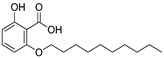 | 4.82 | NA | NA |
| 1c |  | 5.24 | 0.78 | 0.65 |
| 1d |  | 5.65 | 0.1 | 0.66 |
| 1e | 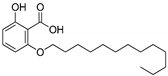 | 6.07 | 0.17 | 0.87 |
| 1f | 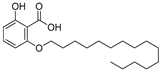 | 6.91 | 0.52 | 0.55 |
| 2 | 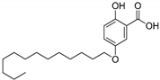 | 6.07 | 6.22 | 0.07 |
| 3 | 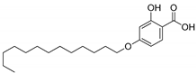 | 6.07 | 1.00 | 0.06 |
Publisher’s Note: MDPI stays neutral with regard to jurisdictional claims in published maps and institutional affiliations. |
© 2022 by the authors. Licensee MDPI, Basel, Switzerland. This article is an open access article distributed under the terms and conditions of the Creative Commons Attribution (CC BY) license (https://creativecommons.org/licenses/by/4.0/).
Share and Cite
Kim, J.; Son, J.; Ahn, D.; Nam, G.; Zhao, X.; Park, H.; Jeong, W.; Chung, S.J. Structure–Activity Relationship of Synthetic Ginkgolic Acid Analogs for Treating Type 2 Diabetes by PTPN9 Inhibition. Int. J. Mol. Sci. 2022, 23, 3927. https://doi.org/10.3390/ijms23073927
Kim J, Son J, Ahn D, Nam G, Zhao X, Park H, Jeong W, Chung SJ. Structure–Activity Relationship of Synthetic Ginkgolic Acid Analogs for Treating Type 2 Diabetes by PTPN9 Inhibition. International Journal of Molecular Sciences. 2022; 23(7):3927. https://doi.org/10.3390/ijms23073927
Chicago/Turabian StyleKim, Jinsoo, Jinyoung Son, Dohee Ahn, Gibeom Nam, Xiaodi Zhao, Hyuna Park, Woojoo Jeong, and Sang J. Chung. 2022. "Structure–Activity Relationship of Synthetic Ginkgolic Acid Analogs for Treating Type 2 Diabetes by PTPN9 Inhibition" International Journal of Molecular Sciences 23, no. 7: 3927. https://doi.org/10.3390/ijms23073927