
Acute Hypoxia Alters Extracellular Vesicle Signatures and the Brain Citrullinome of Naked Mole-Rats (Heterocephalus glaber)

 , , , and
Abstract
:1. Introduction
2. Results
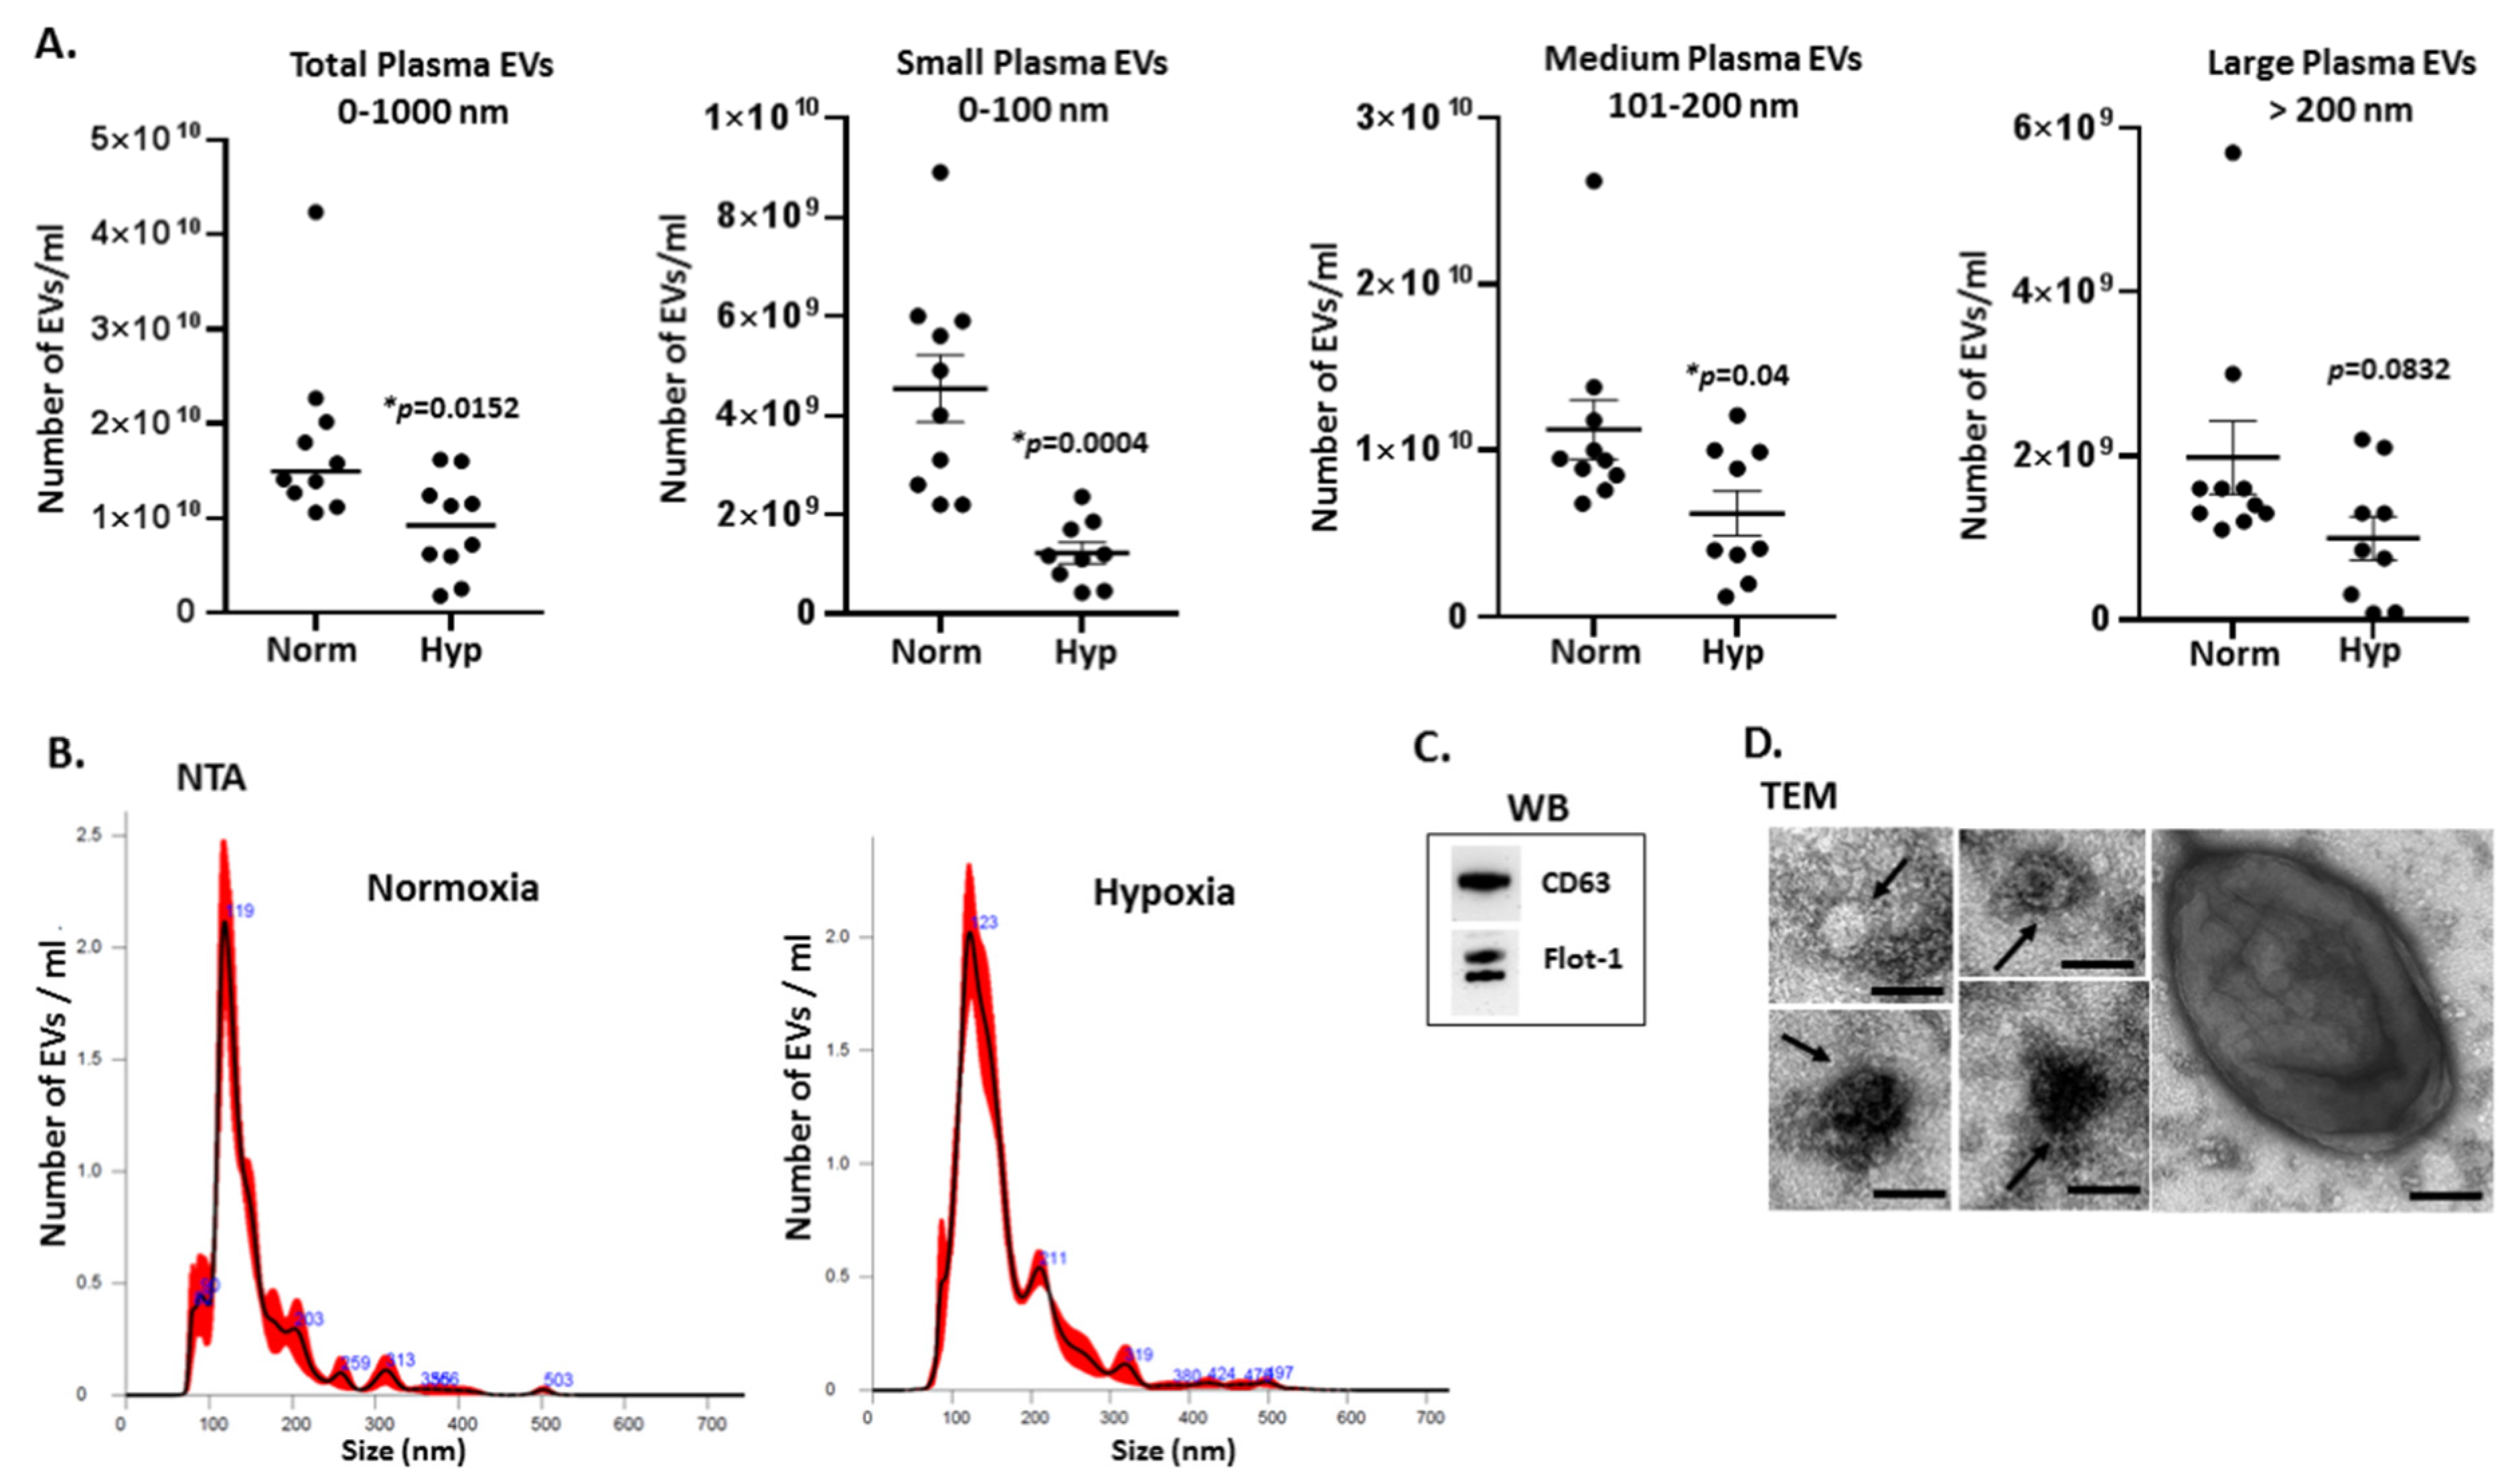
2.1. Extracellular Vesicle Profiles in Naked Mole-Rat Plasma Change in Response to Hypoxia Treatment
2.2. Proteomic Profiles of Naked Mole-Rat Plasma EVs Change Following Hypoxia
2.3. Citrullinated Protein Profiles of Plasma EVs under Normoxic Versus Hypoxic Conditions in Naked Mole-Rats
2.4. PAD Isozyme Levels Differ in Naked Mole-Rat Brains from Normoxia and Hypoxia Groups
2.5. The Brain Citrullinome of Naked Mole-Rats Is Increased Following Hypoxic Challenge
3. Discussion
3.1. EV Proteomic Signatures in Normoxia- and Hypoxia-Treated Naked Mole-Rats
3.2. EV Citrullinome Signatures in Normoxia- and Hypoxia-Treated Naked Mole-Rats
3.3. Changes in PADs and the Brain Citrullinome
3.4. EV Signatures and the Brain Citrullinome in Relation to HIF-1 Regulation
3.5. Histones in EV Signatures and the Brain Citrullinome
4. Materials and Methods
4.1. Animals
4.2. Extracellular Vesicle Isolation and Characterisation by NTA Analysis, Western Blotting, and Transmission Electron Microscopy
4.3. Protein Isolation from Brain Tissue and Western Blotting
4.4. F95-Enrichment for Deiminated Proteins from Plasma EVs and Brain Tissue
4.5. Silver Staining of Proteins and F95-Enriched Proteins
4.6. LC-MS/MS Proteomic Analysis
4.7. Protein Interaction Network Analysis
4.8. Statistical Analysis
5. Conclusions
Supplementary Materials
Author Contributions
Funding
Institutional Review Board Statement
Data Availability Statement
Acknowledgments
Conflicts of Interest
References
- Buffenstein, R.; Amoroso, V.; Andziak, B.; Avdieiev, S.; Azpurua, J.; Barker, A.J.; Bennett, N.C.; Brieno-Enriquez, M.A.; Bronner, G.N.; Coen, C.; et al. The naked truth: A comprehensive clarification and classification of current ‘myths’ in naked mole-rat biology. Biol. Rev. Camb. Philos. Soc. 2022, 97, 115–140. [Google Scholar] [CrossRef] [PubMed]
- Pamenter, M.E. Adaptations to a hypoxic lifestyle in naked mole-rats. J. Exp. Biol. 2022, 225, jeb196725. [Google Scholar] [CrossRef] [PubMed]
- Chung, D.; Dzal, Y.A.; Seow, A.; Milsom, W.K.; Pamenter, M.E. Naked mole rats exhibit metabolic but not ventilatory plasticity following chronic sustained hypoxia. Proc. Biol. Sci. 2016, 283, 20160216. [Google Scholar] [CrossRef] [PubMed] [Green Version]
- Pamenter, M.E.; Dzal, Y.A.; Milsom, W.K. Adenosine receptors mediate the hypoxic ventilatory response but not the hypoxic metabolic response in the naked mole rat during acute hypoxia. Proc. Biol. Sci. 2015, 282, 20141722. [Google Scholar] [CrossRef] [Green Version]
- Pamenter, M.E.; Lau, G.Y.; Richards, J.G.; Milsom, W.K. Naked mole rat brain mitochondria electron transport system flux and H(+) leak are reduced during acute hypoxia. J. Exp. Biol. 2018, 221 Pt 4, jeb171397. [Google Scholar] [CrossRef] [Green Version]
- Park, T.J.; Reznick, J.; Peterson, B.L.; Blass, G.; Omerbasic, D.; Bennett, N.C.; Kuich, P.H.J.L.; Zasada, C.; Browe, B.M.; Hamann, W.; et al. Fructose-driven glycolysis supports anoxia resistance in the naked mole-rat. Science 2017, 356, 305–308. [Google Scholar] [CrossRef] [Green Version]
- Cheng, H.; Pamenter, M.E. Naked mole-rat brain mitochondria tolerate in vitro ischaemia. J. Physiol. 2021, 599, 4671–4685. [Google Scholar] [CrossRef]
- Pamenter, M.E.; Cheng, H. Supermole-rat to the rescue: Does the naked mole-rat offer a panacea for all that ails us? Comp. Biochem. Physiol. A Mol. Integr. Physiol. 2022, 266, 111139. [Google Scholar] [CrossRef]
- Pamenter, M.E.; Dzal, Y.A.; Thompson, I.A.; Milsom, W.K. Do naked mole rats accumulate a metabolic acidosis or an oxygen debt in severe hypoxia? J. Exp. Biol. 2019, 222 Pt 3, jeb191197. [Google Scholar] [CrossRef] [Green Version]
- Houlahan, C.R.; Kirby, A.M.; Dzal, Y.A.; Fairman, G.D.; Pamenter, M.E. Divergent behavioural responses to acute hypoxia between individuals and groups of naked mole rats. Comp. Biochem. Physiol. B Biochem. Mol. Biol. 2018, 224, 38–44. [Google Scholar] [CrossRef]
- Ilacqua, A.N.; Kirby, A.M.; Pamenter, M.E. Behavioural responses of naked mole rats to acute hypoxia and anoxia. Biol. Lett. 2017, 13, 20170545. [Google Scholar] [CrossRef] [PubMed] [Green Version]
- Kirby, A.M.; Fairman, G.D.; Pamenter, M.E. Atypical behavioural, metabolic and thermoregulatory responses to hypoxia in the naked mole rat (Heterocephalus glaber). J. Zool. 2018, 305, 106–115. [Google Scholar] [CrossRef]
- Cheng, H.; Sebaa, R.; Malholtra, N.; Lacoste, B.; El Hankouri, Z.; Kirby, A.; Bennett, N.C.; van Jaarsveld, B.; Hart, D.W.; Tattersall, G.J.; et al. Naked mole-rat brown fat thermogenesis is diminished during hypoxia through a rapid decrease in UCP1. Nat. Commun. 2021, 12, 6801. [Google Scholar] [CrossRef] [PubMed]
- Vandewint, A.L.; Zhu-Pawlowsky, A.J.; Kirby, A.; Tattersall, G.J.; Pamenter, M.E. Evaporative cooling and vasodilation mediate thermoregulation in naked mole-rats during normoxia but not hypoxia. J. Therm. Biol. 2019, 84, 228–235. [Google Scholar] [CrossRef]
- Al-Attar, R.; Childers, C.L.; Nguyen, V.C.; Pamenter, M.E.; Storey, K.B. Differential protein phosphorylation is responsible for hypoxia-induced regulation of the Akt/mTOR pathway in naked mole rats. Comp. Biochem. Physiol. A Mol. Integr. Physiol. 2020, 242, 110653. [Google Scholar] [CrossRef] [PubMed]
- Reznick, J.; Park, T.J.; Lewin, G.R. A Sweet Story of Metabolic Innovation in the Naked Mole-Rat. Adv. Exp. Med. Biol. 2021, 1319, 271–286. [Google Scholar] [PubMed]
- Farhat, E.; Devereaux, M.E.M.; Pamenter, M.E.; Weber, J.M. Naked mole-rats suppress energy metabolism and modulate membrane cholesterol in chronic hypoxia. Am. J. Physiol. Regul. Integr. Comp. Physiol. 2020, 319, R148–R155. [Google Scholar] [CrossRef] [PubMed]
- Hadj-Moussa, H.; Chiasson, S.; Cheng, H.; Eaton, L.; Storey, K.B.; Pamenter, M.E. MicroRNA-mediated inhibition of AMPK coordinates tissue-specific downregulation of skeletal muscle metabolism in hypoxic naked mole-rats. J. Exp. Biol. 2021, 224, jeb242968. [Google Scholar] [CrossRef]
- Hadj-Moussa, H.; Pamenter, M.E.; Storey, K.B. Hypoxic naked mole-rat brains use microRNA to coordinate hypometabolic fuels and neuroprotective defenses. J. Cell Physiol. 2021, 236, 5080–5097. [Google Scholar] [CrossRef]
- Logan, S.M.; Szereszewski, K.E.; Bennett, N.C.; Hart, D.W.; van Jaarsveld, B.; Pamenter, M.E.; Storey, K.B. (2020). The brains of six African mole-rat species show divergent responses to hypoxia. J. Exp. Biol. 2020, 223 Pt 9, jeb215905. [Google Scholar] [CrossRef]
- Nguyen, V.C.; Deck, C.A.; Pamenter, M.E. Naked mole-rats reduce the expression of ATP-dependent but not ATP-independent heat shock proteins in acute hypoxia. J. Exp. Biol. 2019, 222 Pt 22, jeb211243. [Google Scholar] [CrossRef]
- Dzal, Y.A.; Seow, A.; Borecky, L.G.; Chung, D.; Gill, S.K.G.; Milsom, W.K.; Pamenter, M.E. Glutamatergic Receptors Modulate Normoxic but Not Hypoxic Ventilation and Metabolism in Naked Mole Rats. Front. Physiol. 2019, 10, 106. [Google Scholar] [CrossRef] [PubMed] [Green Version]
- Cheng, H.; Munro, D.; Huynh, K.; Pamenter, M.E. Naked mole-rat skeletal muscle mitochondria exhibit minimal functional plasticity in acute or chronic hypoxia. Comp. Biochem. Physiol. B Biochem. Mol. Biol. 2021, 255, 110596. [Google Scholar] [CrossRef] [PubMed]
- Lau, G.Y.; Milsom, W.K.; Richards, J.G.; Pamenter, M.E. Heart mitochondria from naked mole-rats (Heterocephalus glaber) are more coupled, but similarly susceptible to anoxia-reoxygenation stress than in laboratory mice (Mus musculus). Comp. Biochem. Physiol. B Biochem. Mol. Biol. 2020, 240, 110375. [Google Scholar] [CrossRef] [PubMed]
- Siesjo, B.K. Mechanisms of ischemic brain damage. Crit. Care Med. 1988, 16, 954–963. [Google Scholar] [CrossRef] [PubMed]
- Farhat, E.; Devereaux, M.E.M.; Cheng, H.; Weber, J.M.; Pamenter, M.E. Na(+)/K(+)-ATPase activity is regionally regulated by acute hypoxia in naked mole-rat brain. Neurosci. Lett. 2021, 764, 136244. [Google Scholar] [CrossRef]
- Buck, L.T.; Pamenter, M.E. Adaptive responses of vertebrate neurons to anoxia--matching supply to demand. Respir. Physiol. Neurobiol. 2006, 154, 226–240. [Google Scholar] [CrossRef] [PubMed]
- Choi, D.W. Excitotoxic cell death. J. Neurobiol. 1992, 23, 1261–1276. [Google Scholar] [CrossRef]
- Cheng, H.; Qin, Y.A.; Dhillon, R.; Dowell, J.; Denu, J.M.; Pamenter, M.E. Metabolomic Analysis of Carbohydrate and Amino Acid Changes Induced by Hypoxia in Naked Mole-Rat Brain and Liver. Metabolites 2022, 12, 56. [Google Scholar] [CrossRef]
- Peterson, B.L.; Larson, J.; Buffenstein, R.; Park, T.J.; Fall, C.P. Blunted neuronal calcium response to hypoxia in naked mole-rat hippocampus. PLoS ONE 2012, 7, e31568. [Google Scholar] [CrossRef] [Green Version]
- Peterson, B.L.; Park, T.J.; Larson, J. Adult naked mole-rat brain retains the NMDA receptor subunit GluN2D associated with hypoxia tolerance in neonatal mammals. Neurosci. Lett. 2012, 506, 342–345. [Google Scholar] [CrossRef] [PubMed] [Green Version]
- Pamenter, M.E.; Uysal-Onganer, P.; Huynh, K.W.; Kraev, I.; Lange, S. Post-Translational Deimination of Immunological and Metabolic Protein Markers in Plasma and Extracellular Vesicles of Naked Mole-Rat (Heterocephalus glaber). Int. J. Mol. Sci. 2019, 20, 5378. [Google Scholar] [CrossRef] [PubMed] [Green Version]
- Vossenaar, E.R.; Zendman, A.J.; van Venrooij, W.J.; Pruijn, G.J. PAD, a growing family of citrullinating enzymes: Genes, features and involvement in disease. BioEssays 2003, 25, 1106–1118. [Google Scholar] [CrossRef] [PubMed]
- György, B.; Toth, E.; Tarcsa, E.; Falus, A.; Buzas, E.I. Citrullination: A posttranslational modification in health and disease. Int. J. Biochem. Cell Biol. 2006, 38, 1662–1677. [Google Scholar] [CrossRef]
- Alghamdi, M.; Al Ghamdi, K.A.; Khan, R.H.; Uversky, V.N.; Redwan, E.M. An interplay of structure and intrinsic disorder in the functionality of peptidylarginine deiminases, a family of key autoimmunity-related enzymes. Cell Mol. Life Sci. 2018, 76, 4635–4662. [Google Scholar] [CrossRef]
- Mondal, S.; Thompson, P.R. Protein arginine deiminases (PADs): Biochemistry and chemical biology of protein citrullination. Acc. Chem. Res. 2019, 52, 818–832. [Google Scholar] [CrossRef]
- Witalison, E.E.; Thompson, P.R.; Hofseth, L.J. Protein Arginine Deiminases and Associated Citrullination: Physiological Functions and Diseases Associated with Dysregulation. Curr. Drug Targets 2015, 16, 700–710. [Google Scholar] [CrossRef]
- Wang, S.; Wang, Y. Peptidylarginine deiminases in citrullination, gene regulation, health and pathogenesis. Biochim. Biophys. Acta 2013, 1829, 1126–1135. [Google Scholar] [CrossRef] [Green Version]
- Lange, S.; Gallagher, M.; Kholia, S.; Kosgodage, U.S.; Hristova, M.; Hardy, J.; Inal, J.M. Peptidylarginine Deiminases-Roles in Cancer and Neurodegeneration and Possible Avenues for Therapeutic Intervention via Modulation of Exosome and Microvesicle (EMV) Release? Int. J. Mol. Sci. 2017, 18, 1196. [Google Scholar] [CrossRef]
- Lange, S. Peptidylarginine deiminases and extracellular vesicles: Prospective drug targets and biomarkers in central nervous system diseases and repair. Neural Regen. Res. 2021, 16, 934–938. [Google Scholar] [CrossRef]
- Wang, L.; Chen, H.; Tang, J.; Guo, Z.; Wang, Y. Peptidylarginine Deiminase and Alzheimer’s Disease. J. Alzheimers Dis. 2022, 85, 473–484. [Google Scholar] [CrossRef] [PubMed]
- Moscarello, M.A.; Pritzker, L.; Mastronardi, F.G.; Wood, D.D. Peptidylarginine deiminase: A candidate factor in demyelinating disease. J. Neurochem. 2002, 81, 335–343. [Google Scholar] [CrossRef] [PubMed] [Green Version]
- Lange, S.; Gögel, S.; Leung, K.Y.; Vernay, B.; Nicholas, A.P.; Causey, C.P.; Thompson, P.R.; Greene, N.D.; Ferretti, P. Protein deiminases: New players in the developmentally regulated loss of neural regenerative ability. Dev. Biol. 2011, 355, 205–214. [Google Scholar] [CrossRef] [PubMed] [Green Version]
- Lange, S.; Rocha-Ferreira, E.; Thei, L.; Mawjee, P.; Bennett, K.; Thompson, P.R.; Subramanian, V.; Nicholas, A.P.; Peebles, D.; Hristova, M.; et al. Peptidylarginine deiminases: Novel drug targets for prevention of neuronal damage following hypoxic ischemic insult (HI) in neonates. J. Neurochem. 2014, 130, 555–562. [Google Scholar] [CrossRef]
- Lazarus, R.C.; Buonora, J.E.; Flora, M.N.; Freedy, J.G.; Holstein, G.R.; Martinelli, G.P.; Jacobowitz, D.M.; Mueller, G.P. Protein citrullination: A proposed mechanism for pathology in traumatic brain injury. Front. Neurol. 2015, 6, 204. [Google Scholar] [CrossRef] [Green Version]
- Lange, S.; Wray, S.; Devine, M.; Matarin, M.; Hardy, J. Protein deimination in protein misfolding disorders–modelled in human induced pluripotent stem cells (iPSCs). In Protein Deimination in Human Health and Disease; Nicholas, A.P., Bhattacharya, S.K., Eds.; Springer Science and Business Media: New York, NY, USA, 2017. [Google Scholar]
- Nicholas, A.P.; Lu, L.; Heaven, M.; Kadish, I.; van Groen, T.; Accavitti-Loper, M.A.; Wewering, S.; Kofskey, D.; Gambetti, P.; Brenner, M. Ongoing studies of deimination in neurodegenerative diseases using the F95 antibody. In Protein Deimination in Human Health and Disease; Nicholas, A.P., Bhattacharya, S.K., Eds.; Springer: New York, NY, USA, 2014; pp. 257–280. [Google Scholar]
- Ishigami, A.; Masutomi, H.; Handa, S.; Nakamura, M.; Nakaya, S.; Uchida, Y.; Saito, Y.; Murayama, S.; Jang, B.; Jeon, Y.C.; et al. Mass spectrometric identification of citrullination sites and immunohistochemical detection of citrullinated glial fibrillary acidic protein in Alzheimer’s disease brains. J. Neurosci. Res. 2015, 93, 1664–1674. [Google Scholar] [CrossRef]
- Jang, B.; Jeon, Y.C.; Shin, H.Y.; Lee, Y.J.; Kim, H.; Kondo, Y.; Ishigami, A.; Kim, Y.S.; Choi, E.K. Myelin basic protein citrullination, a hallmark of central nervous system demyelination, assessed by novel monoclonal antibodies in prion diseases. Mol. Neurobiol. 2018, 55, 3172–3184. [Google Scholar] [CrossRef]
- Attilio, P.J.; Flora, M.; Kamnaksh, A.; Bradshaw, D.J.; Agoston, D.; Mueller, G.P. The effects of blast exposure on protein deimination in the brain. Oxid. Med. Cell Longev. 2017, 2017, 8398072. [Google Scholar] [CrossRef]
- Kosgodage, U.S.; Uysal-Onganer, P.; MacLatchy, A.; Kraev, I.; Chatterton, N.P.; Nicholas, A.P.; Inal, J.M.; Lange, S. Peptidylarginine deiminases post-translationally deiminate prohibitin and modulate extracellular vesicle release and microRNAs in glioblastoma multiforme. Int. J. Mol. Sci. 2018, 20, 103. [Google Scholar] [CrossRef] [Green Version]
- Uysal-Onganer, P.; MacLatchy, A.; Mahmoud, R.; Kraev, I.; Thompson, P.R.; Inal, J.M.; Lange, S. Peptidylarginine deiminase isozyme-specific PAD2, PAD3 and PAD4 inhibitors differentially modulate extracellular vesicle signatures and cell invasion in two glioblastoma multiforme cell lines. Int. J. Mol. Sci. 2020, 21, 1495. [Google Scholar] [CrossRef] [Green Version]
- Caprariello, A.V.; Rogers, J.A.; Morgan, M.L.; Hoghooghi, V.; Plemel, J.R.; Koebel, A.; Tsutsui, S.; Dunn, J.F.; Kotra, L.P.; Ousman, S.S.; et al. Biochemically altered myelin triggers autoimmune demyelination. Proc. Natl. Acad. Sci. USA 2018, 115, 5528–5533. [Google Scholar] [CrossRef] [PubMed] [Green Version]
- Faigle, W.; Cruciani, C.; Wolski, W.; Roschitzki, B.; Puthenparampil, M.; Tomas-Ojer, P.; Sellés-Moreno, C.; Zeis, T.; Jelcic, I.; Schaeren-Wiemers, N.; et al. Brain citrullination patterns and T cell reactivity of cerebrospinal fluid-derived CD4+ T cells in multiple sclerosis. Front. Immunol. 2019, 10, 540. [Google Scholar] [CrossRef] [PubMed] [Green Version]
- Sancandi, M.; Uysal-Onganer, P.; Kraev, I.; Mercer, A.; Lange, S. Protein deimination signatures in plasma and plasma-EVs and protein deimination in the brain vasculature in a rat model of pre-motor Parkinson’s disease. Int. J. Mol. Sci. 2020, 21, 2743. [Google Scholar] [CrossRef] [PubMed] [Green Version]
- Sambandam, T.; Belousova, M.; Accaviti-Loper, M.A.; Blanquicett, C.; Guercello, V.; Raijmakers, R.; Nicholas, A.P. Increased peptidylarginine deiminase type II in hypoxic astrocytes. Biochem. Biophys. Res. Commun. 2004, 325, 1324–1329. [Google Scholar] [CrossRef] [PubMed]
- Lange, S. Peptidylarginine Deiminases as Drug Targets in Neonatal Hypoxic-Ischemic Encephalopathy. Front. Neurol. 2016, 7, 22. [Google Scholar] [CrossRef] [Green Version]
- Sase, T.; Arito, M.; Onodera, H.; Omoteyama, K.; Kurokawa, M.S.; Kagami, Y.; Ishigami, A.; Tanaka, Y.; Kato, T. Hypoxia-induced production of peptidylarginine deiminases and citrullinated proteins in malignant glioma cells. Biochem. Biophys. Res. Commun. 2017, 482, 50–56. [Google Scholar] [CrossRef]
- Yu, R.; Li, C.; Sun, L.; Jian, L.; Ma, Z.; Zhao, J.; Liu, X. Hypoxia induces production of citrullinated proteins in human fibroblast-like synoviocytes through regulating HIF1α. Scand. J. Immunol. 2018, 87, e12654. [Google Scholar] [CrossRef] [Green Version]
- Valles, J.; Lago, A.; Santos, M.T.; Latorre, A.M.; Tembl, J.I.; Salom, J.B.; Nieves, C.; Moscardó, A. Neutrophil extracellular traps are increased in patients with acute ischemic stroke: Prognostic,significance. Thromb. Haemost. 2017, 117, 1919–1929. [Google Scholar] [CrossRef]
- Vaibhav, K.; Braun, M.; Alverson, K.; Khodadadi, H.; Kutiyanawalla, A.; Ward, A.; Banerjee, C.; Sparks, T.; Malik, A.; Rashid, M.H.; et al. Neutrophil extracellular traps exacerbate neurological deficits after traumatic brain injury. Sci. Adv. 2020, 6, eaax8847. [Google Scholar] [CrossRef]
- He, W.; Zhou, P.; Chang, Z.; Liu, B.; Liu, X.; Wang, Y.; Li, Y.; Alam, H.B. Inhibition of peptidylarginine deiminase attenuates inflammation and improves survival in a rat model of hemorrhagic shock. J. Surg. Res. 2016, 200, 610–618. [Google Scholar] [CrossRef] [Green Version]
- Eghbalzadeh, K.; Georgi, L.; Louis, T.; Zhao, H.; Keser, U.; Weber, C.; Mollenhauer, M.; Conforti, A.; Wahlers, T.; Paunel-Görgülü, A. Compromised Anti-inflammatory Action of Neutrophil Extracellular Traps in PAD4-Deficient Mice Contributes to Aggravated Acute Inflammation After Myocardial Infarction. Front. Immunol. 2019, 10, 2313. [Google Scholar] [CrossRef] [PubMed]
- Vincent, D.; Klinke, M.; Eschenburg, G.; Trochimiuk, M.; Appl, B.; Tiemann, B.; Bergholz, R.; Reinshagen, K.; Boettcher, M. NEC is likely a NETs dependent process and markers of NETosis are predictive of NEC in mice and humans. Sci. Rep. 2018, 8, 12612. [Google Scholar] [CrossRef] [PubMed] [Green Version]
- Fan, T.; Zhang, C.; Zong, M.; Fan, L. Hypoxia-induced autophagy is inhibited by PADI4 knockdown, which promotes apoptosis of fibroblast-like synoviocytes in rheumatoid arthritis. Mol. Med. Rep. 2018, 17, 5116–5124. [Google Scholar] [CrossRef] [PubMed]
- Wang, Y.; Lyu, Y.; Tu, K.; Xu, Q.; Yang, Y.; Salman, S.; Le, N.; Lu, H.; Chen, C.; Zhu, Y.; et al. Histone citrullination by PADI4 is required for HIF-dependent transcriptional responses to hypoxia and tumor vascularization. Sci. Adv. 2021, 7, eabe3771. [Google Scholar] [CrossRef]
- Bister, N.; Pistono, C.; Huremagic, B.; Jolkkonen, J.; Giugno, R.; Malm, T. Hypoxia and extracellular vesicles: A review on methods, vesicular cargo and functions. J. Extracell. Vesicles 2020, 10, e12002. [Google Scholar] [CrossRef]
- Yaghoubi, S.; Najminejad, H.; Dabaghian, M.; Karimi, M.H.; Abdollahpour-Alitappeh, M.; Rad, F.; Mahi-Birjand, M.; Mohammadi, S.; Mohseni, F.; Sobhani Lari, M.; et al. How Hypoxia Regulate Exosomes in Ischemic Diseases and Cancer Microenvironment? IUBMB Life 2020, 72, 1286–1305. [Google Scholar] [CrossRef]
- Venturella, M.; Criscuoli, M.; Carraro, F.; Naldini, A.; Zocco, D. Interplay between Hypoxia and Extracellular Vesicles in Cancer and Inflammation. Biology 2021, 10, 606. [Google Scholar] [CrossRef]
- Zhang, Y.; Tan, J.; Miao, Y.; Zhang, Q. The effect of extracellular vesicles on the regulation of mitochondria under hypoxia. Cell Death Dis. 2021, 12, 358. [Google Scholar] [CrossRef]
- Słomka, A.; Urban, S.K.; Lukacs-Kornek, V.; Żekanowska, E.; Kornek, M. Large extracellular vesicles: Have we found the holy grail of inflammation? Front. Immunol. 2018, 9, 2723. [Google Scholar] [CrossRef]
- Taylor, C.T.; Colgan, S.P. Regulation of Immunity and Inflammation by Hypoxia in Immunological Niches. Nat. Rev. Immunol. 2017, 17, 774–785. [Google Scholar] [CrossRef]
- Eltzschig, H.K.; Carmeliet, P. Hypoxia and Inflammation. N. Engl. J. Med. 2011, 364, 656–665. [Google Scholar] [CrossRef] [PubMed] [Green Version]
- Iba, T.; Levy, J.H.; Levi, M.; Thachil, J. Coagulopathy in COVID-19. J. Thromb. Haemost. 2020, 18, 2103–2109. [Google Scholar] [CrossRef] [PubMed]
- Castro, R.A.; Frishman, W.H. Thrombotic Complications of COVID-19 Infection: A Review. Cardiol. Rev. 2021, 29, 43–47. [Google Scholar] [CrossRef] [PubMed]
- Vrtačnik, P.; Ostanek, B.; Mencej-Bedrač, S.; Marc, J. The many faces of estrogen signaling. Biochem. Med. 2014, 24, 329–342. [Google Scholar] [CrossRef] [Green Version]
- Rothenberger, N.J.; Somasundaram, A.; Stabile, L.P. The Role of the Estrogen Pathway in the Tumor Microenvironment. Int. J. Mol. Sci. 2018, 19, 611. [Google Scholar] [CrossRef] [Green Version]
- Potokar, M.; Jorgačevski, J. Plectin in the Central Nervous System and a Putative Role in Brain Astrocytes. Cells 2021, 10, 2353. [Google Scholar] [CrossRef]
- Wiche, G. Plectin-Mediated Intermediate Filament Functions: Why Isoforms Matter. Cells 2021, 10, 2154. [Google Scholar] [CrossRef]
- Kholia, S.; Jorfi, S.; Thompson, P.R.; Causey, C.P.; Nicholas, A.P.; Inal, J.M.; Lange, S. A novel role for peptidylarginine deiminases in microvesicle release reveals therapeutic potential of PAD inhibition in sensitizing prostate cancer cells to chemotherapy. J. Extracell. Vesicles 2015, 4, 26192. [Google Scholar] [CrossRef] [Green Version]
- Liberti, M.V.; Allen, A.E.; Ramesh, V.; Dai, Z.; Singleton, K.R.; Guo, Z.; Liu, J.O.; Wood, K.C.; Locasale, J.W. Evolved resistance to partial GAPDH inhibition results in loss of the Warburg effect and in a different state of glycolysis. J. Biol. Chem. 2020, 295, 111–124. [Google Scholar] [CrossRef]
- Mikeladze, M.A.; Dutysheva, E.A.; Kartsev, V.G.; Margulis, B.A.; Guzhova, I.V.; Lazarev, V.F. Disruption of the Complex between GAPDH and Hsp70 Sensitizes C6 Glioblastoma Cells to Hypoxic Stress. Int. J. Mol. Sci. 2021, 22, 1520. [Google Scholar] [CrossRef]
- Chaput, D.; Kirouac, L.; Stevens, S.M., Jr.; Padmanabhan, J. Potential role of PCTAIRE-2, PCTAIRE-3 and P-Histone H4 in amyloid precursor protein-dependent Alzheimer pathology. Oncotarget 2016, 7, 8481–8497. [Google Scholar] [CrossRef] [PubMed] [Green Version]
- Herskovits, A.Z.; Davies, P. The regulation of tau phosphorylation by PCTAIRE 3: Implications for the pathogenesis of Alzheimer’s disease. Neurobiol. Dis. 2006, 23, 398–408. [Google Scholar] [CrossRef] [PubMed]
- Shimizu, Y.; Nakai, Y.; Watanabe, H.; Iikuni, S.; Ono, M.; Saji, H.; Kuge, Y.; Saga, T.; Nakamoto, Y. Increased [18F]FMISO accumulation under hypoxia by multidrug-resistant protein 1 inhibitors. EJNMMI Res. 2021, 11, 9. [Google Scholar] [CrossRef]
- Lombardi, M.S.; van den Tweel, E.; Kavelaars, A.; Groenendaal, F.; van Bel, F.; Heijnen, C.J. Hypoxia/ischemia modulates G protein-coupled receptor kinase 2 and beta-arrestin-1 levels in the neonatal rat brain. Stroke 2004, 35, 981–986. [Google Scholar] [CrossRef] [Green Version]
- Singh, R.K.; Bose, D.; Robertson, E.S. HIF1α-Regulated Expression of the Fatty Acid Binding Protein Family Is Important for Hypoxic Reactivation of Kaposi’s Sarcoma-Associated Herpesvirus. J. Virol. 2021, 95, e02063-20. [Google Scholar] [CrossRef] [PubMed]
- McKenna, Z.J.; Fennel, Z.J.; Berkemeier, Q.N.; Nava, R.C.; Amorim, F.T.; Deyhle, M.R.; Mermier, C.M. Exercise in hypobaric hypoxia increases markers of intestinal injury and symptoms of gastrointestinal distress. Exp. Physiol. 2022, 107, 326–336. [Google Scholar] [CrossRef] [PubMed]
- Brown, T.J.; Kollara, A.; Shathasivam, P.; Ringuette, M.J. Ventricular Zone Expressed PH Domain Containing 1 (VEPH1): An adaptor protein capable of modulating multiple signaling transduction pathways during normal and pathological development. Cell Commun. Signal. 2019, 17, 116. [Google Scholar] [CrossRef] [Green Version]
- Salomon, C.; Ryan, J.; Sobrevia, L.; Kobayashi, M.; Ashman, K.; Mitchell, M.; Rice, G.E. Exosomal signaling during hypoxia mediates microvascular endothelial cell migration and vasculogenesis. PLoS ONE 2013, 8, e68451. [Google Scholar] [CrossRef]
- Méchin, M.C.; Takahara, H.; Simon, M. Deimination and Peptidylarginine Deiminases in Skin Physiology and Diseases. Int. J. Mol. Sci. 2020, 21, 566. [Google Scholar] [CrossRef] [Green Version]
- Zhang, X.; Liu, X.; Zhang, M.; Li, T.; Muth, A.; Thompson, P.R.; Coonrod, S.A.; Zhang, X. Peptidylarginine deiminase 1-catalyzed histone citrullination is essential for early embryo development. Sci. Rep. 2016, 6, 38727. [Google Scholar] [CrossRef] [Green Version]
- Qin, H.; Liu, X.; Li, F.; Miao, L.; Li, T.; Xu, B.; An, X.; Muth, A.; Thompson, P.R.; Coonrod, S.A.; et al. PAD1 promotes epithelial-mesenchymal transition and metastasis in triple-negative breast cancer cells by regulating MEK1-ERK1/2-MMP2 signaling. Cancer Lett. 2017, 409, 30–41. [Google Scholar] [CrossRef] [PubMed] [Green Version]
- Cau, L.; Takahara, H.; Thompson, P.R.; Serre, G.; Méchin, M.C.; Simon, M. Peptidylarginine Deiminase Inhibitor Cl-Amidine Attenuates Cornification and Interferes with the Regulation of Autophagy in Reconstructed Human Epidermis. J. Investig. Dermatol. 2019, 139, 1889–1897.e4. [Google Scholar] [CrossRef] [PubMed]
- Subramanian, V.; Nicholas, A.P.; Thompson, P.R.; Ferretti, P. Modulation of calcium-induced cell death in human neural stem cells by the novel peptidylarginine deiminase-AIF pathway. Biochim. Biophys. Acta 2014, 1843, 1162–1171. [Google Scholar]
- Coassolo, S.; Davidson, G.; Negroni, L.; Gambi, G.; Daujat, S.; Romier, C.; Davidson, I. Citrullination of pyruvate kinase M2 by PADI1 and PADI3 regulates glycolysis and cancer cell proliferation. Nat. Commun. 2021, 12, 1718. [Google Scholar] [CrossRef]
- Esposito, G.; Vitale, A.M.; Leijten, F.P.; Strik, A.M.; Koonen-Reemst, A.M.; Yurttas, P.; Robben, T.J.; Coonrod, S.; Gossen, J.A. Peptidylarginine deiminase (PAD) 6 is essential for oocyte cytoskeletal sheet formation and female fertility. Mol Cell Endocrinol. 2007, 273, 25–31. [Google Scholar] [CrossRef] [Green Version]
- Horibata, S.; Coonrod, S.A.; Cherrington, B.D. Role for peptidylarginine deiminase enzymes in disease and female reproduction. J. Reprod. Dev. 2012, 58, 274–282. [Google Scholar] [CrossRef] [Green Version]
- Xu, Y.; Shi, Y.; Fu, J.; Yu, M.; Feng, R.; Sang, Q.; Liang, B.; Chen, B.; Qu, R.; Li, B.; et al. Mutations in PADI6 Cause Female Infertility Characterized by Early Embryonic Arrest. Am. J. Hum. Genet. 2016, 99, 744–752. [Google Scholar] [CrossRef] [Green Version]
- Cheng, Y.; Si, Y.; Wang, L.; Ding, M.; Yu, S.; Lu, L.; Guo, Y.; Zong, M.; Fan, L. The regulation of macrophage polarization by hypoxia-PADI4 coordination in Rheumatoid arthritis. Int. Immunopharmacol. 2021, 99, 107988. [Google Scholar] [CrossRef]
- Sorli, S.C.; van den Berghe, L.; Masri, B.; Knibiehler, B.; Audigier, Y. Therapeutic potential of interfering with apelin signalling. Drug Discov. Today 2006, 11, 1100–1106. [Google Scholar] [CrossRef]
- Zhu, J.; Dou, S.; Jiang, Y.; Bai, B.; Chen, J.; Wang, C.; Cheng, B. Apelin-36 exerts the cytoprotective effect against MPP+-induced cytotoxicity in SH-SY5Y cells through PI3K/Akt/mTOR autophagy pathway. Life Sci. 2019, 224, 95–108. [Google Scholar] [CrossRef]
- Masoumi, J.; Abbasloui, M.; Parvan, R.; Mohammadnejad, D.; Pavon-Djavid, G.; Barzegari, A.; Abdolalizadeh, J. Apelin, a promising target for Alzheimer disease prevention and treatment. Neuropeptides 2018, 70, 76–86. [Google Scholar] [CrossRef] [PubMed]
- Vagin, O.; Beenhouwer, D.O. Septins: Regulators of Protein Stability. Front. Cell Dev. Biol. 2016, 4, 143. [Google Scholar] [CrossRef] [PubMed] [Green Version]
- Xiao, B.; Wang, S.; Yang, G.; Sun, X.; Zhao, S.; Lin, L.; Cheng, J.; Yang, W.; Cong, W.; Sun, W.; et al. HIF-1α contributes to hypoxia adaptation of the naked mole rat. Oncotarget 2017, 8, 109941–109951. [Google Scholar] [CrossRef] [PubMed] [Green Version]
- Kim, E.B.; Fang, X.; Fushan, A.A.; Huang, Z.; Lobanov, A.V.; Han, L.; Lobanov, A.V.; Han, L.; Marino, S.M.; Sun, X.; et al. Genome sequencing reveals insights into physiology and longevity of the naked mole rat. Nature 2011, 479, 223–227. [Google Scholar] [CrossRef]
- King, H.W.; Michael, M.Z.; Gleadle, J.M. Hypoxic Enhancement of Exosome Release by Breast Cancer Cells. BMC Cancer 2012, 12, 421. [Google Scholar] [CrossRef] [PubMed] [Green Version]
- Wang, T.; Gilkes, D.M.; Takano, N.; Xiang, L.; Luo, W.; Bishop, C.J.; Chaturvedi, P.; Green, J.J.; Semenza, G.L. Hypoxia-Inducible Factors and RAB22A Mediate Formation of Microvesicles That Stimulate Breast Cancer Invasion and Metastasis. Proc. Natl. Acad. Sci. USA 2014, 111, E3234. [Google Scholar] [CrossRef] [Green Version]
- Li, L.; Li, C.; Wang, S.; Wang, Z.; Jiang, J.; Wang, W.; Li, X.; Chen, J.; Liu, K.; Li, C.; et al. Exosomes Derived from Hypoxic Oral Squamous Cell Carcinoma Cells Deliver MiR-21 to Normoxic Cells to Elicit a Prometastatic Phenotype. Cancer Res. 2016, 76, 1770. [Google Scholar] [CrossRef] [Green Version]
- Magnadóttir, B.; Uysal-Onganer, P.; Kraev, I.; Svansson, V.; Hayes, P.; Lange, S. Deiminated proteins and extracellular vesicles—Novel serum biomarkers in whales and orca. Comp. Biochem. Physiol. Part D Genom. Proteom. 2020, 34, 100676. [Google Scholar] [CrossRef]
- Wong, S.L.; Wagner, D.D. Peptidylarginine deiminase 4: A nuclear button triggering neutrophil extracellular traps in inflammatory diseases and aging. FASEB J. 2018, 32, 6358–6370. [Google Scholar] [CrossRef]
- Zhang, X.; Bolt, M.; Guertin, M.J.; Chen, W.; Zhang, S.; Cherrington, B.D.; Slade, D.J.; Dreyton, C.J.; Subramanian, V.; Bicker, K.L.; et al. Peptidylarginine deiminase 2-catalyzed histone H3 arginine 26 citrullination facilitates estrogen receptor α target gene activation. Proc. Natl. Acad. Sci. USA 2012, 109, 13331–13336. [Google Scholar] [CrossRef] [Green Version]
- Tan, L.; Ke, Z.; Tombline, G.; Macoretta, N.; Hayes, K.; Tian, X.; Lv, R.; Ablaeva, J.; Gibert, M.; Bhanu, N.V.; et al. Naked Mole Rat Cells Have a Stable Epigenome that Resists iPSC Reprogramming. Stem Cell Rep. 2017, 9, 1721–1734. [Google Scholar] [CrossRef] [PubMed] [Green Version]
- Théry, C.; Witwer, K.W.; Aikawa, E.; Alcaraz, M.J.; Anderson, J.D.; Andriantsitohaina, R.; Antoniou, A.; Arab, T.; Archer, F.; Atkin-Smith, G.K.; et al. Minimal information for studies of extracellular vesicles 2018 (MISEV2018): A position statement of the International Society for Extracellular Vesicles and update of the MISEV2014 guidelines. J. Extracell. Vesicles 2018, 7, 1535750. [Google Scholar] [CrossRef] [PubMed] [Green Version]
- Nicholas, A.P.; Whitaker, J.N. Preparation of a monoclonal antibody to citrullinated epitopes: Its characterization and some applications to immunohistochemistry in human brain. Glia 2002, 37, 328–336. [Google Scholar] [CrossRef] [PubMed]
- Schneider, C.A.; Rasband, W.S.; Eliceiri, K.W. NIH Image to ImageJ: 25 years of image analysis. Nat. Methods 2012, 9, 671–675. [Google Scholar] [CrossRef]


| Protein ID | Protein Name | Protein ID | Protein Name |
|---|---|---|---|
| PROTEIN HITS SHARED BETWEEN NORMOXIA AND HYPOXIA EV PROTEOMES: | |||
| G5AZB7 | Apolipoprotein B-100 | G5AUT5 | Ficolin-3 |
| G5C0N5 | Complement C3 | G5B491 | Alpha-1-antichymotrypsin |
| G5BPM1 | Alpha-2-macroglobulin | G5B5P1 | Alpha-fetoprotein |
| G5B5P2 | Serum albumin (fragment) | G5C4R4 | Complement component C7 |
| G5C3H6 | Complement C4-A | G5BNV2 | Plasma kallikrein |
| G5BQA9 | Serotransferrin | G5BM72 | Coagulation factor XIII B chain |
| G5BM71 | Complement factor H (fragment) | G5BXY1 | Hemoglobin subunit alpha |
| G5AXS5 | Complement C5 | G5BHR4 | Fibronectin |
| G5BC53 | Plasminogen | G5BJ39 | Keratin, type II cytoskeletal 8 |
| G5BUN4 | Inter-alpha-trypsin inhibitor heavy chain H4 | G5AZM7 | Alpha-amylase |
| G5AXS0 | Gelsolin | G5AQM1 | Complement factor I |
| G5BT86 | Kininogen-1 | G5BJ37 | Keratin, type II cytoskeletal 79 |
| G5ALS1 | Keratin, type II cytoskeletal 6B | G5C4H7 | Mannose-binding protein A |
| G5BSL1 | Ceruloplasmin | G5AXV0 | Catalase |
| G5BE53 | Vitamin D-binding protein | G5BI78 | Actin, cytoplasmic 1 |
| G5BQB0 | Inhibitor of carbonic anhydrase | G5BYJ8 | Hemoglobin subunit beta |
| G5B0M6 | Keratin, type I cytoskeletal 14 | G5AV68 | Vitamin K-dependent protein S |
| G5CBM7 | Apolipoprotein E | G5BT83 | Adiponectin |
| G5ALS3 | Keratin, type II cytoskeletal 5 | G5CAS5 | Complement C1s subcomponent |
| G5C3H1 | Complement factor B (fragment) | G5BYX0 | Peroxiredoxin-2 isoform a |
| G5BQH5 | Apolipoprotein A-I | G5ATW7 | Carbonic anhydrase 2 |
| G5BUN3 | Inter-alpha-trypsin inhibitor heavy chain H3 | G5CAP7 | Glyceraldehyde-3-phosphate dehydrogenase |
| G5BQI5 | Angiotensinogen | G5C3E9 | Apolipoprotein M |
| G5BT87 | Histidine-rich glycoprotein | G5ATW9 | Carbonic anhydrase 1 |
| G5BUN2 | Inter-alpha-trypsin inhibitor heavy chain H1 | G5BKR5 | Thyroxine-binding globulin |
| G5ARS6 | Antithrombin-III (fragment) | G5BJV7 | Adipocyte plasma membrane-associated protein |
| G5B0M4 | Keratin, type I cytoskeletal 17 | G5BAT4 | Desmoplakin |
| G5BQH3 | Apolipoprotein A-IV | G5AYL7 | Sulfhydryl oxidase |
| G5BBR0 | Hemopexin | G5BHZ8 | Complement C1q subcomponent subunit A |
| G5BML3 | Fibrinogen beta chain | G5BIZ5 | Anion exchange protein |
| G5AXV8 | Inter-alpha-trypsin inhibitor heavy chain H2 | G5C521 | Mannan-binding lectin serine protease 2 |
| G5ATC4 | Prothrombin | G5AN09 | Zinc-alpha-2-glycoprotein |
| G5BGY7 | Beta-2-glycoprotein 1 | G5BZF5 | Hepatocyte growth factor activator |
| G5BML2 | Fibrinogen alpha chain (fragment) | G5CBM5 | Apolipoprotein C-I |
| G5CB46 | Coagulation factor V | G5BNG0 | Platelet-activating factor acetylhydrolase |
| G5BP10 | C4b-binding protein (fragment) | G5BY64 | Insulin-like growth factor-binding protein complex acid labile chain |
| G5BT89 | Alpha-2-HS-glycoprotein | G5BHZ6 | Complement C1q subcomponent subunit B |
| G5BT88 | Fetuin-B | G5AVW1 | Coagulation factor X |
| G5BLJ5 | Plasma protease C1 inhibitor | G5BHZ7 | Complement C1q subcomponent subunit C |
| G5BVN8 | Vitronectin | G5CA61 | Four and a half LIM domains protein 1 |
| G5BML1 | Fibrinogen gamma chain | G5ANE0 | Complement component C9 |
| G5BS33 | Hemoglobin subunit beta | G5BWM1 | Pentaxin |
| G5B7K8 | Alpha-1B-glycoprotein | G5BHB1 | Pyruvate kinase |
| G5B1Y4 | Protein AMBP | G5BTJ5 | Cysteine-rich secretory protein 3 |
| G5B496 | Alpha-1-antiproteinase S | G5BKU0 | Creatine kinase M-type |
| G5BCV1 | Alpha-2-antiplasmin | G5BX50 | Putative carboxypeptidase PM20D1 |
| G5B7P8 | Phospholipid transfer protein | G5B183 | Putative hexokinase HKDC1 |
| G5BBS9 | Annexin | G5B8W4 | 40S ribosomal protein S27a |
| G5BLD9 | Myelin proteolipid protein | G5C5Z0 | Serine/threonine-protein kinase 11 |
| G5C9Y4 | E3 ubiquitin-protein ligase HUWE1 | G5BMW1 | Transmembrane protein 127 |
| G5C1U0 | Protein FAM184A | G5B165 | Multidrug resistance-associated protein 4 |
| G5BQ09 | Coagulation factor XII | G5BL81 | ATP synthase subunit alpha |
| G5AU87 | General transcription factor IIE subunit 1 | G5AW28 | ATP-binding cassette sub-family D member 3 |
| G5AS67 | Arf-GAP with Rho-GAP domain, ANK repeat and PH domain-containing protein 1 | G5BZJ1 | Fer3-like protein |
| G5BB67 | ATP synthase subunit beta | G5B253 | Ventricular zone-expressed PH domain-containing protein-like protein 1 |
| G5AVU8 | Growth arrest-specific protein 6 | G5BR57 | Leucine-rich repeat flightless-interacting protein 2 |
| PROTEIN HITS IDENTIFIED IN NORMOXIA PLASMA EVS ONLY: | |||
| G5BKL3 | Histone H4 | ||
| G5B3P5 | Keratin, type II cytoskeletal 75 | G5AKU3 | Ataxin-2 |
| G5CAA1 | Aminopeptidase | G5C4Z8 | Vacuolar protein sorting-associated protein 13D |
| G5BM62 | Thrombospondin-1 | G5C6Q5 | Thyroglobulin |
| G5AKA3 | L-lactate dehydrogenase | G5C307 | Transthyretin |
| G5BL96 | Keratin, type II cytoskeletal 7 | G5BAK9 | Fatty acid-binding protein, epidermal |
| G5B1Y7 | Alpha-1-acid glycoprotein 1 (fragment) | G5C1Y6 | Protein FAM161A |
| G5B3Z0 | Xanthine dehydrogenase/oxidase | G5ANL3 | Serum paraoxonase/arylesterase 1 |
| G5C682 | Phosphatidylcholine-sterol acyltransferase | G5C8M3 | Malate dehydrogenase |
| G5AU84 | Beta-actin-like protein 2 | G5C311 | Desmoglein-1 |
| E3VX78 | Transferrin receptor protein 1 | G5B899 | Cytosolic phospholipase A2 gamma (fragment) |
| G5BTD5 | Mannan-binding lectin serine protease 1 | G5CB14 | Ribonucleoside-diphosphate reductase subunit M2 |
| G5AXJ7 | Protein Z-dependent protease inhibitor | G5C3J5 | Aquaporin-1 isoform 1 |
| G5CAS6 | Complement C1r subcomponent | G5BJ09 | Glial fibrillary acidic protein |
| G5BDQ8 | Vascular non-inflammatory molecule 3 (fragment) | G5C4R3 | Complement component C6 |
| G5BSJ5 | Lumican | G5BUL8 | Dynein heavy chain 1, axonemal |
| G5ALX2 | Catenin beta-1 | G5C8Z7 | Midasin |
| G5C0E1 | Nesprin-1 | G5BDF7 | Secretory carrier-associated membrane protein |
| G5ALE6 | Leucine-rich repeat-containing protein 15 | G5BUP0 | Transketolase |
| G5CAR5 | Triosephosphate isomerase | G5BLQ4 | Oxysterol-binding protein |
| G5BRD7 | Sarcoplasmic/endoplasmic reticulum calcium ATPase 1 | G5B5A1 | Disks large homolog 4 isoform 1 |
| G5C9X6 | Flavin reductase (fragment) | ||
| G5B6P6 | Coiled-coil domain-containing protein 88B | G5C4J5 | Crossover junction endonuclease EME1 |
| G5BIX4 | E3 ubiquitin-protein ligase topors | G5AZ29 | Inversin |
| G5BJ98 | Coiled-coil domain-containing protein 57 | ||
| G5AQB5 | PTB domain-containing engulfment adapter protein 1 | G5AKJ8 | Tubulin alpha chain |
| G5C1E5 | Carboxypeptidase B2 | G5BP51 | Eukaryotic translation initiation factor 4E type 1B |
| PROTEIN HITS IDENTIFIED IN HYPOXIA PLASMA EVS ONLY: | |||
| G5ALS8 | Keratin, type II cytoskeletal 1 (fragment) | G5AQW0 | Envoplakin |
| G5B0N0 | Keratin, type I cytoskeletal 13 | G5BSI2 | FYVE, RhoGEF, and PH domain-containing protein 4 |
| G5ATW7 | Carbonic anhydrase 2 (fragment) | G5AKF7 | Transforming acidic coiled-coil-containing protein 2 |
| G5ALS4 | Keratin, type II cytoskeletal 71 | G5AZ97 | Triple functional domain protein |
| G5BV28 | Histone H3 | G5C0I8 | Sarcalumenin |
| G5AX68 | Keratin, type I cytoskeletal 27 | G5B7I2 | Pre-mRNA-splicing factor SYF1 |
| G5BSE8 | Histone H2A | G5C2U0 | Piezo-type mechanosensitive ion channel component |
| G5BH20 | Histone H2B | G5BAY8 | Lysine-specific demethylase 5C |
| G5B251 | Heat shock cognate 71 kDa protein | G5APP5 | Complement component C8 beta chain |
| G5AV43 | Biliverdin reductase A | G5AVH0 | Transient receptor potential cation channel subfamily M member 3 |
| G5AU24 | Tubulin alpha-1C chain | G5BUY9 | Skin-specific protein 32 |
| G5ALK7 | Elongation factor 1-alpha | G5BJ90 | Leucine-rich repeat-containing protein 45 |
| G5B5C8 | Eukaryotic initiation factor 4A-I | G5BF75 | Disks large-associated protein 5 |
| G5AMU8 | Histone-lysine N-methyltransferase | G5BAS8 | Coagulation factor XIII A chain (fragment) |
| G5BEK1 | 14-3-3 protein theta | G5BPP6 | Aconitate hydratase, mitochondrial |
| G5BSY3 | Zinc finger C3H1 domain-containing protein | G5BHM2 | Coatomer subunit delta |
| G5B0M0 | Junction plakoglobin | G5B9Y3 | Stress-70 protein, mitochondrial |
| G5BN83 | MAGUK p55 subfamily member 3 | G5BZV1 | Inosine-5’-monophosphate dehydrogenase |
| G5BUZ5 | Uncharacterized protein | G5C0H1 | E3 ubiquitin-protein ligase UBR5 (fragment) |
| G5B8I9 | Ficolin-1 | G5AMK2 | Transmembrane protein 176B |
| G5BRJ4 | Induced myeloid leukemia cell differentiation protein Mcl-1-like protein |
| A. KEGG Pathways | Normoxia (Observed Gene Count) | Hypoxia (Observed Gene Count) |
|---|---|---|
| Complement and coagulation cascades | V (31) | V (28) |
| Staphylococcus aureus infection | V (17) | V (16) |
| Cholesterol metabolism | V (7) | V (6) |
| Pertussis | V (8) | V (7) |
| Vitamin digestion and absorption | V (3) | V (3) |
| Systemic lupus erythematosus | V (12) | V (12) |
| African trypanosomiasis | V (4) | V (4) |
| Arrhythmogenic right ventricular cardiomyopathy | V (4) | V (4) |
| Chagas disease | V (5) | V (5) |
| Prion disease | V (10) | V (10) |
| Proteoglycan in cancer | V (6) | |
| Proximal tubule bicarbonate reclamation | V (4) | |
| Ferroptosis | V (4) | |
| Glycolysis/gluconeogenesis | V (4) | |
| HIF-1 signalling pathway | V (6) | |
| Thyroid hormone synthesis | V (4) | |
| Phagosome | V (7) | |
| Carbon metabolism | V (6) | |
| B. STRING pathways | Normoxia (Observed Gene Count) | Hyopxia (Observed Gene Count) |
| Complement and coagulation cascades, and serine-type endopeptidase inhibitor activity | V (46) | V (43) |
| Complement and coagulation cascades, and serpin (serine protease inhibitor) | V (21) | V (19) |
| Complement and coagulation cascades, and inter-alpha-trypsin inhibitor heavy chain, C-terminal | V (19) | V (17) |
| Complement activation, alternative pathway, and factor i/membrane attack complex | V (3) | V (3) |
| Complement activation | V (18) | V (17) |
| Complement activation, lectin pathway | V (4) | V (3) |
| Membrane attack complex | V (4) | V (4) |
| Synapse pruning, and complement c1r subcomponent | V (5) | V (4) |
| Mixed, incl. fibrinolysis and inter-alpha-trypsin inhibitor heavy chain, C-terminal | V (13) | V (11) |
| Mixed, incl. fibrinogen alpha/beta chain family and inter-alpha-trypsin inhibitor heavy chain, C-terminal | V (13) | V (10) |
| Mixed, incl. fibrinogen alpha/beta chain family and protein AMBP | V (6) | V (6) |
| Mixed, incl. transferrin and hemopexin | V (7) | V (7) |
| Mixed, incl. hemopexin and haptoglobin | V (3) | V (4) |
| Mixed, incl. cholesterol metabolism and regulation of lipoprotein lipase activity | V (7) | V (7) |
| Cholesterol metabolism and regulation of lipoprotein lipase activity | V (6) | V (6) |
| Cholesterol efflux and triglyceride transport | V (5) | V (5) |
| Intermediate filament protein, conserved site | V (4) | V (5) |
| Carbonic anhydrase, alpha-class, conserved site, and glycophorin A | V (3) | V (3) |
| Intermediate filament protein | V (5) | V (8) |
| High-density lipoprotein particle | V (3) | V (3) |
| Carbon metabolism and phosphoglycerate mutase family | V (6) | |
| Intermediate filament and apical plasma membrane urothelial plaque | V (6) | |
| Pentose phosphate pathway and glycolytic process | V (4) | |
| Mixed, incl. apple domain and antithrombin-iii | V (3) | |
| Mixed, incl. HMW kininogen and mitochondrial glycoprotein | V (3) | |
| Keratin type II head and keratin type I | V (3) | |
| Mixed, incl. blood coagulation, fibrin clot formation, and alpha2-antiplasmin | V (3) | |
| Intermediate filament protein, conserved site, and keratinocyte activation | V (6) |
| Protein ID | Protein Name | Normoxia | Hypoxia |
|---|---|---|---|
| G5B5P2 | Serum albumin | V | V |
| G5BT87 | Histidine-rich glycoprotein | V | V |
| G5ALS3 | Keratin, type II cytoskeletal | V | V |
| G5ALS1 | Keratin, type II cytoskeletal 6B | V | V |
| G5B3Q0 | Keratin, type II cuticular Hb5 | V | V |
| G5BPM1 | Alpha-2-macroglobulin | V | V |
| G5BT86 | Kininogen-1 | V | V |
| G5BS33 | Hemoglobin subunit beta | V | V |
| G5BQA9 | Serotransferrin | V | V |
| G5B0M6 | Keratin, type I cytoskeletal 14 | V | V |
| G5BXY1 | Hemoglobin subunit alpha | V | V |
| G5BJ37 | Keratin, type II cytoskeletal 79 | V | V |
| G5BAT4 | Desmoplakin | V | V |
| G5C776 | Arginase | V | V |
| G5B0M4 | Keratin, type I cytoskeletal 17 | V | V |
| G5BJ39 | Keratin, type II cytoskeletal 8 | V | V |
| G5BYJ8 | Hemoglobin subunit beta | V | V |
| G5BUN4 | Inter-alpha-trypsin inhibitor heavy chain H4 | V | V |
| G5C0N5 | Complement C3 | V | V |
| G5BSE8 | Histone H2A | V | V |
| G5BV28 | Histone H3 | V | V |
| G5C3H6 | Complement C4-A | V | V |
| G5BRJ4 | Induced myeloid leukemia cell differentiation protein Mcl-1-like protein | V | V |
| G5C311 | Desmoglein-1 | V | V |
| G5ARW1 | Peroxiredoxin-1 | V | V |
| G5AWC0 | Annexin | V | V |
| G5AXH0 | Actin, gamma-enteric smooth muscle | V | V |
| G5BFU9 | N6-adenosine-methyltransferase 70 kDa subunit | V | V |
| G5BG61 | SRRM2-like protein | V | V |
| G5B0N6 | Keratin, type I cuticular Ha3-I | V | |
| G5B0N5 | Keratin, type I cuticular Ha4 | V | |
| G5B3P5 | Keratin, type II cytoskeletal 75 | V | |
| G5AX68 | Keratin, type I cytoskeletal 27 | V | |
| G5B0N2 | Keratin, type I cuticular Ha5 | V | |
| G5ALS4 | Keratin, type II cytoskeletal 71 | V | |
| G5B3P8 | Keratin, type II cuticular Hb4 | V | |
| G5BL99 | Keratin, type II cuticular Hb6 | V | |
| G5BJ40 | Keratin, type I cytoskeletal 18 | V | |
| G5AX70 | Keratin, type I cytoskeletal 25 | V | |
| G5AYD5 | Dedicator of cytokinesis protein 10 | V | |
| G5BQ09 | Coagulation factor XII | V | |
| G5AYL5 | Integrator complex subunit 7 | V | |
| G5B319 | Janus kinase and microtubule-interacting protein 1 | V | |
| G5B3A4 | Plakophilin-1 | V | |
| G5BV47 | Histone H3.3 | V | |
| G5BI06 | Basement membrane-specific heparan sulfate proteoglycan core protein | V | |
| G5BUY9 | Skin-specific protein 32 | V | |
| G5C656 | Puratrophin-1 | V | |
| G5APA7 | Selenoprotein P | V | |
| G5BH20 | Histone H2B | V | |
| G5BKL1 | Histone H2B | V | |
| G5ALS8 | Keratin, type II cytoskeletal 1 (fragment) | V | |
| G5ALS9 | Keratin, type II cytoskeletal 1b (fragment) | V | |
| G5B0M0 | Junction plakoglobin | V | |
| G5CAP7 | Glyceraldehyde-3-phosphate dehydrogenase (fragment) | V | |
| G5C5U7 | Plectin-1 | V | |
| G5BYG4 | Apoptosis facilitator Bcl-2-like protein 14 | V | |
| G5BNM3 | Multidrug resistance-associated protein 7 | V | |
| G5BAK9 | Fatty acid-binding protein, epidermal | V | |
| G5BX43 | Serine/threonine-protein kinase PCTAIRE-3 | V | |
| G5C312 | Desmocollin-1 (fragment) | V | |
| G5AQ00 | Tubulin alpha-1C chain | V | |
| G5AUQ5 | Serine/threonine-protein kinase PDIK1L | V | |
| G5BYF7 | Putative G-protein coupled receptor 19 | V | |
| G5B253 | Ventricular zone-expressed PH domain-containing protein-like protein 1 | V |
| A. KEGG Pathways F95-Enriched EV Cargo | Normoxia (Observed Gene Count) | Hypoxia (Observed Gene Count) |
|---|---|---|
| Complement and coagulation cascades | V (5) | V (4) |
| Staphylococcus aureus infection | V (8) | V (4) |
| African trypanosomiasis | V (3) | V (3) |
| Systemic lupus erythematosus | V (4) | V (4) |
| Oestrogen signalling pathway | V (5) | NA |
| B. STRING Pathways F95-Enriched EV cargo | Normoxia (Observed Gene Count) | Hypoxia (Observed Gene Count) |
| Intermediate filament and apical plasma membrane urothelial plaque | V (13) | |
| Intermediate filament protein, conserved site, and keratinocyte activation | V (7) | |
| Keratin, type I cytoskeletal 18 and keratin, type II head | V (2) | |
| Keratin, type I and structural constituent of skin epidermis | V (2) | |
| Intermediate filament protein, conserved site | V (4) | V (5) |
| Intermediate filament protein | V (12) | V (6) |
| Keratin, type II head and keratin, type I | V (2) | V (4) |
| Complement and coagulation cascades, and serine-type endopeptidase inhibitor activity | V (6) | V (6) |
| Complement and coagulation cascades, and inter-alpha-trypsin inhibitor heavy chain, C-terminal | V (4) | V (3) |
| Mixed, incl. hmw kininogen and mitochondrial glycoprotein | V (3) | V (2) |
| Haemoglobin complex | V (2) | V (2) |
| Desmosome | V (3) | V (2) |
| Desmosome and cell–cell adhesion mediated by cadherin | V (3) |
| STRING NETWORKS IN NORMOXIA AND HYPOXIA BRAINS (All F95 Hits) | NORMOXIA (Observed Gene Count) | HYPOXIA (Observed Gene Count) |
|---|---|---|
| Carbon metabolism and pyruvate | V (37) | V (43) |
| Carbon metabolism and phosphoglycerate mutase family | V (33) | V (39) |
| Mixed, incl. oxidative phosphorylation and apoptosis-multiple species | V (32) | V (33) |
| Citrate cycle (TCA cycle), lactate/malate dehydrogenase, NAD-binding domain | V (18) | V (22) |
| Citrate cycle (TCA cycle) and cysteine and methionine metabolism | V (19) | V (25) |
| Oxidative phosphorylation and cytochrome c oxidase subunit VIa | V (24) | V (31) |
| Mixed, incl. oxidative phosphorylation and uncharacterised protein family (upf0240) | V (26) | V (33) |
| Ubiquinone and oxidative phosphorylation | V (17) | V (22) |
| Citrate cycle (TCA cycle) | V (14) | V (11) |
| Oxidative phosphorylation and cytochrome c oxidase subunit VIIc | V (18) | V (24) |
| Pentose phosphate pathway and phosphoglycerate mutase family | V (14) | V (14) |
| Ubiquinone and MNLL subunit | V (12) | V (16) |
| Ubiquinone | V (11) | V (15) |
| Mixed, incl. spectrin repeat and immunoglobulin i-set | V (12) | V (13) |
| Glycolysis/gluconeogenesis and 6-phosphofructo-2-kinase | V (11) | V (11) |
| Mixed, incl. spectrin repeat and ankyrin, UPA domain | V (11) | V (11) |
| Collecting duct acid secretion and V-ATPase subunit H | V (7) | V (8) |
| Mixed, incl. atp1g1/plm/mat8 family, and endocrine and other factor-regulated calcium reabsorption | V (10) | V (11) |
| Ribosome | V (14) | V (15) |
| GroEL-like equatorial domain superfamily | V (7) | |
| Proteasome | V (14) | |
| Ribosome and ribosomal protein L23 | V (25) | |
| Ubiquinone and zinc-finger domain | V (9) | |
| Mixed, incl. regulation of actin cytoskeleton and actin | V (16) | |
| Septin | V (7) |
| KEGG PATHWAYS IN NORMOXIA AND HYPOXIA BRAINS (All F95 Hits) | NORMOXIA (Observed Gene Count) | HYPOXIA (Observed Gene Count) |
|---|---|---|
| Metabolic pathways | V (115) | V (152) |
| Carbon metabolism | V (39) | V (47) |
| Prion disease | V (51) | V (71) |
| Parkinson’s disease | V (47) | V (65) |
| Huntington’s disease | V (48) | V (67) |
| Alzheimer’s disease | V (51) | V (72) |
| Oxidative phosphorylation | V (31) | V (39) |
| Amyotrophic lateral sclerosis | V (47) | V (64) |
| Synaptic vesicle cycle | V (22) | V (22) |
| Citrate cycle (TCA cycle) | V (17) | V (21) |
| Endocrine and other factor-regulated calcium reabsorption | V (18) | V (22) |
| Glycolysis/gluconeogenesis | V (19) | V (20) |
| Biosynthesis of amino acids | V (17) | V (20) |
| Retrograde endocannabinoid signalling | V (21) | V (30) |
| Thermogenesis | V (25) | V (33) |
| Endocytosis | V (26) | V (29) |
| Pyruvate metabolism | V (13) | V (14) |
| Non-alcoholic fatty liver disease | V (21) | V (26) |
| cGMP-PKG signalling pathway | V (21) | V (28) |
| Bacterial invasion of epithelial cells | V (15) | V (15) |
| Cardiac muscle contraction | V (15) | V (15) |
| HIF-1 signalling pathway | V (17) | V (19) |
| Glutamatergic synapse | V (17) | V (22) |
| Adrenergic signalling in cardiomyocytes | V (18) | V (21) |
| Spinocerebellar ataxia | V (18) | V (29) |
| Phagosome | V (17) | V (19) |
| Proximal tubule bicarbonate reclamation | V (8) | V (9) |
| Mineral absorption | V (11) | V (12) |
| Pancreatic secretion | V (14) | V (19) |
| Propanoate metabolism | V (9) | V (12) |
| Ribosome | V (16) | V (21) |
| Central carbon metabolism in cancer | V (11) | V (15) |
| Pentose phosphate pathway | V (8) | V (8) |
| Regulation of actin cytoskeleton | V (18) | V (19) |
| GABAergic synapse | V (12) | V (14) |
| Fc gamma R-mediated phagocytosis | V (12) | V (11) |
| Salivary secretion | V (11) | V (17) |
| Glyoxylate and dicarboxylate metabolism | V (8) | V (12) |
| Calcium signalling pathway | V (17) | V (26) |
| Cysteine and methionine metabolism | V (9) | V (10) |
| Thyroid hormone signalling pathway | V (13) | V (17) |
| Collecting duct acid secretion | V (7) | V (8) |
| cAMP signalling pathway | V (17) | V (20) |
| Adherens junction | V (10) | V (10) |
| 2-Oxocarboxylic acid metabolism | V (6) | V (9) |
| Dopaminergic synapse | V (13) | V (21) |
| Gastric acid secretion | V (10) | V (14) |
| Aldosterone synthesis and secretion | V (11) | V (16) |
| Starch and sucrose metabolism | V (7) | V (8) |
| Focal adhesion | V (16) | V (18) |
| Long-term depression | V (9) | V (15) |
| Axon guidance | V (15) | V (14) |
| Leukocyte transendothelial migration | V (12) | V (13) |
| Arginine biosynthesis | V (6) | V (6) |
| Aldosterone-regulated sodium reabsorption | V (7) | V (7) |
| Alanine, aspartate, and glutamate metabolism | V (7) | V (7) |
| Insulin secretion | V (10) | V (13) |
| Valine, leucine, and isoleucine degradation | V (8) | V (13) |
| Butanoate metabolism | V (6) | V (6) |
| Circadian entrainment | V (10) | V (15) |
| Thyroid hormone synthesis | V (9) | V (13) |
| Necroptosis | V (12) | V (13) |
| Long-term potentiation | V (8) | V (14) |
| Glucagon signalling pathway | V (10) | V (17) |
| Salmonella infection | V (15) | V (23) |
| Spliceosome | V (11) | V (14) |
| Gap junction | V (9) | V (16) |
| Morphine addiction | V (9) | V (12) |
| Inositol phosphate metabolism | V (8) | V (7) |
| Oocyte meiosis | V (10) | V (17) |
| Tight junction | V (12) | V (15) |
| Phosphatidylinositol signalling system | V (9) | V (11) |
| VEGF signalling pathway | V (7) | V (7) |
| Arrhythmogenic right ventricular cardiomyopathy | V (8) | V (8) |
| Aminoacyl-tRNA biosynthesis | V (6) | V (9) |
| Tryptophan metabolism | V (6) | V (9) |
| Lysine degradation | V (7) | V (10) |
| Rap1 signalling pathway | V (13) | V (16) |
| Yersinia infection | V (10) | V (13) |
| Viral carcinogenesis | V (12) | V (17) |
| Proteasome | V (6) | V (14) |
| Arginine and proline metabolism | V (6) | V (9) |
| Fructose and mannose metabolism | V (5) | V (6) |
| Protein processing in endoplasmic reticulum | V (11) | V (16) |
| Human immunodeficiency virus 1 infection | V (12) | V (16) |
| Glutathione metabolism | V (6) | V (9) |
| Proteoglycans in cancer | V (12) | V (17) |
| Oxytocin signalling pathway | V (10) | V (18) |
| African trypanosomiasis | V (5) | V (7) |
| Synthesis and degradation of ketone bodies | V (3) | V (3) |
| Carbohydrate digestion and absorption | V (5) | V (7) |
| Serotonergic synapse | V (8) | V (15) |
| Hippo signalling pathway | V (10) | V (14) |
| Cholinergic synapse | V (8) | V (14) |
| Ferroptosis | V (5) | V (6) |
| Vasopressin-regulated water reabsorption | V (5) | V (10) |
| Amphetamine addiction | V (6) | V (9) |
| Rheumatoid arthritis | V (7) | V (8) |
| Cell adhesion molecules | V (9) | V (11) |
| Galactose metabolism | V (4) | V (5) |
| Legionellosis | V (6) | V (8) |
| Tuberculosis | V (10) | V (13) |
| Sphingolipid signalling pathway | V (8) | V (11) |
| Beta-alanine metabolism | V (4) | V (6) |
| Phospholipase D signalling pathway | V (9) | V (11) |
| Melanogenesis | V (7) | V (11) |
| Human cytomegalovirus infection | V (11) | V (16) |
| D-Glutamine and D-glutamate metabolism | V (2) | V (2) |
| Antigen processing and presentation | V (5) | V (7) |
| Pathways in cancer | V (20) | V (27) |
| Hepatitis C | V (9) | V (16) |
| Human papillomavirus infection | V (14) | V (18) |
| Ras signalling pathway | V (11) | V (14) |
| RNA transport | V (9) | V (13) |
| Phenylalanine, tyrosine, and tryptophan biosynthesis | V (2) | |
| Nitrogen metabolism | V (3) | |
| Mineral absorption | V (12) | |
| Estrogen signalling pathway | V (16) | |
| Renin secretion | V (9) | |
| Platelet activation | V (12) | |
| Bile secretion | V (10) | |
| Apelin signalling pathway | V (12) | |
| Fatty acid degradation | V (6) | |
| Vascular smooth muscle contraction | V (11) | |
| Amino sugar and nucleotide sugar metabolism | V (6) | |
| GnRH signalling pathway | V (9) | |
| mRNA surveillance pathway | V (9) | |
| MAPK signalling pathway | V (18) | |
| Human T-cell leukemia virus 1 infection | V (15) | |
| Chemokine signalling pathway | V (13) | |
| GnRH secretion | V (7) | |
| Inflammatory mediator regulation of TRP channels | V (9) | |
| Parathyroid hormone synthesis, secretion, and action | V (9) | |
| Cellular senescence | V (11) | |
| Renal cell carcinoma | V (7) | |
| Apoptosis | V (11) | |
| Alcoholism | V (11) | |
| Insulin signaling pathway | V (10) | |
| Histidine metabolism | V (4) | |
| Cushing syndrome | V (11) | |
| Growth hormone synthesis, secretion, and action | V (9) | |
| Purine metabolism | V (10) | |
| Fatty acid metabolism | V (6) | |
| Hepatitis B | V (11) |
| KEGG Pathways for F95-Specific Hits Identified in Hypoxia Brains Only | Observed Gene Count | KEGG Pathways for F95-Specific Hits Identified in Hypoxia Brains Only | Observed Gene Count |
|---|---|---|---|
| Metabolic pathways | 36 | Renin secretion | 5 |
| Gap junction | 9 | Endocytosis | 9 |
| Long-term depression | 8 | Focal adhesion | 8 |
| Ribosome | 10 | Amyotrophic lateral sclerosis | 11 |
| Prion disease | 13 | Aminoacyl-tRNA biosynthesis | 4 |
| Oestrogen signalling pathway | 9 | Vasopressin-regulated water reabsorption | 4 |
| Huntington’s disease | 13 | Growth hormone synthesis, secretion, and action | 6 |
| Salmonella infection | 11 | Insulin secretion | 5 |
| Parkinson’s disease | 11 | Yersinia infection | 6 |
| Dopaminergic synapse | 8 | GnRH signaling pathway | 5 |
| Valine, leucine, and isoleucine degradation | 5 | Spliceosome | 6 |
| Retrograde endocannabinoid signalling | 8 | Melanogenesis | 5 |
| Serotonergic synapse | 7 | Choline metabolism in cancer * | 5 |
| Oxytocin signalling pathway | 8 | Beta-alanine metabolism | 3 |
| Carbon metabolism | 7 | Glucagon signalling pathway | 5 |
| Glyoxylate and dicarboxylate metabolism | 4 | Long-term potentiation | 4 |
| Protein processing in endoplasmic reticulum | 8 | Parathyroid hormone synthesis, secretion, and action | 5 |
| Platelet activation | 7 | Non-alcoholic fatty liver disease | 6 |
| Salivary secretion | 6 | Rap1 signalling pathway | 7 |
| Alzheimer’s disease | 12 | Amphetamine addiction | 4 |
| Oxidative phosphorylation | 7 | Propanoate metabolism | 3 |
| Circadian entrainment | 6 | Sulphur metabolism * | 2 |
| Vascular smooth muscle contraction | 7 | Glutamatergic synapse | 5 |
| GnRH secretion | 5 | Cholinergic synapse | 5 |
| Prostate cancer * | 6 | Central carbon metabolism in cancer | 4 |
Publisher’s Note: MDPI stays neutral with regard to jurisdictional claims in published maps and institutional affiliations. |
© 2022 by the authors. Licensee MDPI, Basel, Switzerland. This article is an open access article distributed under the terms and conditions of the Creative Commons Attribution (CC BY) license (https://creativecommons.org/licenses/by/4.0/).
Share and Cite
D’Alessio, S.; Cheng, H.; Eaton, L.; Kraev, I.; Pamenter, M.E.; Lange, S. Acute Hypoxia Alters Extracellular Vesicle Signatures and the Brain Citrullinome of Naked Mole-Rats (Heterocephalus glaber). Int. J. Mol. Sci. 2022, 23, 4683. https://doi.org/10.3390/ijms23094683
D’Alessio S, Cheng H, Eaton L, Kraev I, Pamenter ME, Lange S. Acute Hypoxia Alters Extracellular Vesicle Signatures and the Brain Citrullinome of Naked Mole-Rats (Heterocephalus glaber). International Journal of Molecular Sciences. 2022; 23(9):4683. https://doi.org/10.3390/ijms23094683
Chicago/Turabian StyleD’Alessio, Stefania, Hang Cheng, Liam Eaton, Igor Kraev, Matthew E. Pamenter, and Sigrun Lange. 2022. "Acute Hypoxia Alters Extracellular Vesicle Signatures and the Brain Citrullinome of Naked Mole-Rats (Heterocephalus glaber)" International Journal of Molecular Sciences 23, no. 9: 4683. https://doi.org/10.3390/ijms23094683