Article

Characterization of the Skeletal Muscle Proteome in Undernourished Old Rats

1
Human Nutrition Unit, INRAE, Auvergne Human Nutrition Research Center, Clermont Auvergne University, 63000 Clermont-Ferrand, France
2
Animal Products Quality Unit (QuaPA), INRAE, 63122 Clermont-Ferrand, France
3
Metabolomic and Proteomic Exploration Facility, Clermont Auvergne University, INRAE, 63122 Clermont-Ferrand, France
4
Department of Clinical Nutrition, Clermont-Ferrand University Hospital Center, 63000 Clermont-Ferrand, France
*
Author to whom correspondence should be addressed.
Int. J. Mol. Sci. 2022, 23(9), 4762; https://doi.org/10.3390/ijms23094762
Submission received: 16 March 2022 / Revised: 10 April 2022 / Accepted: 15 April 2022 / Published: 26 April 2022
(This article belongs to the Special Issue Highlights in Pathophysiology of the Musculoskeletal System)

Abstract

:
Aging is associated with a progressive loss of skeletal muscle mass and function termed sarcopenia. Various metabolic alterations that occur with aging also increase the risk of undernutrition, which can worsen age-related sarcopenia. However, the impact of undernutrition on aged skeletal muscle remains largely under-researched. To build a deeper understanding of the cellular and molecular mechanisms underlying age-related sarcopenia, we characterized the undernutrition-induced changes in the skeletal muscle proteome in old rats. For this study, 20-month-old male rats were fed 50% or 100% of their spontaneous intake for 12 weeks, and proteomic analysis was performed on both slow- and fast-twitch muscles. Proteomic profiling of undernourished aged skeletal muscle revealed that undernutrition has profound effects on muscle proteome independently of its effect on muscle mass. Undernutrition-induced changes in muscle proteome appear to be muscle-type-specific: slow-twitch muscle showed a broad pattern of differential expression in proteins important for energy metabolism, whereas fast-twitch muscle mainly showed changes in protein turnover between undernourished and control rats. This first proteomic analysis of undernourished aged skeletal muscle provides new molecular-level insight to explain phenotypic changes in undernourished aged muscle. We anticipate this work as a starting point to define new biomarkers associated with undernutrition-induced muscle loss in the elderly.

1. Introduction

Undernutrition is an imbalanced nutritional state resulting from a negative ratio between dietary intake and nutrient needs. This imbalance may be related to inadequate intake of dietary energy and/or protein, an increase in energy expenditure and/or protein loss, or both [1]. Prolonged undernutrition leads to altered cellular metabolism and impaired body composition and function, which worsen disease prognosis [2]. In particular, undernutrition induces a loss of body tissues, especially a loss of skeletal muscle mass, which makes it one of the main risk factors for the onset of sarcopenia. Sarcopenia is defined as an independent disease entity related to a loss of muscle mass, quality, and strength [3,4]. Indeed, preserving skeletal muscle is not only crucial for maintaining mobility, but also for its many roles in metabolism and homeostasis. Low skeletal muscle mass has been shown to adversely affect health outcomes and lead to increased risk for mortality [5].
Aging increases the body’s needs for nutrients, especially protein intake. Older people show higher splanchnic extraction of amino acids [6,7] and lower anabolic response to protein diet [8], whereas various aging-related impairments lead to lower food intake such as poor dentition, physical and mental disabilities, multiple medications, and even social and financial challenges [9]. Undernutrition is therefore common in the elderly where its prevalence varies from 4% to 10% at home and from 15% to 30% in care homes, and even reaches 30% to 70% in hospitals, depending on the diagnostic criteria used [10]. Most of all, aging impairs the ability to adapt to undernutrition, leading to severe loss of body weight and muscle [11,12,13,14]. Old rats show defective adaptation to long-term 50% dietary restriction initiated at an advanced age, resulting in dramatic body weight loss and deregulation of protein metabolism in terms of nitrogen balance and protein content, especially at the skeletal muscle level [12]. Undernutrition in elderly patients consequently exacerbates their state of frailty and dependence, thus greatly increasing the risk for morbidity and mortality [15]. This issue will become increasingly critical given the worldwide pattern of population aging. According to United Nations statistics on demographics and aging, the proportion of persons aged 65 or over in the world is projected to grow from 9% in 2019 to nearly 16% in 2050 [16]. Specific studies are needed to better understand the undernutrition-induced alterations in skeletal muscle in order to identify new therapeutic targets and prevent sarcopenia in the elderly population.
Few studies have investigated the impact of undernutrition on aged skeletal muscle, and the mechanisms responsible for muscle wasting in this context remain unclear. Previous work has highlighted a reduction in protein turnover and mitochondrial oxidative capacities in fast-twitch plantaris muscle [17,18]. Aged undernourished rats show blunted rates of muscle protein synthesis together with increased indexes of muscle proteolysis [18]. Moreover, the energy deficit resulting from undernutrition was associated with a decrease in mitochondrial density and function in plantaris muscle [18,19]. Due to their fiber type composition, skeletal muscles vary in their functional and metabolic properties and in their response to atrophying conditions [20]. However, undernutrition-related muscle alterations have never been investigated in aged slow-twitch muscles.
Nowadays, the progresses in protein separation and analysis techniques as well as in bioinformatics allow for the identification of thousands of proteins in a short time. Since the development of so-called “soft” ionization sources, MALDI and electrospray, mass spectrometry has grown considerably in the field of biology [21]. In this regard, the application of proteomics to study muscle atrophy have provided new insight into the muscle proteome remodeling under various catabolic conditions such as unloading [22], cancer cachexia [23], and aging [24]. However, none of them investigated the muscle proteomic changes associated with undernutrition. Here, we used a shotgun proteomic approach to characterize the cellular and molecular mechanisms responsible for muscle alterations in undernourished old rats. Our proteomic workflow included a fractionation step to improve the detection of low-abundance proteins, and we performed a comparison between the proteome of fast-twitch and slow-twitch muscles to reveal muscle type-specific changes. This proteomic profiling of undernourished aged skeletal muscle revealed that undernutrition has profound effects on muscle proteome, independently of its effect on muscle mass. Undernutrition-induced changes in muscle proteome appear to be muscle-type-specific: slow-twitch muscle showed a broad pattern of differential expression in proteins important for energy metabolism, whereas fast-twitch muscle mainly showed changes in protein turnover between undernourished and control rats. This study ultimately identified new potential muscle biomarkers of undernutrition in the elderly.

2. Results

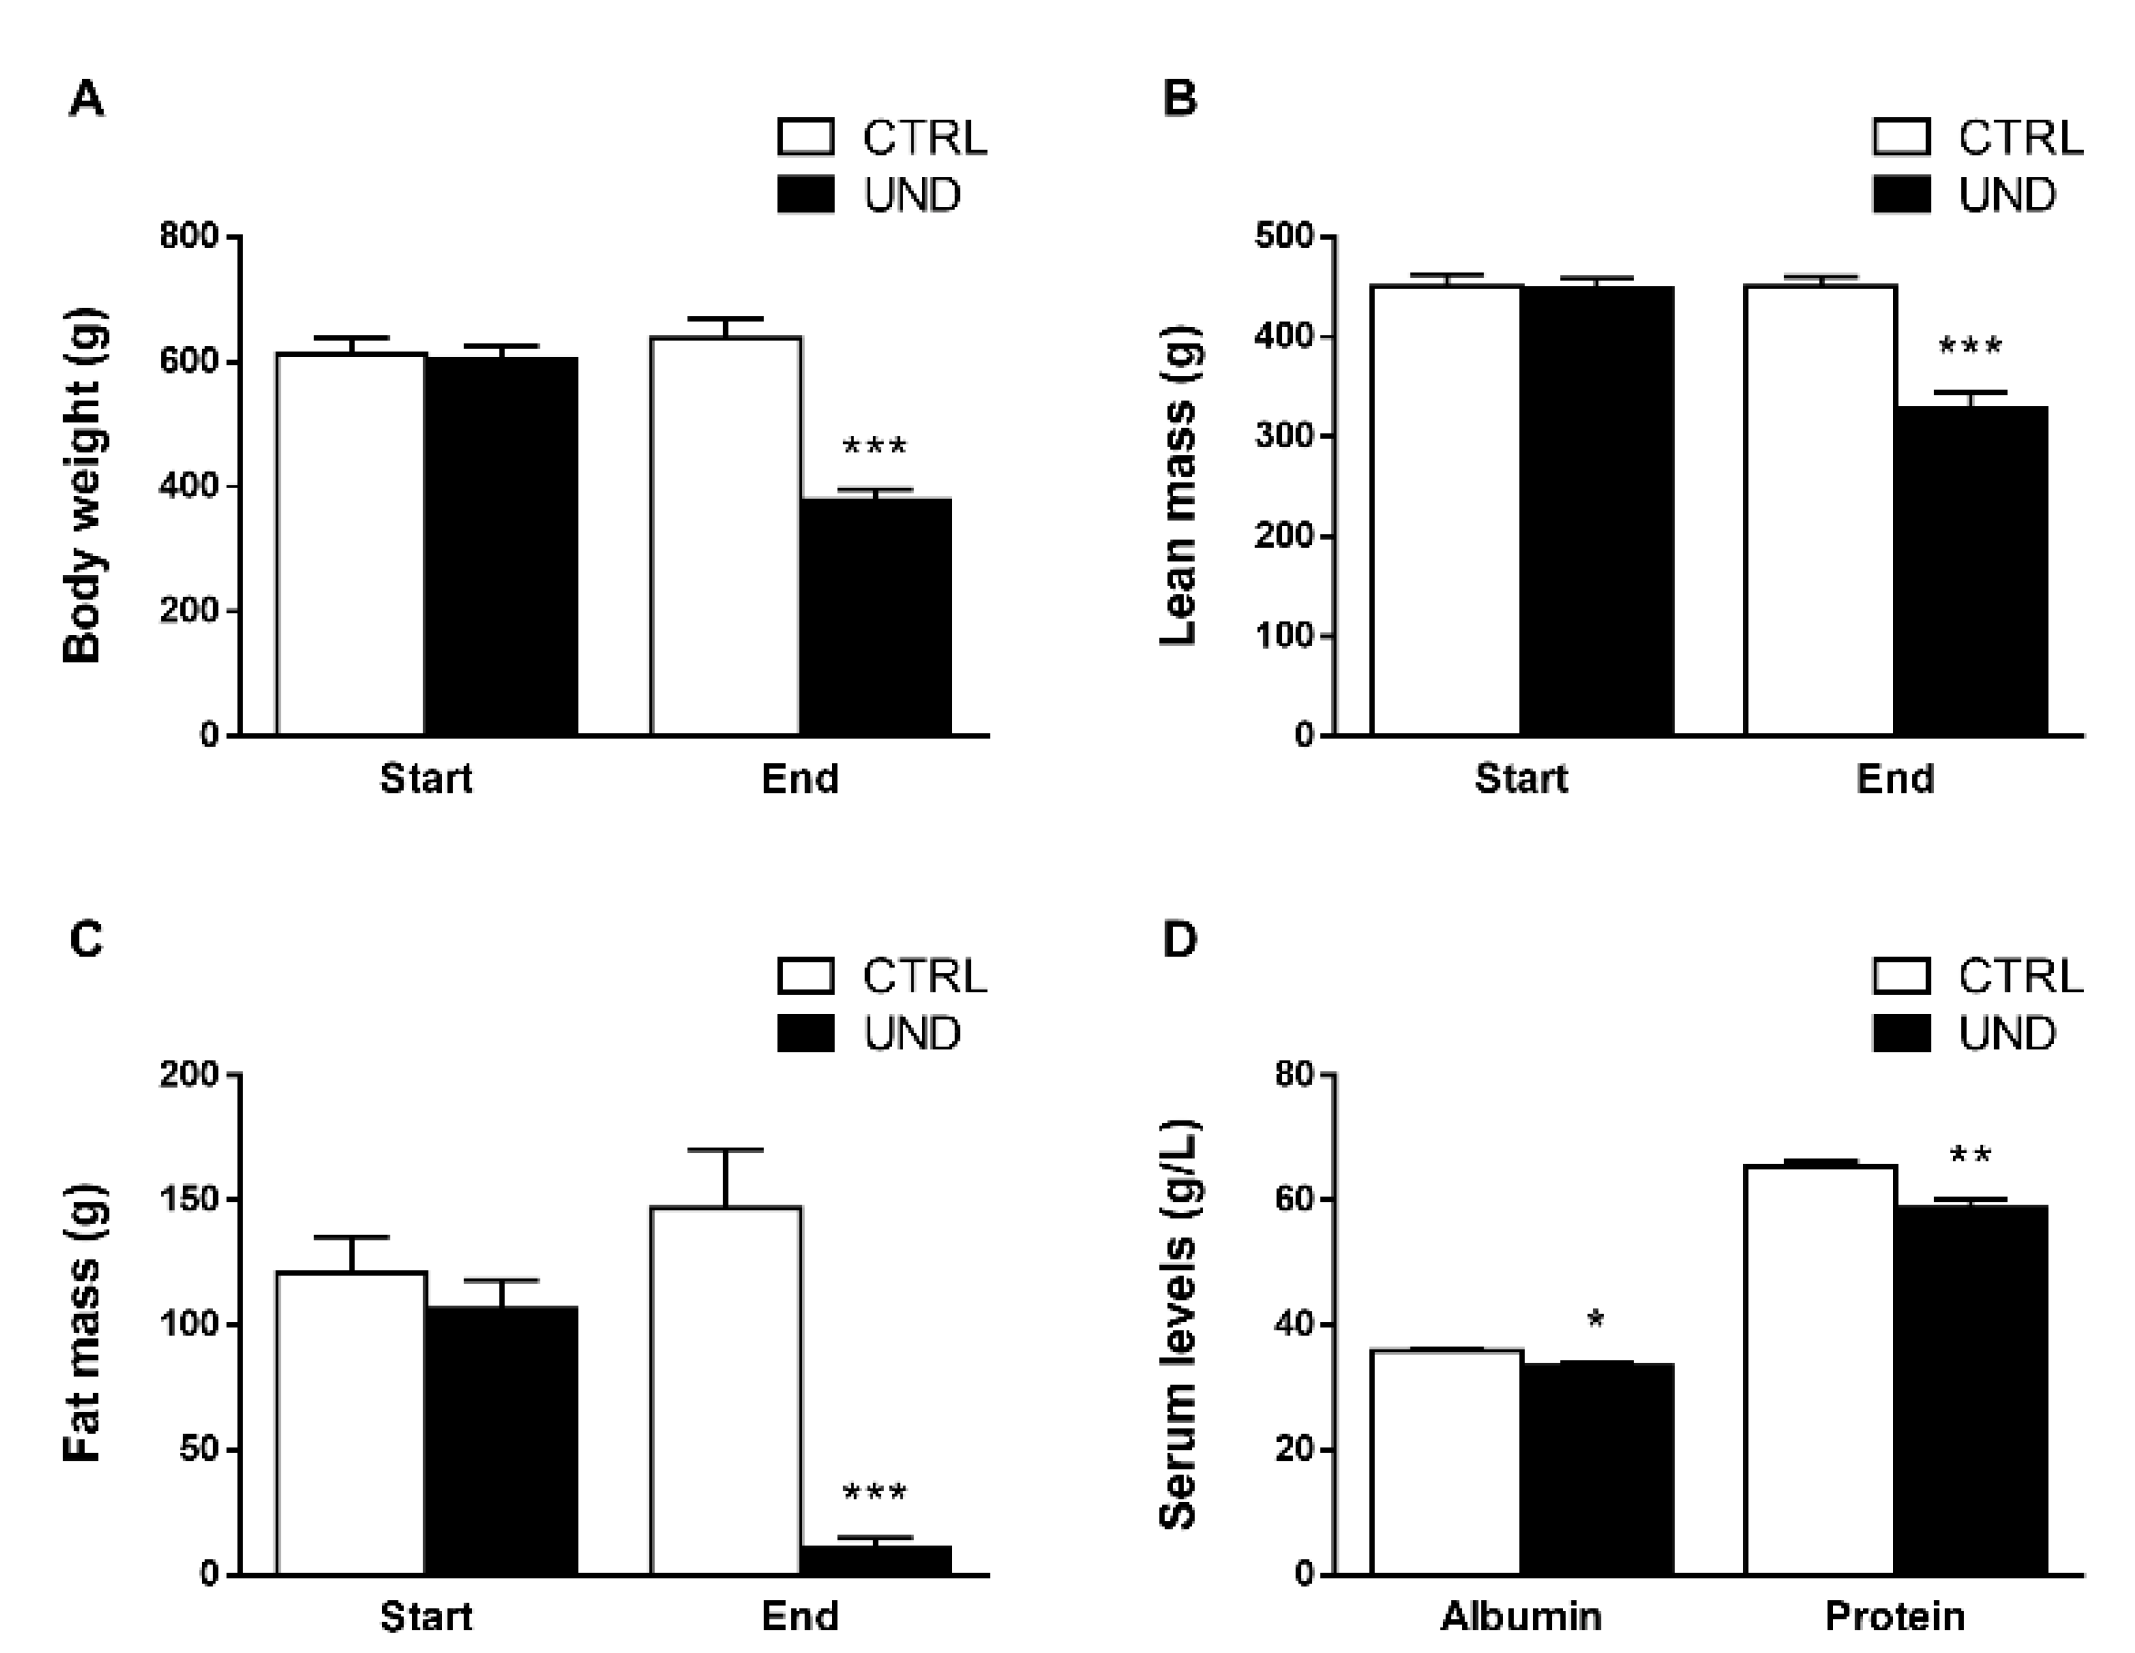
2.1. Undernutrition Affects Muscle Mass and Function in Old Rats

At the beginning of the experiment, there were no significant differences in body weight and body composition between the undernourished (UND) and control (CTRL) rats. At the end of the 12 weeks, we observed a decrease in body weight in response to undernutrition (−42% vs. CTRL, P < 0.001; Figure 1A) associated with a decrease in lean mass (−27% vs. CTRL, P < 0.001; Figure 1B) and a severe decrease in fat mass (−92% vs. CTRL, P < 0.001; Figure 1C). Nutritional status was also evaluated and revealed a slight decrease in serum albumin (−5%, P < 0.05) and total protein levels (−8%, P < 0.05) in UND compared to CTRL animals (Figure 1D), thus confirming undernutrition in the old rats.
In parallel, we observed a significant decrease in muscle mass, especially at hindlimb level including Tibialis anterior (TA), Quadriceps (QD), Gastrocnemius (GC), Soleus (SOL), and Plantaris (PL) muscles (9.27 ± 0.77 g in UND vs. 12.20 ± 0.63 g in CTRL; P < 0.01). In line with previous data [25], undernutrition led to a significant decrease in muscle mass in the predominantly fast-twitch PL muscle (−26% vs. CTRL; P < 0.01; Figure 2A) whereas the slow-twitch SOL muscle showed no significant difference (Figure 2B). Moreover, undernutrition-induced muscle atrophy was demonstrated by a decrease in GC muscle mass (−27% vs. CTRL; P < 0.01; Figure 2C) and fiber cross-sectional area (CSA) (−22% vs. CTRL; P < 0.05; Figure 2D). Regarding muscle function, whereas aging alone tends to decrease grip strength, UND further worsened the loss of absolute muscle force in old rats (−16% vs. Start; P < 0.05; Figure 2E).

2.2. Undernutrition Induces Profound Changes in Muscle Proteome Independently of Muscle Mass

In order to better understand how undernutrition affects muscle mass and function in older age, we performed a shotgun analysis on both fast-twitch PL and slow-twitch SOL muscles. Given the wide dynamic range of protein expression in skeletal muscle, we used two-step solubilization of proteins and generated a sarcoplasmic protein-enriched extract (SPE) and a myofibrillar protein-enriched extract (MPE) fraction from each sample. Proteomic analysis was run on SPE and MPE separately. The amount of proteins extracted was similar in the SPE and MPE fractions of the non-atrophied SOL muscle between UND and CTRL rats (SPE: 34.41 ± 2.01 mg/g and 37.01 ± 1.39 mg/g, respectively, NS; MPE: 37.60 ± 2.53 mg/g and 38.07 ± 1.60 mg/g, respectively, NS). Conversely, muscle wasting was associated with a decrease in the amount of proteins extracted from PL muscle, specifically in the SPE fraction in UND rats compared to CTRL rats (SPE: 37.47 ± 0.91 mg/g and 43.41 ± 1.67 mg/g, respectively, P < 0.05; MPE: 84.21 ± 5.28 mg/g and 81.86 ± 6.59 mg/g, respectively, NS). Using this proteomic workflow, we identified a total of 1635 and 1938 non-redundant proteins with at least two single peptides in the PL and SOL muscles, respectively (FDR < 0.01). Around 38% of the proteins detected in SPE and 18% in MPE were identified, and 44% were identified in both protein extracts (Figure 3A). The differential analysis indicated that the abundance levels of 67 proteins in PL muscle (4% of the total detected proteins) and 187 proteins in SOL muscle (10% of the total detected proteins) were significantly altered in response to UND (Figure 3B) (P < 0.05 and 1.3-FC cut-off). The higher number of regulated proteins in the SOL muscle indicates that UND profoundly affects the muscle proteome, independently of its effect on muscle mass. As observed in the volcano plots, most of the differentially expressed proteins were downregulated in SOL muscle (75%), whereas PL had a relatively even proportion between upregulated and downregulated proteins (Figure 3C,D). However, a higher number of upregulated proteins showed extremely significant fold changes (±2.8-FC) between UND and CTRL rats, as annotated on the graphs.
In order to identify the relevant biological processes (BP) involved in the muscle proteome changes observed in undernourished rats, we performed a Gene Ontology (GO) analysis on the significantly dysregulated proteins in PL and SOL muscles. The most over-represented GO_BP terms were “Energy metabolism” and “Proteostasis” in both PL and SOL muscle. We found that proteins involved in “Energy metabolism”, “Cell organization” and “Signal transduction” were more altered in the SOL than the PL muscle. Conversely, the proteins involved in “Proteostasis” and “Detoxification and Cytoprotection” were more altered in the PL muscle (Figure 4A).
Regarding metabolic processes, we found that carbohydrate and fatty acid (FA) metabolism and Krebs cycle were more altered in SOL than PL muscle whereas purine-pyrimidine and amino acid (AA) metabolism were more altered in PL than SOL muscle. There was no difference in regulation between the PL and SOL muscle in ketone bodies, creatine metabolism, and mitochondrial oxidative phosphorylation (OXPHOS) (Figure 4B). Regarding the proteostasis processes, proteolysis was more affected in PL than in SOL muscle whereas there was no difference between the PL and SOL muscles in proteosynthesis and protein folding (Figure 4C).

2.3. Regulation of Metabolism-Related Proteins in Muscle from Undernourished Old Rats

Our analysis showed that UND leads to a hypometabolic state in aged muscle, as highlighted by the decline in abundances of most of the metabolic enzymes, particularly at the mitochondrial level (Figure 5). Regarding glycolytic metabolism, we found that several glycogenolytic (PGM1, PHKG1) and glycolytic enzymes (ALDOA, GPI, LDHA, PGAM2, PFKB1) were less abundant in the SOL muscle from UND compared to CTRL rats.
Regarding muscle lipid metabolism, we observed a reduction in the abundance of proteins involved in FA beta-oxidation including medium-chain-specific acetyl-CoA dehydrogenase (ACADM) and hydroxyacyl-CoA dehydrogenase (HADH), which were found to be less abundant in both the PL and SOL muscles from UND compared to CTRL rats.
All the proteins involved in the Krebs cycle were found at lower levels in old UND rats including pyruvate dehydrogenase kinase isozyme 4 (PDK4) and fumarate hydratase (FH), which were decreased in response to UND in both the PL and SOL muscles. In SOL muscle, UND induced a decrease in the expression of enzymes responsible for the NADH shuttles (MDH2, GOT1 and GOT2). Moreover, our study points to lower levels of a large number of mitochondrial oxidative phosphorylation (OXPHOS) components in UND compared to CTRL rats including the complex I subunit NDUFA8, complex III subunit UQCRC1, and carrier protein cytochrome C (CYCS), transferring electrons from Complex III to Complex IV. These three proteins were less abundant in both the PL and SOL muscles. Surprisingly, the flavoprotein subunit of succinate dehydrogenase (SDHA), which is required for covalent FAD insertion into complex II of the mitochondrial electron transport chain and for the Krebs cycle, was significantly overrepresented in UND.
Finally, the decreased abundance of proteins involved in amino acid catabolism points to disruptions in amino acid metabolism, which contrasts with the decrease in muscle mass observed in response to UND. For example, branched-chain amino-acid aminotransferase (BCAT2) was less abundant in both the PL and SOL muscles from UND compared to the CTRL rats. This decrease in endogenous losses is likely to be secondary to the decrease in available energy.

2.4. Regulation of Proteostasis-Related Proteins in Muscle from Undernourished Old Rats

Our proteomic data highlighted UND-induced alterations in protein synthesis and degradation (Figure 6). In line with the morphological changes, muscle protein turnover appeared to be differentially altered in PL vs. SOL muscles.
Regarding protein synthesis, PL muscle wasting was surprisingly associated with an increase in various transcription and translation regulators, and in particular, the ribosomal eukaryotic translation initiator factor 4E (EIF4E), which is a downstream effector of the mTOR pathway. Similar to PL muscle, SOL muscle showed a higher abundance of several transcriptional regulators and a lower abundance of the transcriptional repressor TSC22D1 protein. Unlike PL muscle, SOL muscle showed decreased levels of proteins involved in protein translation such as the initiation factors EIF3J and EEF1A2, the elongation factor TUFM, and the component of the 28S ribosomal subunit MRPS36. PL and SOL muscles both showed a decreased abundance of several chaperones involved in protein folding including HSPD1, which was downregulated in both PL and SOL muscles.
PL muscle wasting was associated with changes in the abundance of several ubiquitin–proteasome system (UPS) components. UND led to elevated levels of PSME4, an associated component of the proteasome. Although to date, only the deubiquitinating enzymes USP14 and USP19 have been found to be upregulated in atrophying muscle [26], here, we observed an increase in USP5 in response to UND in PL muscle. In contrast, USP15, which is involved in the regulation of hypertrophic response in cardiac muscle [27], was less abundant in PL muscles from UND compared to CTRL old rats. Alterations in the autophagy–lysosomal pathway (ALP) were revealed by an increase in the abundance of the lysosomal proteinase CTSL in response to UND. Moreover, KLHL22, which is an E3 ubiquitin ligase belonging to the BTB–CUL3–RBX1 E3 ubiquitin ligase complex (BCR) linking the UPS to autophagy termination [28], was more abundant in PL muscle from UND compared to CTRL old rats. Conversely, the E3 ubiquitin ligase FBXO40 targeting IRS1 [29] and the autophagy regulators SH3GLB1 and RETREG1 were found to be less abundant in the SOL muscle from UND old rats.

2.5. Proteomic Signature of Undernourished Aged Muscle

Comparative analyses showed that 1447 proteins were identified in both the PL and SOL muscle (Figure 7A). A total of 12 proteins were significantly regulated in the two muscles (Table 1), of which three were confirmed by western blotting (Figure 8). Note that for these proteins, directional changes were systematically concordant between the PL and SOL muscle. Moreover, three of these proteins (i.e., KNG2L, SERPINF1, and PDK4) were at least 2-fold differentially expressed in aged UND muscles, making them new potential muscle biomarkers of undernutrition in the elderly population.
In response to UND, the commonly-regulated protein with the biggest increase was KNG2L. Kininogens are plasma glycoproteins that have been linked to insulin sensitivity. Insulin sensitivity is reduced in kininogen-deficient rats [30]. Moreover, kinin, which results from kininogen cleavage by kallikrein, promotes an increase in insulin-stimulated glucose uptake in skeletal muscle [31,32,33]. In line with this observation, we observed a decrease in protein levels of SERPINF1, which is known to induce insulin resistance in skeletal muscle [34,35,36]. The pyruvate dehydrogenase kinase PDK4 was found to be decreased in skeletal muscle from old UND rats, whereas it increased in the skeletal muscle of insulin-resistant patients [37]. High-fat-diet-challenged PDK4 knockout mice exhibited improved glucose tolerance and insulin sensitivity [38,39]. Interestingly, it was recently shown that PDK4 overexpression is sufficient to induce C2C12 myotube atrophy whereas PDK4 blockade increases myotube size [40]. These regulations suggest that the decrease in insulinemia in response to UND [17] might be compensated for by increasing skeletal-muscle insulin sensitivity.
A large number of proteins were found to be significantly regulated in only one muscle (Figure 7A). In order to better visualize these proteins, we plotted their Log2 (UND/CTRL) values for PL muscle versus SOL muscle (Figure 7B). The number of muscle-specifically-regulated proteins ranged from 40 in the PL to 81 in the SOL muscle (cutoff < 1.3-fold), indicating that each muscle type exhibited a specific response to UND. As highlighted in Figure 7B, 11 of these proteins were at least 2-fold differentially expressed specifically in the PL muscle (Table 2) against 14 proteins in the SOL muscle (Table 3). In line with this observation, three proteins exclusively identified in PL muscle were at least 2-fold differentially expressed in response to UND (Figure 7A and Table 2). In parallel, 38 proteins exclusively identified in the SOL muscle were affected by UND (Figure 7A), of which 12 with at least 2-FC (Table 3). These fast- and slow-twitch proteins might therefore be responsible for the different responses of aged muscle to undernutrition.
Among the proteins specifically regulated in the fast-twitch PL muscle (Table 2), serpin family H member 1 (SERPINH1) and indolethylamine N-methyltransferase (INMT) have already been associated with muscle wasting conditions. Indeed, studies have reported a decrease in levels of SERPINH1, also known as HSP47, in response to hindlimb suspension and aging [41,42]. As SERPINH1 is a collagen specific molecular chaperone, its decrease suggests that undernutrition impedes maintenance of the extracellular matrix in skeletal muscle [43]. In contrast, gene expression of INMT has been found to be upregulated in response to hindlimb suspension and spaceflight [44].
Among the proteins specifically regulated in the slow-twitch SOL muscle (Table 3), several of the UND-increased proteins such as RRAS2 and STBD1 have already been associated with muscle hypertrophy. Indeed, activation of the canonical Ras/MAPK signaling has been shown to increase the activity of mTORC1, a crucial regulator of skeletal muscle hypertrophy [45]. Moreover, STBD1 is upregulated in muscle hypertrophy models induced by myostatin inhibition [46,47]. Although STBD1 has been linked to glycogen transport to lysosomes, its deletion does not affect glycogen content in skeletal muscle, suggesting an unknown function for this protein [48].
Moreover, we observed changes in the abundance of ELAVL1 and STAT3, which are activated in skeletal muscle and promote skeletal muscle atrophy in cancer [49]. The increased ELAVL1 level contrasts with the muscle phenotype observed in the SOL muscle. However, here, we found a lower abundance of STAT3, whereas STAT3 inhibition has been shown to abrogate skeletal muscle wasting in cancer cachexia models [50].

3. Discussion

Preserving skeletal muscle is not only crucial for maintaining mobility, but also for the many roles it plays in metabolism and homeostasis. Low muscle mass has been shown to adversely affect health outcomes and leads to increased risk for morbidity and mortality. Sarcopenia and undernutrition are both conditions that commonly occur in older populations, where they lead to weight loss with implications for muscle mass and strength and physical function [51]. Rapid worldwide population aging makes muscle health an increasingly real public health challenge. However, despite the co-existence of undernutrition and sarcopenia in older people, few studies have investigated the cellular and molecular mechanisms responsible for muscle wasting in undernourished old populations.
Previous research reported that 50% dietary restriction for 12 weeks was associated with a significant decrease in both fat mass and lean mass from old rats [17,18]. The UND protocol used here in old rats therefore logically affected the mass of several tissues including skeletal muscle. We found that UND had effects on the glycolytic PL muscle but had no significant effect on the oxidative SOL muscle. These findings are corroborated by previous data, demonstrating that UND does not affect muscle mass and protein synthesis in aged SOL muscle [17,25] and does not affect muscle mass and fiber CSA in adult SOL muscle [52]. Whether undernutrition affects the muscle fiber type composition remains undescribed. In addition, the mechanisms driving the differential effects of UND on these two muscle types are unclear. Interestingly, glycolytic fast-twitch muscle fibers show broader effects of aging than oxidative slow-twitch muscle fibers [6]. Moreover, it has been proposed that the preferential use of glucose as substrates might be rate-limiting for muscle protein synthesis in glycolytic muscles, making them more sensitive to UND [4]. In contrast, lipolysis-derived muscle FA might supply sufficient energy to ensure protein synthesis in oxidative muscles [7]. However, the differences in UND-induced alterations in fast and slow muscles remain largely unknown. To address this gap, we characterized changes occurring in skeletal muscle proteome from undernourished old rats and performed a shotgun analysis on both fast-twitch PL and slow-twitch SOL muscles. Our results demonstrate that, unlike muscle mass, UND affected the SOL muscle proteome more than the PL muscle proteome. Despite a similar number of identified proteins (SOL/PL ratio = 1.18), more proteins were found to be differentially expressed (SOL/PL ratio = 2.74) in the SOL muscle.
Undernutrition is often associated with muscle dysfunction and weakness in humans, and this was replicated here as a significant decrease in absolute muscle force in UND old rats. Muscle contraction is reliant on contractile proteins (i.e., myofibrillar proteins) and ATP supply, chiefly through mitochondrial oxidative function. Here, we did not find any change in myofibrillar protein content. However, our proteomic data revealed a reduced abundance in a large number of mitochondrial proteins, suggesting an alteration in ATP production. Grip strength test remains the measure of choice for assessing muscle strength in rodents, but it is influenced by many factors other than pure motor function [53]. Moreover, muscle function cannot be reduced to muscle strength, and in healthy older people, muscle power declines earlier and faster than muscle mass and strength [54]. Nevertheless, the decrease in muscle mass and grip strength observed here in response to UND suggests an alteration in global muscle function in these old rats.
Mitochondria are crucial for energy production, and the mitochondria organelle integrates several metabolic pathways. Our analysis showed a lower abundance of most of the mitochondrial proteins in response to UND, as highlighted by the reduced levels of several key enzymes in the Krebs cycle, β-oxidation, and OXPHOS complexes in both PL and SOL muscles. In line with this analysis, previous reports have shown altered mitochondrial function in the skeletal muscle of malnourished rats [17,18,52,55]. Our results indicate that alteration in mitochondrial function during UND is further complicated by the decrease in mitochondrial content. Moreover, the lower levels of β-oxidation enzymes were observed in SOL muscle while skeletal muscle mass was not significantly altered, which suggests that lipid oxidation may not provide sufficient energy to sustain protein synthesis in oxidative muscles. However, we also demonstrated that SOL muscle undergoes other proteomic changes that are likely to afford it better resistance to UND. Finally, the general decrease in the protein abundance of metabolic enzymes suggests a decrease in metabolic rate that likely contributes to energy saving. Here, UND led to a lower abundance of certain translation regulators in the SOL muscle, which is coherent with the fact that protein synthesis is a high-energy-consuming process [56]. Moreover, the pro-transcriptional regulations observed here might effectively reflect a compensatory response to a drop in translational regulation. In contrast, in the PL muscle, we observed regulations that would be expected to promote protein synthesis via transcription processes and translation processes, which does not fit with the muscle loss observed in response to UND. Moreover, previous research found a decrease in protein synthesis in PL muscle from undernourished old rats [17,18]. Although the abundance of a protein does not directly reflect its corresponding activity, these regulations could constitute or reflect important adaptations designed to limit the reduction in protein synthesis. Whether they represent mechanisms contributing to muscle sparing remains to be determined.
Muscle wasting may be the result of a decrease in protein synthesis and an increase in muscle protein breakdown, which in turn reflects the activation of two major pathways, the UPS pathway and the ALS pathway [57]. Our proteomic data revealed a number of regulations in proteolytic regulators at the level of both UPS and ALS. Most importantly, these regulations were perfectly in line with the changes in muscle mass and protein content observed in both PL and SOL muscles in response to UND. The changes observed in PL muscle are pro-proteolysis, with a higher abundance of proteins that activate UPS and ALS. These results are consistent with the increased MURF1 mRNA levels previously shown in PL muscle from UND rats [18]. Interestingly, cons-proteolysis regulations were observed in the SOL muscle. Taken together, these results suggest that UND-related muscle wasting is caused by increased protein degradation in the fast-twitch PL muscle while the decrease in proteolytic markers could slow the muscle loss in slow-twitch SOL muscle. The proteomic signature of aged UND muscle highlighted specific changes related to muscle type susceptibility. The workflow used here enabled us to identify new potential mediators of muscle wasting in fast-twitch muscle such as SERPINH1 or INMT. In contrast, the specific regulations observed in SOL muscle such as changes in levels of RRAS2, STBD1, and STAT3 could mediate the lower susceptibility of slow-twitch muscle to UND-induced muscle atrophy.
Many proteomic studies have investigated muscle aging in rodents and human skeletal muscle in order to characterize the molecular mechanisms of aging and identify biomarkers that could be targets for the prevention and treatment of sarcopenia [24,58,59,60]. Surprisingly, none assessed age-prevalent undernutrition. This study describes the first proteomic study of undernourished aged skeletal muscle to investigate the mechanisms by which undernutrition affects skeletal muscle in an old population. Our proteomic analysis identified a huge number of proteins whose expression was dysregulated in undernourished old skeletal muscle. We analyzed both the SOL muscle, which is mainly composed of slow-twitch fibers, and the PL muscle, which is mainly composed of fast-twitch fibers, to reveal muscle type-specific changes. Our data demonstrate that UND has profound effects on muscle proteome, independently of its effect on muscle mass. Changes observed in the abundance of metabolic enzymes appear to be consistent with a hypometabolic state, likely to support energy saving. Most importantly, proteomic changes in response to UND, and particularly protein turnover, appear to be specific to muscle type. Finally, we identified several proteins that likely drive the effect of UND in aged skeletal muscle. Future studies should examine whether and to what extent such targets could serve as potential new biomarkers of undernourished aged skeletal muscle and/or novel targets for therapeutic intervention.

4. Materials and Methods

4.1. Animals and Undernutrition Protocol

All animal and experimental procedures were performed in accordance with the Clermont-Ferrand University (France) IRB guidelines, and the study was approved by the local ethics committee (permission number10635-2017071711566890v2). Eighteen twenty-month-old male WISTAR rats were purchased from Janvier-Labs (Le Genest-St-Isle, France). All rats were from the same batch and bred under the same conditions throughout their lives. They were single-housed under controlled conditions of light (12 h/12 h light/dark cycle) and temperature (22 ± 2 °C). During the acclimatization period, the rats had access to standard chow pellets and water ad libitum, and their spontaneous intakes (21 g food/day) were assessed. At the start of the experiment, the undernourished animals (UND, n = 9) were fed 50% of their spontaneous intake for 12 weeks to induce undernutrition, while control animals (CTRL, n = 9) were fed ad libitum all throughout the experiment, as previously validated [18].

4.2. Whole Body Composition and Grip Strength Analysis

At the start and end of the experiment, the animals were placed in an EchoMRI-100 analyzer (Echo Medical Systems LLC, Houston, TX, USA) to determine fat and lean body mass (g). Mean and maximal muscle force were determined by a grip test of forelimb muscles. Grip strength was assessed using a commercially-available force gauge (Bioseb, Vitrolles, France) by the same investigator. The apparatus consisted of a metal bar connected to a force transducer. The rats were gently allowed to grasp the bar with their forepaws, then pulled back steadily until the bar was released down. Three successive measures were performed at 10 min intervals. Results are presented as the mean recorded force value.

4.3. Biological Sample Collection

At the end of the protocol, 16-h-fasted rats were weighed and anesthetized with isoflurane. Blood was collected from the abdominal aorta, then the animals were euthanized by cervical dislocation. Blood was allowed to clot for 15 min at room temperature, and serum was collected after centrifugation at 2000× g for 10 min at 4 °C. Tibialis anterior (TA), Quadriceps (QD), Soleus (SOL), and Plantaris (PL) muscles were then harvested, weighed, and immediately snap-frozen in liquid nitrogen. Gastrocnemius (GC) muscles were harvested, weighed, and promptly frozen in isopentane chilled by liquid nitrogen (−160 °C) for histological analyses. Biological samples were stored at −80 °C until processed.

4.4. Nutritional Status Analyses

Serum levels of albumin and protein were measured on a Konelab 20 biochemical analyzer (Thermo-Electron Corporation, Waltham, MA, USA).

4.5. Histological Analyses

Two serial transverse 10-μm-thick sections were obtained from each GC muscle at −18 °C using a cryostat and mounted on glass slides. Cross-sections were labelled with anti-laminin-α1 (1:20; #L9393, MerckMillipore, Molsheim, France) to outline the fibers and resolved with a secondary antibody conjugated to Alexa-Fluor 488 (Invitrogen, Cergy-Pontoise, France). Images were captured using a high-resolution digital camera coupled to an Axio Vert.A1 inverted microscope (Zeiss, Okerkochen, Germany) at a resolution of 0.645 μm/pixel. Four fields, each containing at least 200 fibers, were analyzed per muscle. Fiber cross sectional area (CSA) was determined for each fiber using ImageJ 1.47v image processing software (National Institutes of Health, Bethesda, MD, USA).

4.6. Muscle Protein Extraction

For the proteomic analysis, we used the PL and SOL muscles from six animals (those presenting the body mass and skeletal muscle mass the closest to the mean) per group. These muscles were homogenized (50 mg/mL) in ice-cold buffer containing 40 mM Tris (pH 7.0), 2 mM EDTA, and 10% protease inhibitor cocktail (#4693124001, MerckMillipore) using an Ultra-Turrax homogenizer (IKALabortechnik, Staufen, Germany). The sarcoplasmic protein-enriched extracts (SPE) were collected after centrifugation at 10,000× g for 10 min at 4 °C. The remaining pellets were resuspended in a buffer containing 50 mM Tris (pH 7.0) and 8 M urea, and incubated for 1 h on ice. The myofibrillar protein-enriched extracts (MPE) were then collected after centrifugation at 5000× g for 5 min at 4 °C. Protein concentrations of SPE and MPE were assessed using the BiCinchoninic acid (BCA) assay method (Pierce™ BCA Protein Assay Kit, ThermoFisher Scientific, Courtaboeuf, France) and the Bradford method (Protein Assay Dye Reagent Concentrate, Bio-Rad Laboratories, Hercules, CA, USA), respectively, according to the manufacturer’s instructions.

4.7. Nano-LC-MS/MS Analysis

Proteins (22.5 µg) from both the SPE and MPE fractions were concentrated into the 1D electrophoresis stacking gel (12% acrylamide), as described in [61,62]. Briefly, gels were stained in Coomassie brilliant blue G-250 solution, and excised lanes were reduced with dithiothreitol (DTT) and alkylated with iodoacetamide (IAA). Proteins were then digested by trypsin (ratio 1:50), and peptide mixtures were analyzed by online nanoflow liquid chromatography using an Ultimate 3000 system coupled to a HFX mass spectrometer (ThermoFisher Scientific) with a nanoelectrospray ion source. Each peptide fraction (n = 48, two fractions per muscle and six animals per group) was injected once into the LC−MS/MS instrument. In other words, we performed LC-MS/MS mass spectrometry analysis in simplicate on six biological replicates per group. The MS/MS spectra search was performed using Mascot (v2.5.1) and Peaks (v10) against the Uniprot Rattus norvegicus database (2019/07, 29,944 sequences). The following parameters were considered for the search: precursor mass tolerance of 10 ppm and fragment mass tolerance of 0.05 Da, a maximum of two missed cleavage sites of trypsin, carbamidomethylation (C), oxidation (M), and deamidation (NQ) set as variable modifications. The minimal peptide length was 5–7 amino acids. Protein identification was validated when at least two peptides originating from one protein showed a significant Mascot score with a false discovery rate (FDR) ≤1%. Label-free protein quantification was performed using Progenesis QI (Nonlinear Dynamics, Waters, Milford, MA). All unique validated peptides of an identified protein were included, and the total cumulative abundance was calculated by summing the abundances of all peptides allocated to the respective protein. The mass-spectrometry proteomics data were deposited to the ProteomeXchange Consortium via the PRIDE [63] partner repository with the dataset identifier PXD032044. Statistical analysis was performed using the “between subject design” option and P-values were calculated by a repeated-measures analysis of variance using the normalized abundances across all runs. The significate threshold was set at P < 0.05 and a 1.3-FC cut-off was applied. To complete the analysis, the proteomic results for SPE and MPE were gathered. In the case of duplication between both fractions, the amplitude of the changes is reported for the fraction where the protein was the most expected based on Progenesis QI confidence score and the known protein localization. Note that directional changes were concordant between the two fractions for >75% of the proteins detected in both fractions, and reported as differentially abundant between UND and CTRL rats.

4.8. Gene Ontology Analysis

Functional annotation was performed according to the Gene Ontology (GO) Biological Processes (BP) using the ProteINSIDE web service (http://www.proteinside.org accessed on 20 April 2021) [64]. The analysis was performed in Rattus norvegicus, and both muscles were considered independently. Benjamini–Hochberg (BH) adjusted P-values were used to establish lists of significantly-enriched pathways in each dataset compared to the whole genome. The GO_BP overview was carried out using only specifications associated with an adjusted P-value < 0.001 with a minimum of annotated proteins ≥2. Finally, annotations were completed manually based on UniProt (https://www.uniprot.org/ accessed on 20 April 2021), NCBI (https://www.ncbi.nlm.nih.gov/ accessed on 20 April 2021), and DAVID (https://david.ncifcrf.gov/ accessed on 20 April 2021) databases.

4.9. Western Blots

Equal amounts of proteins were separated by SDS-PAGE and transferred to PVDF membranes. Membranes were probed with the following primary antibodies: anti-ACADM (1:500; #GTX100488, Genetex, Irvine, CA, USA), anti-SERPINF1 (1:2000; #AF1149, R&D Systems, Minneapolis, MN, USA), and anti-Cytochrome C (1:500; #4272, Cell Signaling Technologies, Leiden, The Netherlands), then incubated with a horseradish peroxidase-coupled secondary antibody and developed using an enhanced chemiluminescence (ECL) western blotting substrate (ThermoFisher Scientific). Luminescence was visualized using a Fusion FX imaging system (Vilber Lourmat, Collegien, France) and quantified using ImageJ 1.47v image processing software. All results were normalized to total protein Ponceau staining.

4.10. Statistical Analysis

For statistical analysis not related to the proteomic datasets, results were expressed relative to CTRL condition and are presented as means ± standard error of the mean (SEM). An unpaired Student’s t-test was used to assess statistical differences amongst means. Statistical analysis of mean grip strength was performed using one-way ANOVA followed by Tukey post hoc tests. The significance threshold was set at P < 0.05. All statistical analyses were performed using GraphPad Prism 6 software (San Diego, CA, USA).

Author Contributions

Conceptualization, J.S., S.W. and M.G.; Methodology, C.B., J.S., C.C. and M.G.; Software, C.C.; Validation, C.B., J.S. and M.G.; Formal Analysis, C.B., C.C., C.G., P.S., V.P. and P.D.; Investigation, C.B., J.S. and M.G.; Resources, S.W., M.G. and C.C.; Data curation, C.B., J.S., C.C. and M.G.; Visualization, C.B., J.S., C.C., S.W. and M.G.; Writing—original draft preparation, C.B.; Writing—review and editing, C.B., J.S., C.C., Y.B., S.W. and M.G.; Supervision, S.W. and M.G.; Project administration, S.W. and M.G.; Funding acquisition, C.B., S.W. and M.G. All authors have read and agreed to the published version of the manuscript.

Funding

C.B. was supported by grant funding from Wallonia-Brussels International (WBI) and from the French Speaking Society of Clinical Nutrition and Metabolism.

Institutional Review Board Statement

All experimental animal procedures were vetted and approved by the Clermont-Ferrand University (France) institutional animal care and use committee (protocol code 10635-2017071711566890v2).

Data Availability Statement

All data supporting the reported results can be found in the tables and figures. The mass spectrometry proteomic data were deposited at the ProteomeXchange Consortium via the PRIDE partner repository with the dataset identifier PXD032044.

Acknowledgments

The authors thank the staff at the INRAE–Theix animal facilities for their valuable care and cooperation: Arlette Cissoire, Benoit Cohade, Yoann Delorme, Medhi Djelloul-Mazouz, Philippe Lhoste, and Julien Hermet.

Conflicts of Interest

The authors declare no conflict of interest.

References

  1. Cederholm, T.; Bosaeus, I.; Barazzoni, R.; Bauer, J.; Van Gossum, A.; Klek, S.; Muscaritoli, M.; Nyulasi, I.; Ockenga, J.; Schneider, S.M.; et al. Diagnostic criteria for malnutrition—An espen consensus statement. Clin. Nutr. 2015, 34, 335–340. [Google Scholar] [CrossRef] [PubMed]
  2. Elia, M. Defining, recognizing, and reporting malnutrition. Int. J. Low Extrem. Wounds 2017, 16, 230–237. [Google Scholar] [CrossRef] [PubMed]
  3. Cao, L.; Morley, J.E. Sarcopenia is recognized as an independent condition by an international classification of disease, tenth revision, clinical modification (icd-10-cm) code. J. Am. Med. Dir. Assoc. 2016, 17, 675–677. [Google Scholar] [CrossRef] [PubMed]
  4. Cruz-Jentoft, A.J.; Bahat, G.; Bauer, J.; Boirie, Y.; Bruyère, O.; Cederholm, T.; Cooper, C.; Landi, F.; Rolland, Y.; Sayer, A.A.; et al. Sarcopenia: Revised european consensus on definition and diagnosis. Age Ageing 2019, 48, 16–31. [Google Scholar] [CrossRef] [PubMed] [Green Version]
  5. Argilés, J.M.; Campos, N.; Lopez-Pedrosa, J.M.; Rueda, R.; Rodriguez-Mañas, L. Skeletal muscle regulates metabolism via interorgan crosstalk: Roles in health and disease. J. Am. Med. Dir. Assoc. 2016, 17, 789–796. [Google Scholar] [CrossRef] [Green Version]
  6. Boirie, Y.; Gachon, P.; Beaufrère, B. Splanchnic and whole-body leucine kinetics in young and elderly men. Am. J. Clin. Nutr. 1997, 65, 489–495. [Google Scholar] [CrossRef]
  7. Jourdan, M.; Cynober, L.; Moinard, C.; Blanc, M.C.; Neveux, N.; De Bandt, J.P.; Aussel, C. Splanchnic sequestration of amino acids in aged rats: In vivo and ex vivo experiments using a model of isolated perfused liver. Am. J. Physiol. Regul. Integr. Comp. Physiol. 2008, 294, R748–R755. [Google Scholar] [CrossRef] [Green Version]
  8. Dardevet, D.; Rémond, D.; Peyron, M.A.; Papet, I.; Savary-Auzeloux, I.; Mosoni, L. Muscle wasting and resistance of muscle anabolism: The “anabolic threshold concept” for adapted nutritional strategies during sarcopenia. Sci. World J. 2012, 2012, 269531. [Google Scholar] [CrossRef]
  9. Guyonnet, S.; Rolland, Y. Screening for malnutrition in older people. Clin. Geriatr. Med. 2015, 31, 429–437. [Google Scholar] [CrossRef]
  10. Roberts, H.C.; Lim, S.E.R.; Cox, N.J.; Ibrahim, K. The challenge of managing undernutrition in older people with frailty. Nutrients 2019, 11, 808. [Google Scholar] [CrossRef] [Green Version]
  11. Barrows, C.H., Jr.; Roeder, L.M. The effect of reduced dietary intake on enzymatic activities and life span of rats. J. Gerontol. 1965, 20, 69–71. [Google Scholar] [CrossRef] [PubMed]
  12. Chambon-Savanovitch, C.; Felgines, C.; Farges, M.C.; Pernet, P.; Cézard, J.; Raul, F.; Cynober, L.; Vasson, M.P. Severe dietary restriction initiated in aged rats: Evidence for poor adaptation in terms of protein metabolism and intestinal functions. Eur. J. Clin. Investig. 1999, 29, 504–511. [Google Scholar] [CrossRef]
  13. Felgines, C.; Savanovitch, C.; Farges, M.C.; Cynober, L.; Vasson, M.P. Protein metabolism in rats during long-term dietary restriction: Influence of aging. JPEN J. Parenter Enter. Nutr. 1999, 23, 32–37. [Google Scholar] [CrossRef] [PubMed]
  14. Walrand, S.; Chambon-Savanovitch, C.; Felgines, C.; Chassagne, J.; Raul, F.; Normand, B.; Farges, M.C.; Beaufrere, B.; Vasson, M.P.; Cynober, L. Aging: A barrier to renutrition? Nutritional and immunologic evidence in rats. Am. J. Clin. Nutr. 2000, 72, 816–824. [Google Scholar] [CrossRef] [PubMed]
  15. Sullivan, D.H.; Walls, R.C.; Bopp, M.M. Protein-energy undernutrition and the risk of mortality within one year of hospital discharge: A follow-up study. J. Am. Geriatr. Soc. 1995, 43, 507–512. [Google Scholar] [CrossRef]
  16. Nations Unies. World population prospects 2019: Highlights; Department of Economic and Social Affairs: New York, NY, USA, 2019. [Google Scholar]
  17. Salles, J.; Cardinault, N.; Patrac, V.; Berry, A.; Giraudet, C.; Collin, M.L.; Chanet, A.; Tagliaferri, C.; Denis, P.; Pouyet, C.; et al. Bee pollen improves muscle protein and energy metabolism in malnourished old rats through interfering with the mtor signaling pathway and mitochondrial activity. Nutrients 2014, 6, 5500–5516. [Google Scholar] [CrossRef] [Green Version]
  18. Salles, J.; Chanet, A.; Berry, A.; Giraudet, C.; Patrac, V.; Domingues-Faria, C.; Rocher, C.; Guillet, C.; Denis, P.; Pouyet, C.; et al. Fast digestive, leucine-rich, soluble milk proteins improve muscle protein anabolism, and mitochondrial function in undernourished old rats. Mol. Nutr. Food Res. 2017, 61, 1700287. [Google Scholar] [CrossRef] [Green Version]
  19. Zangarelli, A.; Chanseaume, E.; Morio, B.; Brugère, C.; Mosoni, L.; Rousset, P.; Giraudet, C.; Patrac, V.; Gachon, P.; Boirie, Y.; et al. Synergistic effects of caloric restriction with maintained protein intake on skeletal muscle performance in 21-month-old rats: A mitochondria-mediated pathway. FASEB J. 2006, 20, 2439–2450. [Google Scholar] [CrossRef]
  20. Sartori, R.; Romanello, V.; Sandri, M. Mechanisms of muscle atrophy and hypertrophy: Implications in health and disease. Nat. Commun. 2021, 12, 330. [Google Scholar] [CrossRef]
  21. Patterson, S.D.; Aebersold, R.H. Proteomics: The first decade and beyond. Nat. Genet. 2003, 33, 311–323. [Google Scholar] [CrossRef]
  22. Wang, F.; Zhang, P.; Liu, H.; Fan, M.; Chen, X. Proteomic analysis of mouse soleus muscles affected by hindlimb unloading and reloading. Muscle Nerve 2015, 52, 803–811. [Google Scholar] [CrossRef]
  23. Massart, I.S.; Paulissen, G.; Loumaye, A.; Lause, P.; Pötgens, S.A.; Thibaut, M.M.; Balan, E.; Deldicque, L.; Atfi, A.; Louis, E.; et al. Marked increased production of acute phase reactants by skeletal muscle during cancer cachexia. Cancers 2020, 12, 3221. [Google Scholar] [CrossRef] [PubMed]
  24. Ubaida-Mohien, C.; Lyashkov, A.; Gonzalez-Freire, M.; Tharakan, R.; Shardell, M.; Moaddel, R.; Semba, R.D.; Chia, C.W.; Gorospe, M.; Sen, R.; et al. Discovery proteomics in aging human skeletal muscle finds change in spliceosome, immunity, proteostasis and mitochondria. Elife 2019, 8, e49874. [Google Scholar] [CrossRef] [PubMed]
  25. Walrand, S.; Zangarelli, A.; Guillet, C.; Salles, J.; Soulier, K.; Giraudet, C.; Patrac, V.; Boirie, Y. Effect of fast dietary proteins on muscle protein synthesis rate and muscle strength in ad libitum-fed and energy-restricted old rats. Br. J. Nutr. 2011, 106, 1683–1690. [Google Scholar] [CrossRef] [Green Version]
  26. Vainshtein, A.; Sandri, M. Signaling pathways that control muscle mass. Int. J. Mol. Sci. 2020, 21, 4759. [Google Scholar] [CrossRef] [PubMed]
  27. Isumi, Y.; Hirata, T.; Saitoh, H.; Miyakawa, T.; Murakami, K.; Kudoh, G.; Doi, H.; Ishibashi, K.; Nakajima, H. Transgenic overexpression of usp15 in the heart induces cardiac remodeling in mice. Biochem. Biophys. Res. Commun. 2011, 405, 216–221. [Google Scholar] [CrossRef]
  28. Liu, C.C.; Chen, R.H. Klhl20 links the ubiquitin-proteasome system to autophagy termination. Autophagy 2016, 12, 890–891. [Google Scholar] [CrossRef] [Green Version]
  29. Shi, J.; Luo, L.; Eash, J.; Ibebunjo, C.; Glass, D.J. The scf-fbxo40 complex induces irs1 ubiquitination in skeletal muscle, limiting igf1 signaling. Dev. Cell 2011, 21, 835–847. [Google Scholar] [CrossRef] [Green Version]
  30. Damas, J.; Bourdon, V.; Lefebvre, P.J. Insulin sensitivity, clearance and release in kininogen-deficient rats. Exp. Physiol. 1999, 84, 549–557. [Google Scholar] [CrossRef]
  31. Dietze, G.J.; Henriksen, E.J. Angiotensin-converting enzyme in skeletal muscle: Sentinel of blood pressure control and glucose homeostasis. J. Renin Angiotensin Aldosterone Syst. 2008, 9, 75–88. [Google Scholar] [CrossRef] [Green Version]
  32. Henriksen, E.J.; Jacob, S.; Fogt, D.L.; Dietze, G.J. Effect of chronic bradykinin administration on insulin action in an animal model of insulin resistance. Am. J. Physiol. 1998, 275, R40–R45. [Google Scholar] [CrossRef] [PubMed]
  33. Miyata, T.; Taguchi, T.; Uehara, M.; Isami, S.; Kishikawa, H.; Kaneko, K.; Araki, E.; Shichiri, M. Bradykinin potentiates insulin-stimulated glucose uptake and enhances insulin signal through the bradykinin b2 receptor in dog skeletal muscle and rat l6 myoblasts. Eur. J. Endocrinol. 1998, 138, 344–352. [Google Scholar] [CrossRef] [PubMed] [Green Version]
  34. Carnagarin, R.; Dharmarajan, A.M.; Dass, C.R. Pedf attenuates insulin-dependent molecular pathways of glucose homeostasis in skeletal myocytes. Mol. Cell. Endocrinol. 2016, 422, 115–124. [Google Scholar] [CrossRef]
  35. Crowe, S.; Wu, L.E.; Economou, C.; Turpin, S.M.; Matzaris, M.; Hoehn, K.L.; Hevener, A.L.; James, D.E.; Duh, E.J.; Watt, M.J. Pigment epithelium-derived factor contributes to insulin resistance in obesity. Cell Metab. 2009, 10, 40–47. [Google Scholar] [CrossRef] [Green Version]
  36. Famulla, S.; Lamers, D.; Hartwig, S.; Passlack, W.; Horrighs, A.; Cramer, A.; Lehr, S.; Sell, H.; Eckel, J. Pigment epithelium-derived factor (pedf) is one of the most abundant proteins secreted by human adipocytes and induces insulin resistance and inflammatory signaling in muscle and fat cells. Int. J. Obes. 2011, 35, 762–772. [Google Scholar] [CrossRef] [Green Version]
  37. McAinch, A.J.; Cornall, L.M.; Watts, R.; Hryciw, D.H.; O’Brien, P.E.; Cameron-Smith, D. Increased pyruvate dehydrogenase kinase expression in cultured myotubes from obese and diabetic individuals. Eur. J. Nutr. 2015, 54, 1033–1043. [Google Scholar] [CrossRef] [PubMed]
  38. Hwang, B.; Jeoung, N.H.; Harris, R.A. Pyruvate dehydrogenase kinase isoenzyme 4 (pdhk4) deficiency attenuates the long-term negative effects of a high-saturated fat diet. Biochem. J. 2009, 423, 243–252. [Google Scholar] [CrossRef] [Green Version]
  39. Thoudam, T.; Ha, C.M.; Leem, J.; Chanda, D.; Park, J.S.; Kim, H.J.; Jeon, J.H.; Choi, Y.K.; Liangpunsakul, S.; Huh, Y.H.; et al. Pdk4 augments er-mitochondria contact to dampen skeletal muscle insulin signaling during obesity. Diabetes 2019, 68, 571–586. [Google Scholar] [CrossRef]
  40. Pin, F.; Novinger, L.J.; Huot, J.R.; Harris, R.A.; Couch, M.E.; O’Connell, T.M.; Bonetto, A. Pdk4 drives metabolic alterations and muscle atrophy in cancer cachexia. FASEB J. 2019, 33, 7778–7790. [Google Scholar] [CrossRef] [Green Version]
  41. Kanazawa, Y.; Ikegami, K.; Sujino, M.; Koinuma, S.; Nagano, M.; Oi, Y.; Onishi, T.; Sugiyo, S.; Takeda, I.; Kaji, H.; et al. Effects of aging on basement membrane of the soleus muscle during recovery following disuse atrophy in rats. Exp. Gerontol. 2017, 98, 153–161. [Google Scholar] [CrossRef]
  42. Oguro, A.; Sakurai, T.; Fujita, Y.; Lee, S.; Kubota, H.; Nagata, K.; Atomi, Y. The molecular chaperone hsp47 rapidly senses gravitational changes in myoblasts. Genes Cells 2006, 11, 1253–1265. [Google Scholar] [CrossRef] [PubMed]
  43. Nagata, K. Hsp47: A collagen-specific molecular chaperone. Trends Biochem. Sci. 1996, 21, 22–26. [Google Scholar] [CrossRef]
  44. Allen, D.L.; Bandstra, E.R.; Harrison, B.C.; Thorng, S.; Stodieck, L.S.; Kostenuik, P.J.; Morony, S.; Lacey, D.L.; Hammond, T.G.; Leinwand, L.L.; et al. Effects of spaceflight on murine skeletal muscle gene expression. J. Appl. Physiol. (1985) 2009, 106, 582–595. [Google Scholar] [CrossRef] [PubMed] [Green Version]
  45. Slack, C. Ras signaling in aging and metabolic regulation. Nutr. Healthy Aging 2017, 4, 195–205. [Google Scholar] [CrossRef] [PubMed] [Green Version]
  46. Barbé, C.; Bray, F.; Gueugneau, M.; Devassine, S.; Lause, P.; Tokarski, C.; Rolando, C.; Thissen, J.P. Comparative proteomic and transcriptomic analysis of follistatin-induced skeletal muscle hypertrophy. J. Proteome Res. 2017, 16, 3477–3490. [Google Scholar] [CrossRef]
  47. Steelman, C.A.; Recknor, J.C.; Nettleton, D.; Reecy, J.M. Transcriptional profiling of myostatin-knockout mice implicates wnt signaling in postnatal skeletal muscle growth and hypertrophy. FASEB J. 2006, 20, 580–582. [Google Scholar] [CrossRef]
  48. Sun, T.; Yi, H.; Yang, C.; Kishnani, P.S.; Sun, B. Starch binding domain-containing protein 1 plays a dominant role in glycogen transport to lysosomes in liver. J. Biol. Chem. 2016, 291, 16479–16484. [Google Scholar] [CrossRef] [Green Version]
  49. Mubaid, S.; Ma, J.F.; Omer, A.; Ashour, K.; Lian, X.J.; Sanchez, B.J.; Robinson, S.; Cammas, A.; Dormoy-Raclet, V.; Di Marco, S.; et al. Hur counteracts mir-330 to promote stat3 translation during inflammation-induced muscle wasting. Proc. Natl. Acad. Sci. USA 2019, 116, 17261–17270. [Google Scholar] [CrossRef] [Green Version]
  50. Bonetto, A.; Aydogdu, T.; Jin, X.; Zhang, Z.; Zhan, R.; Puzis, L.; Koniaris, L.G.; Zimmers, T.A. Jak/stat3 pathway inhibition blocks skeletal muscle wasting downstream of il-6 and in experimental cancer cachexia. Am. J. Physiol. Endocrinol. Metab. 2012, 303, E410–E421. [Google Scholar] [CrossRef] [Green Version]
  51. Sieber, C.C. Malnutrition and sarcopenia. Aging Clin. Exp. Res. 2019, 31, 793–798. [Google Scholar] [CrossRef]
  52. Hirabayashi, T.; Nakanishi, R.; Tanaka, M.; Nisa, B.U.; Maeshige, N.; Kondo, H.; Fujino, H. Reduced metabolic capacity in fast and slow skeletal muscle via oxidative stress and the energy-sensing of ampk/sirt1 in malnutrition. Physiol. Rep. 2021, 9, e14763. [Google Scholar] [CrossRef] [PubMed]
  53. Maurissen, J.P.; Marable, B.R.; Andrus, A.K.; Stebbins, K.E. Factors affecting grip strength testing. Neurotoxicol. Teratol. 2003, 25, 543–553. [Google Scholar] [CrossRef]
  54. Reid, K.F.; Pasha, E.; Doros, G.; Clark, D.J.; Patten, C.; Phillips, E.M.; Frontera, W.R.; Fielding, R.A. Longitudinal decline of lower extremity muscle power in healthy and mobility-limited older adults: Influence of muscle mass, strength, composition, neuromuscular activation and single fiber contractile properties. Eur. J. Appl. Physiol. 2014, 114, 29–39. [Google Scholar] [CrossRef] [PubMed]
  55. Madapallimattam, A.G.; Law, L.; Jeejeebhoy, K.N. Effect of hypoenergetic feeding on muscle oxidative phosphorylation and mitochondrial complex i-iv activities in rats. Am. J. Clin. Nutr. 2002, 76, 1031–1039. [Google Scholar] [CrossRef] [Green Version]
  56. Rolfe, D.F.; Brown, G.C. Cellular energy utilization and molecular origin of standard metabolic rate in mammals. Physiol. Rev. 1997, 77, 731–758. [Google Scholar] [CrossRef] [Green Version]
  57. Schiaffino, S.; Dyar, K.A.; Ciciliot, S.; Blaauw, B.; Sandri, M. Mechanisms regulating skeletal muscle growth and atrophy. FEBS J. 2013, 280, 4294–4314. [Google Scholar] [CrossRef]
  58. Piec, I.; Listrat, A.; Alliot, J.; Chambon, C.; Taylor, R.G.; Bechet, D. Differential proteome analysis of aging in rat skeletal muscle. FASEB J. 2005, 19, 1143–1145. [Google Scholar] [CrossRef]
  59. Gelfi, C.; Vigano, A.; Ripamonti, M.; Pontoglio, A.; Begum, S.; Pellegrino, M.A.; Grassi, B.; Bottinelli, R.; Wait, R.; Cerretelli, P. The human muscle proteome in aging. J. Proteome Res. 2006, 5, 1344–1353. [Google Scholar] [CrossRef]
  60. Kim, J.A.; Vetrivel, P.; Kim, S.M.; Ha, S.E.; Kim, H.H.; Bhosale, P.B.; Heo, J.D.; Lee, W.S.; Senthil, K.; Kim, G.S. Quantitative proteomics analysis for the identification of differential protein expression in calf muscles between young and old sd rats using mass spectrometry. ACS Omega 2021, 6, 7422–7433. [Google Scholar] [CrossRef]
  61. Theron, L.; Gueugneau, M.; Coudy, C.; Viala, D.; Bijlsma, A.; Butler-Browne, G.; Maier, A.; Bechet, D.; Chambon, C. Label-free quantitative protein profiling of vastus lateralis muscle during human aging. Mol. Cell. Proteom. 2014, 13, 283–294. [Google Scholar] [CrossRef] [Green Version]
  62. Gueugneau, M.; d’Hose, D.; Barbe, C.; de Barsy, M.; Lause, P.; Maiter, D.; Bindels, L.B.; Delzenne, N.M.; Schaeffer, L.; Gangloff, Y.G.; et al. Increased serpina3n release into circulation during glucocorticoid-mediated muscle atrophy. J. Cachexia Sarcopenia Muscle 2018, 9, 929–946. [Google Scholar] [CrossRef] [PubMed] [Green Version]
  63. Perez-Riverol, Y.; Csordas, A.; Bai, J.; Bernal-Llinares, M.; Hewapathirana, S.; Kundu, D.J.; Inuganti, A.; Griss, J.; Mayer, G.; Eisenacher, M.; et al. The pride database and related tools and resources in 2019: Improving support for quantification data. Nucleic Acids Res. 2019, 47, D442–D450. [Google Scholar] [CrossRef] [PubMed]
  64. Kaspric, N.; Picard, B.; Reichstadt, M.; Tournayre, J.; Bonnet, M. Proteinside to easily investigate proteomics data from ruminants: Application to mine proteome of adipose and muscle tissues in bovine foetuses. PLoS ONE 2015, 10, e0128086. [Google Scholar] [CrossRef] [PubMed] [Green Version]
Figure 1. Body composition and nutritional markers in undernourished old rats. (A) Body weight, (B) EchoMRI-measured lean mass, (C) EchoMRI-measured fat mass, and (D) serum levels of nutritional markers from UND and CTRL old rats (n = 8–9/group). Results are expressed as means ± SEM. Unpaired student’s t-test were performed to test the effect of undernutrition (*, P < 0.05; **, P < 0.01 and ***, P < 0.001 vs. CTRL).
Ijms 23 04762 g001
Figure 2. Muscle mass and function in undernourished old rats. (A) PL, (B) SOL, (C) GC muscle mass, (D) Representative images and (E) measurements of GC muscle fiber CSA (scale bar = 50 µm), and (F) forelimb mean grip strength in UND and CTRL old rats (n = 7–9/group). Results are expressed as means ± SEM. Unpaired student’s t-test was performed to test the effect of undernutrition (*, P < 0.05 and ** P < 0.01 vs. CTRL). Statistical analysis of mean grip strength used one-way ANOVA (##, P < 0.01) and Tukey post hoc tests (UND effect: ** P < 0.01).
Ijms 23 04762 g002
Figure 3. Undernutrition affects muscle proteome independently of its effect on muscle mass. (A) Total number of non-redundant proteins identified with at least two single peptides and (B) significantly regulated proteins between UND and CTRL PL and SOL muscles (P < 0.05 and 1.3-FC cut-off; n = 6/group). Volcano plots of the distribution of the 1635 and 1938 non-redundant proteins identified in (C) PL and (D) SOL muscles, respectively. Y-axis plots −Log10 (P-value) with a horizontal line at the significance threshold at P = 0.05. X-axis plots Log2 (UND/CTRL) with vertical black cut-off lines at +1.3-FC and −1.3-FC and vertical grey lines corresponding to +2.8-FC and −2.8-FC. Significantly downregulated and upregulated proteins are highlighted in green and red, respectively.
Ijms 23 04762 g003
Figure 4. Functional annotation according to Biological Process enrichment analysis on the proteins dysregulated in PL and SOL muscles from undernourished rats. (A) Pie chart representing GO frequency within the dataset (i.e., 67 dysregulated proteins in PL muscle and 187 dysregulated proteins in SOL muscle (P < 0.05 and 1.3-FC cut-off; n = 6/group). Number of proteins dysregulated for each GO is reported directly on the graphs. The most over-represented GO_terms (B) “Energy metabolism” and (C) “Proteostasis” are scatterplotted, with blue/yellow enriched BP mainly found in SOL/PL muscle.
Ijms 23 04762 g004
Figure 5. Regulation of metabolism-related proteins in muscle from undernourished old rats. Histograms of differential protein expression in the PL (yellow bars) and SOL (blue bars) muscles between UND and CTRL old rats (P < 0.05 and 1.3-FC cut-off; n = 6/group).
Ijms 23 04762 g005
Figure 6. Regulation of proteostasis-related proteins in muscle from undernourished old rats. Histograms of differential protein expression in PL (yellow bars) and SOL (blue bars) muscle between UND and CTRL old rats (P < 0.05 and 1.3-FC cut-off; n = 6/group). UPS, ubiquitin–proteasome system; ALP, autophagy–lysosomal pathway.
Ijms 23 04762 g006
Figure 7. Comparison of proteomic changes in PL and SOL muscles from UND old rats. (A) Venn diagram comparing the number of identified and dysregulated proteins in the PL and SOL muscles from UND rats. (B) Scatterplot of Log2 (ratio UND/CTRL) for proteins identified in both PL and SOL muscles, but significantly regulated only in either the PL muscle (yellow dots) or SOL muscle (blue dots). The grey area indicates the 1.3-FC cut-off. Big dots highlight proteins specifically regulated at beyond +2-FC and −2-FC.
Ijms 23 04762 g007
Figure 8. Western blot verification of selected muscle proteins commonly regulated by UND in both the PL and SOL muscles. (A,E) Representative western blot images and densitometric analysis of (B,F) β-oxidation enzyme ACADM, (C,G) oxidative phosphorylation enzyme CYTC, and (D,H) glycoprotein SERPINF1 levels in PL and SOL muscles from UND vs. CTRL rats (n = 6/group). Results are expressed as means ± SEM. Unpaired student’s t-test was performed to test the effect of undernutrition (*, P < 0.05; **, P < 0.01).
Ijms 23 04762 g008
Table 1. Proteins regulated by UND in both the PL and SOL muscle from old rats.
Proteins ( Ijms 23 04762 i001)PLSOL
SymbolNameFCPFCP
PDK4Pyruvate dehydrogenase kinase isozyme 4−2.20.002−3.80.000
SERPINF1Alpha-2 antiplasmin−2.10.012−2.10.000
NDUFA8NADH dehydrogenase 1 alpha subcomplex subunit 8−1.60.048−2.10.015
HSPD160 kDa heat shock protein−1.60.003−1.40.012
FHFumarate hydratase−1.50.014−2.00.029
HADHHydroxyacyl-coenzyme A dehydrogenase−1.50.028−1.70.014
BCAT2Branched-chain amino acid aminotransferase−1.40.037−1.40.023
CYCSCytochrome c, somatic−1.40.047−1.60.011
ACADMAcetyl-coenzyme A dehydrogenase medium-chain−1.40.040−1.80.001
UQCRC1Cytochrome b-c1 complex subunit 1−1.40.040−1.50.039
IMPDH2Inosine-5′-monophosphate dehydrogenase 2+1.70.045+1.70.011
KNG2LT-kininogen 2+2.20.041+3.10.044
Table 2. Proteins regulated by UND, specifically in PL muscle from old rats.
Proteins ( Ijms 23 04762 i002 & Ijms 23 04762 i003)PLSOL
SymbolNameFCPFCP
SERPINH1Serpin H1−2.00.031NDND
CD163Scavenger receptor cysteine-rich type 1 protein M130+2.20.005NDND
PSME4Proteasome activator subunit 4+2.20.014NDND
MPC2Mitochondrial pyruvate carrier 2−5.70.033+1.10.914
LASP1LIM and SH3 domain protein 1−2.30.037+1.00.858
MTCO3Cytochrome c oxidase subunit 3−2.30.023+1.10.602
NT5C25′-nucleotidase, cytosolic II+2.00.040−1.20.252
AK2Adenylate kinase 2, mitochondrial+2.10.045+1.30.154
GSTM2Glutathione S-transferase Mu 2+2.10.003+1.30.609
MRC1Mannose receptor C-type 1+2.20.028+1.20.943
CUTCCutC copper transporter+2.20.004+1.30.711
INMTIndolethylamine N-methyltransferase+2.20.025−1.10.707
MYOTMyotilin+2.50.035−1.10.538
PHYKPL5-phosphohydroxy-L-lysine phospho-lyase+7.70.017−1.20.705
Table 3. Proteins regulated by UND specifically in the SOL muscle from old rats.
Proteins ( Ijms 23 04762 i004 & Ijms 23 04762 i005)PLSOL
SymbolNameFCPFCP
L2HGDHL-2-hydroxyglutarate dehydrogenaseNDND−2.10.015
AKAP1A-kinase anchor protein 1NDND+2.00.036
ENPP3Ectonucleotide pyrophosphatase/phosphodiesterase family member 3NDND+2.20.023
NOMO1Nodal modulator 1NDND+2.20.012
UGDHUDP-glucose 6-dehydrogenaseNDND+2.30.040
CYP4B1Cytochrome P450 4B1NDND+2.40.013
CHMP3Charged multivesicular body protein 3NDND+2.60.017
RRAS2RAS-related protein 2NDND+2.60.017
MXRA7Matrix-remodeling-associated protein 7NDND+2.80.017
PDLIM4PDZ and LIM domain protein 4NDND+2.90.048
TTF1Transcription termination factor 1NDND+2.90.017
TNNT2Troponin T, cardiac muscleNDND+3.10.027
PFKFB16-phosphofructo-2-kinase/fructose-2,6-biphosphatase 1−1.10.719−3.20.004
PGAM2Phosphoglycerate mutase 2−1.10.663−2.70.006
CKMCreatine kinase M-type+1.10.868−2.60.201
CDC37Hsp90 co-chaperone Cdc37−1.20.427−2.60.034
MRPS36Mitochondrial ribosomal protein S36−1.00.760−2.40.028
STAT3Signal transducer and activator of transcription 3−1.10.862−2.30.050
ACADSAcetyl-coenzyme A dehydrogenase, short chain−1.20.113−2.20.015
GNPDA1Glucosamine-6-phosphate isomerase+1.20.484−2.20.016
PHKG1Phosphorylase b kinase gamma catalytic chain, skeletal muscle/heart isoform−1.10.978−2.10.048
DDX5DEAD (Asp-Glu-Ala-Asp) box polypeptide 5−1.10.755+2.00.008
HNRNPH2Heterogeneous nuclear ribonucleoprotein H2+1.20.837+2.10.037
STBD1Starch-binding domain-containing protein 1+1.10.402+2.10.049
FASNFatty acid synthase+1.00.914+4.30.002
ELAVL1ELAV-like protein 1−1.30.260+7.20.047
Publisher’s Note: MDPI stays neutral with regard to jurisdictional claims in published maps and institutional affiliations.

