
Identification of Novel Pathways Regulated by APE1/Ref-1 in Human Retinal Endothelial Cells
 , ,
, ,  ,
,  and
and 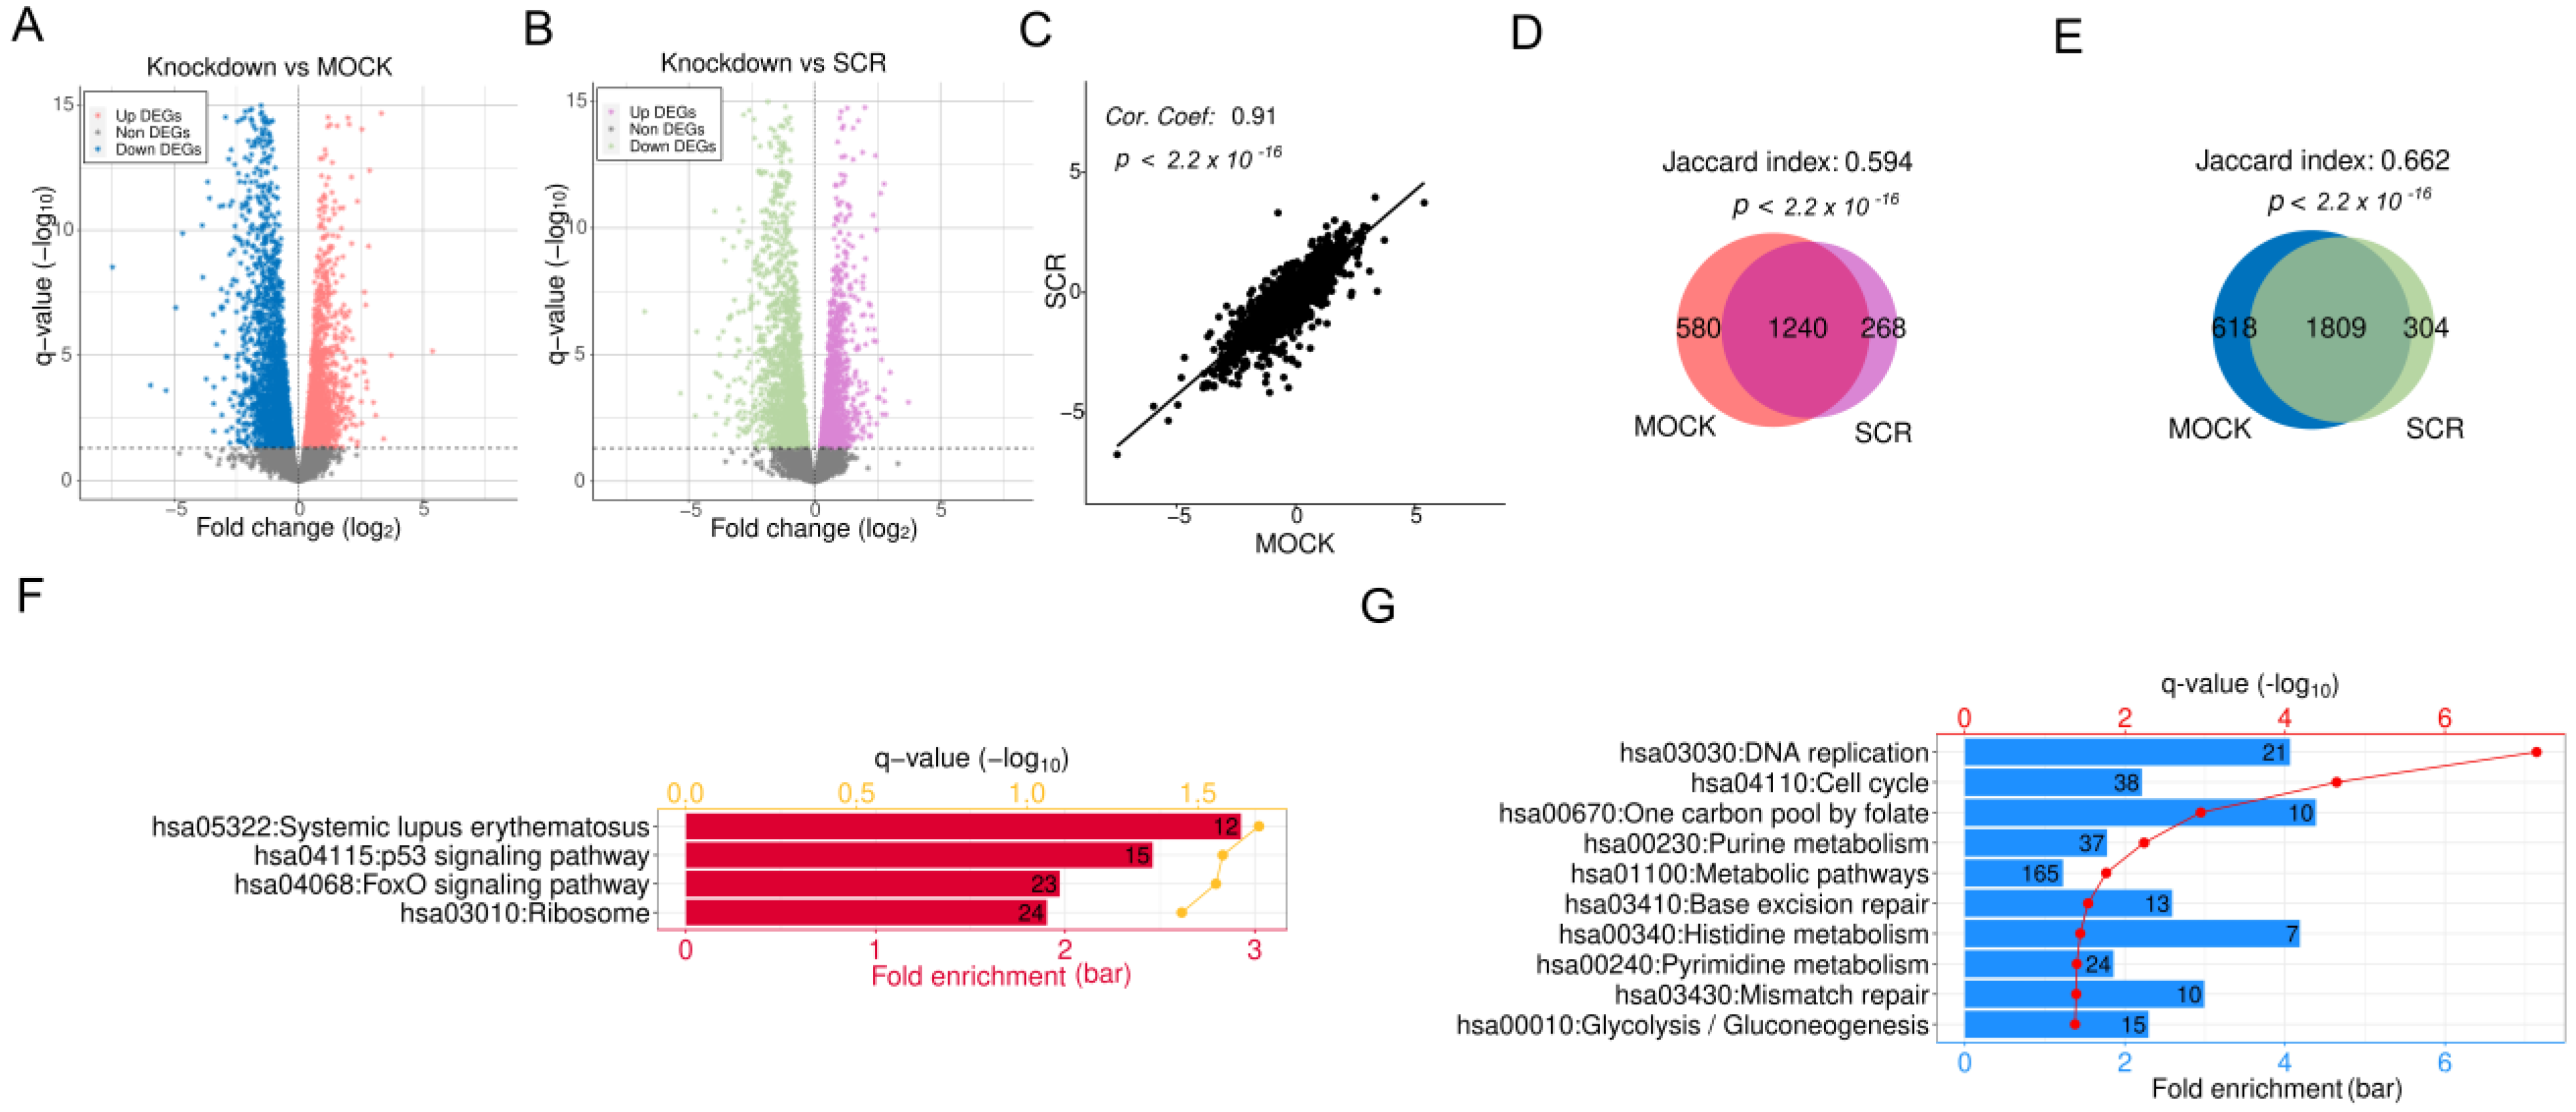
Abstract
:1. Introduction
2. Results
2.1. Differential Gene Expression Analysis for APEX1 KD in HRECs
2.2. Multiple Crucial Signaling Pathways Are Dysregulated Following APEX1 KD in HRECs
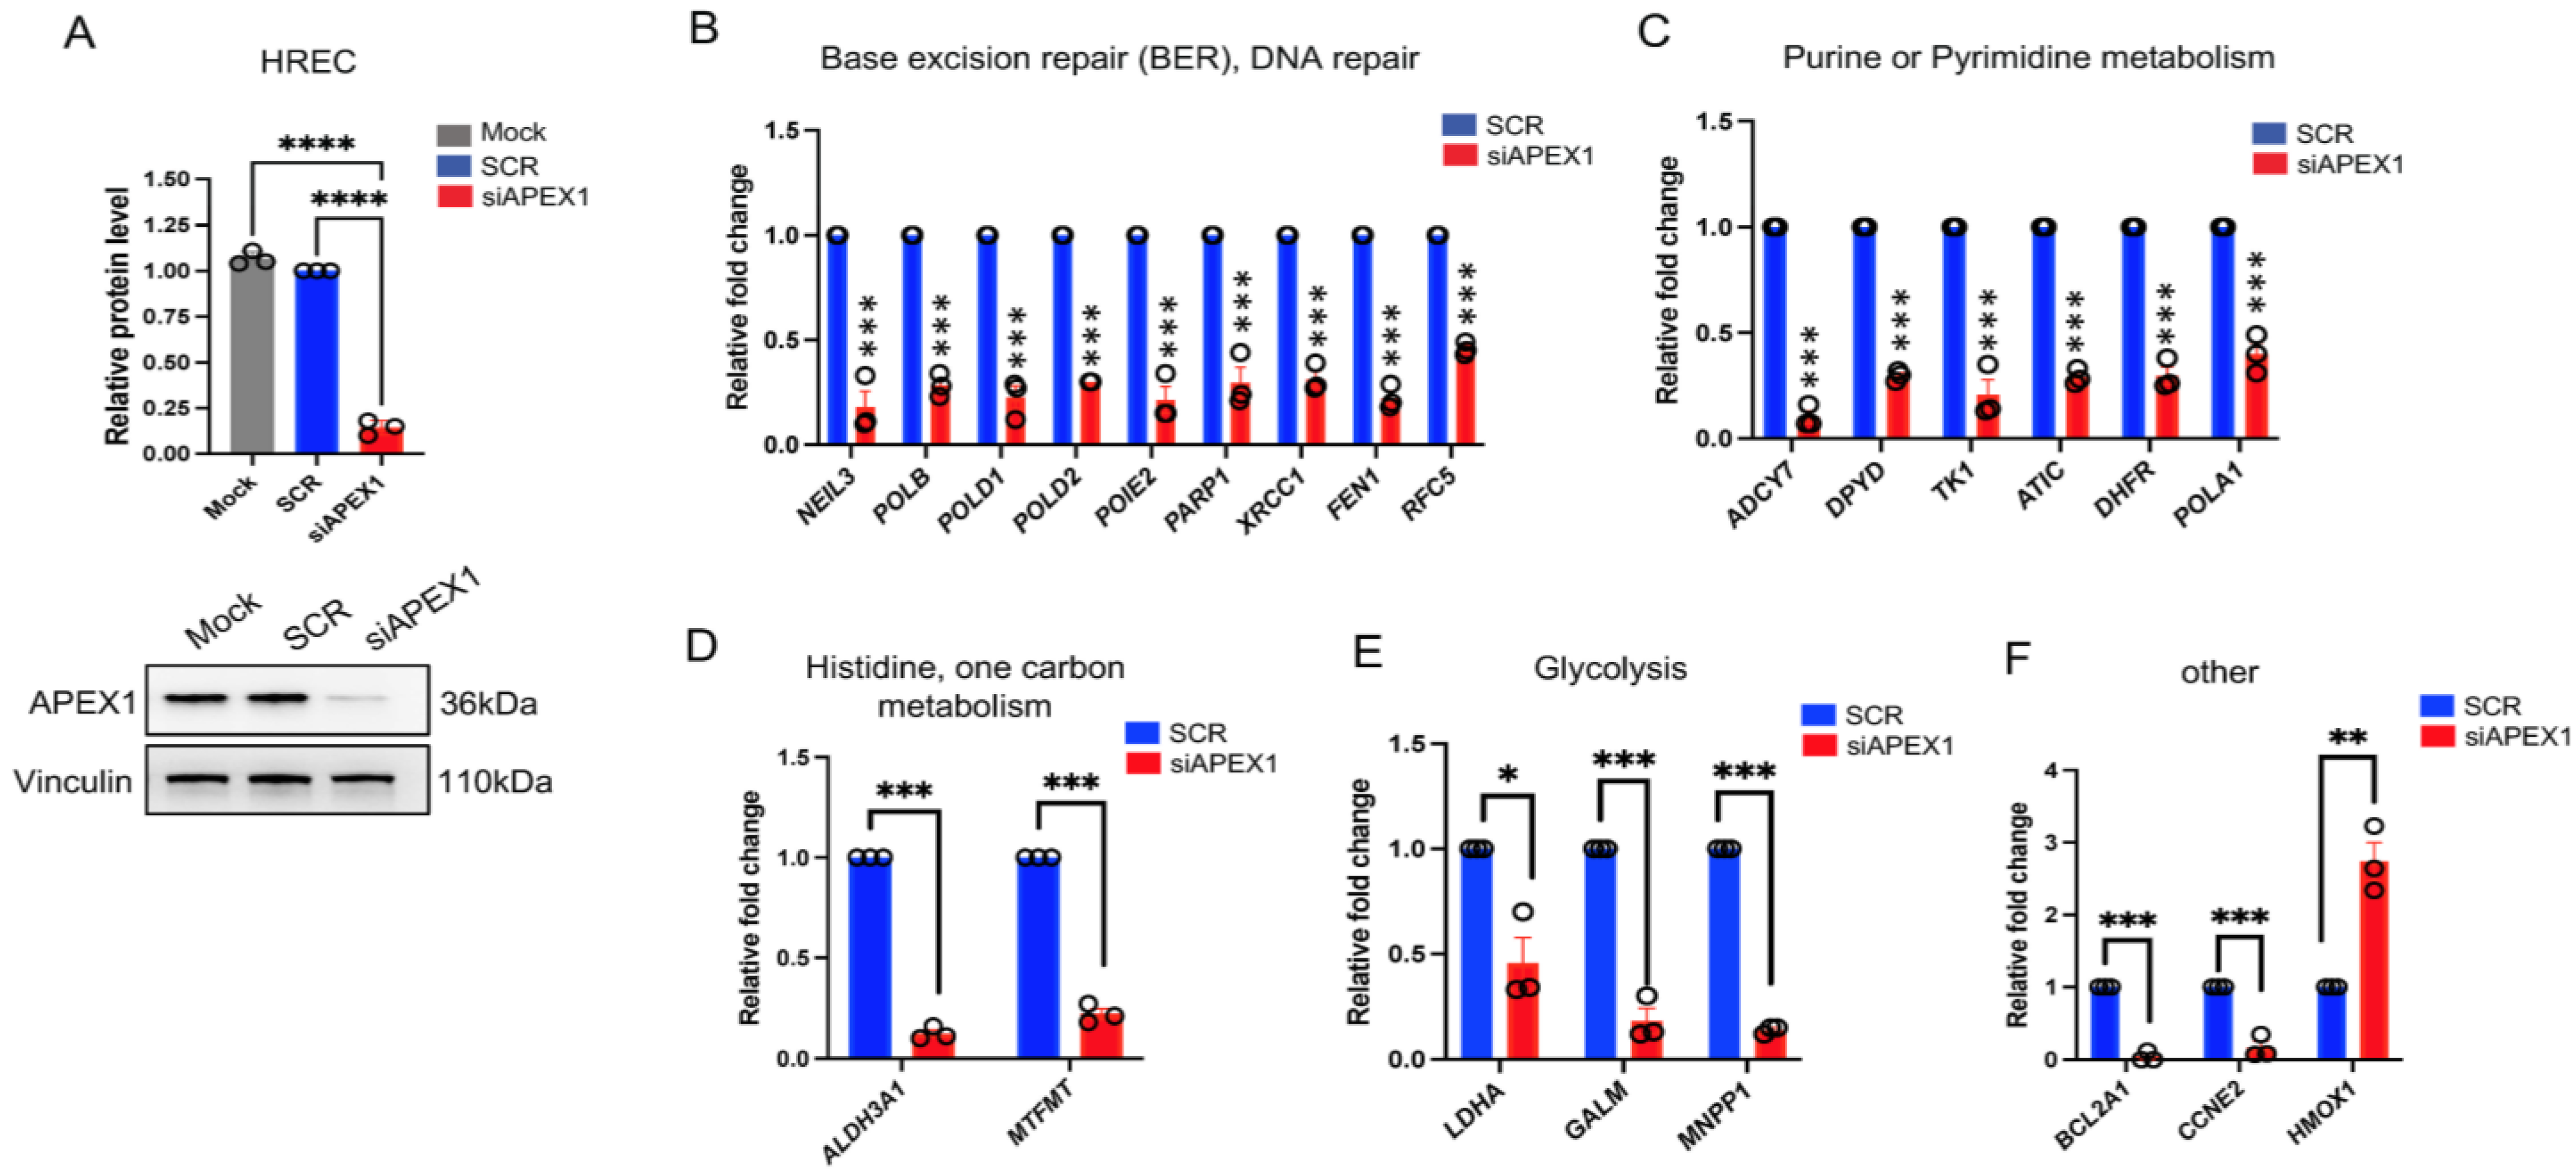
2.3. Expression Levels of Selected Genes from RNA-seq upon APEX1 KD
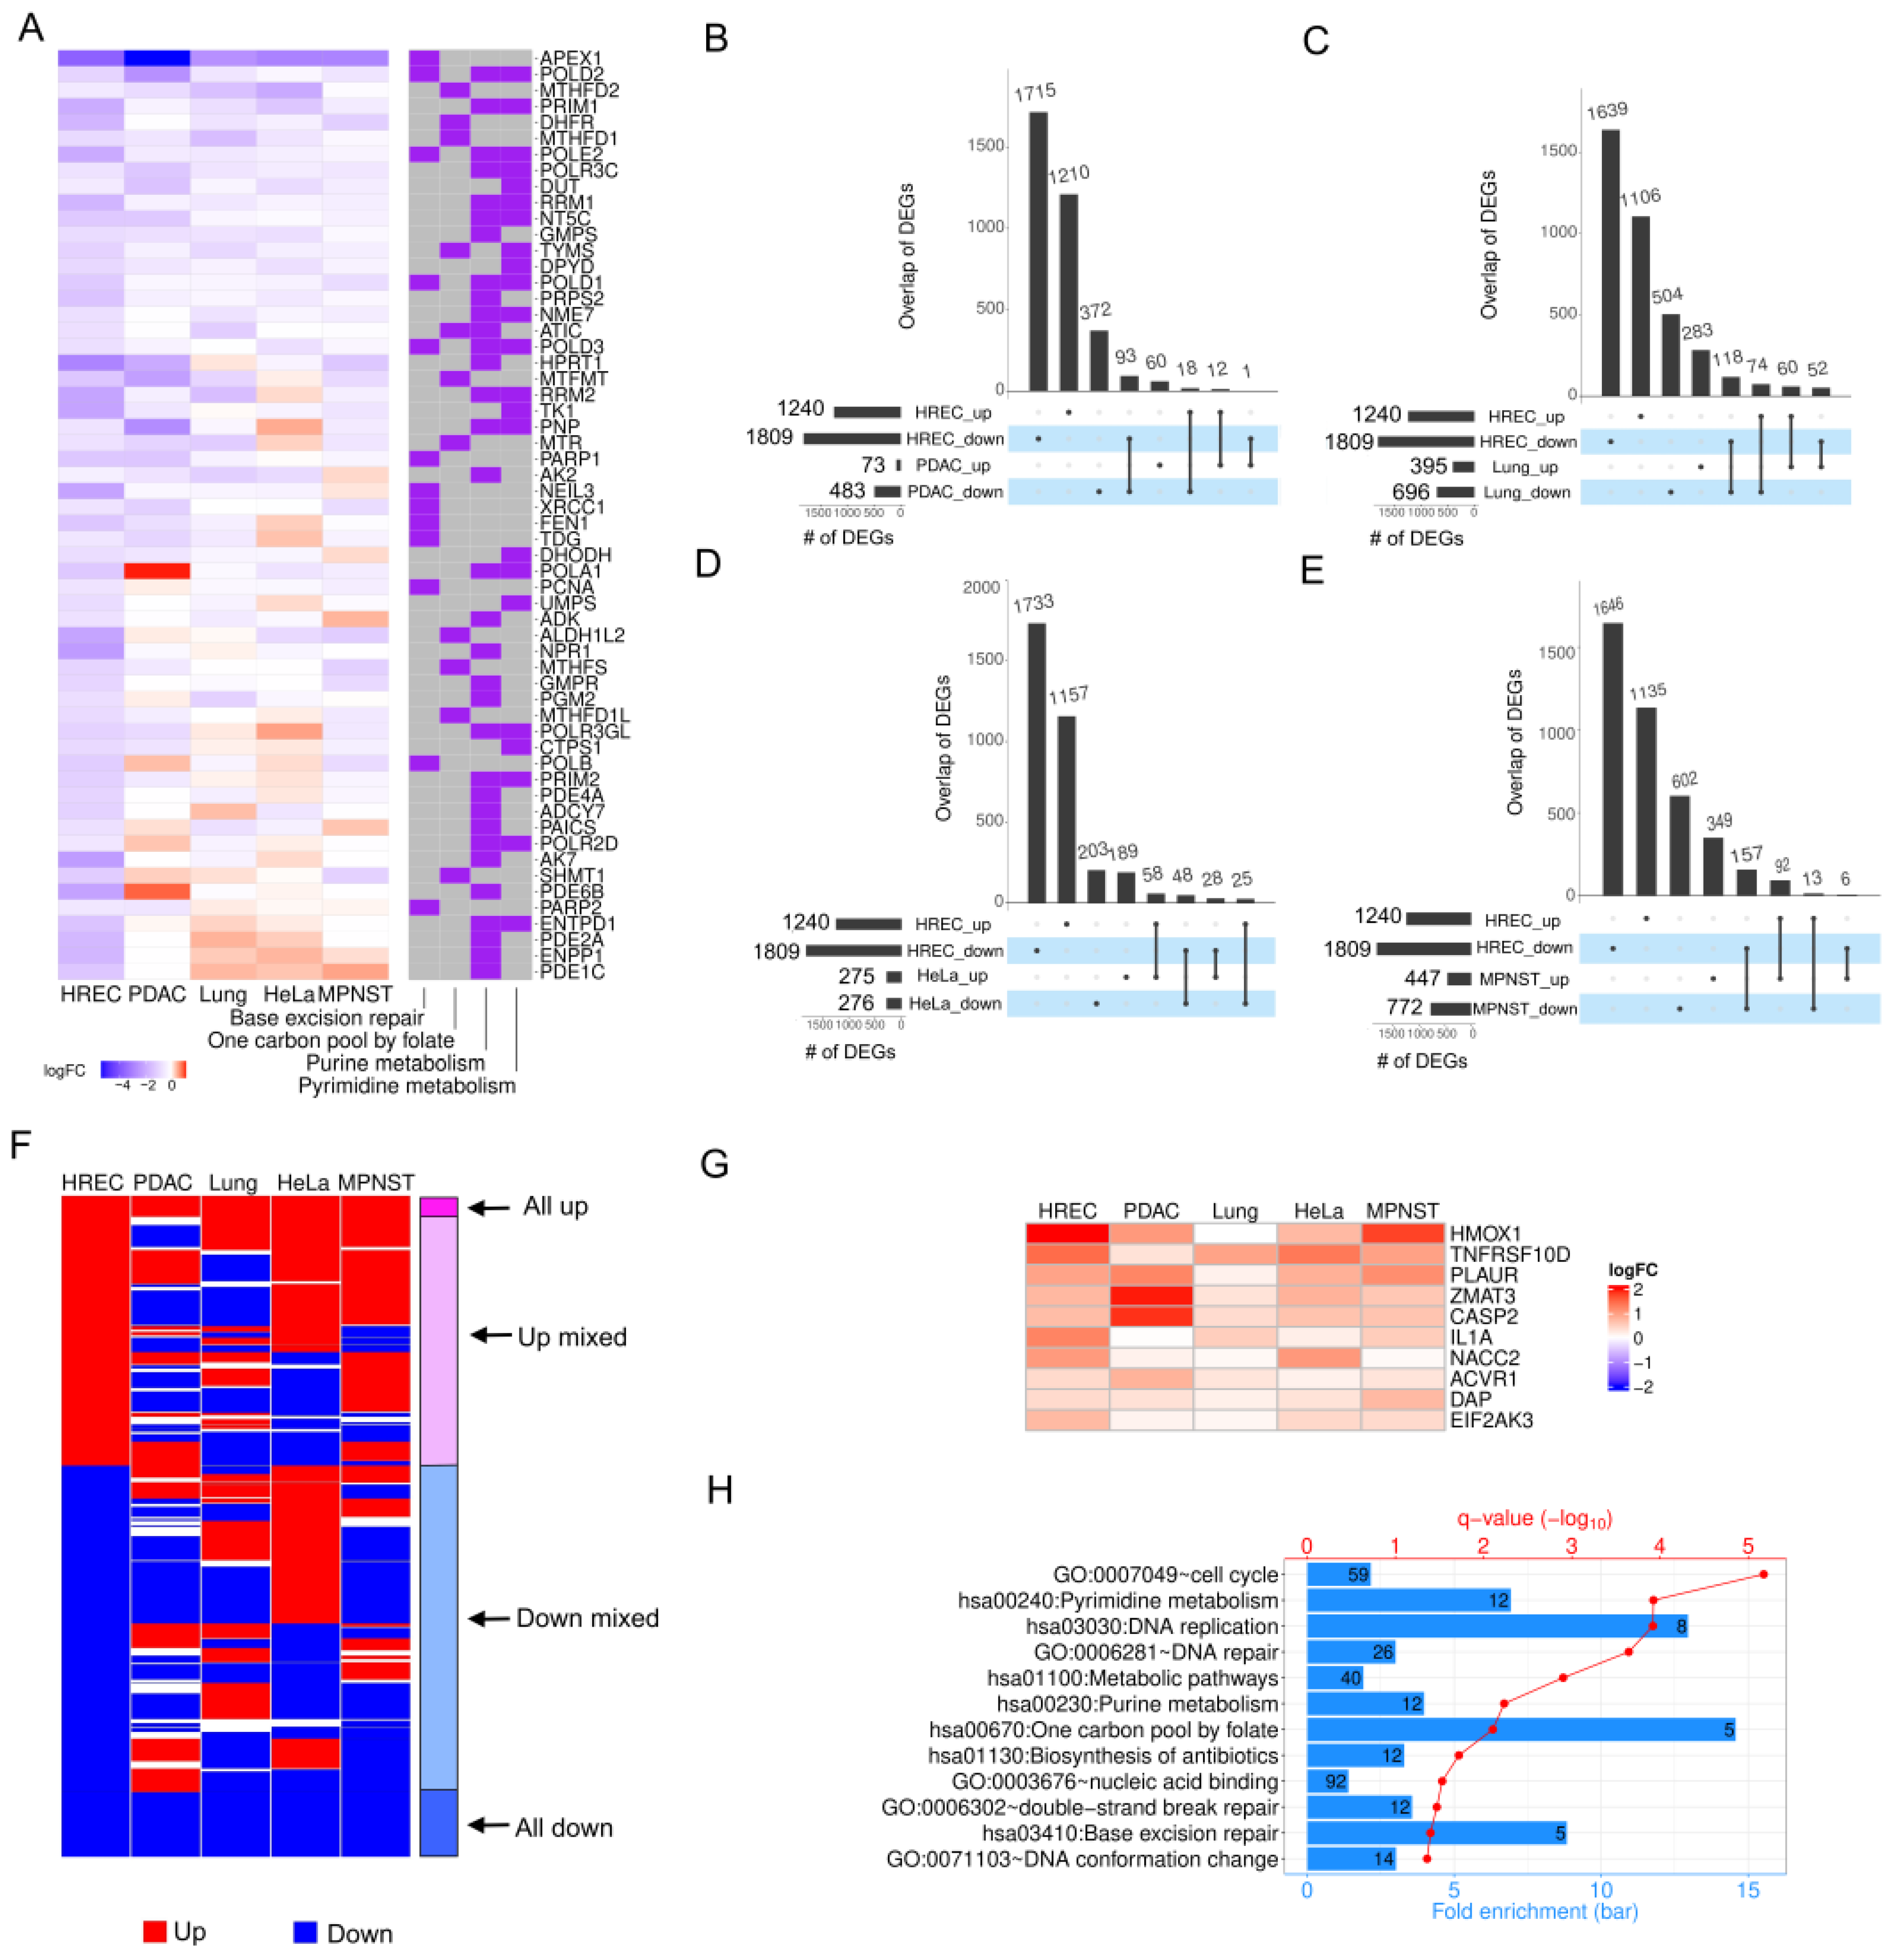
2.4. APEX1 Affects Diverse Sets of Genes in HRECs and Different Cancer Cell Lines
3. Discussion
4. Materials and Methods
4.1. Cell Transfection with siRNA
4.2. RNA-seq Library Preparation and Sequencing
4.3. Bioinformatics and Data Analyses
4.4. Immunoblot
4.5. qRT-PCR
4.6. Statistics
Supplementary Materials
Author Contributions
Funding
Data Availability Statement
Acknowledgments
Conflicts of Interest
References
- Qiang, W.; Wei, R.; Chen, Y.; Chen, D. Clinical pathological features and current animal models of type 3 macular neovascularization. Front. Neurosci. 2021, 15, 734860. [Google Scholar] [CrossRef] [PubMed]
- Campochiaro, P.A. Ocular neovascularization. J. Mol. Med. 2013, 91, 311–321. [Google Scholar] [CrossRef] [PubMed]
- Lux, A.; Llacer, H.; Heussen, F.M.; Joussen, A.M. Non-responders to bevacizumab (Avastin) therapy of choroidal neovascular lesions. Br. J. Ophthalmol. 2007, 91, 1318–1322. [Google Scholar] [CrossRef] [PubMed] [Green Version]
- Liu, C.H.; Wang, Z.; Sun, Y.; Chen, J. Animal models of ocular angiogenesis: From development to pathologies. FASEB J. 2017, 31, 4665–4681. [Google Scholar] [CrossRef] [Green Version]
- Xu, M.; Fan, R.; Fan, X.; Shao, Y.; Li, X. Progress and challenges of anti-VEGF agents and their sustained-release strategies for retinal angiogenesis. Drug Des. Dev. Ther. 2022, 16, 3241–3262. [Google Scholar] [CrossRef] [PubMed]
- Jacobs, B.; Palmer, N.; Shetty, T.; Dimaras, H.; Hajrasouliha, A.; Jusufbegovic, D.; Corson, T.W. Patient preferences in retinal drug delivery. Sci. Rep. 2021, 11, 18996. [Google Scholar] [CrossRef]
- Rubsam, A.; Parikh, S.; Fort, P.E. Role of inflammation in diabetic retinopathy. Int. J. Mol. Sci. 2018, 19, 942. [Google Scholar] [CrossRef] [Green Version]
- Kuo, C.Y.J.; Murphy, R.; Rupenthal, I.D.; Mugisho, O.O. Correlation between the progression of diabetic retinopathy and inflammasome biomarkers in vitreous and serum—A systematic review. BMC Ophthalmol. 2022, 22, 238. [Google Scholar] [CrossRef]
- Mijit, M.; Caston, R.; Gampala, S.; Fishel, M.L.; Fehrenbacher, J.; Kelley, M.R. APE1/Ref-1—One target with multiple indications: Emerging aspects and new directions. J. Cell. Signal. 2021, 2, 151–161. [Google Scholar]
- Heisel, C.; Yousif, J.; Mijiti, M.; Charizanis, K.; Brigell, M.; Corson, T.W.; Kelley, M.R. APE1/Ref-1 as a novel target for retinal diseases. J. Cell. Signal. 2021, 2, 133–138. [Google Scholar] [CrossRef]
- Gampala, S.; Caston, R.A.; Fishel, M.L.; Kelley, M.R. Chapter 27. Basic, translational and clinical relevance of the DNA repair and redox signaling protein APE1 in human diseases. In DNA Damage, DNA Repair and Disease; Chemical Biology; Royal Society of Chemistry: Cambridge, UK, 2020; pp. 286–318. [Google Scholar]
- Fishel, M.; Vascotto, C.; Kelley, M. DNA base excision repair therapeutics: Summary of BER targets with a focus on APE1. In DNA Repair and Cancer: Bench to Clinic; CRC Press: Boca Raton, FL, USA, 2013; pp. 233–287. [Google Scholar]
- Malfatti, M.C.; Antoniali, G.; Codrich, M.; Tell, G. Coping with RNA damage with a focus on APE1, a BER enzyme at the crossroad between DNA damage repair and RNA processing/decay. DNA Repair 2021, 104, 103133. [Google Scholar] [CrossRef] [PubMed]
- Caston, R.A.; Gampala, S.; Armstrong, L.; Messmann, R.A.; Fishel, M.L.; Kelley, M.R. The multifunctional APE1 DNA repair–redox signaling protein as a drug target in human disease. Drug Discov. Today 2021, 26, 218–228. [Google Scholar] [CrossRef] [PubMed]
- Zhang, G.; Shi, H.; Wang, L.; Zhou, M.; Wang, Z.; Liu, X.; Cheng, L.; Li, W.; Li, X. MicroRNA and transcription factor mediated regulatory network analysis reveals critical regulators and regulatory modules in myocardial infarction. PLoS ONE 2015, 10, e0135339. [Google Scholar] [CrossRef] [PubMed]
- Antoniali, G.; Serra, F.; Lirussi, L.; Tanaka, M.; D’Ambrosio, C.; Zhang, S.; Radovic, S.; Dalla, E.; Ciani, Y.; Scaloni, A.; et al. Mammalian APE1 controls miRNA processing and its interactome is linked to cancer RNA metabolism. Nat. Commun. 2017, 8, 797–815. [Google Scholar] [CrossRef] [Green Version]
- Li, Y.; Liu, X.; Zhou, T.; Kelley, M.R.; Edwards, P.A.; Gao, H.; Qiao, X. Suppression of choroidal neovascularization through inhibition of APE1/Ref-1 redox activity. Investig. Ophthalmol. Vis. Sci. 2014, 55, 4461–4469. [Google Scholar] [CrossRef] [PubMed]
- Sardar Pasha, S.P.B.; Sishtla, K.; Sulaiman, R.S.; Park, B.; Shetty, T.; Shah, F.; Fishel, M.L.; Wikel, J.H.; Kelley, M.R.; Corson, T.W. Ref-1/APE1 inhibition with novel small molecules blocks ocular neovascularization. J. Pharmacol. Exp. Ther. 2018, 367, 108–118. [Google Scholar] [CrossRef] [Green Version]
- Hartman, G.D.; Lambert-Cheatham, N.A.; Kelley, M.R.; Corson, T.W. Inhibition of APE1/Ref-1 for neovascular eye diseases: From biology to therapy. Int. J. Mol. Sci. 2021, 22, 10279. [Google Scholar] [CrossRef]
- Muniyandi, A.; Hartman, G.D.; Day, K.; Qi, X.; Boulton, M.; Kelley, M.R.; Corson, T.W. APE1/Ref-1 is highly expressed in murine laser-induced choroidal neovascularization and human neovascular age-related macular degeneration. Investig. Ophthalmol. Vis. Sci. 2022, 63, 0005. [Google Scholar]
- Hartman, G.D.; Muniyandi, A.; Kelley, M.R.; Corson, T.W. APE1/Ref-1 is overexpressed and colocalizes with neovascular tufts and hypoxic regions in the oxygen-induced retinopathy mouse model. Investig. Ophthalmol. Vis. Sci. 2022, 63, 269-F0314. [Google Scholar]
- Dennis, G., Jr.; Sherman, B.T.; Hosack, D.A.; Yang, J.; Gao, W.; Lane, H.C.; Lempicki, R.A. DAVID: Database for Annotation, Visualization, and Integrated Discovery. Genome Biol. 2003, 4, P3. [Google Scholar] [CrossRef] [Green Version]
- Da Huang, W.; Sherman, B.T.; Lempicki, R.A. Systematic and integrative analysis of large gene lists using DAVID bioinformatics resources. Nat. Protoc. 2009, 4, 44–57. [Google Scholar] [CrossRef] [PubMed]
- Shah, F.; Goossens, E.; Atallah, N.M.; Grimard, M.; Kelley, M.R.; Fishel, M.L. APE1/Ref-1 knockdown in pancreatic ductal adenocarcinoma—Characterizing gene expression changes and identifying novel pathways using single-cell RNA sequencing. Mol. Oncol. 2017, 11, 1711–1732. [Google Scholar] [CrossRef] [PubMed] [Green Version]
- Xue, Z.; Demple, B. Knockout and inhibition of Ape1: Roles of Ape1 in base excision DNA Repair and modulation of gene expression. Antioxidants 2022, 11, 1817. [Google Scholar] [CrossRef] [PubMed]
- Vascotto, C.; Fantini, D.; Romanello, M.; Cesaratto, L.; Deganuto, M.; Leonardi, A.; Radicella, J.P.; Kelley, M.R.; D’Ambrosio, C.; Scaloni, A.; et al. APE1/Ref-1 interacts with NPM1 within nucleoli and plays a role in the rRNA quality control process. Mol. Cell. Biol. 2009, 29, 1834–1854. [Google Scholar] [CrossRef] [PubMed] [Green Version]
- Whitaker, A.M.; Freudenthal, B.D. APE1: A skilled nucleic acid surgeon. DNA Repair 2018, 71, 93–100. [Google Scholar] [CrossRef] [PubMed]
- Vidal, A.E.; Boiteux, S.; Hickson, I.D.; Radicella, J.P. XRCC1 coordinates the initial and late stages of DNA abasic site repair through protein-protein interactions. EMBO J. 2001, 20, 6530–6539. [Google Scholar] [CrossRef] [Green Version]
- Whitaker, A.M.; Schaich, M.A.; Smith, M.R.; Flynn, T.S.; Freudenthal, B.D. Base excision repair of oxidative DNA damage: From mechanism to disease. Front. Biosci. 2017, 22, 1493–1522. [Google Scholar] [CrossRef] [Green Version]
- Luo, M.; Delaplane, S.; Jiang, A.; Reed, A.; He, Y.; Fishel, M.; Nyland, R.L., 2nd; Borch, R.F.; Qiao, X.; Georgiadis, M.M.; et al. Role of the multifunctional DNA repair and redox signaling protein Ape1/Ref-1 in cancer and endothelial cells: Small-molecule inhibition of the redox function of Ape1. Antioxid. Redox Signal. 2008, 10, 1853–1867. [Google Scholar] [CrossRef]
- Campalans, A.; Marsin, S.; Nakabeppu, Y.; O’Connor, T.R.; Boiteux, S.; Radicella, J.P. XRCC1 interactions with multiple DNA glycosylases: A model for its recruitment to base excision repair. DNA Repair 2005, 4, 826–835. [Google Scholar] [CrossRef]
- Parlanti, E.; Giada, L.; Giovanni, M.; Eugenia, D. Human base excision repair complex is physically associated to DNA replication and cell cycle regulatory proteins. Nucleic Acids Res. 2007, 35, 1569–1577. [Google Scholar] [CrossRef] [Green Version]
- Ranalli, T.A.; Tom, S.; Bambara, R.A. AP endonuclease 1 coordinates flap endonuclease 1 and DNA ligase I activity in long patch base excision repair. J. Biol. Chem. 2002, 277, 41715–41724. [Google Scholar] [CrossRef] [PubMed] [Green Version]
- Nazarkina, Z.K.; Khodyreva, S.N.; Marsin, S.; Lavrik, O.I.; Radicella, J.P. XRCC1 interactions with base excision repair DNA intermediates. DNA Repair 2007, 6, 254–264. [Google Scholar] [CrossRef] [PubMed]
- Dianova, I.I.; Bohr, V.A.; Dianov, G.L. Interaction of human AP endonuclease 1 with flap endonuclease 1 and proliferating cell nuclear antigen involved in long-patch base excision repair. Biochemistry 2001, 40, 12639–12644. [Google Scholar] [CrossRef] [PubMed]
- Illuzzi, J.L.; Wilson, D.M., 3rd. Base excision repair: Contribution to tumorigenesis and target in anticancer treatment paradigms. Curr. Med. Chem. 2012, 19, 3922–3936. [Google Scholar] [CrossRef]
- Gampala, S.; Shah, F.; Zhang, C.; Rhodes, S.D.; Babb, O.; Grimard, M.; Wireman, R.S.; Rad, E.; Calver, B.; Bai, R.-Y.; et al. Exploring transcriptional regulators Ref-1 and STAT3 as therapeutic targets in malignant peripheral nerve sheath tumours. Br. J. Cancer 2021, 124, 1566–1580. [Google Scholar] [CrossRef]
- Gampala, S.; Shah, F.; Lu, X.; Moon, H.-R.; Babb, O.; Umesh Ganesh, N.; Sandusky, G.; Hulsey, E.; Armstrong, L.; Mosely, A.L.; et al. Ref-1 redox activity alters cancer cell metabolism in pancreatic cancer: Exploiting this novel finding as a potential target. J. Exp. Clin. Cancer Res. 2021, 40, 251. [Google Scholar] [CrossRef]
- Chen, Y.; Coorey, N.J.; Zhang, M.; Zeng, S.; Madigan, M.C.; Zhang, X.; Gillies, M.C.; Zhu, L.; Zhang, T. Metabolism dysregulation in retinal diseases and related therapies. Antioxidants 2022, 11, 942. [Google Scholar] [CrossRef]
- Yetkin-Arik, B.; Vogels, I.M.C.; Nowak-Sliwinska, P.; Weiss, A.; Houtkooper, R.H.; Van Noorden, C.J.F.; Klaassen, I.; Schlingemann, R.O. The role of glycolysis and mitochondrial respiration in the formation and functioning of endothelial tip cells during angiogenesis. Sci. Rep. 2019, 9, 12608. [Google Scholar] [CrossRef] [Green Version]
- Du, W.; Ren, L.; Hamblin, M.H.; Fan, Y. Endothelial cell glucose metabolism and angiogenesis. Biomedicines 2021, 9, 147. [Google Scholar] [CrossRef]
- Zhu, J.; Thompson, C.B. Metabolic regulation of cell growth and proliferation. Nat. Rev. Mol. Cell Biol. 2019, 20, 436–450. [Google Scholar] [CrossRef]
- Singh, C. Metabolism and vascular retinopathies: Current perspectives and future directions. Diagnostics 2022, 12, 903. [Google Scholar] [CrossRef]
- Chinchore, Y.; Begaj, T.; Wu, D.; Drokhlyansky, E.; Cepko, C.L. Glycolytic reliance promotes anabolism in photoreceptors. Elife 2017, 6, e25946. [Google Scholar] [CrossRef] [PubMed]
- Winkler, B.S. Glycolytic and oxidative metabolism in relation to retinal function. J. Gen. Physiol. 1981, 77, 667–692. [Google Scholar] [CrossRef] [PubMed]
- Hurley, J.B.; Lindsay, K.J.; Du, J. Glucose, lactate, and shuttling of metabolites in vertebrate retinas. J. Neurosci. Res. 2015, 93, 1079–1092. [Google Scholar] [CrossRef] [PubMed] [Green Version]
- Villa, E.; Ali, E.S.; Sahu, U.; Ben-Sahra, I. Cancer cells tune the signaling pathways to empower de novo synthesis of nucleotides. Cancers 2019, 11, 688. [Google Scholar] [CrossRef] [Green Version]
- Rohlenova, K.; Goveia, J.; Garcia-Caballero, M.; Subramanian, A.; Kalucka, J.; Treps, L.; Falkenberg, K.D.; de Rooij, L.; Zheng, Y.; Lin, L.; et al. Single-Cell RNA sequencing maps endothelial metabolic plasticity in pathological angiogenesis. Cell Metab. 2020, 31, 862–877.e814. [Google Scholar] [CrossRef]
- Khurshed, M.; Molenaar, R.J.; Lenting, K.; Leenders, W.P.; van Noorden, C.J.F. In silico gene expression analysis reveals glycolysis and acetate anaplerosis in IDH1 wild-type glioma and lactate and glutamate anaplerosis in IDH1-mutated glioma. Oncotarget 2017, 8, 49165–49177. [Google Scholar] [CrossRef] [Green Version]
- Fantin, V.R.; St-Pierre, J.; Leder, P. Attenuation of LDH-A expression uncovers a link between glycolysis, mitochondrial physiology, and tumor maintenance. Cancer Cell 2006, 9, 425–434. [Google Scholar] [CrossRef] [Green Version]
- Le, A.; Cooper, C.R.; Gouw, A.M.; Dinavahi, R.; Maitra, A.; Deck, L.M.; Royer, R.E.; Vander Jagt, D.L.; Semenza, G.L.; Dang, C.V. Inhibition of lactate dehydrogenase A induces oxidative stress and inhibits tumor progression. Proc. Natl. Acad. Sci. USA 2010, 107, 2037–2042. [Google Scholar] [CrossRef] [Green Version]
- Parra-Bonilla, G.; Alvarez, D.F.; Alexeyev, M.; Vasauskas, A.; Stevens, T. Lactate dehydrogenase A expression is necessary to sustain rapid angiogenesis of pulmonary microvascular endothelium. PLoS ONE 2013, 8, e75984. [Google Scholar] [CrossRef] [Green Version]
- Sonveaux, P.; Copetti, T.; De Saedeleer, C.J.; Vegran, F.; Verrax, J.; Kennedy, K.M.; Moon, E.J.; Dhup, S.; Danhier, P.; Frerart, F.; et al. Targeting the lactate transporter MCT1 in endothelial cells inhibits lactate-induced HIF-1 activation and tumor angiogenesis. PLoS ONE 2012, 7, e33418. [Google Scholar] [CrossRef] [PubMed] [Green Version]
- Beckert, S.; Farrahi, F.; Aslam, R.S.; Scheuenstuhl, H.; Konigsrainer, A.; Hussain, M.Z.; Hunt, T.K. Lactate stimulates endothelial cell migration. Wound Repair Regen. 2006, 14, 321–324. [Google Scholar] [CrossRef] [PubMed]
- Kumar, V.B.; Viji, R.I.; Kiran, M.S.; Sudhakaran, P.R. Endothelial cell response to lactate: Implication of PAR modification of VEGF. J. Cell. Physiol. 2007, 211, 477–485. [Google Scholar] [CrossRef] [PubMed]
- Logsdon, D.P.; Grimard, M.; Luo, M.; Shahda, S.; Jiang, Y.; Tong, Y.; Yu, Z.; Zyromski, N.; Schipani, E.; Carta, F.; et al. Regulation of HIF1α under hypoxia by APE1/Ref-1 impacts CA9 expression: Dual targeting in patient-derived 3D pancreatic cancer models. Mol. Cancer Ther. 2016, 15, 2722–2732. [Google Scholar] [CrossRef] [Green Version]
- Fishel, M.; Jiang, Y.; Rajeshkumar, N.; Sinn, A.; He, Y.; Shen, C.; Jones, D.; Pollok, K.; Maitra, A.; Kelley, M. Impact of APE1/Ref-1 redox inhibition on pancreatic tumor growth. Mol. Cancer Ther. 2011, 10, 1698–1708. [Google Scholar] [CrossRef] [Green Version]
- Li, Y.; Liu, X.; Zhou, T.; Kelley, M.R.; Edwards, P.; Gao, H.; Qiao, X. Inhibition of APE1/Ref-1 redox activity rescues human retinal pigment epithelial cells from oxidative stress and reduces choroidal neovascularization. Redox Biol. 2014, 2, 485–494. [Google Scholar] [CrossRef] [Green Version]
- Boyer, D.S.; Brigell, M.; Kolli, A.; Rahmani, K.; Lazar, A.; Sooch, M.; Patel, R.; Lazar, E.; Pepose, J.S.; Kelley, M.R. The safety of APX3330, an oral drug candidate for the treatment of diabetic eye disease, in the ongoing masked 24-week ZETA-1 Phase 2 clinical trial. Investig. Ophthalmol. Vis. Sci. 2022, 63, 675-F0129. [Google Scholar]
- Sun, Y.; Zou, H.; Li, X.; Xu, S.; Liu, C. Plasma metabolomics reveals metabolic profiling for diabetic retinopathy and disease progression. Front. Endocrinol. 2021, 12, 757088. [Google Scholar] [CrossRef] [PubMed]
- Zhu, X.R.; Yang, F.Y.; Lu, J.; Zhang, H.R.; Sun, R.; Zhou, J.B.; Yang, J.K. Plasma metabolomic profiling of proliferative diabetic retinopathy. Nutr. Metab. 2019, 16, 37. [Google Scholar] [CrossRef] [Green Version]
- Li, M.; Jin, C.; Xu, M.; Zhou, L.; Li, D.; Yin, Y. Bifunctional enzyme ATIC promotes propagation of hepatocellular carcinoma by regulating AMPK-mTOR-S6 K1 signaling. Cell Commun. Signal. 2017, 15, 52. [Google Scholar] [CrossRef] [PubMed] [Green Version]
- Ma, Q.; Yang, Q.; Xu, J.; Zhang, X.; Kim, D.; Liu, Z.; Da, Q.; Mao, X.; Zhou, Y.; Cai, Y.; et al. ATIC-associated de novo purine synthesis is critically involved in proliferative arterial disease. Circulation 2022, 146, 1444–1460. [Google Scholar] [CrossRef] [PubMed]
- Okamura, S.; Osaki, T.; Nishimura, K.; Ohsaki, H.; Shintani, M.; Matsuoka, H.; Maeda, K.; Shiogama, K.; Itoh, T.; Kamoshida, S. Thymidine kinase-1/CD31 double immunostaining for identifying activated tumor vessels. Biotech. Histochem. 2019, 94, 60–64. [Google Scholar] [CrossRef] [PubMed] [Green Version]
- Bitter, E.E.; Townsend, M.H.; Erickson, R.; Allen, C.; O’Neill, K.L. Thymidine kinase 1 through the ages: A comprehensive review. Cell Biosci. 2020, 10, 138. [Google Scholar] [CrossRef] [PubMed]
- Rosenzweig, A.; Blenis, J.; Gomes, A.P. Beyond the Warburg Effect: How do cancer cells regulate one-carbon metabolism? Front. Cell Dev. Biol. 2018, 6, 90. [Google Scholar] [CrossRef]
- Fishel, M.L.; Wu, X.; Devlin, C.M.; Logsdon, D.P.; Jiang, Y.; Luo, M.; He, Y.; Yu, Z.; Tong, Y.; Lipking, K.P.; et al. Apurinic/apyrimidinic endonuclease/redox factor-1 (APE1/Ref-1) redox function negatively regulates NRF2. J. Biol. Chem. 2015, 290, 3057–3068. [Google Scholar] [CrossRef] [Green Version]
- Cardoso, A.A.; Jiang, Y.; Luo, M.; Reed, A.M.; Shahda, S.; He, Y.; Maitra, A.; Kelley, M.R.; Fishel, M.L. APE1/Ref-1 regulates STAT3 transcriptional activity and APE1/Ref-1-STAT3 dual-targeting effectively inhibits pancreatic cancer cell survival. PLoS ONE 2012, 7, e47462. [Google Scholar] [CrossRef] [PubMed]
- Chun, K.S.; Jang, J.H.; Kim, D.H. Perspectives regarding the intersections between STAT3 and oxidative metabolism in cancer. Cells 2020, 9, 2202. [Google Scholar] [CrossRef]
- Hanselmann, C.; Mauch, C.; Werner, S. Haem oxygenase-1: A novel player in cutaneous wound repair and psoriasis? Biochem. J. 2001, 353, 459–466. [Google Scholar] [CrossRef]
- Xanthoudakis, S.; Smeyne, R.J.; Wallace, J.D.; Curran, T. The redox/DNA repair protein, Ref-1, is essential for early embryonic development in mice. Proc. Natl. Acad. Sci. USA 1996, 93, 8919–8923. [Google Scholar] [CrossRef] [Green Version]
- Luo, M.; He, H.; Kelley, M.R.; Georgiadis, M.M. Redox regulation of DNA repair: Implications for human health and cancer therapeutic development. Antioxid. Redox Signal. 2010, 12, 1247–1269. [Google Scholar] [CrossRef] [Green Version]
- Dobin, A.; Davis, C.A.; Schlesinger, F.; Drenkow, J.; Zaleski, C.; Jha, S.; Batut, P.; Chaisson, M.; Gingeras, T.R. STAR: Ultrafast universal RNA-seq aligner. Bioinformatics 2013, 29, 15–21. [Google Scholar] [CrossRef] [PubMed]
- Liao, Y.; Smyth, G.K.; Shi, W. featureCounts: An efficient general purpose program for assigning sequence reads to genomic features. Bioinformatics 2014, 30, 923–930. [Google Scholar] [CrossRef] [PubMed] [Green Version]
- Dai, N.; Cao, X.J.; Li, M.X.; Qing, Y.; Liao, L.; Lu, X.F.; Zhang, S.H.; Li, Z.; Yang, Y.X.; Wang, D. Serum APE1 autoantibodies: A novel potential tumor marker and predictor of chemotherapeutic efficacy in non-small cell lung cancer. PLoS ONE 2013, 8, e58001. [Google Scholar] [CrossRef] [PubMed]
- McCarthy, D.J.; Chen, Y.; Smyth, G.K. Differential expression analysis of multifactor RNA-Seq experiments with respect to biological variation. Nucleic Acids Res. 2012, 40, 4288–4297. [Google Scholar] [CrossRef] [PubMed]
- Vascotto, C.; Cesaratto, L.; Zeef, L.A.; Deganuto, M.; D’Ambrosio, C.; Scaloni, A.; Romanello, M.; Damante, G.; Taglialatela, G.; Delneri, D. Genome-wide analysis and proteomic studies reveal APE1/Ref-1 multifunctional role in mammalian cells. Proteomics 2009, 9, 1058–1074. [Google Scholar] [CrossRef] [Green Version]
- Ritchie, M.E.; Phipson, B.; Wu, D.; Hu, Y.; Law, C.W.; Shi, W.; Smyth, G.K. limma powers differential expression analyses for RNA-sequencing and microarray studies. Nucleic Acids Res. 2015, 43, e47. [Google Scholar] [CrossRef]
- Wan, C.; Chang, W.; Zhang, Y.; Shah, F.; Lu, X.; Zang, Y.; Zhang, A.; Cao, S.; Fishel, M.L.; Ma, Q. LTMG: A novel statistical modeling of transcriptional expression states in single-cell RNA-Seq data. Nucleic Acids Res. 2019, 47, e111. [Google Scholar] [CrossRef] [Green Version]
- Conway, J.R.; Lex, A.; Gehlenborg, N. UpSetR: An R package for the visualization of intersecting sets and their properties. Bioinformatics 2017, 33, 2938–2940. [Google Scholar] [CrossRef] [Green Version]
- Gu, Z.; Eils, R.; Schlesner, M. Complex heatmaps reveal patterns and correlations in multidimensional genomic data. Bioinformatics 2016, 32, 2847–2849. [Google Scholar] [CrossRef] [Green Version]
- Luo, W.; Brouwer, C. Pathview: An R/Bioconductor package for pathway-based data integration and visualization. Bioinformatics 2013, 29, 1830–1831. [Google Scholar] [CrossRef] [Green Version]
- Mijit, M.; Wireman, R.; Armstrong, L.; Gampala, S.; Hassan, Z.; Schneeweis, C.; Schneider, G.; Zhang, C.; Fishel, M.L.; Kelley, M.R. RelA is an essential target for enhancing cellular responses to the DNA repair/ref-1 redox signaling protein and restoring perturbated cellular redox homeostasis in mouse PDAC cells. Front. Oncol. 2022, 12, 826617. [Google Scholar] [CrossRef] [PubMed]


Disclaimer/Publisher’s Note: The statements, opinions and data contained in all publications are solely those of the individual author(s) and contributor(s) and not of MDPI and/or the editor(s). MDPI and/or the editor(s) disclaim responsibility for any injury to people or property resulting from any ideas, methods, instructions or products referred to in the content. |
© 2023 by the authors. Licensee MDPI, Basel, Switzerland. This article is an open access article distributed under the terms and conditions of the Creative Commons Attribution (CC BY) license (https://creativecommons.org/licenses/by/4.0/).
Share and Cite
Mijit, M.; Liu, S.; Sishtla, K.; Hartman, G.D.; Wan, J.; Corson, T.W.; Kelley, M.R. Identification of Novel Pathways Regulated by APE1/Ref-1 in Human Retinal Endothelial Cells. Int. J. Mol. Sci. 2023, 24, 1101. https://doi.org/10.3390/ijms24021101
Mijit M, Liu S, Sishtla K, Hartman GD, Wan J, Corson TW, Kelley MR. Identification of Novel Pathways Regulated by APE1/Ref-1 in Human Retinal Endothelial Cells. International Journal of Molecular Sciences. 2023; 24(2):1101. https://doi.org/10.3390/ijms24021101
Chicago/Turabian StyleMijit, Mahmut, Sheng Liu, Kamakshi Sishtla, Gabriella D. Hartman, Jun Wan, Timothy W. Corson, and Mark R. Kelley. 2023. "Identification of Novel Pathways Regulated by APE1/Ref-1 in Human Retinal Endothelial Cells" International Journal of Molecular Sciences 24, no. 2: 1101. https://doi.org/10.3390/ijms24021101