Article

Genome-Wide Identification and Characterization of Gibberellic Acid-Stimulated Arabidopsis Gene Family in Pineapple (Ananas comosus)

1
Key Laboratory of Biology and Germplasm Enhancement of Horticultural Crops in South China, Ministry of Agriculture and Rural Areas, College of Horticulture, South China Agricultural University, Guangzhou 510642, China
2
South Subtropical Crop Research Institute, Chinese Academy of Tropical Agricultural Sciences, Zhanjiang 524091, China
3
Tropical Crops Genetic Resources Institute, Chinese Academy of Tropical Agricultural Sciences, Haikou 571101, China
*
Authors to whom correspondence should be addressed.
Int. J. Mol. Sci. 2023, 24(23), 17063; https://doi.org/10.3390/ijms242317063
Submission received: 27 October 2023 / Revised: 26 November 2023 / Accepted: 27 November 2023 / Published: 2 December 2023
(This article belongs to the Collection Feature Papers in Molecular Plant Sciences)

Abstract

:
The gibberellic acid-stimulated Arabidopsis (GASA) gene family plays a crucial role in growth, development, and stress response, and it is specific to plants. This gene family has been extensively studied in various plant species, and its functional role in pineapple has yet to be characterized. In this study, 15 AcGASA genes were identified in pineapple through a genome-wide scan and categorized into three major branches based on a phylogenetic tree. All AcGASA proteins share a common structural domain with 12 cysteine residues, but they exhibit slight variations in their physicochemical properties and motif composition. Predictions regarding subcellular localization suggest that AcGASA proteins are present in the cell membrane, Golgi apparatus, nucleus, and cell wall. An analysis of gene synteny indicated that both tandem and segmental repeats have a significant impact on the expansion of the AcGASA gene family. Our findings demonstrate the differing regulatory effects of these hormones (GA, NAA, IAA, MeJA, and ABA) on the AcGASA genes. We analyzed the expression profiles of GASA genes in different pineapple tissue parts, and the results indicated that AcGASA genes exhibit diverse expression patterns during the development of different plant tissues, particularly in the regulation of floral organ development. This study provides a comprehensive understanding of GASA family genes in pineapple. It serves as a valuable reference for future studies on the functional characterization of GASA genes in other perennial herbaceous plants.

1. Introduction

The GASA gene family is now widely observed in monocotyledonous and dicotyledonous plants [1]. These genes, belonging to the GASA family, are characterized by their cysteine-rich peptides and possess a conserved structural domain primarily comprising 12 cysteines at the C-terminus [2,3]. Over the past few decades, GASA family genes have been identified in numerous plant species, including Arabidopsis thaliana [3], tobacco (Nicotiana tabacum) [4], rice (Oryza sativa) [5], Grapevine (Vitis vinifera L.) [6], potato (Solanum tuberosum) [7], and poplar (Populus trichocarpa) [8]. However, it has yet to be detected in charophytes or bryophytes [9,10].
GASA proteins have been demonstrated to play a role in regulating various plant growth and developmental processes, including fruit maturation and development [11], cell division [12], organ development [13], lateral root development [14], stem elongation [15], and seed germination [6,16]. In Arabidopsis, AtGASA4 promotes the flower development process, while the overexpression of AtGASA5 leads to delayed flowering due to the downregulation of LFY (LEAFY) and FT (FLOWERING LOCUS T) expression and upregulation of FLC (FLOWERING LOCUS C) expression [15]. In the case of petunia, GASA proteins contribute to shoot elongation [17].
Additionally, the GASA gene exhibits tissue-specific expression patterns. For example, the GASA gene is highly expressed during both the ripening and flowering stages of tomato fruit [18]. In rice, the GASR9 gene exhibits an elevated expression in the panicles [19], while in Arabidopsis, GASA1 and GASA2 are prominently expressed in floral buds [20].
Interestingly, GASA family genes play a vital role in responding to stress and hormonal responses. Numerous studies have confirmed their resistance to salt, drought, and high temperatures [21,22]. For instance, the overexpression of FsGASA4 increases tolerance to salt, oxidative stress, and heat in beechnut (Fagus sylvatica) and transgenic Arabidopsis [23]. Similarly, the overexpression of GsGASA1 in soybeans inhibits low-temperature root growth [24]. Moreover, GASA proteins play a crucial role in enhancing plant resistance and its antimicrobial properties [25,26,27]. For instance, following infection with the citrus tristeza virus, citrus leaves exhibit a substantial upregulation of CcGASA4 expression [28]. In Arabidopsis and soybean, the overexpression of the GASA family gene GmSN1 enhances resistance to viral infections [29]. Notably, the antifungal properties of GASA members have been documented in Arabidopsis [30], tomato [31], and alfalfa [9].
Furthermore, GASA genes are influenced by hormones such as gibberellin (GA), abscisic acid (ABA), naphthalene acetic acid (NAA), and salicylic acid (SA). Most GASA genes are involved in the regulation of the gibberellin pathway. For instance, in Arabidopsis, AtGASA4, AtGASA6, AtGASA7, AtGASA8, and AtGASA13 are induced by GA [30,32]. It is worth noting that AtGASA4 is down-regulated in GA-treated cotyledons and leaves but up-regulated in most meristematic tissue regions [3]. Additionally, it has been observed that growth hormones, such as GA, auxin, and cytokinin, can stimulate the expression of the AtGASA4 and AtGASA6 genes in Arabidopsis. Conversely, ABA, SA, and MeJA have been found to exert a repressive effect on the expression of these genes [33]. In Arabidopsis, AtGASA6 acts as a mediator in the signaling pathways of gibberellin, abscisic acid, and glucose during seed germination [34]. In rice, the expression of OsGASR1 and OsGASR2 is induced by GA [5]. OsGASR1 functions as a mediator between brassinosteroid (BR) and GA signaling pathways [35]. Similarly, in Glycine max, GA has been found to up-regulate GmGASA32, which promotes plant height by interacting with GmCDC25, which is a cell cycle-associated protein [36]. ABA has been demonstrated to exert both promotive and suppressive effects on the expression of GASA genes [27,30,37]. In potatoes, the application of ABA induced the expression of StSN2 [27] while repressing the expression of Snakin-3 [7]. In tomatoes, the upregulation of GAST1 transcript levels following GA treatment was partially inhibited by ABA [38]. Furthermore, GA and ABA have been found to effectively enhance the expression of MdGASA during the flowering stage of apple (Malus domestica) [39]. Additionally, MeJA treatment significantly upregulated the transcription of HbGASA7-1, 14, and 16 in Hevea brasiliensis [40].
Pineapple is one of the world’s top cultivated tropical fruits and is known as the queen of fruits. It holds considerable medical and industrial significance due to its fiber content and nutritional value [41,42,43]. Pineapple growth and development are susceptible to adverse conditions such as high temperatures and fluctuation in hormone levels, which can substantially impact both yield and quality. To preserve the commercial value of pineapples, it is crucial to explore the mechanisms governing plant growth, development, and stress response. The GASA gene family plays a crucial role in plant growth and development, but its presence and characteristics in pineapple have remained unexplored. In this study, we employed bioinformatic techniques to identify 15 GASA family genes in pineapple. We analyzed their gene structures, phylogenetic relationships, protein chemical properties, motif compositions, and genomic collinearity. Additionally, we investigated the potential functions of AcGASA genes in pineapple by analyzing pineapple transcriptome data and examining how the expression analysis of GASA genes responds to hormone treatments. The findings of this experiment provide a basis for further studies on the identification of GASA genes in pineapple and other fruit trees.

2. Results

2.1. Physicochemical Properties of the AcGASA Gene

We identified 15 AcGASA family genes in pineapple using BlastP and HMMER, and we assigned them the names AcGASA1-15 based on their order in the chromosome (Table S1). These genes exhibited a range of characteristics (Table 1), with amino acid counts varying from 63 (AcGASA3/6) to 155 (AcGASA8), molecular weights (MWs) ranging from 6.67 (AcGASA6) to 17.39 (AcGASA8) KDa, isoelectric points (pIs) ranging from 8.48 (AcGASA2) to 9.25 (AcGASA8), and their aliphatic index ranging from 17.14 (AcGASA3) to 74.00 (AcGASA9). With the exception of AcGASA2, AcGASA5, and AcGASA7, the hydrophilicity scores (GRAVY) for the other AcGASA genes were negative, indicating their hydrophilic nature. Subcellular localization predictions for all AcGASA genes showed that AcGASA genes were localized to different locations, including the cell membrane, Golgi, nucleus, and cell wall.

2.2. Characterization of the AcGASA Genes

The GASA proteins exhibit conserved C-terminal structural domains, each of which encompasses 12 conserved cysteines [3]. In pineapple, we observed a similar pattern to tobacco, with 12 conserved cysteines in all pineapple GASA proteins, except for AcGASA13 (Figure 1A). This divergence could be attributed to amino acid insertions and deletions [4].
The chromosomal positions of the AcGASA gene in the pineapple are shown in Figure 1B. We identified tandem repeats for AcGASA2, AcGASA3, AcGASA6, and AcGASA7 (Figure 1B). Additionally, the occurrence of more than two GASA genes on a single chromosome was primarily located on LG1\2\17, with most AcGASA genes clustering in regions of a high chromosome density (Figure 1B).
We identified a limited number of conserved motifs in the AcGASA gene, ranging from 2 to 5, which contrasts with our initial expectation of 10 conserved motifs (Figure 1D and Figure S1). Motifs 1 and 2 were present in all GASA proteins, with motif 1 being a component of the GASA structural domain, while motif 3 was found in most GASA proteins. The number of exons varied from two to four, and only seven genes possessed complete 5′ or 3′ UTR regions (Figure 1F).

2.3. Developmental Relationships of Different Species of the GASA Family

In our initial analysis, we analyzed the evolutionary history of GASA genes across 23 different species. We identified 366 GASA genes from 19 species, with some exceptions including Pteridophyta, Basal angiosperms, Monocots, and Dicots (Figure 2). Notably, GASA proteins are prevalent in higher plants but absent in Gymnosperms (Pinus taeda), as well as Chlorophyta (Chlamydomonas reinhardtii and Volvox carteri) and Bryophyta (Physcomitrella patens). These GASA genes exhibited varying numbers across different species, typically falling within the range of 10 to 20. Some species, like Glycine max (46) and Gossypium raimondii (33), featured more GASA proteins. There were 11 GASA proteins in Pteridophyta (Selaginella moellendorffii). Among the monocots, the number of GASA genes ranged from 10 to 18, while in Dicots, this range extended from 14 to 46. In conclusion, Dicots exhibited a higher number of GASA genes compared to monocots.

2.4. Phylogenetic Analysis of the GASA Family Genes

To explore the evolutionary relationships among pineapple (A. comosus), Arabidopsis (A. thaliana), tobacco (N. tabacum), rice (O. sativa), grape (V. vinifera), and maize (Z. mays), we constructed a phylogenetic tree that encompassed a total of 90 GASA genes (Table S2). This evolutionary tree was categorized into three branches, as previously described [4]. Our analysis revealed that Subfamily 1 contained 33 genes, Subfamily 2 had 32 genes, and Subfamily 3 encompassed 25 genes (Figure 3). Within the pineapple species, we identified seven GASA genes (AcGASA2, AcGASA3, AcGASA6, AcGASA7, AcGASA12, AcGASA14, and AcGASA15) in Subfamily 1, four genes (AcGASA4, AcGASA5, AcGASA8, and AcGASA13) in Subfamily 2, and four genes (AcGASA1, AcGASA9, AcGASA10, and AcGASA11) in Subfamily 3. The distribution of pineapple GASA genes was predominant in Subfamily 1, which is like the distribution patterns observed in tobacco and grape GASA genes [4,6]. We observed that AcGASA10 in pineapple clustered on the same small branch as AcGASA9, suggesting a closer evolutionary relationship between these two genes and their potentially shared functional roles.

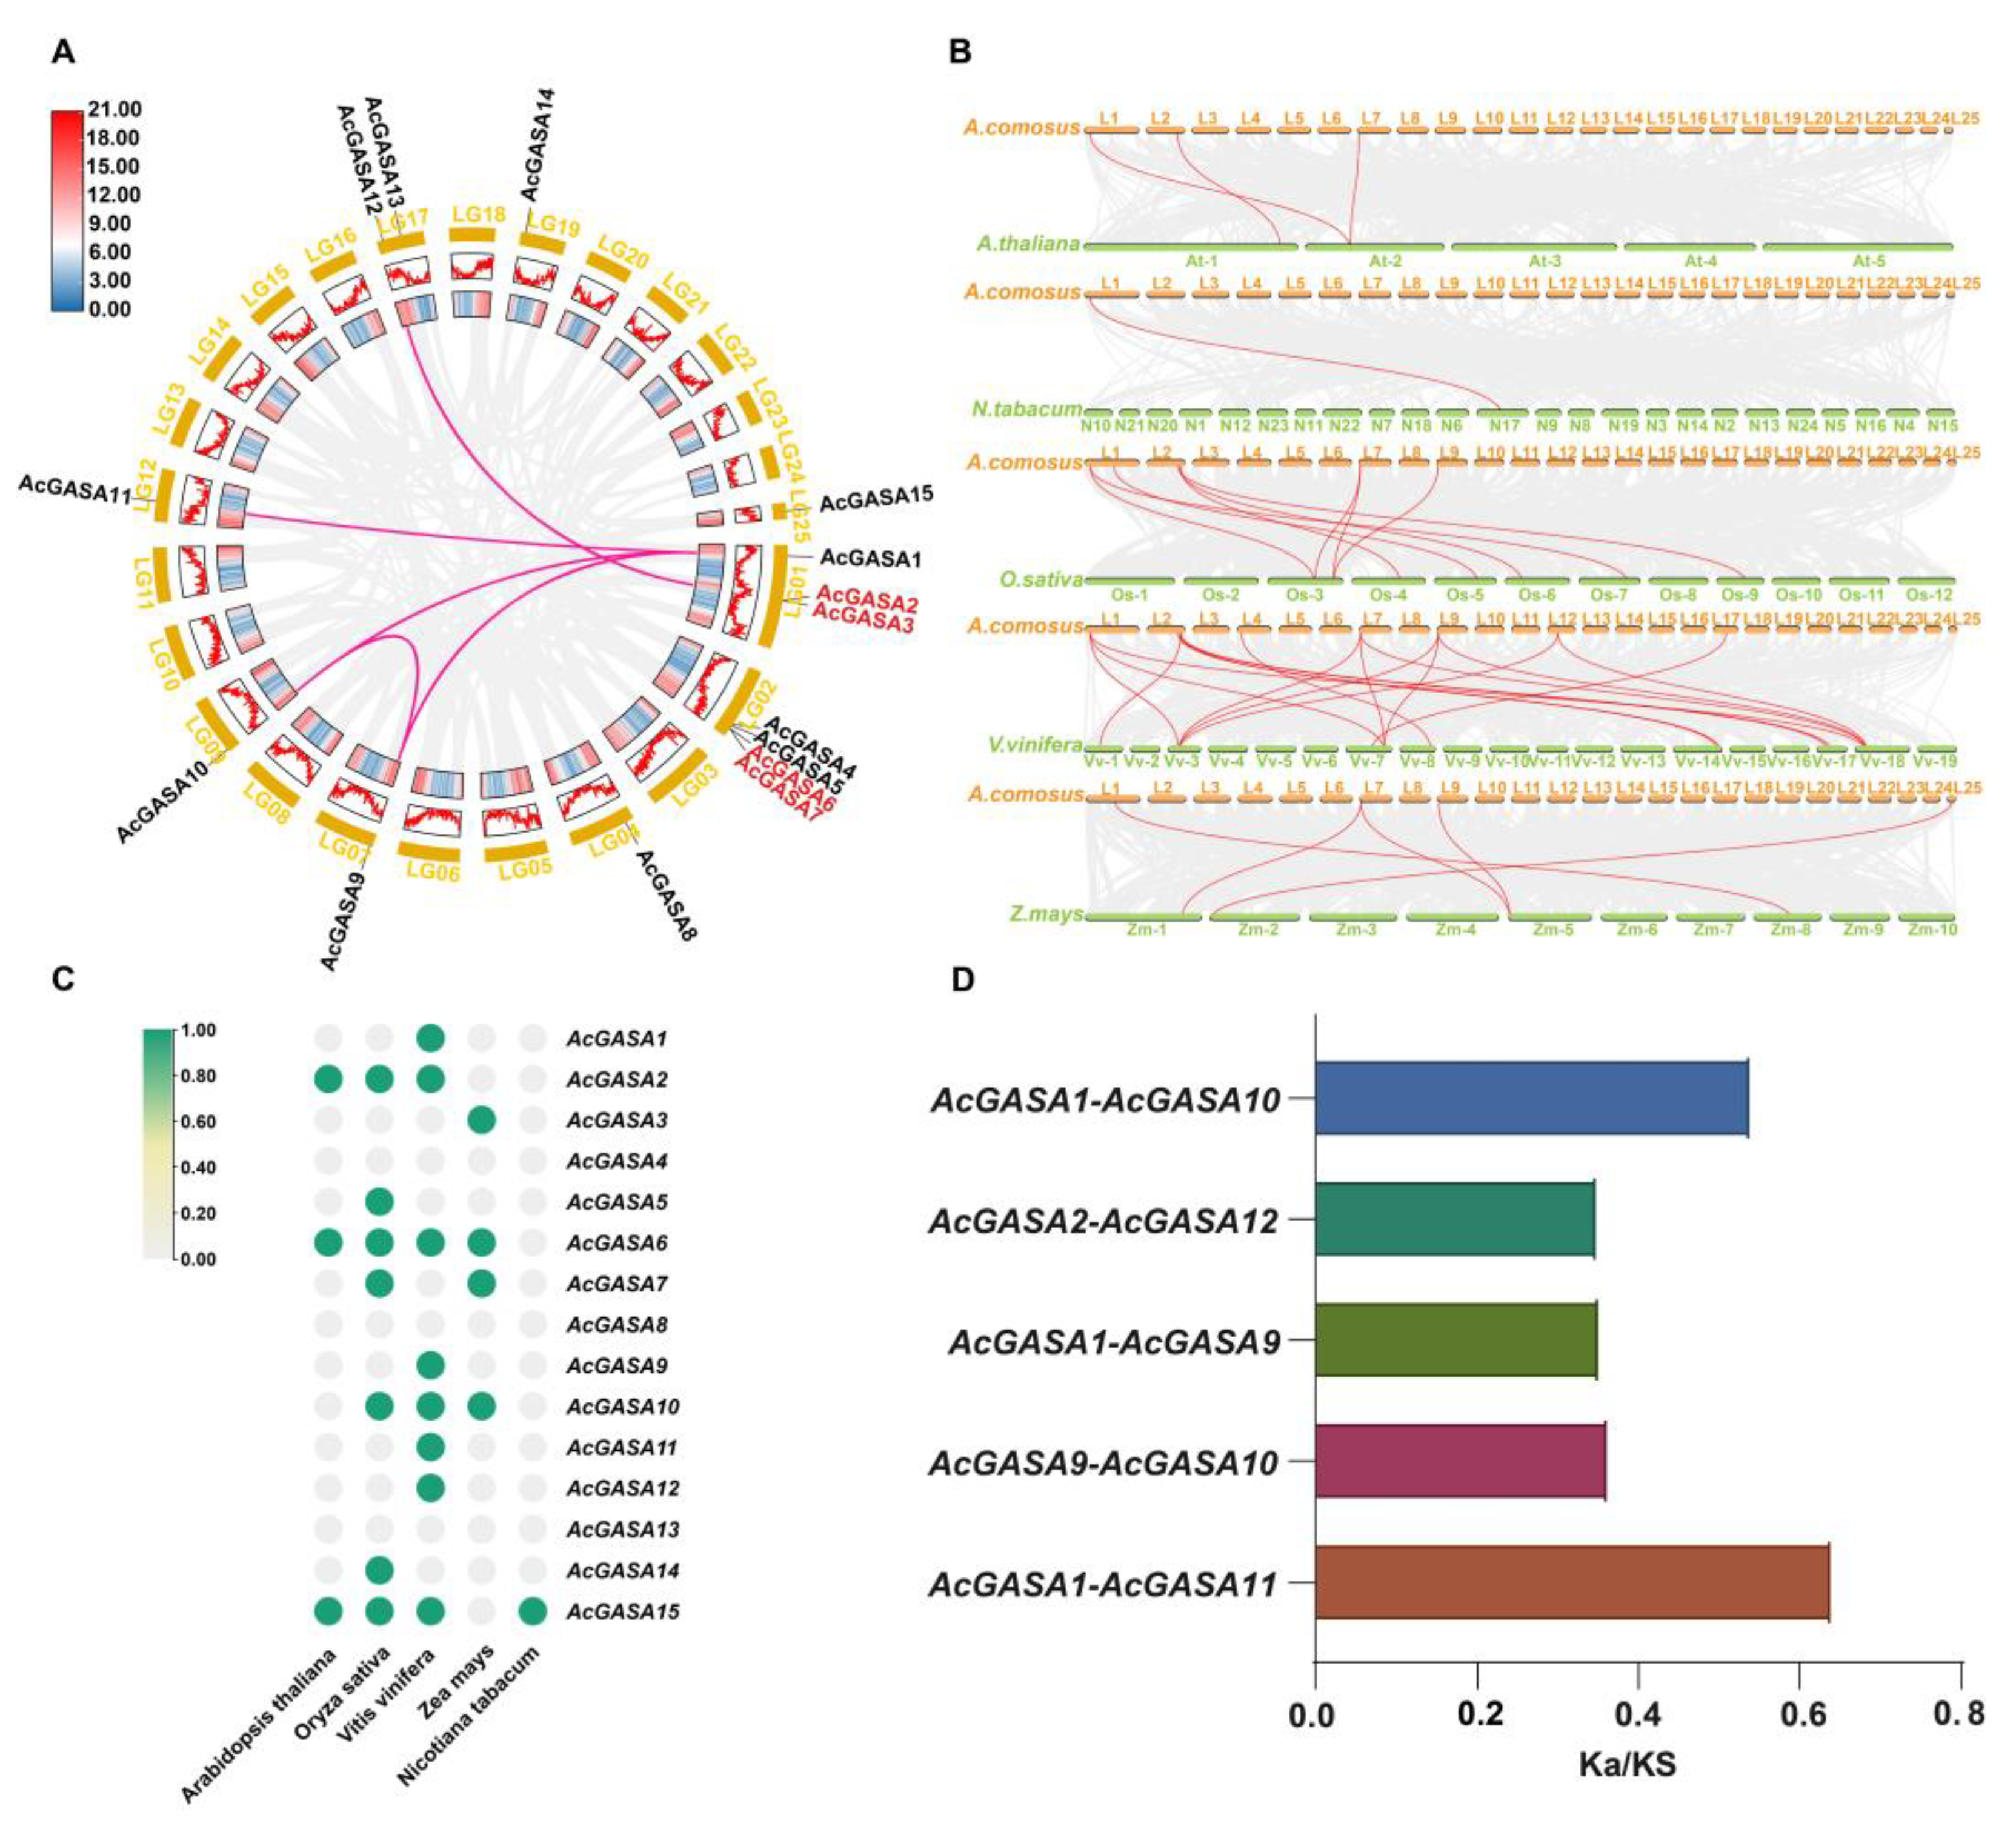
2.5. Origins of the AcGASA Gene

Gene duplication is recognized as a significant driver of species evolution and a direct contributor to the expansion of gene families [44,45,46]. To investigate this phenomenon within the AcGASA gene, we conducted a comprehensive search for both tandem and segmental duplicates and presented the results using a Circos plot (Figure 4A). We observed that both tandem and segmental duplicates within the AcGASA gene family, suggesting their key role in the expansion of this gene family. We identified two pairs of tandem duplicates, comprising AcGASA2 with AcGASA3 and AcGASA6 with AcGASA7, and five pairs of segmental duplicates, involving AcGASA1 with AcGASA10, AcGASA2 with AcGASA12, AcGASA1 with AcGASA9, AcGASA9 with AcGASA10, and AcGASA1 with AcGASA11 (Figure 4A).
To explore the ancestral relationship between pineapple GASA genes and their counterparts in various species, including pineapple, Arabidopsis thaliana (A. thaliana), tobacco (N. tabacum), rice (O. sativa), grape (V. vinifera), and maize (Z. mays), we conducted a comprehensive analysis of collinearity (Table S3). The pineapple GASA genes displayed three collinear gene pairs with Arabidopsis, while tobacco had 1 pair, rice had 9 pairs, grape had 18 pairs, and maize had 5 pairs (Figure 4B). There were no collinear relationships between AcGASA4/8/13 in any of the species in our study (Figure 4C and Table S4). AcGASA1, AcGASA9, AcGASA11, and AcGASA12 exhibited colinear relationships exclusively with the grape species (Figure 4C). On the other hand, AcGASA3, AcGASA5, and AcGASA14 displayed colinear relationships with only one species (Figure 4C). AcGASA6 and AcGASA15 demonstrated the highest degree of colinearity among the identified pairs (Figure 4C). Subsequently, we calculated the Ka/Ks values (nonsynonymous/synonymous substitution ratio) for five duplicated AcGASA gene pairs (Figure 4D and Table S5). All AcGASA gene pairs had Ka/Ks values less than one, indicating that the AcGASA gene family evolved primarily under the influence of purifying selection.

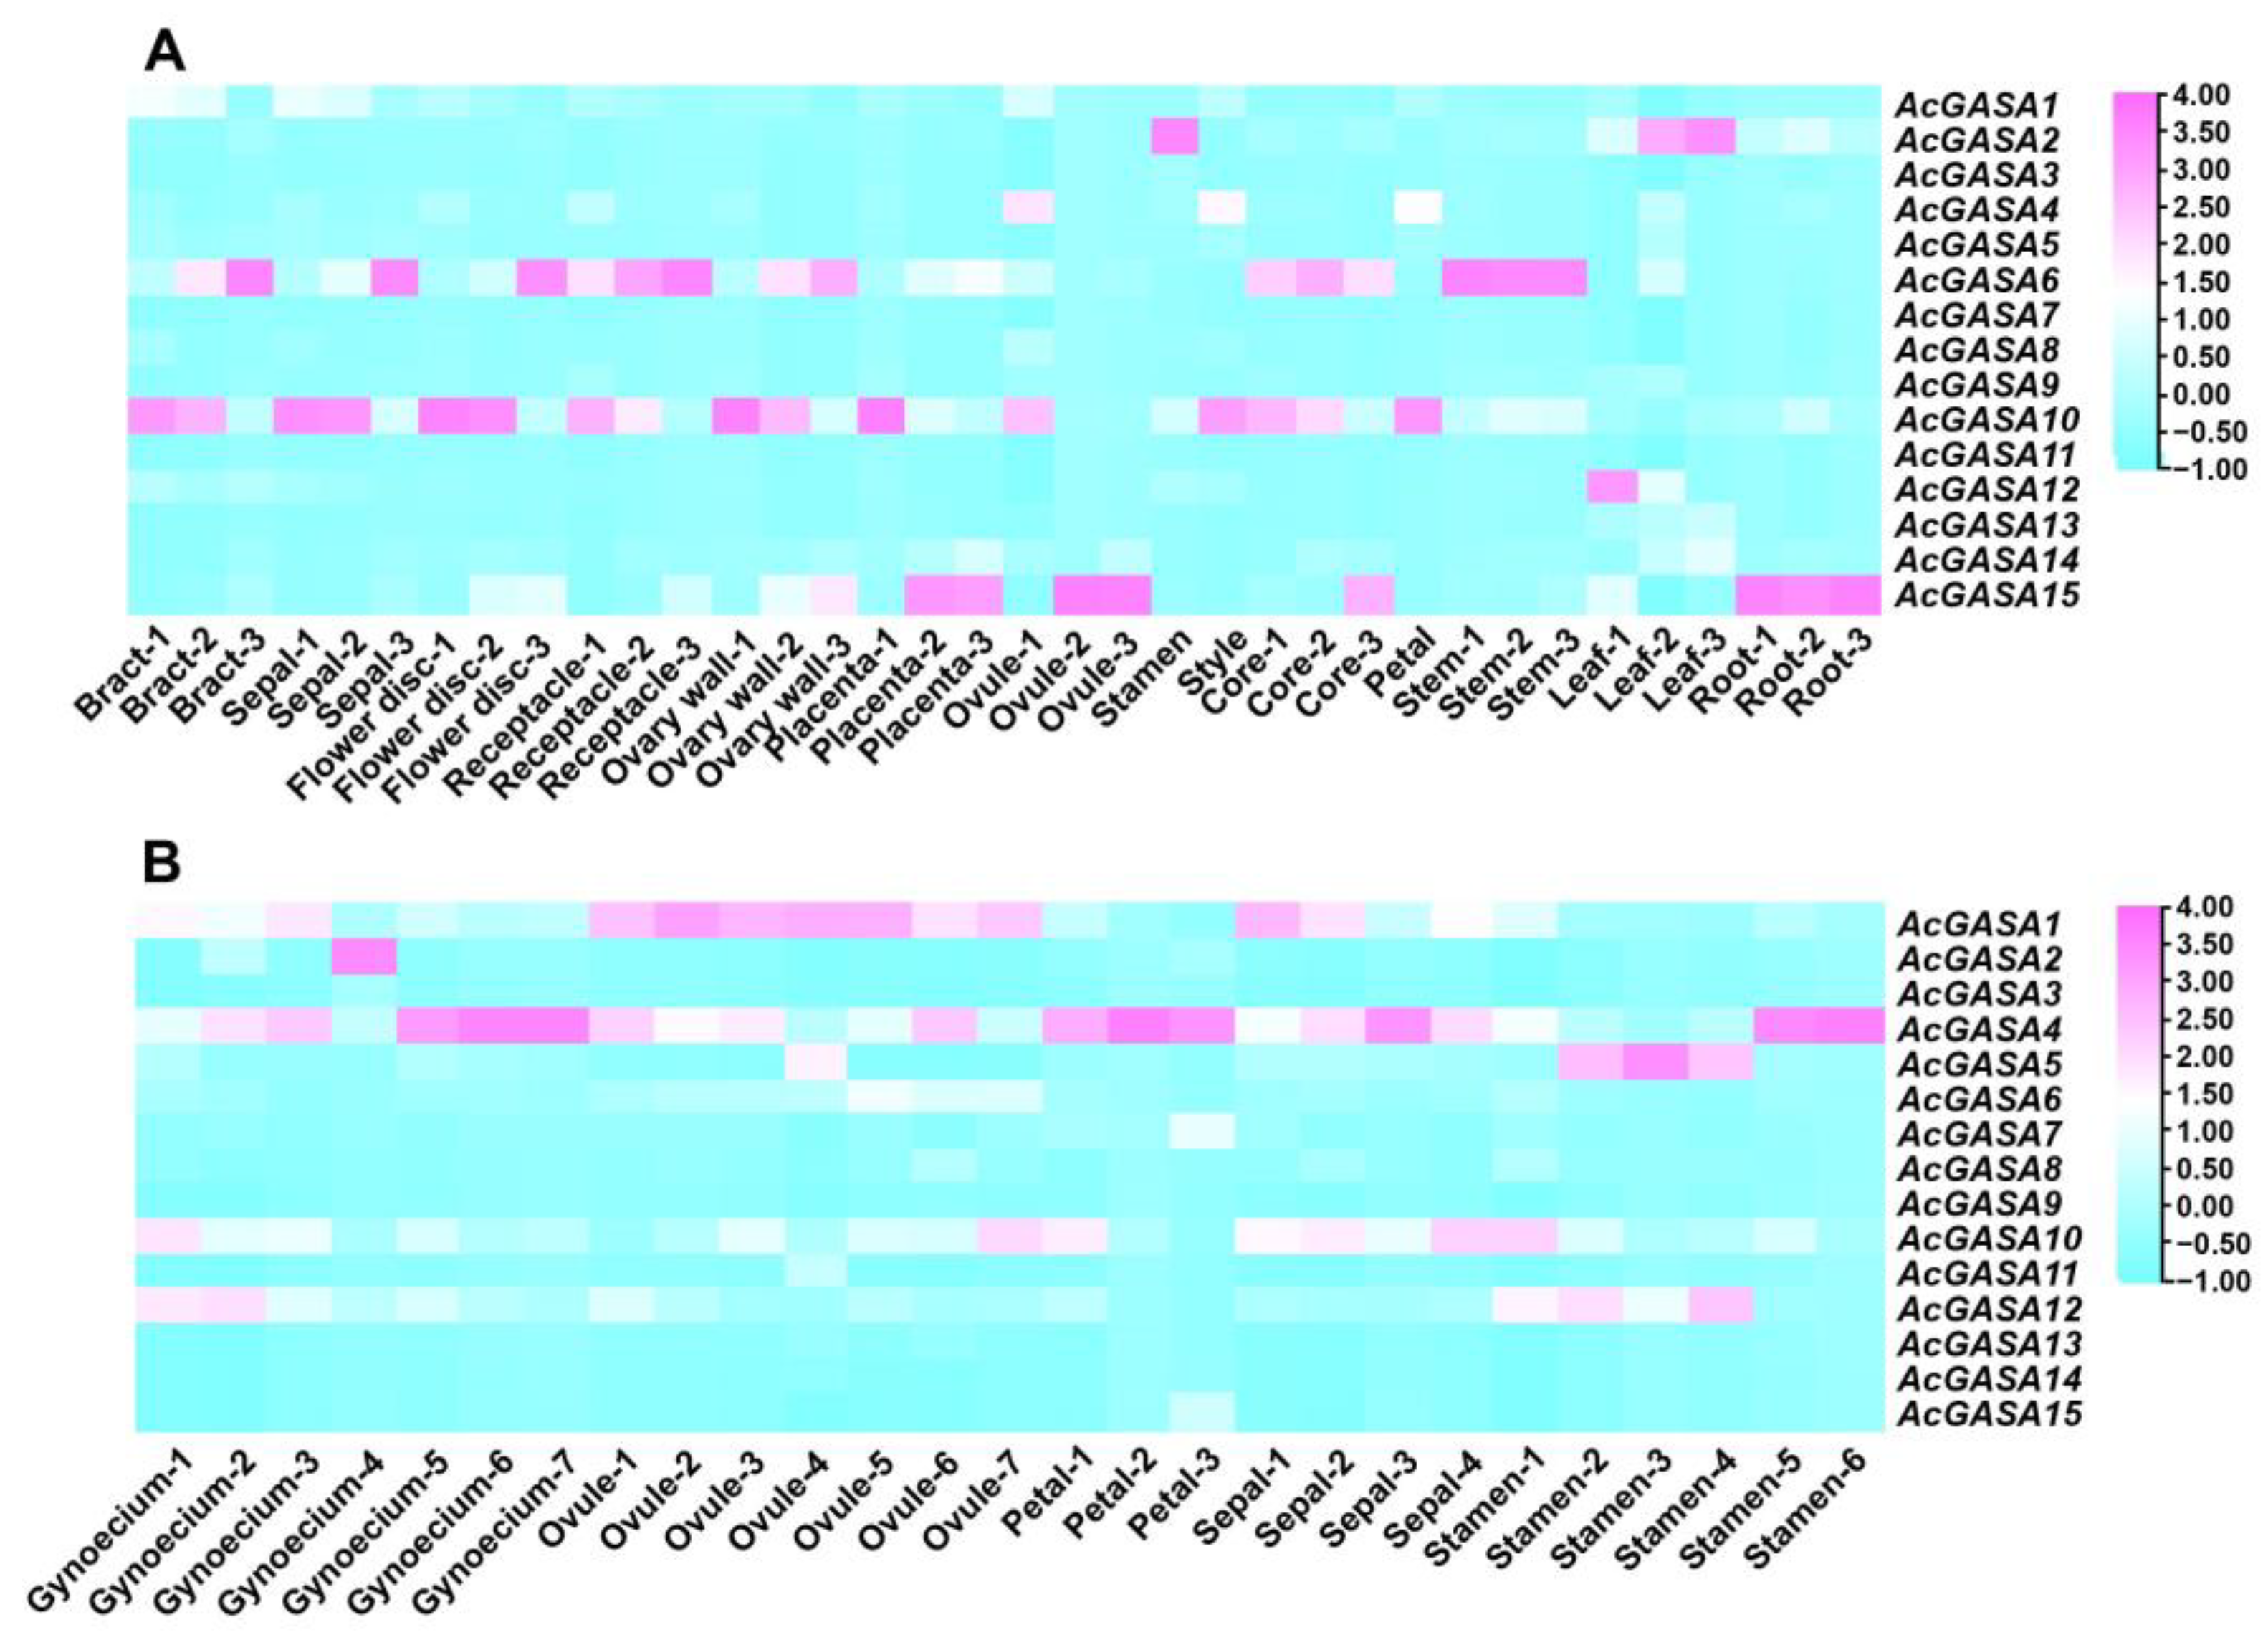
2.6. Expression Profile of AcGASA Gene in Different Tissue Parts of Pineapple

The expression of AcGASA genes was analyzed across various tissue types using pineapple transcriptome data from previous studies [47]. These tissue types included roots, stems, leaves, petals, stamens, pistils, ovules, ovaries, fruiting centers, bracts, sepals, flower discs, pedicels, and placentas (Table S6). Our findings revealed that most of the genes exhibited relatively low expression levels throughout the various pineapple tissues (Figure 5A). However, two genes, AcGASA6 and AcGASA10, showed high expression patterns across multiple pineapple tissues (Figure 5A). AcGASA10 displayed high expression during early pineapple development, whereas AcGASA6 generally exhibited high expression in the later stages of pineapple development (Figure 5A).
We examined transcriptome data from prior studies and produced a gene expression heat map to gain insight into the expression patterns of AcGASA genes within floral organs (Figure 5B and Table S7) [48]. We observed that not all AcGASA genes exhibit high expression within these floral organs (Figure 5B). AcGASA4 is highly expressed in almost the entire floral organ (Figure 5B). Interestingly, AcGASA1 exhibits high expression levels during the entire development of ovules, while AcGASA5 exhibited high expression levels during the initial and middle stages of stamen development (Figure 5B).
To further visualize the expression patterns of AcGASA genes in various tissues, we used cartoon heat maps to display the expression levels of GASA genes (Figure 6 and Table S8). AcGASA1, AcGASA4, AcGASA5, AcGASA10, and AcGASA13 exhibited high expression, primarily in petals and style (Figure 6). AcGASA6, AcGASA7, and AcGASA9 demonstrated high expression in the roots (Figure 6). AcGASA2, AcGASA3, AcGASA11, and AcGASA12 displayed high expression in the stamen (Figure 6). Among the analyzed tissues, AcGASA7 was highly expressed in the core. In the placenta, we observed high expression levels of AcGASA9 and AcGAS14 (Figure 6). In the receptacle, AcGASA7 and AcGASA9 demonstrated a notably high expression (Figure 6). These distinct expression patterns across various tissue sites in pineapples underscore the potential role of AcGASA genes in the developmental processes of pineapples.

2.7. AcGASA Gene Protein Interactions Prediction and miRNA Target Prediction

We conducted a miRNA target prediction analysis for the AcGASA gene (Table S9), using established pineapple miRNAs as a reference [49]. Our analysis identified miRNA target sites in only seven genes, including AcGASA2/5/6/7/12/14/15 (Figure 7A). We observed that the AcGASA5 gene contains five miRNA target sites, with all four located within the 3’ UTR regions, except for one located in the CDS region (Figure 7A). AcGASA15 has a miRNA target site within its 3’ UTR region, while AcGASA7 presents two miRNA target sites in its 5’UTR region (Figure 7A). In AcGASA2/6/12/14, each gene possesses one miRNA target site located in the CDS region (Figure 7A).
An analysis of the predicted protein interaction networks indicates the presence of multiple interactions involving various AcGASA genes (Figure 7B), including serine/threonine protein kinase, phosphatase, and autophagy proteins. The AcGASA genes predicted to engage in interactions are AcGASA1, AcGASA6, AcGASA7, AcGASA10, AcGASA11, and AcGASA15 (Figure 7B). These predicted interactions involve one or more partner proteins. Notably, GASA genes exhibit the following interacting relationships: AcGASA15 with AcGASA11, AcGASA11 with AcGASA6, AcGASA7 with AcGASA1, AcGASA7 with AcGASA10 (Figure 7B). AcGASA6 had the highest number of interactions among the predicted interactions (Figure 7B).

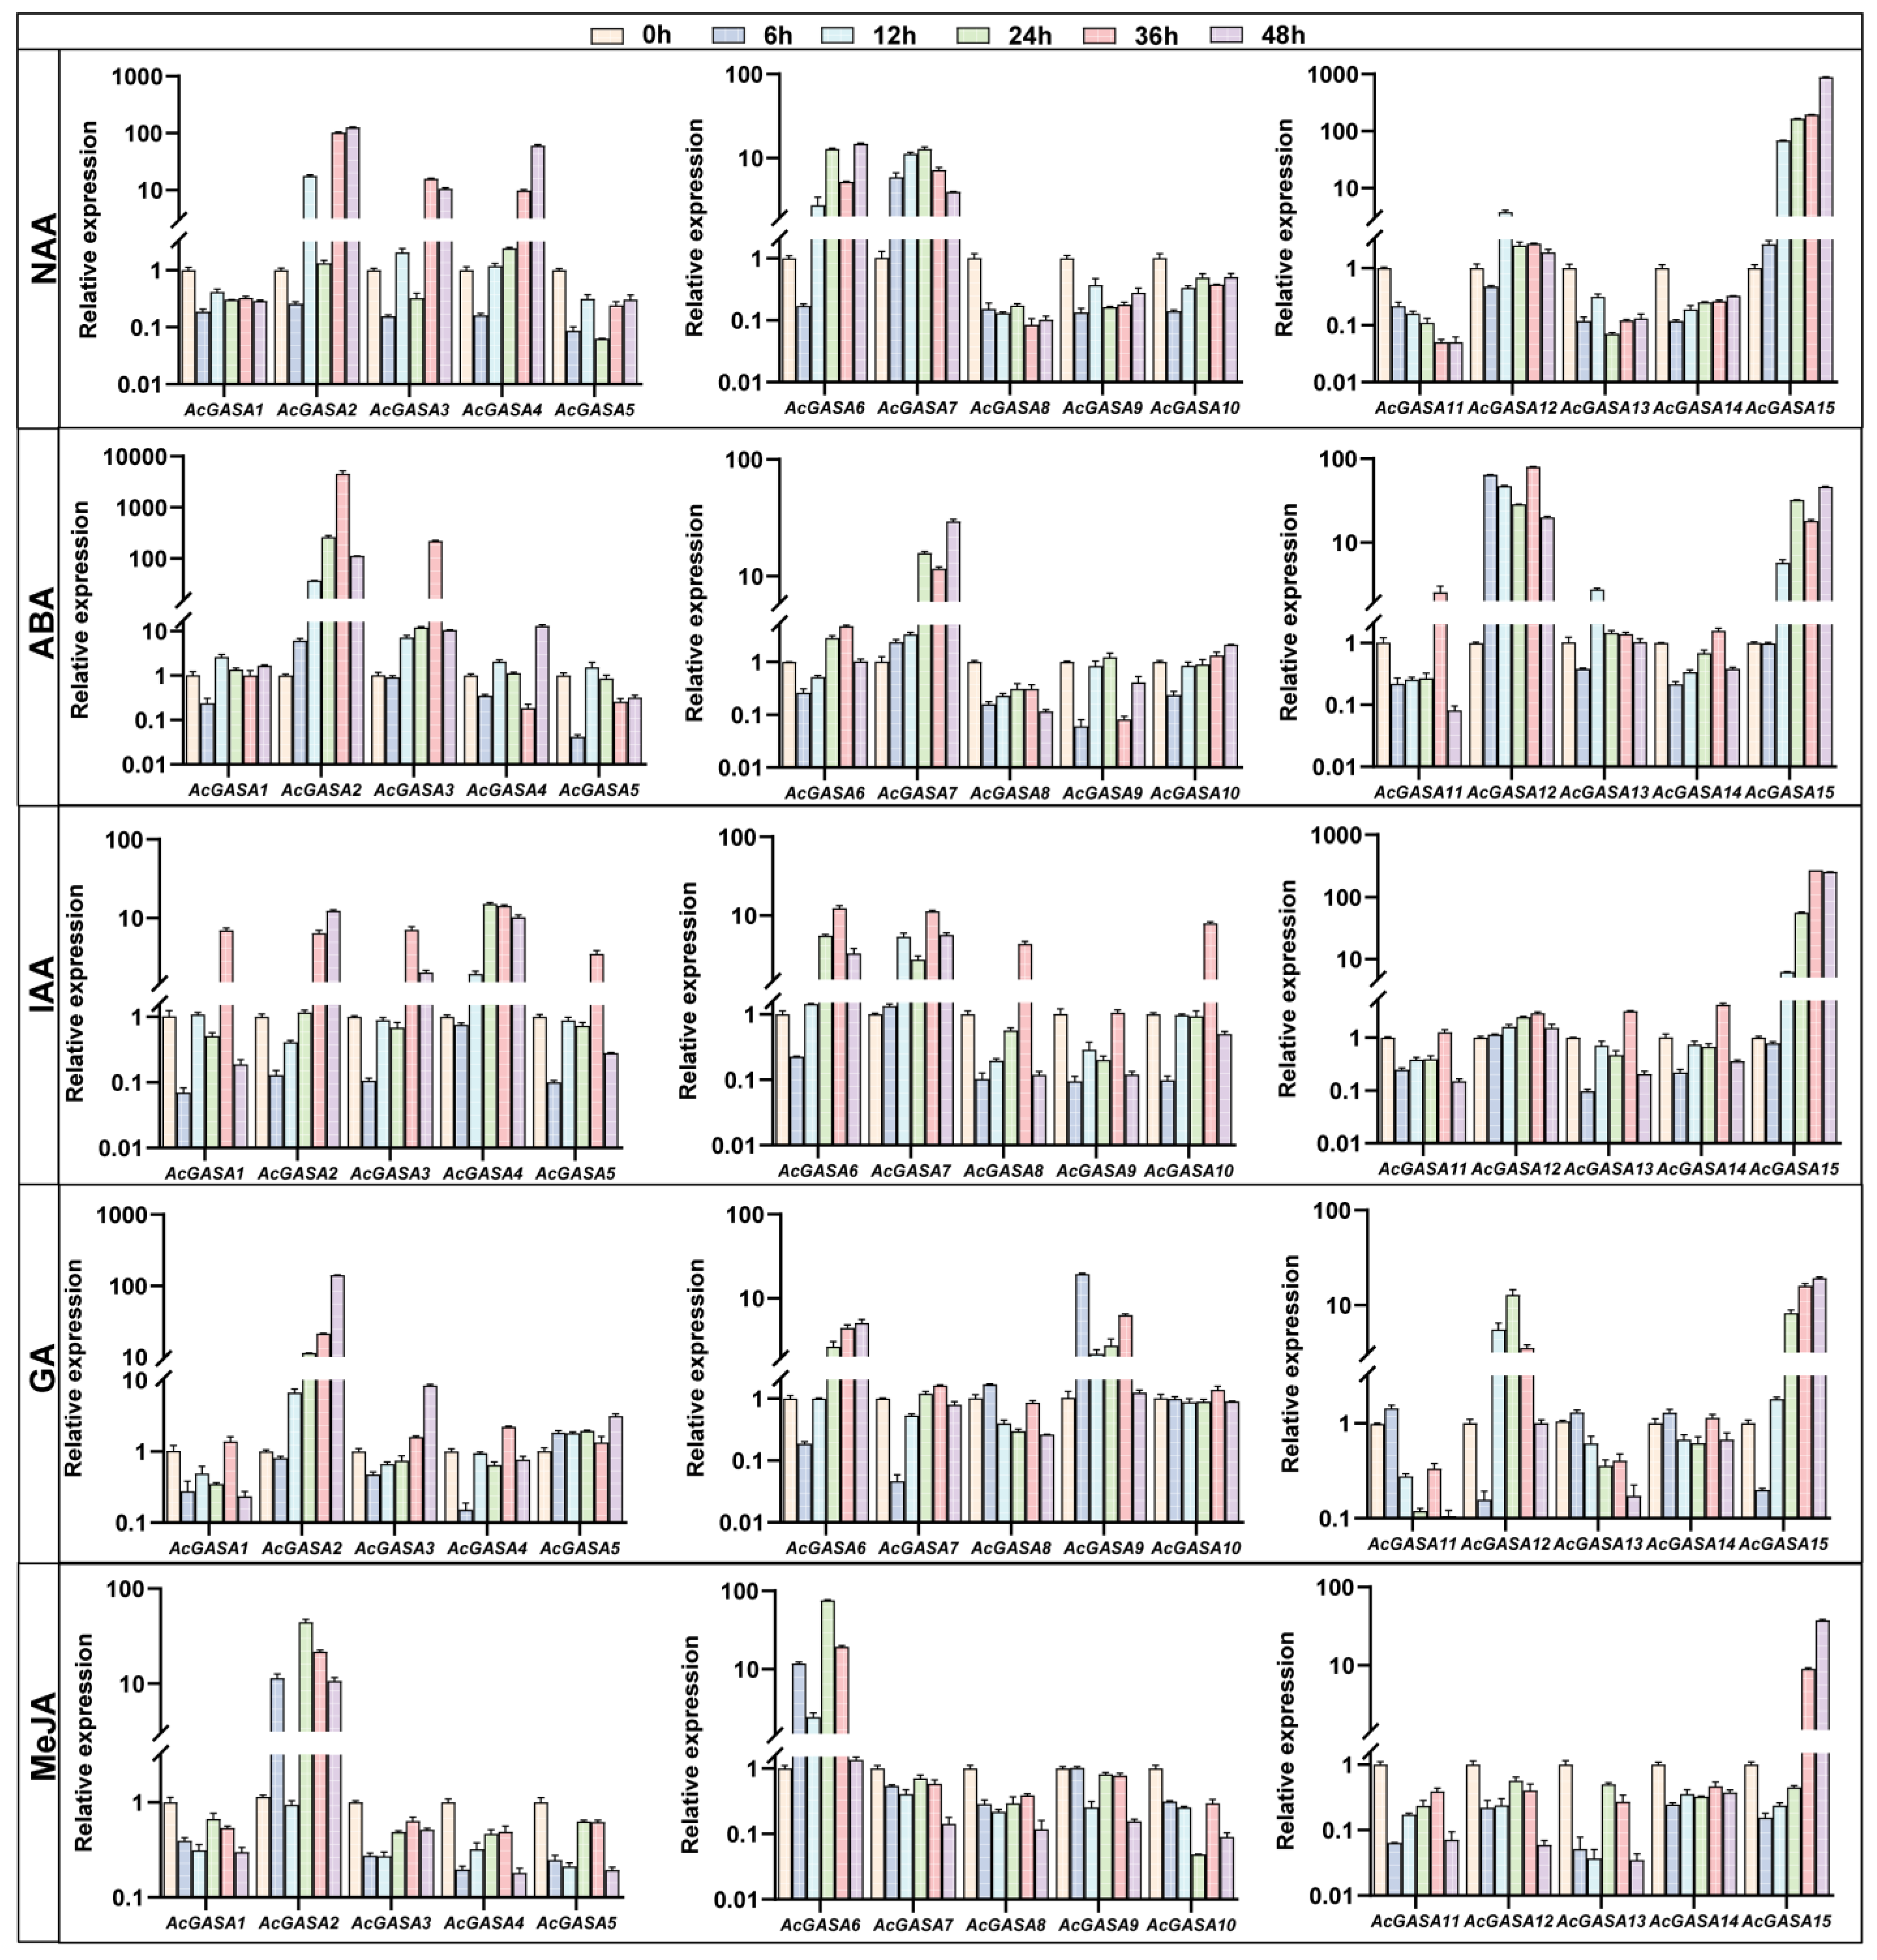
2.8. AcGASA Gene Promoter Analysis and Expression Patterns upon Different Hormone Treatments

To examine the functionality of the AcGASA gene, we conducted an analysis of cis-elements present in the 2000 bp sequence upstream of the Transcription Start Site (TSS) (Table S10). This allowed us to map the distribution of cis-elements across different AcGASA genes in pineapple (Figure 8A). We identified numerous hormone-responsive cis-elements, including the ABRE and CE3 elements, which are responsive to abscisic acid (ABA); the SRE, T/G-box, GCC-box, TGACG-motif, and CGTCA-motif elements responsive to methyl jasmonate (MeJA); the LS7, TCA, and W-box elements responsive to salicylic acid (SA); the ERE element responsive to ethylene; the NDE, D1, D2, and other auxin-responsive elements; and the GARE and P-box elements responsive to gibberellin (GA) (Table S10). In the promoters of AcGASA7 and AcGASA13, GA response elements are absent (Figure 8B) in AcGASAs. Only a few AcGASA genes (AcGASA4, AcGASA5, AcGASA10, and AcGASA14) contain the ethylene response element, while the remaining AcGASA genes possess a significant number of other hormone-responsive elements. Furthermore, we identified various abiotic stress cis-elements, including light-responsive cis-elements (G-Box, LRE, TCT-motif, and MRE), defense and stress-responsive elements (TC-rich repeats, SRE, and CORE), low-temperature-responsive elements (LTR), dehydration-responsive elements (DRE), drought-induced responsive elements (MBS), and anaerobic-induced responsive elements (ARE and AGCAACGGTC motifs) (Figure 8A and Table S10). Additionally, we detected seed expression responsive elements (ACGT motif) and endosperm-specific expression elements (AACA motifs and GCN motifs) (Figure 8A and Table S10).
We observed the significant presence of hormone-related cis-elements within the AcGASA genes. Subsequently, we detected the expression patterns of AcGASA genes in pineapple seedlings subjected to various hormonal treatments (GA, ABA, NAA, IAA, and MeJA) (Figure 9 and Table S11). All the AcGASA genes demonstrated hormone responsiveness. In NAA-treated pineapple seedlings, we observed a mixture of the repression and promotion of AcGASA genes. Specifically, eight genes (AcGASA1/5/8/9/10/11/13/14) exhibited downregulation, while seven genes (AcGASA2/3/4/6/7/12/15) displayed elevated expression levels (Figure 9). Following a 48 h treatment with MeJA, the majority of AcGASA gene expression in pineapple seedlings was repressed (Figure 9). Interestingly, despite the absence of MeJA-related cis-elements within the AcGASA6 gene, the expression notably increased (Figure 8B and Figure 9). After 6 h of IAA treatment, most AcGASA genes showed repression, but most genes also displayed significant upregulation in expression after 36 h (Figure 9). Under GA treatment, a subset of AcGASA genes (AcGASA1/4/6/7/12/15) exhibited an initial phase of repression, but all genes displayed a significant upregulation in their expression, while another portion of genes (AcGASA8/11/13/14) exhibited upregulation followed by repression (Figure 9). We found that the AcGASA2/3/7/12/15 expression was significantly upregulated after ABA treatment (Figure 9). These observations suggest that AcGASA genes play distinct roles under the influence of different hormones.

3. Discussion

Pineapple, a significant tropical fruit globally, is susceptible to various biotic and abiotic stresses that can profoundly impact its yield and quality. GASA proteins play a crucial role in the regulation of plant growth and development. While GASA genes have been extensively studied in several plant species, such as Arabidopsis thaliana [3], rice [5], grape [6], tobacco [4], and citrus [10], their presence in pineapple has not been previously documented. In this study, in pineapple, the GASA genes were identified. Their evolutionary relationships, along with promoter cis-elements and commonalities, were analyzed. Additionally, a comparison of sequence features and analyzed expression patterns was conducted under hormone treatments.
Through bioinformatic methods, we identified 15 GASA genes in pineapple. The pineapple GASA gene was categorized into three major subfamilies (Subfamily 1, Subfamily 2, and Subfamily 3), following the subfamily characterization observed in other species (Arabidopsis thaliana, tobacco) [4], which is a common practice in angiosperms [50]. To analyze the evolutionary relationships of the GASA gene in pineapple, we constructed a phylogenetic tree that included Arabidopsis, rice, maize, tobacco, and grape. Our analysis revealed that the AcGASA gene in pineapple primarily belongs to Subfamily 1, which is similar to the distribution in tobacco and grape [4,6]. This suggests that these genes may have experienced similar selective pressures during evolution, indicating shared biological functions and regulatory networks. To analyze the evolutionary relationships of GASA genes among different species, we constructed evolutionary trees of pineapple with Chlorophytes (2), Bryophytes (1), Pteridophytes (1), Gymnosperms (1), Basal angiosperms (1), Monocots (7), and Dicots (10). The number of GASA genes in pineapple is similar to that of other monocotyledonous plants. By contrast, dicotyledonous plants exhibit a higher number of GASA genes, and they are absent in Chlorophyta (Chlamydomonas reinhardtii, Volvox carteri), Bryophyta (Physcomitrella patens), and Gymnosperm (Pinus taeda). These findings substantiate the prevalence of GASA genes among land plants. Physicochemical analysis revealed that all AcGASA proteins demonstrate basic properties, with the majority being hydrophilic, except for AcGASA2, AcGASA5, and AcGASA7. These findings align with those reported in plum, tobacco, and Arabidopsis [4,51]. This suggests that AcGASA proteins tend to interact with other hydrophilic entities, including aqueous molecules and other proteins. This interplay might affect the functionality, folding conformation, and structural stability of the protein. Previous studies have detected GASA proteins in the cell membrane, cell wall, and nucleus of various plant species, corroborating our subcellular prediction results [5,15,52]. In addition, most GASA structural domains consist of 12 cysteines, which play a pivotal role in maintaining the spatial structure and function of GASA proteins [17,53]. AcGASA13 does not possess the complete set of 12 conserved cysteines (Figure 1A), and the modifications or removal of essential peptide residues can render the GASA structural domains non-functional, leading to a loss of biological function. The limited variation in the number and arrangement of the 12 cysteines across different species throughout evolution strongly indicates their crucial role in plant activity.
We observed that the majority of AcGASA genes feature conserved motifs 1 and 2 (Figure 1D). The remaining conserved motifs seem relatively scarce. For instance, conserved motif 4 is exclusively found in AcGASA7/12, while conserved motif 5 is specifically present in AcGASA8/13. These alterations in conserved motifs imply that the function of the AcGASA gene exhibits evolutionary diversity. The AcGASA gene exhibits variations in the number of introns, ranging from 1 to 3 introns, and in exons, with 2–4 per gene. This suggests that changes in exons and introns could be attributed to chromosome modifications [54,55]. We hypothesized that variations in the number and length of introns and exons could contribute to divergent biological functions of the AcGASA gene. However, the intron numbers and lengths in the pineapple GASA genes were not conserved, even within the same subfamily (Figure 1F). Additionally, the AcGASA genes were found to be randomly distributed throughout the genome (Figure 1B). These observations suggest the absence of recent duplication events in the GASA gene family and indicate that the expansion of this gene family is a result of earlier duplication events.
Segmental, tandem and genome-wide duplications are significant driving forces shaping the evolution of gene families [45,56]. Segmental and tandem duplications exert a more pronounced influence on the functional evolution of gene families [57]. In the case of the AcGASA gene family in pineapple, both segmental and tandem duplications are prominent, with the identification of five sets of segmental duplications and two sets of tandem duplications. The prevalence of segmental duplications aligns with previous studies that highlight their higher occurrence in gene families compared to tandem duplications [58]. Furthermore, when examining the collinearity of GASA genes between pineapple, Arabidopsis thaliana, tobacco, maize, rice, and grape, it becomes evident that there is a greater number of covariant gene pairs between pineapple and grape. This observation suggests a closer evolutionary relationship between pineapple and grape in comparison to the other plants studied. Interestingly, pineapple and tobacco exhibit only one pair of collinear genes, implying a higher occurrence of genetic rearrangement events or a more extended period of divergence during their evolution. By identifying nonredundant GASA genes with the collinear relationship between pineapple and other five species, we found that AcGASA1/9/11/12 has direct homologs exclusively in grapes, while AcGASA3 has direct homologs in maize and AcGASA5/14 has direct homologs in rice. This indicates the variability in the preservation of GASA gene family members among species with distinct evolutionary backgrounds. The calculation of Ka/Ks ratios for the AcGASA genes in pineapple reveals that all of them fall below one, implying that the pineapple GASA genes were subjected to robust purifying selection throughout their evolutionary history.
The analysis of cis-elements in gene promoter regions plays a pivotal role in understanding gene function [59]. Within the AcGASA promoter of pineapples, we identified numerous elements that respond to hormones, promote growth and development, and respond to stress. Among these elements, GA, MeJA, SA, and auxin response elements are highly abundant in the promoter region of the AcGASA gene. Notably, we observed that the dehydration response element, sucrose response element, and sucrose response element were identified in only a limited number of genes, indicating that certain AcGASA genes can exhibit specific responses and regulatory mechanisms toward these three stresses. Conversely, other genes may rely on distinct regulatory pathways or possess alternative response elements. This underscores the diversity and variability inherent within gene families, highlighting the intricate regulatory networks involved in plant adaptation to stress conditions. Upon treating pineapple seedlings with various hormones, we observed varying degrees of gene regulation across all genes. The AcGASA2 and AcGASA15 genes exhibited significant expression levels 48h after hormone treatment (NAA, IAA, ABA, GA, and MeJA), and these findings can serve as a reference point for future AcGASA gene studies. The response of GASA genes to ABA differs across different species. In Arabidopsis, ABA leads to an increase in the expression of AtGASA2/3/5/14, while it causes a decrease in the expression of AtGASA7/9 [30]. In Nicotiana tabacum, NtGASA1/2/3/4/8/9/13/14 is induced by ABA, as is PmGASA1/2/6/11/12/14 in Prunus mume [3,51]. In our study with pineapple seedlings, we found that ABA strongly upregulates AcGASA2/3/4/6/7/10/12/13/15 over a period. Interestingly, AcGASA8 contained 4ABA-responsive elements but saw a significant inhibition of its expression. In Arabidopsis, AtGASA1 is induced by GA but inhibited by ABA [37]. We observed a similar pattern in pineapple seedlings. For example, after 6 h of hormone treatment, GA induced the expression of AcGASA11, which was subsequently inhibited by ABA. In contrast to the response in other species, GA treatment induced the GASA gene in potato and tobacco seedlings. However, in pineapple seedlings, only AcGASA2/4/6/9/12/15 was highly induced over time [4,7]. While NAA significantly reduced OsGASA gene expression in rice seedlings, only specific genes (AcGASA5/8/9/10/13/14) were downregulated in pineapple [18]. Additionally, we found that most AcGASA genes were inducible by IAA, with only AcGASA2/6/15 exhibiting a significant induction in response to MeJA. This distinct expression pattern under hormone treatment in the AcGASA gene in pineapple sets it apart from other species, indicating the crucial function of AcGASA genes in regulating the growth and development of pineapples.
In addition to its hormonal responses, AcGASA plays a crucial role in the growth and development of various plant tissues. To clarify the functions and roles of the AcGASA gene across various parts of pineapple, we conducted an examination of its expression patterns in various tissue organs. Some genes, like AcGASA6 and AcGASA10, displayed universal expression patterns similar to NtGASA11 and NtGASA17 in tobacco [4]. Some studies have reported that GASA genes have flower-inducing effects in various plant species, such as petunia, rice, cotton, and Gerbera hybrida [17,60,61,62]. Most AcGASA genes exhibit significantly higher expression levels in their floral organ tissues, similar to the patterns in NtGASA genes in tobacco. We identified genes with a notably high expression in specific tissue types, such as AcGASA6, AcGASA7, AcGASA15 in the roots, AcGASA2 and AcGASA12 in the leaves, and AcGASA6 and AcGASA7 in fruit pulp. The diverse expression of the AcGASA gene across various tissues indicates distinct functions in the growth and development of pineapple plants.

4. Materials and Methods

4.1. Protein Sequence Source

The genome sequences used in this study were obtained from the Pineapple Genome Project [63]. The sequences of GASA proteins from Arabidopsis thaliana, rice, grape, and tobacco were acquired in previous studies [4]. The protein sequences of Physcomitrella patens and Pinus taeda were retrieved from the PlantGenIE database (https://plantgenie.org/, accessed on 5 October 2023). Protein sequences from additional species, including corn and soybean, were obtained through Phytozome (http://www.phytozome.net/, accessed on 5 October 2023).

4.2. Identification and Classification of GASA

For characterizing the GASA gene in pineapple, we employed two distinct methods. We retrieved the Hidden Markov Model for the GASA structural domain (PF02704) from the Pfam database (http://pfam.xfam.org/, accessed on 7 October 2023) and subsequently queried the pineapple protein file using TBtools and applying an E-value of 1e-10 [64]. Next, we conducted a focused BlastP search, utilizing Arabidopsis GASA protein sequences against pineapple protein sequences, leading to the identification of 15 potential GASA candidates. To confirm the presence of GASA-conserved structural domains, we utilized both Batch CD-Search and SMART programs. We applied this methodology to detect the GASA gene in 19 additional species, including corn and soybean. Further analyses involved assessing the physicochemical properties of AcGASA genes/proteins using the ExPASy ProtParam database (https://web.expasy.org/protparam/, accessed on 7 October 2023).
Additionally, we predicted the subcellular localization of the AcGASA gene through Plant-mPLoc (http://www.csbio.sjtu.edu.cn/bioinf/plant-multi/, accessed on 7 October 2023). Finally, we analyzed the evolutionary relationships of 23 species by utilizing the online website TimeTree (http://timetree.org/, accessed on 7 October 2023) and calculated the number of GASA genes in each species.

4.3. Gene Structure and Conserved Motif Analysis of the AcGASA Gene

We employed MEME to analyze the conserved motifs within the AcGASA protein [65]. To further understand the genomic context, we analyzed the pineapple genome annotation using TBtools [63,64]. Subsequently, TBtools were used to represent the exons, introns, and conserved motifs in AcGASA.

4.4. Collinear Analysis and Chromosomal Location of the AcGASA Gene

To determine the position of the AcGASA gene on the pineapple chromosome and highlight tandem and segmental repeats, we conducted a collinear analysis using the "One Step MCScanX Wrapper" plug-in on TBtools [64]. This analysis revealed gene pairs displaying both segmental and tandem duplications, which were depicted in a Circos plot. Moreover, we conducted a collinear analysis of pineapple with other species, such as tobacco, maize, rice, grape, and Arabidopsis thaliana, using TBtools for visualization.

4.5. Analysis of the Cis-Elements of the AcGASA Gene Promoter

To conduct a comprehensive investigation into the functional attributes of the AcGASA gene, we obtained a 2000 bp promoter sequence upstream of the gene’s TSS (Transcription Start Site) from Phytozome (http://www.phytozome.net/, accessed on 13 November 2023). These promoter sequences were then submitted to the online platform PlantPAN 4.0 (http://plantpan.itps.ncku.edu.tw/plantpan4/promoter_analysis.php, accessed on 13 November 2023) for prediction and analysis [59]. Finally, we employed Tbtools to select and visualize the pertinent cis-elements.

4.6. Protein Interaction Network and miRNA Target Prediction of the AcGASA Gene

We submitted all AcGASA gene protein sequences to the online STRING website (http://string-db.org, accessed on 10 October 2023). Within this network, pineapple was selected as the reference, and only the highest-scoring proteins with interactions were retained. Those without protein interactions were subsequently removed.
We used the published pineapple miRNA as a reference [39], submitted the AcGASA sequence to the online website psRNATarget (https://www.zhaolab.org/psRNATarget/, accessed on 10 October 2023) for predicting miRNA targets, and finally visualized it using TBtools [66].

4.7. Expression Map of the AcGASA Gene in Different Pineapple Tissues

From published studies, we obtained transcriptomic data from various tissues of pineapple [47,48]. These transcriptome datasets were downloaded from NCBI and associated with project numbers PRJEB38680 and PRJNA483249. The expression levels of the AcGASA gene were analyzed using FPKM values, and we generated an expression heatmap and cartoon heatmap using TBtools [64].

4.8. Hormone Treatment of Pineapple Seedlings and AcGASA Expression Analysis

Pineapple seedlings underwent treatment with 0.1 mM indole-3-acetic acid (IAA), abscisic acid (ABA), NAA, GA, and MeJA. Samples were collected at 0, 6, 12, 24, 36, and 48 h. Each sample was treated with liquid nitrogen and promptly stored at −80 °C after collection.
The total RNA extraction was carried out using the FastPure Universal Plant Total RNA isolation Kit (Vazyme, Nanjing, China). The RNA quality was assessed through agarose gel electrophoresis, and RNA concentration was determined using a Nanodrop ND-1000spectrophotometer. The first-strand cDNA synthesis was obtained from total RNA using the All-in-One First-Strand Synthesis MasterMix (Guangzhou XinKaiLai Biotechnology Co, Guangzhou, China). Primer design was accomplished using the online URL Primer3Plus (https://www.bioinformatics.nl/cgi-bin/primer3plus/primer3plus.cgi, accessed on 13 October 2023). The qRT-PCR analysis of the AcGASA gene was performed on a Roche LightCycler 480 instrument using SYBR Green Master Mix (YEASEN). The total qRT-PCR reaction system consisted of 10 μL, comprising 5 μL of the Hieff qPCR SYBR Green Master Mix, 0.4 μL of the Forward and Reverse Primer (10 μM), 1 μL of the cDNA template, and 3.6 μL of ddH2O. The reaction parameters were set at 95 °C for 5 min, followed by 40 cycles of 95 °C for 10 s and 60 °C for 30 s. Each reaction was performed with three technical replicates. Relative expression was calculated using the 2−ΔΔCt method, with pineapple β-actin serving as the internal reference gene. The primers used for qRT-PCR experiments are shown in Table S12.

5. Conclusions

In this study, we identified and analyzed 15 GASA genes in pineapple, including their chromosomal locations, gene structures, conserved motifs, and the physicochemical properties of the corresponding proteins. The phylogenetic tree analysis revealed three main branches. The subcellular localization prediction of the AcGASA gene indicated its presence in multiple cellular compartments, including the cell membrane, Golgi apparatus, nucleus, and cell wall. Collinearity analysis demonstrated that segmental and tandem duplications played a crucial role in expanding the pineapple GASA gene family, and purifying selection was the primary evolutionary force acting on the AcGASA gene. Promoter analysis identified a diverse array of cis-elements, including hormone-responsive and stress-responsive elements. In particular, the AcGASA gene exhibited a significant abundance of hormone response elements, such as GA response elements, ABA response elements, SA response elements, and MeJA response elements. Furthermore, we examined the spatiotemporal expression patterns of the AcGASA gene in various pineapple organs and during hormonal responses. Our results show the distinct expression patterns of the AcGASA gene during the development of different tissues in pineapple, particularly during floral organ tube development. These findings suggest that AcGASA genes are differentially regulated by phytohormones such as GA, NAA, IAA, MeJA, and ABA. This study provides valuable insights into the role and regulatory mechanisms of AcGASA genes in pineapple growth and development and can serve as a reference for future investigations on the functional characteristics of GASA genes in other perennial herbaceous plant species.

Supplementary Materials

The following supporting information can be downloaded at: https://www.mdpi.com/article/10.3390/ijms242317063/s1.

Author Contributions

Conceptualization, M.Y., A.L. and Y.H.; methodology, M.Y., W.Y., H.L. and Y.L.; software, W.Z., M.Y., Y.L. and J.W.; validation, M.Y., J.W. and Z.Z.; formal analysis, W.Y. and W.Z.; resources, A.L., W.S. and C.L.; data curation, C.L., H.L., W.S. and Z.Z.; writing—original draft preparation, M.Y. and A.L.; writing—review and editing, Y.H. and A.L.; visualization, M.Y., A.L. and C.L.; supervision, Y.H.; project administration, Y.H.; funding acquisition, Y.H. All authors have read and agreed to the published version of the manuscript.

Funding

This research was funded by the Seed Industry Revitalization Project of Provincial Rural Revitalization Strategy Special Funds in Guangdong Province in 2022 (2022-NPY-00-031), the Major Science and Technology Program of Hainan Province (ZDKT2021014), and the National Natural Science Foundation of China (No. 32272677).

Institutional Review Board Statement

Not applicable.

Informed Consent Statement

Not applicable.

Data Availability Statement

The datasets used in this study are publicly available. All analyzed data can be found in the article or in the Supplementary Material.

Acknowledgments

The authors thank Jianye Chen (South China Agricultural University), Jingyao Xie (Guangdong Eco-Engineering Polytechnic), and Junhu He (Chinese Academy of Tropical Agricultural Sciences) for helpful discussions.

Conflicts of Interest

The authors declare no conflict of interest.

References

  1. Nahirñak, V.; Almasia, N.I.; Hopp, H.E.; Vazquez-Rovere, C. Snakin/GASA Proteins. Plant Signal. Behav. 2012, 7, 1004–1008. [Google Scholar] [CrossRef]
  2. Hou, D.; Bai, Q.; Bai, Q.; Li, J.; Xie, L.; Li, X.; Cheng, Z.; Gao, J. The Gibberellic Acid-Stimulated Transcript Gene Family in Moso Bamboo: A Genome-Wide Survey and Expression Profiling during Development and Abiotic Stresses. J. Plant Growth Regul. 2018, 37, 1135–1147. [Google Scholar] [CrossRef]
  3. Aubert, D.; Chevillard, M.; Dorne, A.M.; Arlaud, G.; Herzog, M. Expression patterns of GASA genes in Arabidopsis thaliana: The GASA4 gene is up-regulated by gibberellins in meristematic regions. Plant Mol. Biol. 1998, 36, 871–883. [Google Scholar] [CrossRef] [PubMed]
  4. Li, Z.; Gao, J.; Wang, G.; Wang, S.; Chen, K.; Pu, W.; Wang, Y.; Xia, Q.; Fan, X. Genome-Wide Identification and Characterization of GASA Gene Family in Nicotiana tabacum. Front. Genet. 2022, 12, 768942. [Google Scholar] [CrossRef] [PubMed]
  5. Furukawa, T.; Sakaguchi, N.; Shimada, H. Two OsGASR genes, rice GAST homologue genes that are abundant in proliferating tissues, show different expression patterns in developing panicles. Genes Genet. Syst. 2006, 81, 171–180. [Google Scholar] [CrossRef]
  6. Ahmad, B.; Yao, J.; Zhang, S.; Li, X.; Zhang, X.; Yadav, V.; Wang, X. Genome-Wide Characterization and Expression Profiling of GASA Genes during Different Stages of Seed Development in Grapevine (Vitis vinifera L.) Predict Their Involvement in Seed Development. Int. J. Mol. Sci. 2020, 21, 1088. [Google Scholar] [CrossRef]
  7. Nahirñak, V.; Rivarola, M.; Gonzalez de Urreta, M.; Paniego, N.; Hopp, H.E.; Almasia, N.I.; Vazquez-Rovere, C. Genome-wide Analysis of the Snakin/GASA Gene Family in Solanum tuberosum cv. Kennebec. Am. J. Potato Res. 2016, 93, 172–188. [Google Scholar] [CrossRef]
  8. Han, S.; Jiao, Z.; Niu, M.X.; Yu, X.; Huang, M.; Liu, C.; Wang, H.L.; Zhou, Y.; Mao, W.; Wang, X.; et al. Genome-Wide Comprehensive Analysis of the GASA Gene Family in Populus. Int. J. Mol. Sci. 2021, 22, 12336. [Google Scholar] [CrossRef]
  9. García, A.N.; Ayub, N.D.; Fox, A.R.; Gómez, M.C.; Diéguez, M.J.; Pagano, E.M.; Berini, C.A.; Muschietti, J.P.; Soto, G. Alfalfa snakin-1 prevents fungal colonization and probably coevolved with rhizobia. BMC Plant Biol. 2014, 14, 248. [Google Scholar] [CrossRef]
  10. Wu, T.; Zhong, Y.; Chen, M.; Wu, B.; Wang, T.; Jiang, B.; Zhong, G. Analysis of CcGASA family members in Citrus clementina (Hort. ex Tan.) by a genome-wide approach. BMC Plant Biol. 2021, 21, 565. [Google Scholar] [CrossRef]
  11. Moyano-Canete, E.; Bellido, M.L.; García-Caparrós, N.; Medina-Puche, L.; Amil-Ruiz, F.; González-Reyes, J.A.; Caballero, J.L.; Munoz-Blanco, J.; Blanco-Portales, R. FaGAST2, a strawberry ripening-related gene, acts together with FaGAST1 to determine cell size of the fruit receptacle. Plant Cell Physiol. 2013, 54, 218–236. [Google Scholar] [CrossRef]
  12. Nahirñak, V.; Almasia, N.I.; Fernandez, P.V.; Hopp, H.E.; Estevez, J.M.; Carrari, F.; Vazquez-Rovere, C. Potato Snakin-1 Gene Silencing Affects Cell Division, Primary Metabolism, and Cell Wall Composition. Plant Physiol. 2012, 158, 252–263. [Google Scholar] [CrossRef] [PubMed]
  13. de la Fuente, J.I.; Amaya, I.; Castillejo, C.; Sánchez-Sevilla, J.F.; Quesada, M.A.; Botella, M.A.; Valpuesta, V. The strawberry gene FaGAST affects plant growth through inhibition of cell elongation. J. Exp. Bot. 2006, 57, 2401–2411. [Google Scholar] [CrossRef]
  14. Zimmermann, R.; Sakai, H.; Hochholdinger, F. The Gibberellic Acid Stimulated-Like gene family in maize and its role in lateral root development. Plant Physiol. 2010, 152, 356–365. [Google Scholar] [CrossRef] [PubMed]
  15. Zhang, S.; Yang, C.; Peng, J.; Sun, S.; Wang, X. GASA5, a regulator of flowering time and stem growth in Arabidopsis thaliana. Plant Mol. Biol. 2009, 69, 745–759. [Google Scholar] [CrossRef] [PubMed]
  16. Roxrud, I.; Lid, S.E.; Fletcher, J.C.; Schmidt, E.D.L.; Opsahl-Sorteberg, H.G. GASA4, one of the 14-member Arabidopsis GASA family of small polypeptides, regulates flowering and seed development. Plant Cell Physiol. 2007, 48, 471–483. [Google Scholar] [CrossRef] [PubMed]
  17. Ben-Nissan, G.; Lee, J.Y.; Borohov, A.; Weiss, D. GIP, a Petunia hybrida GA-induced cysteine-rich protein: A possible role in shoot elongation and transition to flowering. Plant J. 2003, 37, 229–238. [Google Scholar] [CrossRef]
  18. Rezaee, S.; Ahmadizadeh, M.; Heidari, P. Genome-wide characterization, expression profiling, and post-transcriptional study of GASA gene family. Gene Rep. 2020, 20, 100795. [Google Scholar] [CrossRef]
  19. Li, X.; Shi, S.; Tao, Q.; Tao, Y.; Miao, J.; Peng, X.; Li, C.; Yang, Z.; Zhou, Y.; Liang, G. OsGASR9 positively regulates grain size and yield in rice (Oryza sativa). Plant Sci. 2019, 286, 17–27. [Google Scholar] [CrossRef]
  20. Herzog, M.; Dorne, A.M.; Grellet, F. GASA, a gibberellin-regulated gene family from Arabidopsis thaliana related to the tomato GAST1 gene. Plant Mol. Biol. 1995, 27, 743–752. [Google Scholar] [CrossRef]
  21. Wang, H.; Wei, T.; Wang, X.; Zhang, L.; Yang, M.; Chen, L.; Song, W.; Wang, C.; Chen, C. Transcriptome Analyses from Mutant Salvia miltiorrhiza Reveals Important Roles for SmGASA4 during Plant Development. Int. J. Mol. Sci. 2018, 19, 2088. [Google Scholar] [CrossRef]
  22. Ko, C.B.; Woo, Y.M.; Lee, M.C.; Kim, C.S. Enhanced tolerance to heatstress in transgenic plants expressing the GASA4 gene. Plant Physiol. Biochem. 2007, 45, 722–728. [Google Scholar] [CrossRef]
  23. Alonso-Ramírez, A.; Rodríguez, D.; Reyes, D.; Jiménez, J.A.; Nicolás, G.; López-Climent, M.; Gómez-Cadenas, A.; Nicolás, C. Evidence for a Role of Gibberellins in Salicylic Acid-Modulated Early Plant Responses to Abiotic Stress in Arabidopsis Seeds. Plant Physiol. 2009, 150, 1335–1344. [Google Scholar] [CrossRef] [PubMed]
  24. Li, K.L.; Bai, X.; Li, Y.; Cai, H.; Ji, W.; Tang, L.L.; Wen, Y.D.; Zhu, Y.M. GsGASA1 mediated root growth inhibition in response to chronic cold stress is marked by the accumulation of DELLAs. J. Plant Physiol. 2011, 168, 2153–2160. [Google Scholar] [CrossRef]
  25. Kovalskaya, N.; Hammond, R.W. Expression and functional characterization of the plant antimicrobial snakin-1 and defensin recombinant proteins. Protein Expr. Purif. 2009, 63, 12–17. [Google Scholar] [CrossRef] [PubMed]
  26. Almasia, N.I.; Bazzini, A.A.; Hopp, H.E.; Vazquez-Rovere, C. Overexpression of snakin-1 gene enhances resistance to Rhizoctonia solani and Erwinia carotovora in transgenic potato plants. Mol. Plant Pathol. 2008, 9, 329–338. [Google Scholar] [CrossRef] [PubMed]
  27. Berrocal-Lobo, M.; Segura, A.; Moreno, M.; López, G.; Garcıa-Olmedo, F.; Molina, A. Snakin-2, an antimicrobial peptide from potato whose gene is locally induced by wounding and responds to pathogen infection. Plant Physiol. 2002, 128, 951–961. [Google Scholar] [CrossRef]
  28. Wu, T.; Cheng, C.; Zhong, Y.; Lv, Y.; Ma, Y.; Zhong, G. Molecular characterization of the gibberellin-stimulated transcript of GASA4 in Citrus. Plant Growth Regul. 2020, 91, 89–99. [Google Scholar] [CrossRef]
  29. He, H.; Yang, X.; Xun, H.; Lou, X.; Li, S.; Zhang, Z.; Jiang, L.; Dong, Y.; Wang, S.; Pang, J. Over-expression of GmSN1 enhances virus resistance in Arabidopsis and soybean. Plant Cell Rep. 2017, 36, 1441–1455. [Google Scholar] [CrossRef]
  30. Zhang, S.; Wang, X. Expression pattern of GASA, downstream genes of DELLA, in Arabidopsis. Chin. Sci. Bull. 2008, 53, 3839–3846. [Google Scholar] [CrossRef]
  31. Balaji, V.; Smart, C.D. Over-expression of snakin-2 and extensin-like protein genes restricts pathogen invasiveness and enhances tolerance to Clavibacter michiganensis subsp. michiganensis in transgenic tomato (Solanum lycopersicum). Transgenic Res. 2012, 21, 23–37. [Google Scholar] [CrossRef]
  32. Rubinovich, L.; Weiss, D. The Arabidopsis cysteine-rich protein GASA4 promotes GA responses and exhibits redox activity in bacteria and in planta. Plant J. 2010, 64, 1018–1027. [Google Scholar] [CrossRef] [PubMed]
  33. Qu, J.; Kang, S.G.; Hah, C.; Jang, J. Molecular and cellular characterization of GA-Stimulated Transcripts GASA4 and GASA6 in Arabidopsis thaliana. Plant Sci. 2016, 246, 1–10. [Google Scholar] [CrossRef] [PubMed]
  34. Zhong, C.; Xu, H.; Ye, S.; Wang, S.; Li, L.; Zhang, S.; Wang, X. AtGASA6 Serves as an Integrator of Gibberellin-, Abscisic Acid- and Glucose-Signaling during Seed Germination in Arabidopsis. Plant Physiol. 2015, 169, 858–2015. [Google Scholar] [CrossRef] [PubMed]
  35. Wang, L.; Wang, Z.; Xu, Y.; Joo, S.H.; Kim, S.K.; Xue, Z.; Xu, Z.; Wang, Z.; Chong, K. OsGSR is involved in crosstalk between gibberellins and brassinosteroids in rice. Plant J. 2009, 57, 498–510. [Google Scholar] [CrossRef] [PubMed]
  36. Chen, K.; Liu, W.; Li, X.; Li, H. Overexpression of GmGASA32 promoted soybean height by interacting with GmCDC25. Plant Signal. Behav. 2021, 16, 1855017. [Google Scholar] [CrossRef]
  37. Raventos, D.; Meier, C.; Mattsson, O.; Jensen, A.B.; Mundy, J. Fusion genetic analysis of gibberellin signaling mutants. Plant J. 2001, 22, 427–438. [Google Scholar] [CrossRef]
  38. Shi, L.; Gast, R.T.; Gopalraj, M.; Olszewski, N.E. Characterization of a shoot-specific, GA3-and ABA-regulated gene from tomato. Plant J. 1992, 2, 153–159. [Google Scholar] [CrossRef]
  39. Fan, S.; Zhang, D.; Zhang, L.; Gao, C.; Xin, M.; Tahir, M.M.; Li, Y.; Ma, J.; Han, M. Comprehensive analysis of GASA family members in the Malus domestica genome: Identification, characterization, and their expressions in response to apple flower induction. BMC Genom. 2017, 18, 827. [Google Scholar] [CrossRef]
  40. An, B.; Wang, Q.; Zhang, X.; Zhang, B.; Luo, H.; He, C. Comprehensive transcriptional and functional analyses of HbGASA genes reveal their roles in fungal pathogen resistance in Hevea brasiliensis. Tree Genet. Genomes 2018, 14, 41. [Google Scholar] [CrossRef]
  41. Lobo, M.G.; Siddiq, M. Overview of pineapple production, postharvest physiology, processing and nutrition. In Handbook of Pineapple Technology: Production, Postharvest Science, Processing and Nutrition, 1st ed.; Lobo, M.G., Paull, R., Eds.; John Wiley & Sons: Chichester, UK, 2017; Volume 1, pp. 1–15. [Google Scholar]
  42. Baruwa, O.I. Profitability and constraints of pineapple production in Osun State, Nigeria. J. Hortic. Res. 2013, 21, 59–64. [Google Scholar] [CrossRef]
  43. d’Eeckenbrugge, G.C.; Leal, F. History, distribution and world production. In The Pineapple: Botany, Production and Uses, 2nd ed.; Sanewski, G.M., Bartholomew, D.P., Paull, R.E., Eds.; CABI Publishing: Wallingford, UK, 2018; Volume 1, pp. 1–10. [Google Scholar]
  44. Lynch, M.; Conery, J. The Evolutionary Fate and Consequences of Duplicate Genes. Science 2000, 290, 1151–1155. [Google Scholar] [CrossRef] [PubMed]
  45. Moore, R.C.; Purugganan, M.D. The early stages of duplicate gene evolution. Proc. Natl. Acad. Sci. USA 2003, 100, 15682–15687. [Google Scholar] [CrossRef] [PubMed]
  46. Maere, S.; Bodt, S.D.; Raes, J.; Casneuf, T.; Montagu, M.V.; Kuiper, M.; de Peer, Y.V. Modeling gene and genome duplications in eukaryotes. Proc. Natl. Acad. Sci. USA 2005, 102, 5454–5459. [Google Scholar] [CrossRef]
  47. Mao, Q.; Chen, C.; Xie, T.; Luan, A.; Liu, C.; He, Y. Comprehensive tissue-specific transcriptome profiling of pineapple (Ananas comosus) and building an eFP-browser for further study. PeerJ 2018, 6, e6028. [Google Scholar] [CrossRef]
  48. Wang, L.; Li, Y.; Jin, X.; Liu, L.; Dai, X.; Liu, Y.; Zhao, L.; Zheng, P.; Wang, X.; Liu, Y.; et al. Floral transcriptomes reveal gene networks in pineapple floral growth and fruit development. Commun. Biol. 2020, 3, 500. [Google Scholar] [CrossRef] [PubMed]
  49. Yusuf, N.H.M.; Ong, W.D.; Redwan, R.M.; Latip, M.A.; Kumar, S.V. Discovery of precursor and mature microRNAs and their putative gene targets using high-throughput sequencing in pineapple (Ananas comosus var. comosus). Gene 2015, 571, 71–80. [Google Scholar] [CrossRef]
  50. Meslin, C.; Mugnier, S.; Callebaut, I.; Laurin, M.; Pascal, G.; Poupon, A.; Goudet, G.; Monget, P. Evolution of genes involved in gamete interaction: Evidence for positive selection, duplications and losses in vertebrates. PLoS ONE 2012, 7, e44548. [Google Scholar] [CrossRef]
  51. Zhang, M.; Cheng, W.; Wang, J.; Cheng, T.; Zhang, Q. Genome-Wide Identification, Evolution, and Expression Analysis of GASA Gene Family in Prunus mume. Int. J. Mol. Sci. 2022, 23, 10923. [Google Scholar] [CrossRef]
  52. Sun, S.; Wang, H.; Yu, H.; Zhong, C.; Zhang, X.; Peng, J.; Wang, X. GASA14 regulates leaf expansion and abiotic stress resistance by modulating reactive oxygen species accumulation. J. Exp. Bot. 2013, 64, 1637–1647. [Google Scholar] [CrossRef]
  53. Kumar, A.; Singh, A.; Kumar, P.; Sarkar, A.K. Giberellic Acid-Stimulated Transcript Proteins Evolved through Successive Conjugation of Novel Motifs and Their Subfunctionalization. Plant Physiol. 2019, 180, 998–1012. [Google Scholar] [CrossRef] [PubMed]
  54. Zan, T.; Zhang, L.; Xie, T.; Li, L. Genome-Wide Identification and Analysis of the Growth-Regulating Factor (GRF) Gene Family and GRF-Interacting Factor Family in Triticum aestivum L. Biochem. Genet. 2020, 58, 705–724. [Google Scholar] [CrossRef] [PubMed]
  55. Xu, G.; Guo, C.; Shan, H.; Kong, H. Divergence of duplicate genes in exon–intron structure. Proc. Natl. Acad. Sci. USA 2012, 109, 1187–1192. [Google Scholar] [CrossRef] [PubMed]
  56. Paterson, A.H.; Freeling, M.; Tang, H.; Wang, X. Insights from the comparison of plant genome sequences. Annu Rev. Plant Biol. 2010, 61, 349–372. [Google Scholar] [CrossRef]
  57. Cannon, S.B.; Mitra, A.; Baumgarten, A.; Young, N.D.; May, G. The roles of segmental and tandem gene duplication in the evolution of large gene families in Arabidopsis thaliana. BMC Plant Biol. 2004, 4, 10. [Google Scholar] [CrossRef] [PubMed]
  58. Zhang, Z.; Chen, J.; Liang, C.; Liu, F.; Hou, X.; Zou, X. Genome-Wide Identification and Characterization of the bHLH Transcription Factor Family in Pepper (Capsicum annuum L.). Front. Genet. 2020, 11, 570156. [Google Scholar] [CrossRef]
  59. Chow, C.; Lee, T.; Hung, Y.; Li, G.; Tseng, K.; Liu, Y.; Kuo, P.; Zheng, H.; Chang, W. PlantPAN3.0: A new and updated resource for reconstructing transcriptional regulatory networks from ChIP-seq experiments in plants. Nucleic Acids Res. 2019, 47, D1155–D1163. [Google Scholar] [CrossRef]
  60. Peng, J.; Lai, L.; Wang, X. Temporal and spatial expression analysis of PRGL in Gerbera hybrida. Mol. Biol. Rep. 2010, 37, 3311–3317. [Google Scholar] [CrossRef]
  61. Muhammad, I.; Li, W.Q.; Jing, X.Q.; Zhou, M.R.; Shalmani, A.; Ali, M.; Wei, X.Y.; Sharif, R.; Liu, W.T.; Chen, K.M. A Systematic In Silico Prediction of Gibberellic Acid Stimulated GASA Family Members: A Novel Small Peptide Contributes to Floral Architecture and Transcriptomic Changes Induced by External Stimuli in Rice. J. Plant Physiol. 2019, 234–235, 117–132. [Google Scholar] [CrossRef]
  62. Kaikai, Q.; Changkai, M.; Jiaoyan, L.; Chaojun, Z.; Qifeng, M.; Shuli, F. Identification, characterization, and expression profiles of the GASA genes in cotton. J. Cotton Res. 2021, 4, 7. [Google Scholar]
  63. Ming, R.; VanBuren, R.; Wai, C.M.; Tang, H.; Schatz, M.C.; Bowers, J.E.; Lyons, E.; Wang, M.-L.; Chen, J.; Biggers, E.; et al. The pineapple genome and the evolution of CAM photosynthesis. Nat. Genet. 2015, 47, 1435–1442. [Google Scholar] [CrossRef]
  64. Chen, C.; Wu, Y.; Li, J.; Wang, X.; Zeng, Z.; Xu, J.; Liu, Y.; Feng, J.; Chen, H.; He, Y.; et al. TBtools-II: A “One for All, All for One” Bioinformatics Platform for Biological Big-data Mining. Mol Plant 2023, 22, S1674–S2052. [Google Scholar] [CrossRef] [PubMed]
  65. Bailey, T.L.; Williams, N.; Misleh, C.; Li, W.W. MEME: Discovering and analyzing DNA and protein sequence motifs. Nucleic Acids Res. 2006, 34, W369–W373. [Google Scholar] [CrossRef] [PubMed]
  66. Dai, X.; Zhuang, Z.; Zhao, P.X. psRNATarget: A plant small RNA target analysis server (2017 release). Nucleic Acids Res. 2018, 46, W49–W54. [Google Scholar] [CrossRef] [PubMed]
Figure 1. Conserved sequence, chromosomal distribution, gene structure, and gene motifs of the pineapple AcGASA gene. (A) A comparison of the AcGASA protein’s GASA structural domains with conserved cysteines is represented by red asterisks. (B) The chromosomal distribution of AcGASA genes with gene density is indicated from blue (low) to red (high). (C) The phylogenetic tree of AcGASA genes. (D) AcGASA protein-conserved motifs. (E) The AcGASA structural domain. (F) The AcGASA gene structure. Exons are represented by green, untranslated regions are substituted with yellow boxes, and black lines indicate introns.
Ijms 24 17063 g001
Figure 2. An evolutionary tree and the number of gibberellic acid-stimulated Arabidopsis (GASA) genes for 23 species. Various colors are employed to represent different classifications, including Chlorophyta, Bryophyta, Pteridophyta, Gymnosperms, Basal Angiosperms, Monocots, and Dicots. The GASA number column provides the number of GASA genes in each species. The light blue to yellow column shows the amount of GASA genes in each species, from low to high.
Ijms 24 17063 g002
Figure 3. The phylogenetic tree of GASA genes from pineapple, Arabidopsis thaliana, maize, tobacco, grape, and rice. These GASA proteins across the six species were used to create neighbor-joining (NJ) trees supported by 1000 bootstrap replicates. The GASA genes are categorized into three distinct groups (Subfamily 1, Subfamily 2, and Subfamily 3), and the pineapple GASA genes are highlighted in red.
Ijms 24 17063 g003
Figure 4. A collinear analysis of pineapple AcGASA genes and its homologs and the calculation of the Ka/Ks value of AcGASA genes. (A) Circos map of the pineapple GASA colinear homologous gene. Dark pink lines indicate colinear gene pairs, while tandem duplicated genes are highlighted in a red font. Each chromosome is presented as a 100 kb heat map depicting gene density. (B) The co-linearity of pineapple with Arabidopsis thaliana, tobacco, rice, grape, and maize; red lines indicate colinear gene pairs. (C) The heat map of nonredundant collinear GASA genes in pineapple and other species. (D) The bar graph shows the Ka/Ks ratio for the pineapple AcGASA gene.
Ijms 24 17063 g004
Figure 5. The expression of AcGASA genes within various tissue sites of pineapple. (A) The heat map of AcGASA gene expression in different tissue sites of pineapple across various developmental periods. (B) The heat map of AcGASA gene expression in pineapple floral organs (stamens, gynoecia, ovules, sepals, and petals) at different time points. There are five periods for stamens (S1–S5), seven periods for gynoecia (S1–S7), seven periods for ovules (S1–S7), four periods for sepals (S1–S4), and three periods for petals (S1–S3).
Ijms 24 17063 g005
Figure 6. A cartoon heat map depicting the expression of AcGASA genes across various pineapple tissues. Each AcGASA gene expression level is represented by a pineapple cartoon heat map. Blue, white, and red colors indicate low, medium, and high levels of expression. These expression levels were computed by averaging the data for each site across different periods of transcriptome data.
Ijms 24 17063 g006
Figure 7. The prediction of miRNA target sites for AcGASA gene prediction and the protein interaction network prediction. (A) Predicted miRNA targets in the AcGASA gene. miRNAs target the AcGASA gene and are represented by scissors. (B) AcGASA protein interaction network using the pineapple protein as a reference.
Ijms 24 17063 g007
Figure 8. AcGASA gene promoter cis-elements analysis. (A) Promoter cis-element mapping analysis of the 2000 bp region upstream of the TSS (Transcription Start Site) of the AcGASA gene. (B) Heat map of the number of cis-elements of different promoters in the AcGASA gene.
Ijms 24 17063 g008
Figure 9. AcGASA gene expression profile under different hormone treatments. Expression levels of AcGASA genes in pineapple seedlings subjected to treatment with GA, ABA, NAA, IAA, and MeJA. The data presented are normalized to pineapple β-actin, and the error line represents the standard deviation calculated from three technical replicates.
Ijms 24 17063 g009
Table 1. The physicochemical properties of the AcGASA family genes. For each gene, the table provides the gene ID, protein length (PL), molecular weight of amino acid (MW), isoelectric points (pI), hydrophilicity score (GRAVY), aliphatic index (AI), and the predicted subcellular location.
Gene NameGene IDPL (aa)MW (kDa)pIGRAVYAISubcellular Localization
AcGASA1Aco0123709010.089.07−0.14964.00Cell membrane, Golgi, nucleus
AcGASA2Aco0112259410.178.480.00772.66Golgi
AcGASA3Aco011224636.969.16−0.80517.14Golgi, nucleus
AcGASA4Aco00111611112.358.84−0.30756.31Golgi
AcGASA5Aco0010679510.38.980.01458.53Cell membrane, Golgi, nucleus
AcGASA6Aco000980636.678.96−0.39829.52Golgi, nucleus
AcGASA7Aco00097911612.378.590.01169.14Cell wall
AcGASA8Aco00237315517.399.25−0.69145.42Nucleus
AcGASA9Aco0048939510.729.20−0.22974.00Cell membrane, Golgi, nucleus
AcGASA10Aco0085369710.698.98−0.07071.44Cell membrane, cell wall, Golgi
AcGASA11Aco000098889.858.88−0.36554.43Golgi
AcGASA12Aco00324411412.519.23−0.10465.96Golgi
AcGASA13Aco0158159310.549.17−0.93238.92Golgi, nucleus
AcGASA14Aco01563210611.528.65−0.01073.77nucleus
AcGASA15Aco010336677.128.79−0.48235.07Golgi, nucleus
Disclaimer/Publisher’s Note: The statements, opinions and data contained in all publications are solely those of the individual author(s) and contributor(s) and not of MDPI and/or the editor(s). MDPI and/or the editor(s) disclaim responsibility for any injury to people or property resulting from any ideas, methods, instructions or products referred to in the content.

