
Risk Polymorphisms of FNDC5, BDNF, and NTRK2 and Poor Education Interact and Aggravate Age-Related Cognitive Decline
 ,
,  ,
,
Abstract
:1. Introduction
2. Results
2.1. Influence of Single Nucleotide Polymorphisms on Cognitive Performance
2.2. Age Affects Spatial Working Memory
Spatial Working Memory

- Subtitle: In the figure above, they are identified with “■”: the subjects with the highest risk in each group, and with “■”: the subjects with the lowest risk in each group. Each icon represents a sample subject. The black lines between the icons represent the means for each group. Squares are used to represent the BDNF gene, diamonds for the NTRK2 gene, and circles for the FNDC5 gene. On the left side of each graph are the groups with lower schooling (Young and Older), and on the right side are the groups with higher schooling (Young and Older). At the bottom of each graph, the number of participants in each group and their respective polymorphisms are highlighted.
2.3. For Sustained Visual Attention, the More Years of Study the Better the Cognitive Performance
Visual Sustained Attention—Rapid Visual Processing
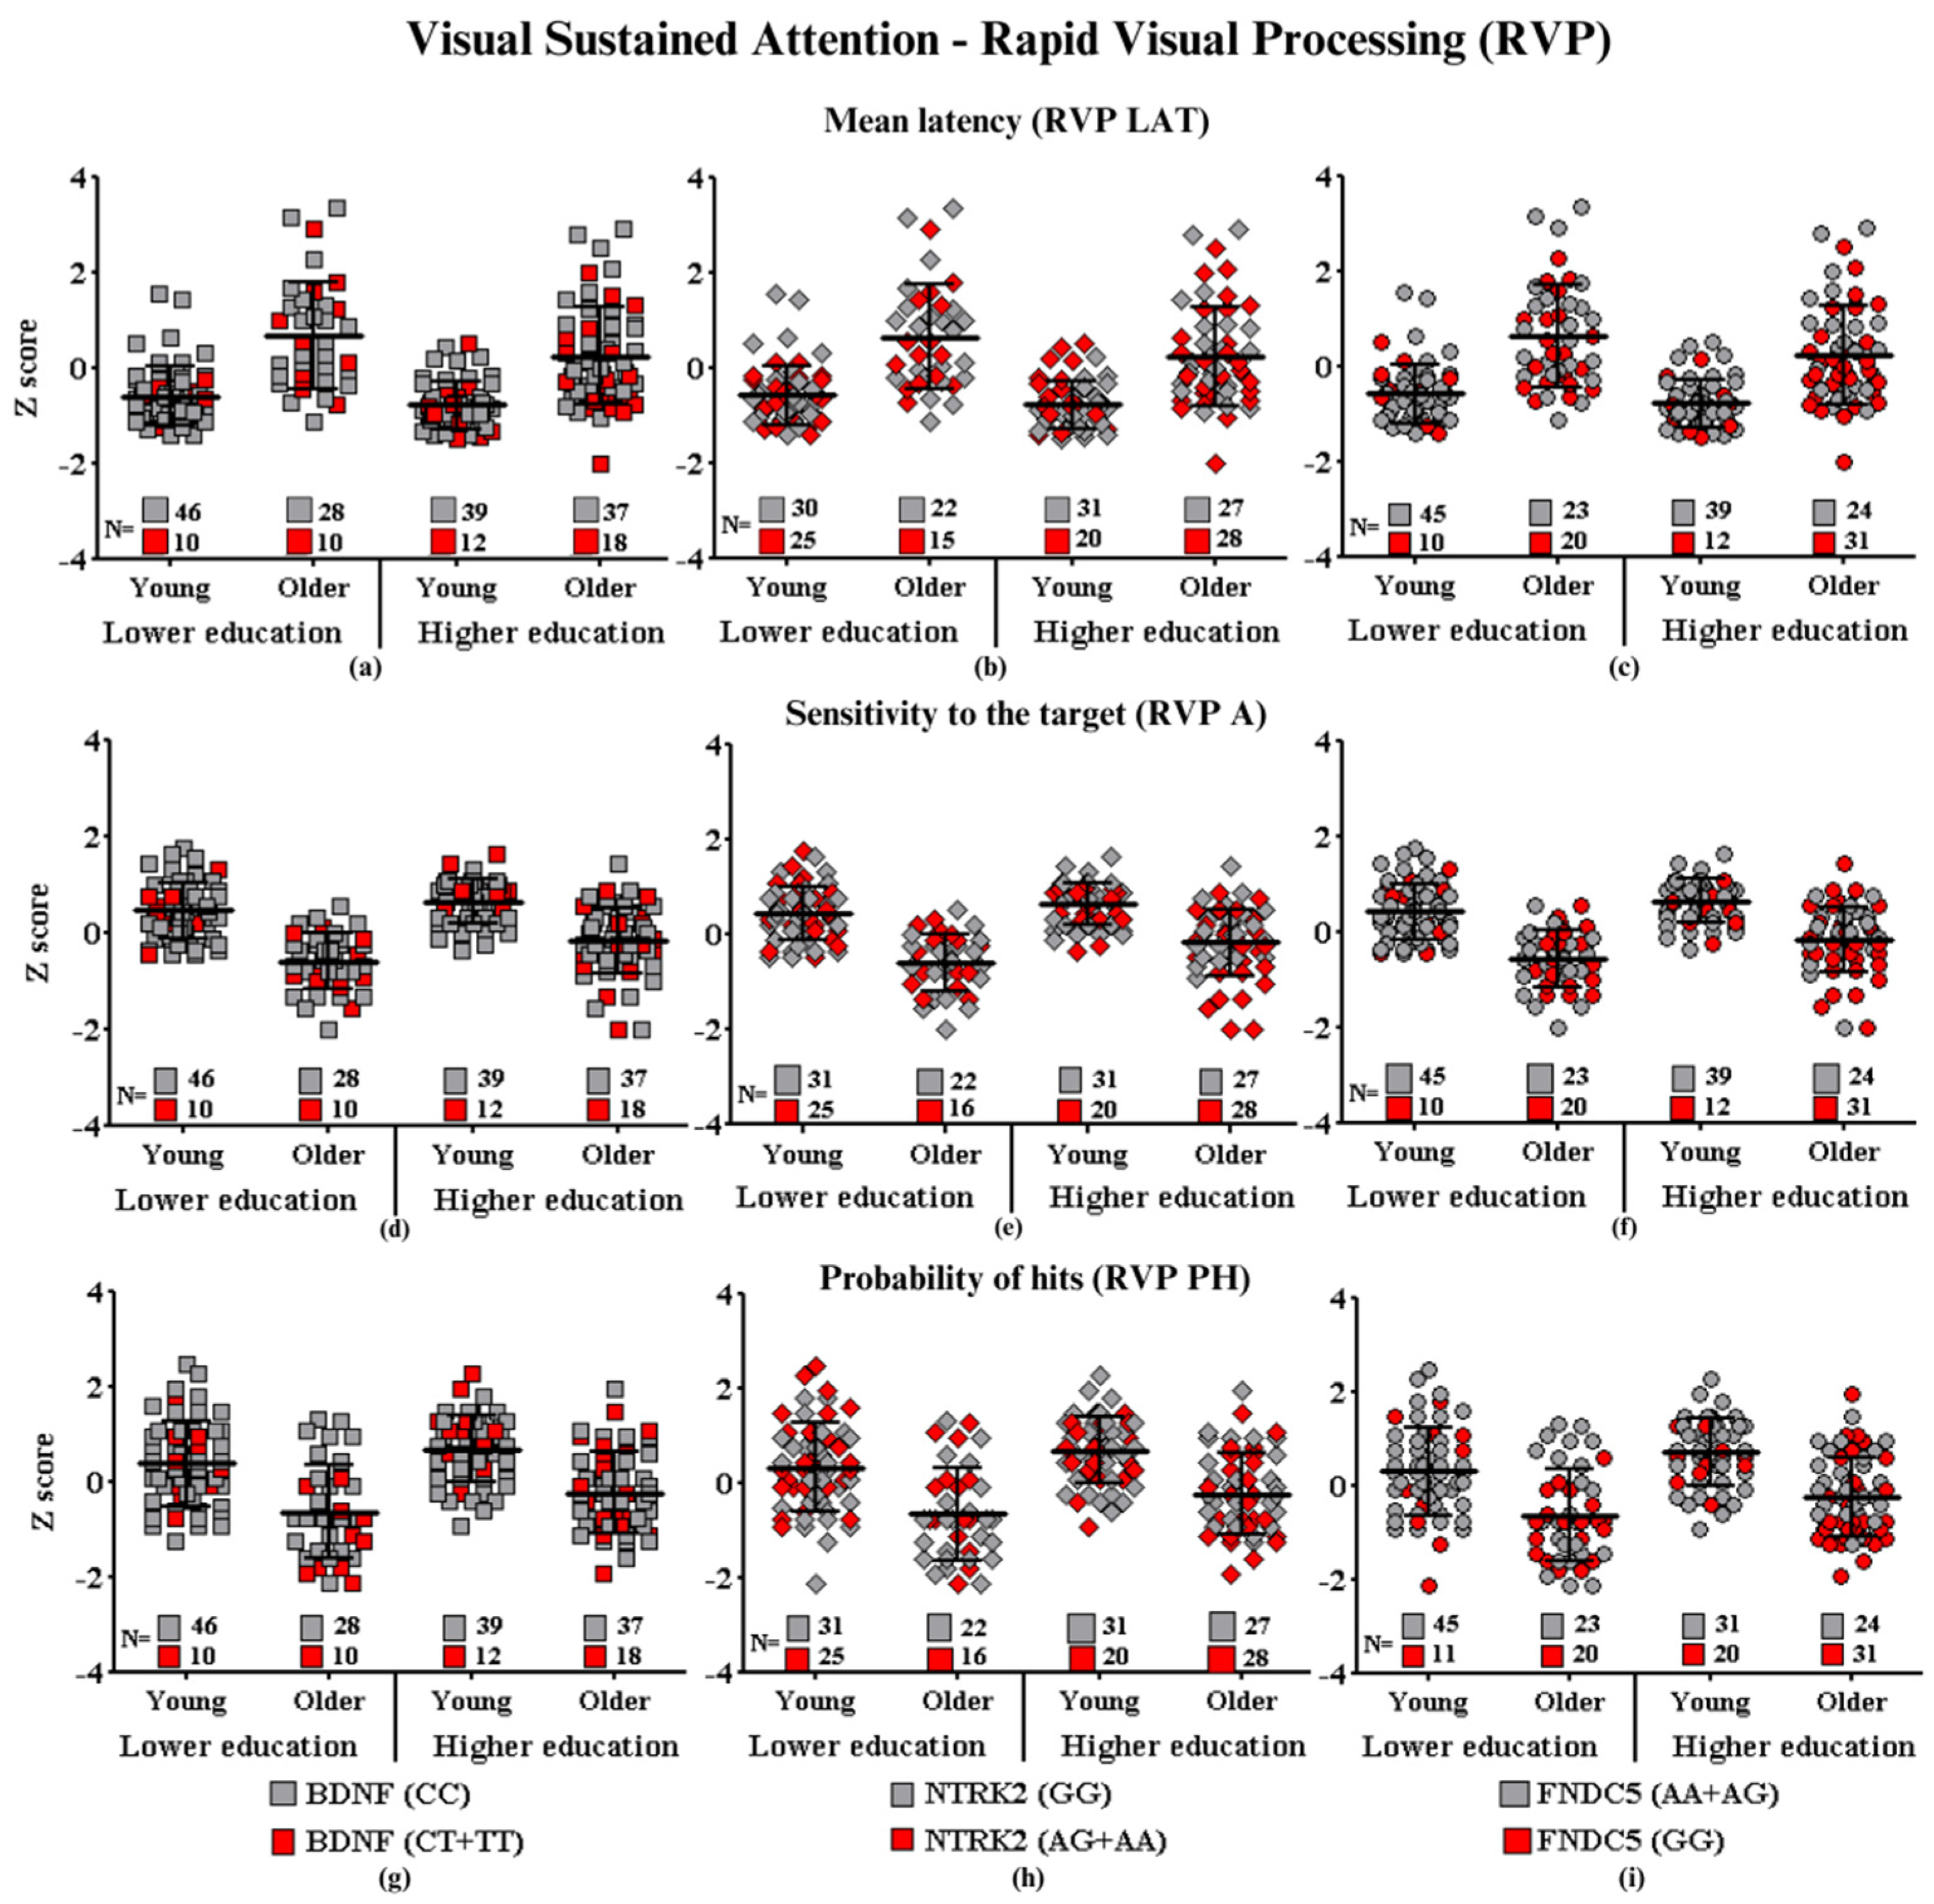
- Subtitle: In the figure above, they are identified with “■”: the subjects with the highest risk in each group, and with “■”: the subjects with the lowest risk in each group. Each icon represents a sample subject. The black lines between the icons represent the means for each group. Squares are used to represent the BDNF gene, diamonds for the NTRK2 gene, and circles for the FNDC5 gene. On the left side of each graph are the groups with lower schooling (young and older), and on the right side are the groups with higher schooling (young and older). At the bottom of each graph, the number of participants in each group and their respective polymorphisms are highlighted.
2.4. Age and Higher Education Impact on Memory and Learning Performance
Learning and Memory—Paired Associated Learning
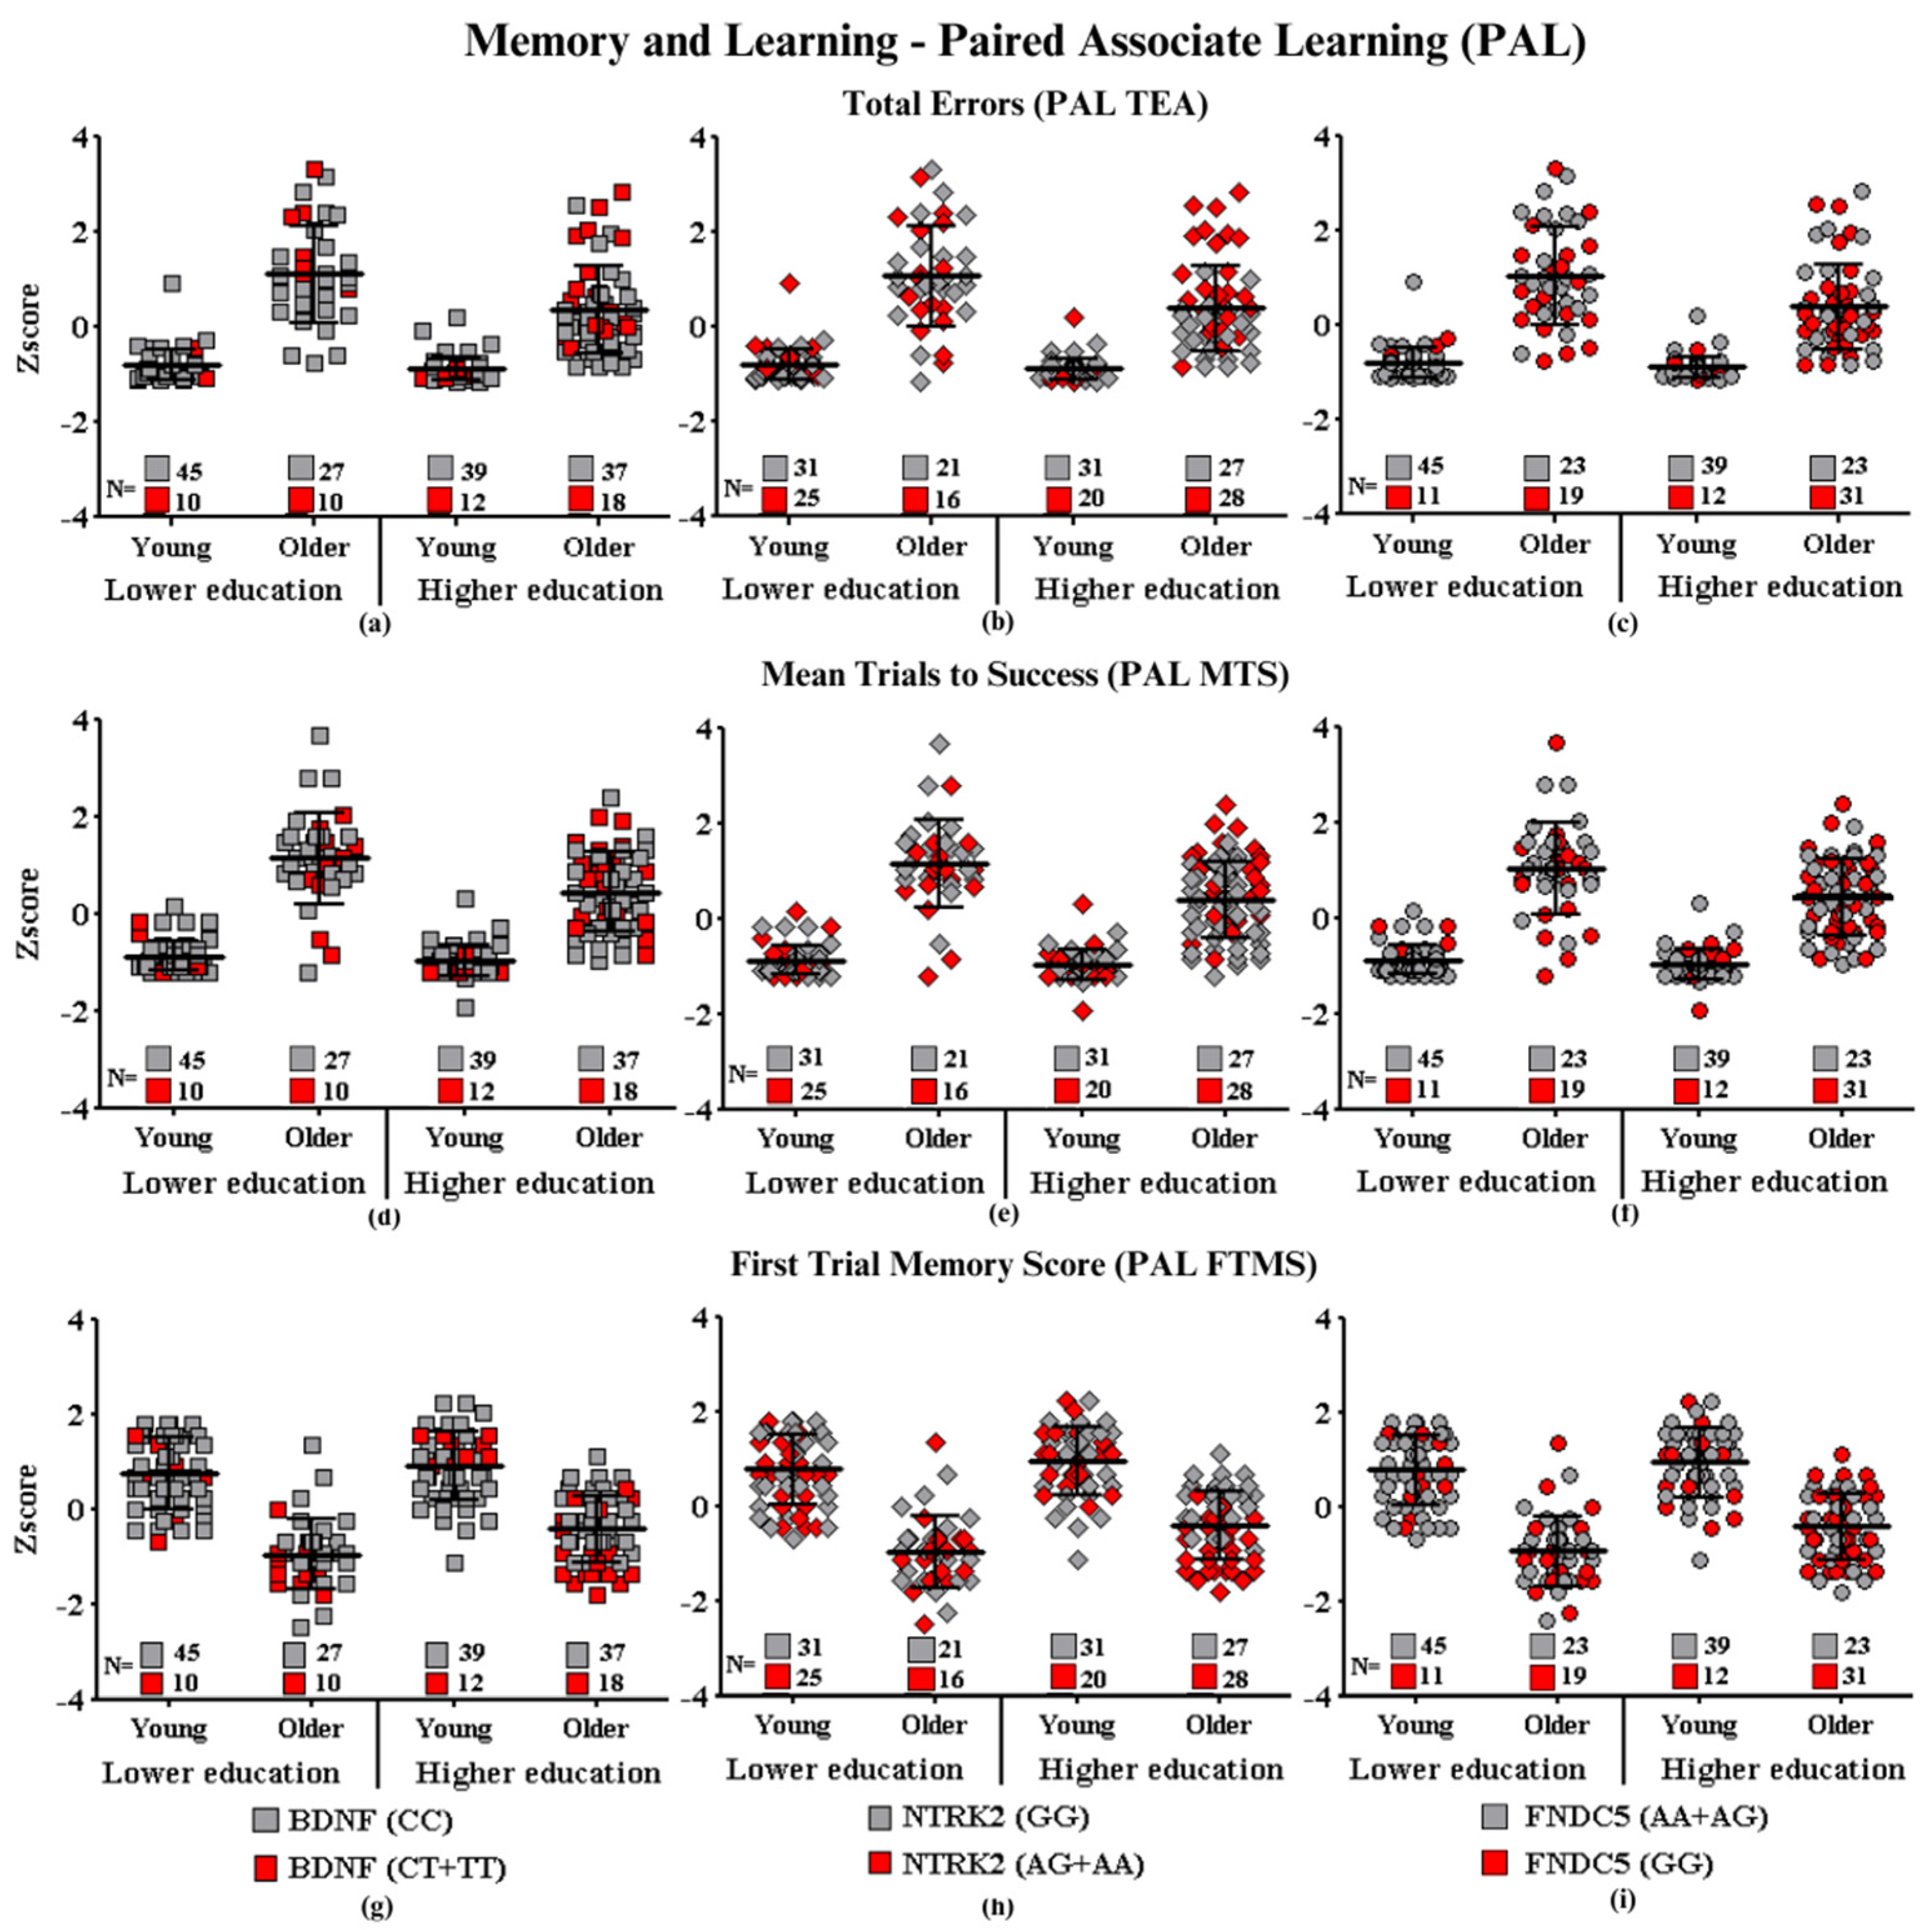
- Subtitle: In the figure above, they are identified with “■”: the subjects with the highest risk in each group, and with “■”: the subjects with the lowest risk in each group. Each icon represents a sample subject. The black lines between the icons represent the means for each group. Squares are used to represent the BDNF gene, diamonds for the NTRK2 gene, and circles for the FNDC5 gene. On the left side of each graph are the groups with lower schooling (young and older), and on the right side are the groups with higher schooling (young and older). At the bottom of each graph, the number of participants in each group and their respective polymorphisms are highlighted.
2.5. Reaction Time Increases with Aging Regardless of Education
Processing and Psychomotor Speed—Reaction Time
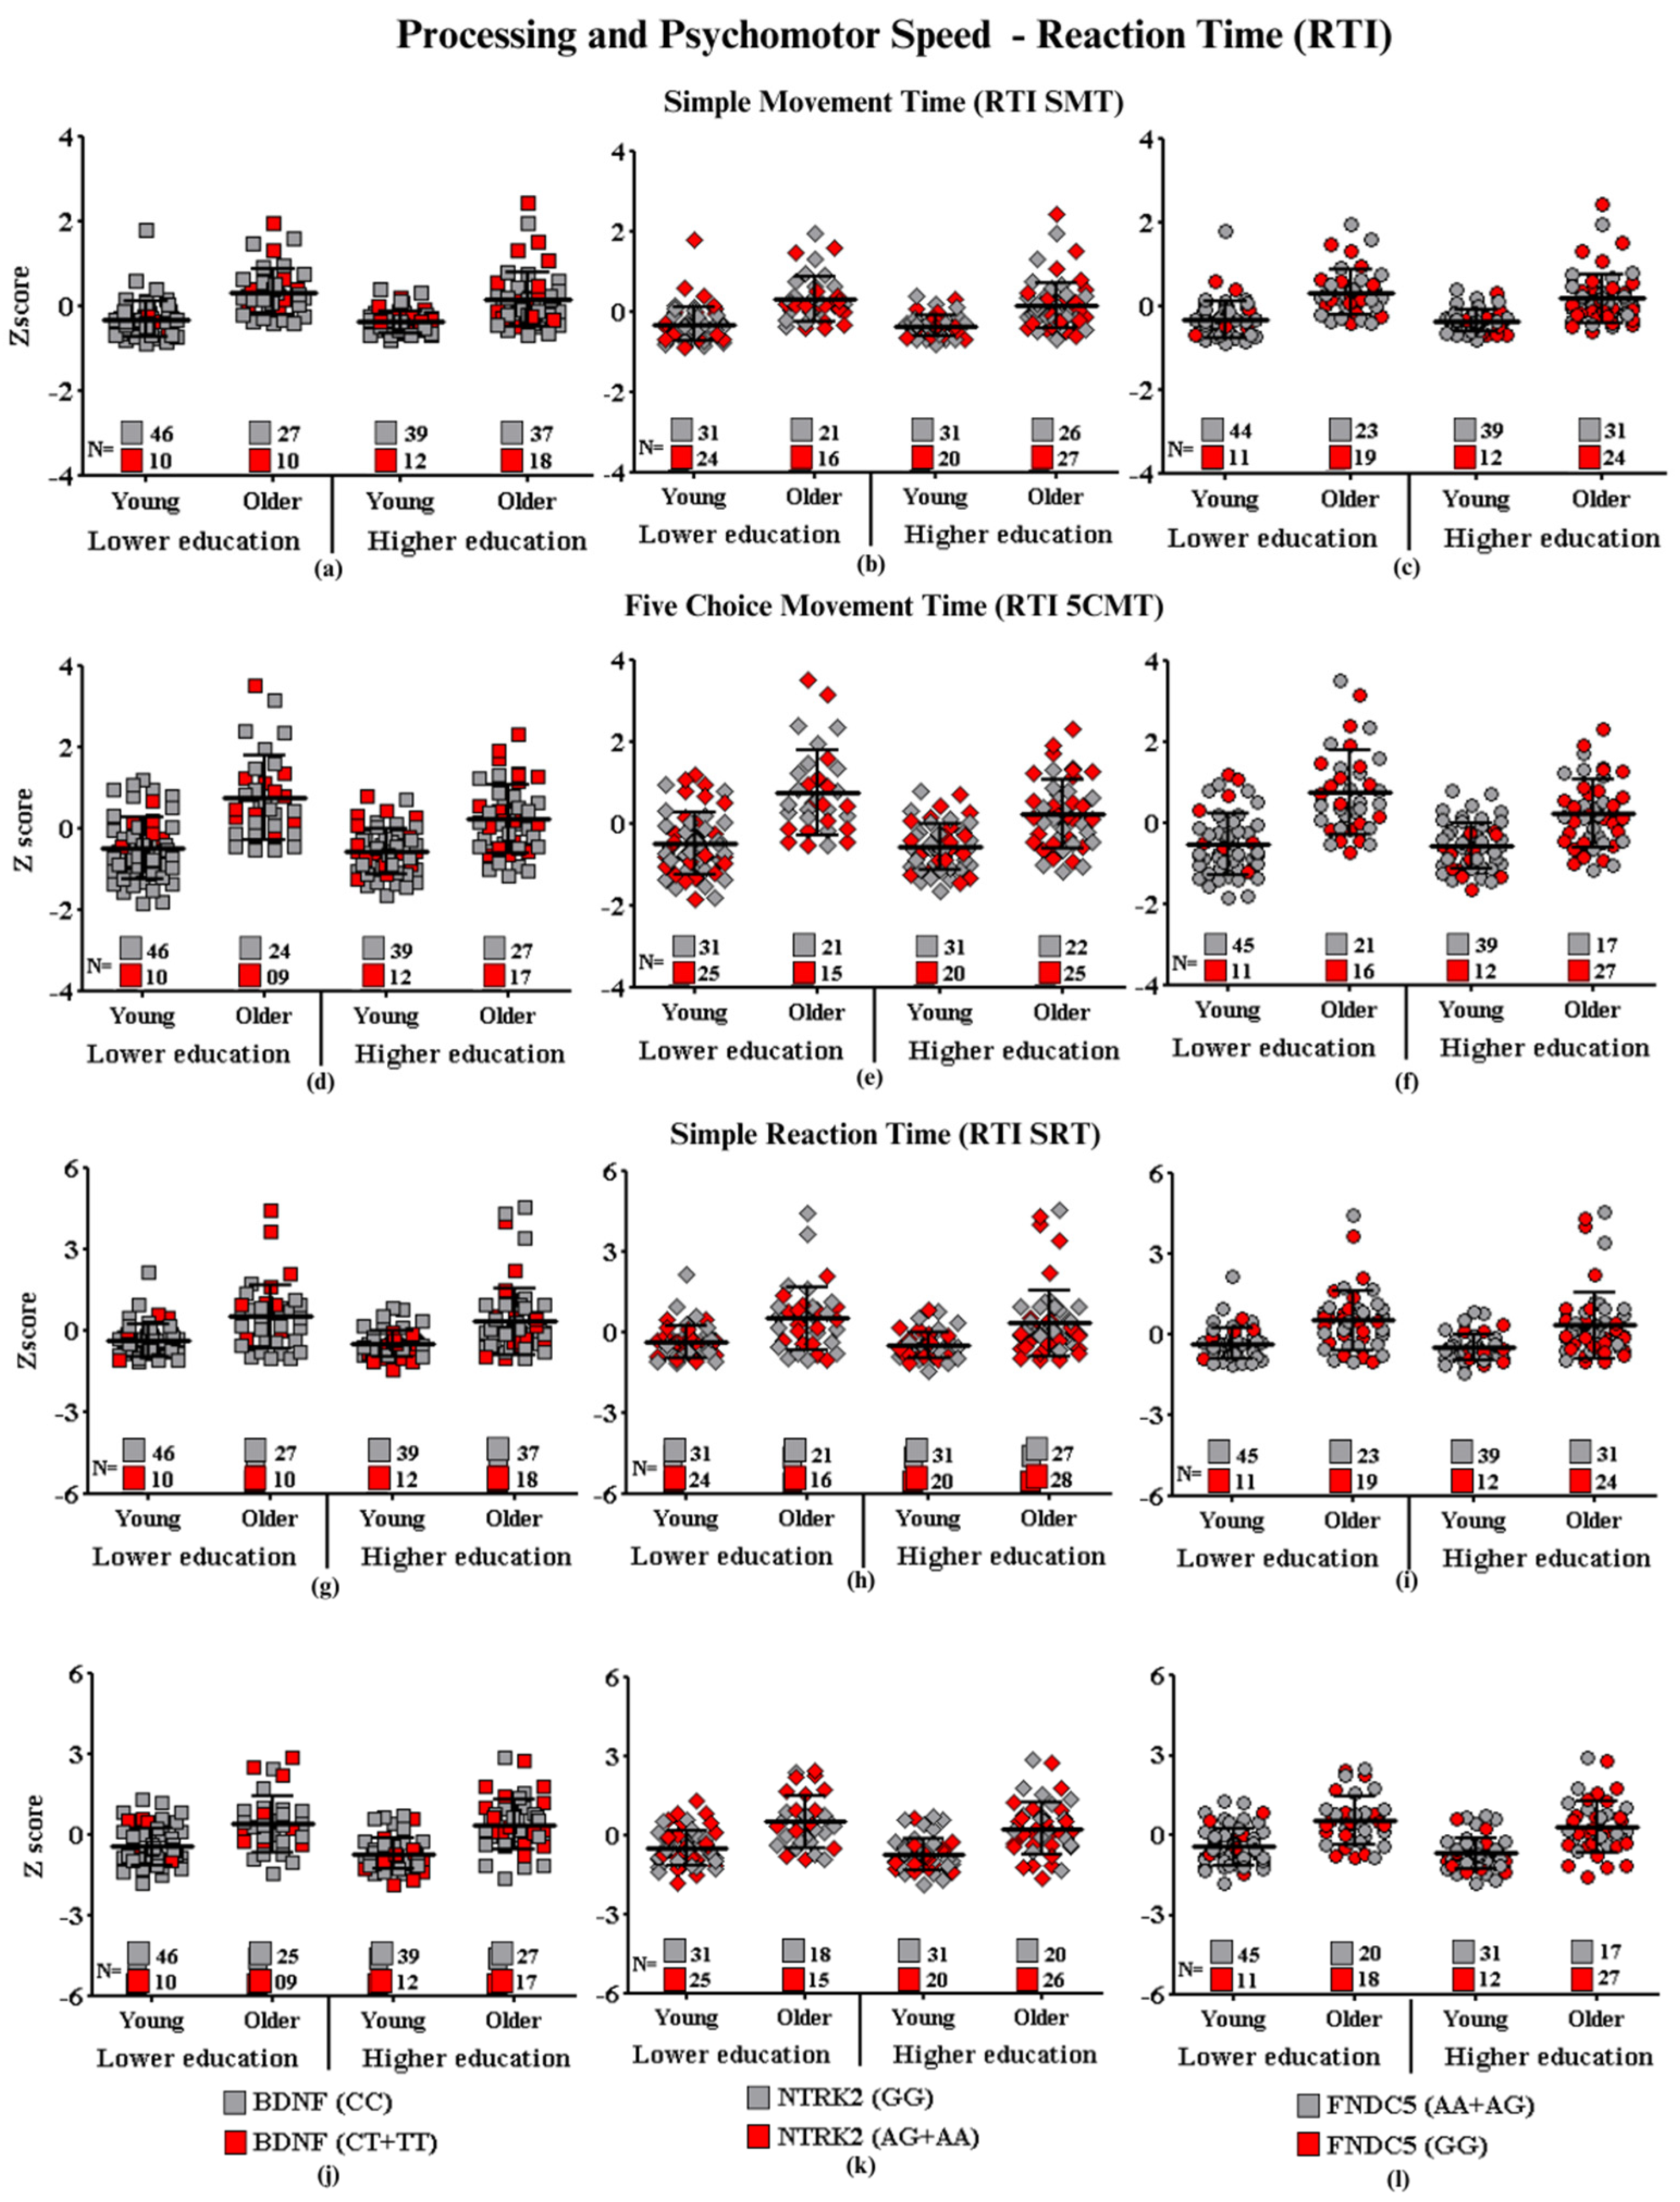
- Subtitle: In the figure above, they are identified with “■”: the subjects with the highest risk in each group, and with “■”: the subjects with the lowest risk in each group. Each icon represents a sample subject. The black lines between the icons represent the means for each group. Squares are used to represent the BDNF gene, diamonds for the NTRK2 gene, and circles for the FNDC5 gene. On the left side of each graph are the groups with lower schooling (young and older), and on the right side are the groups with higher schooling (young and older). At the bottom of each graph, the number of participants in each group and their respective polymorphisms are highlighted.
2.6. Recognition Memory Performance Worsens with Age and Improves with Education
Visual Recognition Memory—Delayed Matched to the Sample

- Subtitle: In the figure above, they are identified with “■”: the subjects with the highest risk in each group, and with “■”: the subjects with the lowest risk in each group. Each icon represents a sample subject. The black lines between the icons represent the means for each group. Squares are used to represent the BDNF gene, diamonds for the NTRK2 gene, and circles for the FNDC5 gene. On the left side of each graph are the groups with lower schooling (young and older), and on the right side are the groups with higher schooling (young and older). At the bottom of each graph, the number of participants in each group and their respective polymorphisms are highlighted.
3. Discussion
3.1. Education, Cognitive Reserve, and Aging
3.2. Genetic Polymorphisms Education and Senile Cognitive Decline
3.2.1. Val66Met (rs6265) of BDNF
3.2.2. NTRK2 (rs2289656)
3.2.3. FNDC5 (rs3840)
3.3. Limitations and Future Directions
4. Materials and Methods
4.1. Participants
4.2. Neuropsychological Assessment
4.3. DNA Extraction, Quantification, and Dilution
4.4. Analysis of Single Nucleotide Polymorphisms (SNPs)
4.5. Statistical Analysis
5. Conclusions
Supplementary Materials
Author Contributions
Funding
Institutional Review Board Statement
Informed Consent Statement
Data Availability Statement
Conflicts of Interest
References
- Murman, D.L. The Impact of Age on Cognition. Semin. Hear. 2015, 36, 111–121. [Google Scholar] [CrossRef]
- Scott, A.J. The longevity society. Lancet Healthy Longev. 2021, 2, e820–e827. [Google Scholar] [CrossRef]
- Niotis, K.; Akiyoshi, K.; Carlton, C.; Isaacson, R. Dementia Prevention in Clinical Practice. Semin. Neurol. 2022, 42, 525–548. [Google Scholar] [CrossRef]
- Maresova, P.; Hruska, J.; Klimova, B.; Barakovic, S.; Krejcar, O. Activities of Daily Living and Associated Costs in the Most Widespread Neurodegenerative Diseases: A Systematic Review. Clin. Interv. Aging 2020, 15, 1841–1862. [Google Scholar] [CrossRef]
- Aranda, M.P.; Kremer, I.N.; Hinton, L.; Zissimopoulos, J.; Whitmer, R.A.; Hummel, C.H.; Trejo, L.; Fabius, C. Impact of dementia: Health disparities, population trends, care interventions, and economic costs. J. Am. Geriatr. Soc. 2021, 69, 1774–1783. [Google Scholar] [CrossRef]
- Navarro-Pardo, E.; Suay, F.; Murphy, M. Ageing: Not only an age-related issue. Mech. Ageing Dev. 2021, 199, 111568. [Google Scholar] [CrossRef]
- Perus, L.; Busto, G.U.; Mangin, J.F.; Le Bars, E.; Gabelle, A. Effects of preventive interventions on neuroimaging biomarkers in subjects at-risk to develop Alzheimer’s disease: A systematic review. Front. Aging Neurosci. 2022, 14, 1014559. [Google Scholar] [CrossRef]
- Tung, H.; Lin, C.H.; Chen, Y.M.; Lee, W.J.; Chien, L.S.; Sun, T.H.; Liao, C.S.; Lin, Y.Y.; Hsiao, T.H. Utilizing apolipoprotein E genotypes and associated comorbidities for the assessment of the risk for dementia. Front. Aging Neurosci. 2022, 14, 927656. [Google Scholar] [CrossRef]
- Everly, J.; Plummer, J.; Lohman, M.; Neils-Strunjas, J. A Tutorial for Speech-Language Pathologists: Physical Activity and Social Engagement to Prevent or Slow Cognitive Decline in Older Adults. Am. J. Speech Lang. Pathol. 2023, 32, 83–95. [Google Scholar] [CrossRef]
- Alfonsetti, M.; d’Angelo, M.; Castelli, V. Neurotrophic factor-based pharmacological approaches in neurological disorders. Neural Regen. Res. 2023, 18, 1220–1228. [Google Scholar] [CrossRef]
- Giustina, A.; Bouillon, R.; Dawson-Hughes, B.; Ebeling, P.R.; Lazaretti-Castro, M.; Lips, P.; Marcocci, C.; Bilezikian, J.P. Vitamin D in the older population: A consensus statement. Endocrine 2023, 79, 31–44. [Google Scholar] [CrossRef]
- Ozawa, H.; Miyazawa, T. Effects of Dietary Food Components on Cognitive Functions in Older Adults. Nutrients 2021, 13, 2804. [Google Scholar] [CrossRef]
- Yu, M.; Zhang, H.; Wang, B.; Zhang, Y.; Zheng, X.; Shao, B.; Zhuge, Q.; Jin, K. Key Signaling Pathways in Aging and Potential Interventions for Healthy Aging. Cells 2021, 10, 660. [Google Scholar] [CrossRef]
- Lin, C.H.; Lin, E.; Lane, H.Y. Genetic Biomarkers on Age-Related Cognitive Decline. Front. Psychiatry 2017, 8, 247. [Google Scholar] [CrossRef]
- Nettiksimmons, J.; Tranah, G.; Evans, D.S.; Yokoyama, J.S.; Yaffe, K. Gene-based aggregate SNP associations between candidate AD genes and cognitive decline. Age 2016, 38, 41. [Google Scholar] [CrossRef]
- Harris, S.E.; Deary, I.J. The genetics of cognitive ability and cognitive ageing in healthy older people. Trends Cogn. Sci. 2011, 15, 388–394. [Google Scholar] [CrossRef]
- Sapkota, S.; Bäckman, L.; Dixon, R.A. Executive function performance and change in aging is predicted by apolipoprotein E, intensified by catechol-O-methyltransferase and brain-derived neurotrophic factor, and moderated by age and lifestyle. Neurobiol. Aging 2017, 52, 81–89. [Google Scholar] [CrossRef]
- Lin, E.; Tsai, S.J.; Kuo, P.H.; Liu, Y.L.; Yang, A.C.; Kao, C.F. Association and interaction effects of Alzheimer’s disease-associated genes and lifestyle on cognitive aging in older adults in a Taiwanese population. Oncotarget 2017, 8, 24077–24087. [Google Scholar] [CrossRef]
- Lövdén, M.; Fratiglioni, L.; Glymour, M.M.; Lindenberger, U.; Tucker-Drob, E.M. Education and Cognitive Functioning Across the Life Span. Psychol. Sci. Public. Interest. 2020, 21, 6–41. [Google Scholar] [CrossRef]
- Opdebeeck, C.; Martyr, A.; Clare, L. Cognitive reserve and cognitive function in healthy older people: A meta-analysis. Neuropsychol. Dev. Cogn. B Aging Neuropsychol. Cogn. 2016, 23, 40–60. [Google Scholar] [CrossRef]
- Bento-Torres, N.V.O.; Bento-Torres, J.; Toms, A.M.; Costa, V.O.; Correa, P.G.R.; Costa, C.N.M.; Jardim, N.Y.V.; Picanco-Diniz, C.W. Influence of schooling and age on cognitive performance in healthy older adults. Braz. J. Med. Biol. Res. 2017, 50, e5892. [Google Scholar] [CrossRef]
- de Azeredo Passos, V.M.; Giatti, L.; Bensenor, I.; Tiemeier, H.; Ikram, M.A.; de Figueiredo, R.C.; Chor, D.; Schmidt, M.I.; Barreto, S.M. Education plays a greater role than age in cognitive test performance among participants of the Brazilian Longitudinal Study of Adult Health (ELSA-Brasil). BMC Neurol. 2015, 15, 191. [Google Scholar] [CrossRef]
- Stern, Y. Cognitive reserve. Neuropsychologia 2009, 47, 2015–2028. [Google Scholar] [CrossRef]
- Stern, Y.; Barnes, C.A.; Grady, C.; Jones, R.N.; Raz, N. Brain reserve, cognitive reserve, compensation, and maintenance: Operationalization, validity, and mechanisms of cognitive resilience. Neurobiol. Aging 2019, 83, 124–129. [Google Scholar] [CrossRef]
- Stern, Y.; Arenaza-Urquijo, E.M.; Bartrés-Faz, D.; Belleville, S.; Cantilon, M.; Chetelat, G.; Ewers, M.; Franzmeier, N.; Kempermann, G.; Kremen, W.S.; et al. Whitepaper: Defining and investigating cognitive reserve, brain reserve, and brain maintenance. Alzheimers Dement. 2020, 16, 1305–1311. [Google Scholar] [CrossRef]
- Negash, S.; Wilson, R.S.; Leurgans, S.E.; Wolk, D.A.; Schneider, J.A.; Buchman, A.S.; Bennett, D.A.; Arnold, S.E. Resilient brain aging: Characterization of discordance between Alzheimer’s disease pathology and cognition. Curr. Alzheimer Res. 2013, 10, 844–851. [Google Scholar] [CrossRef]
- Pettigrew, C.; Soldan, A. Defining Cognitive Reserve and Implications for Cognitive Aging. Curr. Neurol. Neurosci. Rep. 2019, 19, 1. [Google Scholar] [CrossRef]
- Lee, D.H.; Lee, P.; Seo, S.W.; Roh, J.H.; Oh, M.; Oh, J.S.; Oh, S.J.; Kim, J.S.; Jeong, Y. Neural substrates of cognitive reserve in Alzheimer’s disease spectrum and normal aging. Neuroimage 2019, 186, 690–702. [Google Scholar] [CrossRef]
- Oh, H.; Lewis, D.A.; Sibille, E. The Role of BDNF in Age-Dependent Changes of Excitatory and Inhibitory Synaptic Markers in the Human Prefrontal Cortex. Neuropsychopharmacology 2016, 41, 3080–3091. [Google Scholar] [CrossRef]
- Madhu, L.N.; Somayaji, Y.; Shetty, A.K. Promise of irisin to attenuate cognitive dysfunction in aging and Alzheimer’s disease. Ageing Res. Rev. 2022, 78, 101637. [Google Scholar] [CrossRef]
- Islam, M.R.; Valaris, S.; Young, M.F.; Haley, E.B.; Luo, R.; Bond, S.F.; Mazuera, S.; Kitchen, R.R.; Caldarone, B.J.; Bettio, L.E.B.; et al. Exercise hormone irisin is a critical regulator of cognitive function. Nat. Metab. 2021, 3, 1058–1070. [Google Scholar] [CrossRef]
- Cassilhas, R.C.; Tufik, S.; de Mello, M.T. Physical exercise, neuroplasticity, spatial learning and memory. Cell Mol. Life Sci. 2015, 73, 975–983. [Google Scholar] [CrossRef]
- El Hayek, L.; Khalifeh, M.; Zibara, V.; Abi Assaad, R.; Emmanuel, N.; Karnib, N.; El-Ghandour, R.; Nasrallah, P.; Bilen, M.; Ibrahim, P.; et al. Lactate Mediates the Effects of Exercise on Learning and Memory through SIRT1-Dependent Activation of Hippocampal Brain-Derived Neurotrophic Factor (BDNF). J. Neurosci. 2019, 39, 2369–2382. [Google Scholar] [CrossRef]
- Boström, P.; Wu, J.; Jedrychowski, M.P.; Korde, A.; Ye, L.; Lo, J.C.; Rasbach, K.A.; Boström, E.A.; Choi, J.H.; Long, J.Z.; et al. A PGC1-α-dependent myokine that drives brown-fat-like development of white fat and thermogenesis. Nature 2012, 481, 463–468. [Google Scholar] [CrossRef]
- Lourenco, M.V.; Frozza, R.L.; de Freitas, G.B.; Zhang, H.; Kincheski, G.C.; Ribeiro, F.C.; Gonçalves, R.A.; Clarke, J.R.; Beckman, D.; Staniszewski, A.; et al. Exercise-linked FNDC5/irisin rescues synaptic plasticity and memory defects in Alzheimer’s models. Nat. Med. 2019, 25, 165–175. [Google Scholar] [CrossRef]
- Tsai, C.L.; Chen, F.C.; Pan, C.Y.; Wang, C.H.; Huang, T.H.; Chen, T.C. Impact of acute aerobic exercise and cardiorespiratory fitness on visuospatial attention performance and serum BDNF levels. Psychoneuroendocrinology 2014, 41, 121–131. [Google Scholar] [CrossRef]
- Gomes-Osman, J.; Cabral, D.F.; Hinchman, C.; Jannati, A.; Morris, T.P.; Pascual-Leone, A. The effects of exercise on cognitive function and brain plasticity—A feasibility trial. Restor. Neurol. Neurosci. 2017, 35, 547–556. [Google Scholar] [CrossRef]
- Abdu Allah, A.M.; Hammoudah, S.A.; Abd El Gayed, E.M.; El-Attar, L.M.; Shehab-Eldin, W.A. Obesity and its Association with Irisin Level Among Individuals with FNDC5/Irisin Gene Variants RS16835198 and RS726344. Protein Pept. Lett. 2018, 25, 560–569. [Google Scholar] [CrossRef]
- Khidr, E.G.; Ali, S.S.; Elshafey, M.M.; Fawzy, O.A. Association of irisin and FNDC5 rs16835198 G>T gene polymorphism with type 2 diabetes mellitus and diabetic nephropathy. An Egyptian pilot study. Gene 2017, 626, 26–31. [Google Scholar] [CrossRef]
- Sanchis-Gomar, F.; Garatachea, N.; He, Z.H.; Pareja-Galeano, H.; Fuku, N.; Tian, Y.; Arai, Y.; Abe, Y.; Murakami, H.; Miyachi, M.; et al. FNDC5 (irisin) gene and exceptional longevity: A functional replication study with rs16835198 and rs726344 SNPs. Age 2014, 36, 9733. [Google Scholar] [CrossRef]
- de la Monte, S.M.; Wands, J.R. Alzheimer’s disease is type 3 diabetes-evidence reviewed. J. Diabetes Sci. Technol. 2008, 2, 1101–1113. [Google Scholar] [CrossRef]
- Arnold, S.E.; Arvanitakis, Z.; Macauley-Rambach, S.L.; Koenig, A.M.; Wang, H.Y.; Ahima, R.S.; Craft, S.; Gandy, S.; Buettner, C.; Stoeckel, L.E.; et al. Brain insulin resistance in type 2 diabetes and Alzheimer disease: Concepts and conundrums. Nat. Rev. Neurol. 2018, 14, 168–181. [Google Scholar] [CrossRef]
- BRASIL. Censo Escolar da Educação Básica 2022: Resumo Técnico; Educação, M.D., Ed.; Instituto Nacional de Estudos e Pesquisas Educacionais Anísio Teixeira—INEP: Brasilia, Brazil, 2023. [Google Scholar]
- de Rover, M.; Pironti, V.A.; McCabe, J.A.; Acosta-Cabronero, J.; Arana, F.S.; Morein-Zamir, S.; Hodges, J.R.; Robbins, T.W.; Fletcher, P.C.; Nestor, P.J.; et al. Hippocampal dysfunction in patients with mild cognitive impairment: A functional neuroimaging study of a visuospatial paired associates learning task. Neuropsychologia 2011, 49, 2060–2070. [Google Scholar] [CrossRef]
- Sousa, S.S.; Amaro, E.; Crego, A.; Gonçalves, Ó.; Sampaio, A. Developmental trajectory of the prefrontal cortex: A systematic review of diffusion tensor imaging studies. Brain Imaging Behav. 2018, 12, 1197–1210. [Google Scholar] [CrossRef]
- Owen, A.M.; Downes, J.J.; Sahakian, B.J.; Polkey, C.E.; Robbins, T.W. Planning and spatial working memory following frontal lobe lesions in man. Neuropsychologia 1990, 28, 1021–1034. [Google Scholar] [CrossRef]
- Sahakian, B.J.; Downes, J.J.; Eagger, S.; Evenden, J.L.; Levy, R.; Philpot, M.P.; Roberts, A.C.; Robbins, T.W. Sparing of attentional relative to mnemonic function in a subgroup of patients with dementia of the Alzheimer type. Neuropsychologia 1990, 28, 1197–1213. [Google Scholar] [CrossRef]
- Persson, J.; Kalpouzos, G.; Nilsson, L.G.; Ryberg, M.; Nyberg, L. Preserved hippocampus activation in normal aging as revealed by fMRI. Hippocampus 2011, 21, 753–766. [Google Scholar] [CrossRef]
- Lenehan, M.E.; Summers, M.J.; Saunders, N.L.; Summers, J.J.; Vickers, J.C. Does the Cambridge Automated Neuropsychological Test Battery (CANTAB) Distinguish Between Cognitive Domains in Healthy Older Adults? Assessment 2015, 23, 163–172. [Google Scholar] [CrossRef]
- Owen, A.M.; Beksinska, M.; James, M.; Leigh, P.N.; Summers, B.A.; Marsden, C.D.; Quinn, N.P.; Sahakian, B.J.; Robbins, T.W. Visuospatial memory deficits at different stages of parkinson’s disease. Neuropsychology 1993, 31, 627–644. [Google Scholar] [CrossRef]
- Sahakian, B.J.; Morris, R.G.; Evenden, J.L.; Heald, A.; Levy, R.; Philpot, M.; Robbins, T.W. A comparative study of visuospatial memory and learning in alzheimer-type dementia and parkinson’s disease. Brain 1988, 111, 695–718. [Google Scholar] [CrossRef]
- Persson, K.; Eldholm, R.S.; Barca, M.L.; Cavallin, L.; Ferreira, D.; Knapskog, A.B.; Selbæk, G.; Brækhus, A.; Saltvedt, I.; Westman, E.; et al. MRI-assessed atrophy subtypes in Alzheimer’s disease and the cognitive reserve hypothesis. PLoS ONE 2017, 12, e0186595. [Google Scholar] [CrossRef]
- Meng, X.; D’Arcy, C. Education and dementia in the context of the cognitive reserve hypothesis: A systematic review with meta-analyses and qualitative analyses. PLoS ONE 2012, 7, e38268. [Google Scholar] [CrossRef]
- Xu, W.; Tan, L.; Wang, H.F.; Tan, M.S.; Li, J.Q.; Zhao, Q.F.; Yu, J.T. Education and Risk of Dementia: Dose-Response Meta-Analysis of Prospective Cohort Studies. Mol. Neurobiol. 2016, 53, 3113–3123. [Google Scholar] [CrossRef]
- Stern, Y.; Gurland, B.; Tatemichi, T.K.; Tang, M.X.; Wilder, D.; Mayeux, R. Influence of education and occupation on the incidence of Alzheimer’s disease. JAMA 1994, 271, 1004–1010. [Google Scholar] [CrossRef]
- Chapko, D.; McCormack, R.; Black, C.; Staff, R.; Murray, A. Life-course determinants of cognitive reserve (CR) in cognitive aging and dementia—A systematic literature review. Aging Ment. Health 2018, 22, 915–926. [Google Scholar] [CrossRef]
- Cheng, S.T. Cognitive Reserve and the Prevention of Dementia: The Role of Physical and Cognitive Activities. Curr. Psychiatry Rep. 2016, 18, 85. [Google Scholar] [CrossRef]
- Seblova, D.; Berggren, R.; Lövdén, M. Education and age-related decline in cognitive performance: Systematic review and meta-analysis of longitudinal cohort studies. Ageing Res. Rev. 2020, 58, 101005. [Google Scholar] [CrossRef]
- Wilson, R.S.; Hebert, L.E.; Scherr, P.A.; Barnes, L.L.; Mendes de Leon, C.F.; Evans, D.A. Educational attainment and cognitive decline in old age. Neurology 2009, 72, 460–465. [Google Scholar] [CrossRef]
- Amoretti, S.; Cabrera, B.; Torrent, C.; Bonnín, C.D.M.; Mezquida, G.; Garriga, M.; Jiménez, E.; Martínez-Arán, A.; Solé, B.; Reinares, M.; et al. Cognitive Reserve Assessment Scale in Health (CRASH): Its Validity and Reliability. J. Clin. Med. 2019, 8, 586. [Google Scholar] [CrossRef]
- Liu, H.; Li, Y.; Wang, J.; Su, N.; Cui, N.; Xu, K.; Sun, Y.; Cao, F. Psychometric properties of the Chinese version of the Cognitive Reserve Assessment Scale in Health in patients with cancer. BMC Psychiatry 2023, 23, 5. [Google Scholar] [CrossRef]
- Contador, I.; Del Ser, T.; Llamas, S.; Villarejo, A.; Benito-León, J.; Bermejo-Pareja, F. Impact of literacy and years of education on the diagnosis of dementia: A population-based study. J. Clin. Exp. Neuropsychol. 2017, 39, 112–119. [Google Scholar] [CrossRef]
- Jefferson, A.L.; Gibbons, L.E.; Rentz, D.M.; Carvalho, J.O.; Manly, J.; Bennett, D.A.; Jones, R.N. A life course model of cognitive activities, socioeconomic status, education, reading ability, and cognition. J. Am. Geriatr. Soc. 2011, 59, 1403–1411. [Google Scholar] [CrossRef]
- Nogueira, J.; Gerardo, B.; Santana, I.; Simões, M.R.; Freitas, S. The Assessment of Cognitive Reserve: A Systematic Review of the Most Used Quantitative Measurement Methods of Cognitive Reserve for Aging. Front. Psychol. 2022, 13, 847186. [Google Scholar] [CrossRef]
- Song, S.; Stern, Y.; Gu, Y. Modifiable lifestyle factors and cognitive reserve: A systematic review of current evidence. Ageing Res. Rev. 2022, 74, 101551. [Google Scholar] [CrossRef]
- Li, Y.; Wang, M.; Cong, L.; Hou, T.; Song, L.; Wang, X.; Shi, L.; Dekhtyar, S.; Wang, Y.; Du, Y.; et al. Lifelong Cognitive Reserve, Imaging Markers of Brain Aging, and Cognitive Function in Dementia-Free Rural Older Adults: A Population-Based Study. J. Alzheimers Dis. 2023, 92, 261–272. [Google Scholar] [CrossRef]
- Abellaneda-Pérez, K.; Cattaneo, G.; Cabello-Toscano, M.; Solana-Sánchez, J.; Mulet-Pons, L.; Vaqué-Alcázar, L.; Perellón-Alfonso, R.; Solé-Padullés, C.; Bargalló, N.; Tormos, J.M.; et al. Purpose in life promotes resilience to age-related brain burden in middle-aged adults. Alzheimers Res. Ther. 2023, 15, 49. [Google Scholar] [CrossRef]
- Guo, J.; Brickman, A.M.; Manly, J.J.; Reitz, C.; Schupf, N.; Mayeux, R.P.; Gu, Y. Association of Life’s Simple 7 with incident dementia and its modification by the apolipoprotein E genotype. Alzheimers Dement. 2021, 17, 1905–1913. [Google Scholar] [CrossRef]
- Stern, Y. Cognitive reserve in ageing and Alzheimer’s disease. Lancet Neurol. 2012, 11, 1006–1012. [Google Scholar] [CrossRef]
- Zhang, W.; Tang, F.; Chen, Y.; Silverstein, M.; Liu, S.; Dong, X. Education, Activity Engagement, and Cognitive Function in US Chinese Older Adults. J. Am. Geriatr. Soc. 2019, 67, S525–S531. [Google Scholar] [CrossRef]
- Nayak, M.; Das, D.; Pradhan, J.; Ahmed, R.G.; Laureano-Melo, R.; Dandapat, J. Epigenetic signature in neural plasticity: The journey so far and journey ahead. Heliyon 2022, 8, e12292. [Google Scholar] [CrossRef]
- Hong, C.J.; Liou, Y.J.; Tsai, S.J. Effects of BDNF polymorphisms on brain function and behavior in health and disease. Brain Res. Bull. 2011, 86, 287–297. [Google Scholar] [CrossRef]
- Pruunsild, P.; Kazantseva, A.; Aid, T.; Palm, K.; Timmusk, T. Dissecting the human BDNF locus: Bidirectional transcription, complex splicing, and multiple promoters. Genomics 2007, 90, 397–406. [Google Scholar] [CrossRef]
- Avgan, N.; Sutherland, H.G.; Spriggens, L.K.; Yu, C.; Ibrahim, O.; Bellis, C.; Haupt, L.M.; Shum, D.H.; Griffiths, L.R. BDNF Variants May Modulate Long-Term Visual Memory Performance in a Healthy Cohort. Int. J. Mol. Sci. 2017, 18, 655. [Google Scholar] [CrossRef]
- Frois, T.; Faria, L.O.; Souza, R.P.; da Silva Cunha, A.E.; de Holanda Marinho Nogueira, N.G.; Tavares Lim, V.; de Sousa Fortes, L.; de Miranda, D.M.; Bertollo, M.; Albuquerque, M.R. Are COMT Val158Met (rs4680), DRD2 TaqIA (rs1800497), and BDNF Val66Met (rs6265) polymorphisms associated with executive functions performance at rest and during physical exercise? Physiol. Behav. 2022, 257, 113973. [Google Scholar] [CrossRef]
- Dennis, N.A.; Cabeza, R.; Need, A.C.; Waters-Metenier, S.; Goldstein, D.B.; LaBar, K.S. Brain-derived neurotrophic factor val66met polymorphism and hippocampal activation during episodic encoding and retrieval tasks. Hippocampus 2011, 21, 980–989. [Google Scholar] [CrossRef]
- Karnik, M.S.; Wang, L.; Barch, D.M.; Morris, J.C.; Csernansky, J.G. BDNF polymorphism rs6265 and hippocampal structure and memory performance in healthy control subjects. Psychiatry Res. 2010, 178, 425–429. [Google Scholar] [CrossRef]
- Egan, M.F.; Kojima, M.; Callicott, J.H.; Goldberg, T.E.; Kolachana, B.S.; Bertolino, A.; Zaitsev, E.; Gold, B.; Goldman, D.; Dean, M.; et al. The BDNF val66met polymorphism affects activity-dependent secretion of BDNF and human memory and hippocampal function. Cell 2003, 112, 257–269. [Google Scholar] [CrossRef]
- Ng, T.K.S.; Ho, C.S.H.; Tam, W.W.S.; Kua, E.H.; Ho, R.C. Decreased Serum Brain-Derived Neurotrophic Factor (BDNF) Levels in Patients with Alzheimer’s Disease (AD): A Systematic Review and Meta-Analysis. Int. J. Mol. Sci. 2019, 20, 257. [Google Scholar] [CrossRef]
- Kennedy, K.M.; Reese, E.D.; Horn, M.M.; Sizemore, A.N.; Unni, A.K.; Meerbrey, M.E.; Kalich, A.G.; Rodrigue, K.M. BDNF val66met polymorphism affects aging of multiple types of memory. Brain Res. 2015, 1612, 104–117. [Google Scholar] [CrossRef]
- Stuart, K.; Summers, M.J.; Valenzuela, M.J.; Vickers, J.C. BDNF and COMT polymorphisms have a limited association with episodic memory performance or engagement in complex cognitive activity in healthy older adults. Neurobiol. Learn. Mem. 2014, 110, 1–7. [Google Scholar] [CrossRef]
- Laing, K.R.; Mitchell, D.; Wersching, H.; Czira, M.E.; Berger, K.; Baune, B.T. Brain-derived neurotrophic factor (BDNF) gene: A gender-specific role in cognitive function during normal cognitive aging of the MEMO-Study? Age 2012, 34, 1011–1022. [Google Scholar] [CrossRef]
- Gong, P.; Zheng, Z.; Chi, W.; Lei, X.; Wu, X.; Chen, D.; Zhang, K.; Zheng, A.; Gao, X.; Zhang, F. An association study of the genetic polymorphisms in 13 neural plasticity-related genes with semantic and episodic memories. J. Mol. Neurosci. 2012, 46, 352–361. [Google Scholar] [CrossRef]
- Yamada, K.; Nabeshima, T. Brain-derived neurotrophic factor/TrkB signaling in memory processes. J. Pharmacol. Sci. 2003, 91, 267–270. [Google Scholar] [CrossRef]
- Sanders, C.L.; Rattinger, G.B.; Deberard, M.S.; Hammond, A.G.; Wengreen, H.; Kauwe, J.S.K.; Buhusi, M.; Tschanz, J.T. Interaction Between Physical Activity and Genes Related to Neurotrophin Signaling in Late-Life Cognitive Performance: The Cache County Study. J. Gerontol. A Biol. Sci. Med. Sci. 2020, 75, 1633–1642. [Google Scholar] [CrossRef]
- Wrann, C.D.; White, J.P.; Salogiannnis, J.; Laznik-Bogoslavski, D.; Wu, J.; Ma, D.; Lin, J.D.; Greenberg, M.E.; Spiegelman, B.M. Exercise induces hippocampal BDNF through a PGC-1α/FNDC5 pathway. Cell Metab. 2013, 18, 649–659. [Google Scholar] [CrossRef]
- Siteneski, A.; Cunha, M.P.; Lieberknecht, V.; Pazini, F.L.; Gruhn, K.; Brocardo, P.S.; Rodrigues, A.L.S. Central irisin administration affords antidepressant-like effect and modulates neuroplasticity-related genes in the hippocampus and prefrontal cortex of mice. Prog. Neuropsychopharmacol. Biol. Psychiatry 2018, 84, 294–303. [Google Scholar] [CrossRef]
- Yang, X.; Ni, L.; Sun, J.; Yuan, X.; Li, D. Associations between rs3480 and rs16835198 gene polymorphisms of. Front Endocrinol. 2022, 13, 946982. [Google Scholar] [CrossRef]
- Wrann, C.D. FNDC5/irisin—Their role in the nervous system and as a mediator for beneficial effects of exercise on the brain. Brain Plast. 2015, 1, 55–61. [Google Scholar] [CrossRef]
- Timmons, J.A.; Baar, K.; Davidsen, P.K.; Atherton, P.J. Is irisin a human exercise gene? Nature 2012, 488, E9–E10, discussion E10–E11. [Google Scholar] [CrossRef]
- Brondani, L.A.; Boelter, G.; Assmann, T.S.; Leitão, C.B.; Canani, L.H.; Crispim, D. Irisin-encoding gene (FNDC5) variant is associated with changes in blood pressure and lipid profile in type 2 diabetic women but not in men. Metabolism 2015, 64, 952–957. [Google Scholar] [CrossRef]
- Folch, J.; Olloquequi, J.; Ettcheto, M.; Busquets, O.; Sánchez-López, E.; Cano, A.; Espinosa-Jiménez, T.; García, M.L.; Beas-Zarate, C.; Casadesús, G.; et al. The Involvement of Peripheral and Brain Insulin Resistance in Late Onset Alzheimer’s Dementia. Front. Aging Neurosci. 2019, 11, 236. [Google Scholar] [CrossRef]
- Fagundo, A.B.; Jiménez-Murcia, S.; Giner-Bartolomé, C.; Agüera, Z.; Sauchelli, S.; Pardo, M.; Crujeiras, A.B.; Granero, R.; Baños, R.; Botella, C.; et al. Modulation of Irisin and Physical Activity on Executive Functions in Obesity and Morbid obesity. Sci. Rep. 2016, 6, 30820. [Google Scholar] [CrossRef]
- Dun, S.L.; Lyu, R.M.; Chen, Y.H.; Chang, J.K.; Luo, J.J.; Dun, N.J. Irisin-immunoreactivity in neural and non-neural cells of the rodent. Neuroscience 2013, 240, 155–162. [Google Scholar] [CrossRef]
- Grouselle, D.; Winsky-Sommerer, R.; David, J.P.; Delacourte, A.; Dournaud, P.; Epelbaum, J. Loss of somatostatin-like immunoreactivity in the frontal cortex of Alzheimer patients carrying the apolipoprotein epsilon 4 allele. Neurosci. Lett. 1998, 255, 21–24. [Google Scholar] [CrossRef]
- Staub, B.; Doignon-Camus, N.; Després, O.; Bonnefond, A. Sustained attention in the elderly: What do we know and what does it tell us about cognitive aging? Ageing Res. Rev. 2013, 12, 459–468. [Google Scholar] [CrossRef]
- Vallesi, A.; Tronelli, V.; Lomi, F.; Pezzetta, R. Age differences in sustained attention tasks: A meta-analysis. Psychon. Bull. Rev. 2021, 28, 1755–1775. [Google Scholar] [CrossRef]
- Schatz, P.; Browndyke, J. Applications of computer-based neuropsychological assessment. J. Head. Trauma. Rehabil. 2002, 17, 395–410. [Google Scholar] [CrossRef]
- Robbins, T.W.; James, M.; Owen, A.M.; Sahakian, B.J.; McInnes, L.; Rabbitt, P. Cambridge Neuropsychological Test Automated Battery (CANTAB): A factor analytic study of a large sample of normal elderly volunteers. Dementia 1994, 5, 266–281. [Google Scholar] [CrossRef]
- Laukka, E.J.; Köhncke, Y.; Papenberg, G.; Fratiglioni, L.; Bäckman, L. Combined genetic influences on episodic memory decline in older adults without dementia. Neuropsychology 2020, 34, 654–666. [Google Scholar] [CrossRef]
- Bertolucci, P.H.; Brucki, S.M.; Campacci, S.R.; Juliano, Y. The Mini-Mental State Examination in a general population: Impact of educational status. Arq. Neuropsiquiatr. 1994, 52, 1–7. [Google Scholar] [CrossRef]
- Soares, F.C.; de Oliveira, T.C.; de Macedo, L.D.; Tomás, A.M.; Picanço-Diniz, D.L.; Bento-Torres, J.; Bento-Torres, N.V.; Picanço-Diniz, C.W. CANTAB object recognition and language tests to detect aging cognitive decline: An exploratory comparative study. Clin. Interv. Aging 2015, 10, 37–48. [Google Scholar] [CrossRef]
- Cognition, C. CANTAB Eclipse Version 3—Test Administration Guide; Cambridge Cognition Limited: Cambridge, UK, 2006; pp. 1–265. [Google Scholar]
- Davidson, R.; MacKinnon, J.G. Bootstrap tests: How many bootstraps? Econom. Rev. 2000, 1, 55–68. [Google Scholar] [CrossRef]
- Sawilowsky, S.S. New Effect Size Rules of Thumb. J. Mod. Appl. Stat. Methods 2009, 8, 597–599. [Google Scholar] [CrossRef]
Disclaimer/Publisher’s Note: The statements, opinions, and data contained in all publications are solely those of the individual author(s) and contributor(s) and not of MDPI and/or the editor(s). MDPI and/or the editor(s) disclaim responsibility for any injury to people or property resulting from any ideas, methods, instructions, or products referred to in the content. |

| Groups | Young Lower Education | Young Higher Education | Older Lower Education | Older Higher Education | Total |
|---|---|---|---|---|---|
| SNP BDNF (rs6265) | CC: 46 CT + TT: 10 | CC: 39 CT + TT: 12 | CC: 28 CT + TT: 10 | CC: 37 CT + TT: 18 | CC: 150 CT + TT: 50 |
| SNP NTRK2 (rs2289656) | GG: 31 AA + AG: 25 | GG: 31 AA + AG: 20 | GG: 22 AA + AG: 16 | GG: 27 AA + AG: 28 | GG: 111 AA + AG: 89 |
| SNP FNDC5 (rs3840) | GG: 11 AA + AG: 45 | GG: 12 AA + AG: 39 | GG: 16 AA + AG: 22 | GG: 31 AA + AG: 24 | GG: 70 AA + AG: 130 |
| Tests | Groups (n) | Mean ± SD | CI 95% | d | Age (F) | Education (F) | Interaction (F) |
|---|---|---|---|---|---|---|---|
| SWM strategy (score) | Young lower education (75) Older lower education (126) | −0.75 ± 1.04 0.44 ± 0.61 | −1.81, −1.17 *** | 1.49 | 270.60 *** | 0.14 | 1.91 |
| Young lower education (75) Young higher education (75) | −0.75 ± 1.04 −0.89 ± 0.97 | −0.18, 0.46 | 0.14 | ||||
| Young higher education (75) Older higher education (126) | −0.89 ± 0.97 0.52 ± 0.56 | 1.57, −2.25 *** | 1.91 | ||||
| Older lower education (126) Older higher education (126) | 0.44 ± 0.61 0.52 ± 0.56 | −0.11, 0.38 | 0.14 | ||||
| SWM total errors (score) | Young lower education (75) Older lower education (126) | −0.97 ± 0.82 0.61 ± 0.61 | 1.91, 2.63 *** | 2.27 | 503.41 *** | 0.23 | 0.36 |
| Young lower education (75) Young higher education (75) | −0.97 ± 0.82 −0.96 ± 0.81 | −0.31, 0.33 | 0.01 | ||||
| Young higher education (75) Older higher education (126) | −0.96 ± 0.81 0.53 ± 0.48 | −2.76, −2.02 *** | 2.39 | ||||
| Older lower education (126) Older higher education (126) | 0.61 ± 0.61 0.53 ± 0.48 | −0.10, 0.39 | 0.15 |
| Tests | Groups | Mean ± SD | CI 95% | d | Age (F) | Education (F) | Interaction (F) |
|---|---|---|---|---|---|---|---|
| RVP latency (ms) | Young lower education (75) Older lower education (126) | −0.58 ± 0.58 0.57 ± 0.96 | 1.05, 1.69 *** | 1.37 | 168.86 *** | 9.85 ** | 0.10 |
| Young lower education (75) Young higher education (75) | −0.58 ± 0.58 −0.82 ± 0.46 | 0.13, 0.78 | 0.46 | ||||
| Young higher education (75) Older higher education (126) | −0.82 ± 0.46 0.27 ± 0.96 | 1.03, 1.66 *** | 1.34 | ||||
| Older lower education (126) Older higher education (126) | 0.57 ± 0.96 0.27 ± 0.96 | 0.06, 0.56 ** | 0.31 | ||||
| RVP A’ (score) | Young lower education (75) Older lower education (126) | 0.46 ± 0.59 −0.57 ± 1.15 | 0.75, 1.35 *** | 1.05 | 104.92 *** | 14.10 *** | 1.27 |
| Young lower education (75) Young higher education (75) | 0.46 ± 0.59 0.69 ± 0.49 | 0.10, 0.75 | 0.42 | ||||
| Young higher education (75) Older higher education (126) | 0.69 ± 0.49 −0.12 ± 0.86 | 1.32, 1.98 *** | 1.65 | ||||
| Older lower education (126) Older higher education (126) | 0.57 ± 1.15 −0.12 ± 0.86 | 0.19, 0.69 *** | 0.44 | ||||
| RVP probability of hits (score) | Young lower education (75) Older lower education (126) | 0.37 ± 0.97 −0.47 ± 0.92 | 0.60, 1.19 *** | 0.89 | 98.84 *** | 13.61 *** | 0.42 |
| Young lower education (75) Young higher education (75) | 0.37 ± 0.97 0.76 ± 0.78 | 0.12, 0.77 ** | 0.44 | ||||
| Young higher education (75) Older higher education (126) | 0.76 ± 0.78 −0.20 ± 0.84 | 0.87, 1.48 *** | 1.17 | ||||
| Older lower education (126) Older higher education (126) | −0.47 ± 0.92 −0.20 ± 0.84 | 0.06, 0.55 ** | 0.31 |
| Tests | Groups | Mean ± SD | CI 95% | d | Age (F) | Education (F) | Interaction (F) |
|---|---|---|---|---|---|---|---|
| PAL total errors adjusted (score) | Young lower education (75) Older lower education (126) | −0.75 ± 0.34 0.69 ± 0.96 | 1.61, 2.39 *** | 2.00 | 268.72 *** | 10.93 ** | 4.09 * |
| Young lower education (75) Young higher education (75) | −0.75 ± 0.34 −0.85 ± 0.24 | 0.02, 0.66 | 0.34 | ||||
| Young higher education (75) Older higher education (126) | −0.85 ± 0.24 0.27 ± 0.91 | 1.20, 1.84 *** | 1.52 | ||||
| Older lower education (126) Older higher education (126) | 0.69 ± 0.96 0.27 ± 0.91 | 0.20, 0.70 *** | 0.45 | ||||
| PAL mean trials to success (score) | Young lower education (75) Older lower education (126) | −0.81 ± 0.40 0.71 ± 0.87 | 1.25, 1.90 *** | 1.57 | 349.64 *** | 10.37 *** | 2.83 |
| Young lower education (75) Young higher education (75) | −0.81 ± 0.40 −0.93 ± 0.31 | 0.01, 0.66 | 0.34 | ||||
| Young higher education (75) Older higher education (126) | −0.93 ± 0.31 0.34 ± 0.87 | 1.44, 2.11 *** | 1.78 | ||||
| Older lower education (126) Older higher education (126) | 0.71 ± 0.87 0.34 ± 0.87 | 0.18, 0.54 *** | 0.42 | ||||
| PAL first trial memory score (score) | Young lower education (75) Older lower education (126) | 0.73 ± 0.75 −0.66 ± 0.74 | 1.53, 2.21 *** | 1.87 | 286.87 *** | 10.67 *** | 0.99 |
| Young lower education (75) Young higher education (75) | 0.73 ± 0.75 0.91 ± 0.80 | −0.09, 0.55 | 0.23 | ||||
| Young higher education (75) Older higher education (126) | 0.91 ± 0.80 −0.32 ± 0.73 | 1.30, 1.95 *** | 1.63 | ||||
| Older lower education (126) Older higher education (126) | −0.66 ± 0.74 −0.32 ± 0.73 | 0.21, 0.71 *** | 0.46 |
| Tests | Groups | Mean ± SD | CI 95% | d | Age (F) | Education (F) | Interaction (F) |
|---|---|---|---|---|---|---|---|
| RTI simple accuracy score (score) | Young lower education (75) Older lower education (126) | 0.22 ± 0.43 −0.21 ± 1.16 | 0.16, 0.74 ** | 0.45 | 24.87 *** | 1.28 | 0.44 |
| Young lower education (75) Young higher education (75) | 0.22 ± 0.43 0.40 ± 0.28 | 0.17, 0.82 | 0.50 | ||||
| Young higher education (75) Older higher education (126) | 0.40 ± 0.28 −0.16 ± 1.22 | 0.28, 0.86 *** | 0.57 | ||||
| Older lower education (126) Older higher education (126) | −0.21 ± 1.16 −0.16 ± 1.22 | −0.20, 0.29 | 0.04 | ||||
| RTI five-choice accuracy score (score) | Young lower education (75) Older lower education (126) | 0.09 ± 0.70 −0.15 ± 1.29 | −0.07, 0.50 | 0.22 | 10.73 *** | 2.10 | 0.71 |
| Young lower education (75) Young higher education (75) | 0.09 ± 0.70 0.32 ± 0.39 | 0.08, 0.73 | 0.41 | ||||
| Young higher education (75) Older higher education (126) | 0.32 ± 0.39 −0.09 ± 1.02 | 0.23, 0.62 ** | 0.50 | ||||
| Older lower education (126) Older higher education (126) | −0.15 ± 1.29 −0.09 ± 1.02 | −0.27, 0.37 | 0.05 |
| Tests | Groups | Mean ± SD | CI 95% | d | Age (F) | Education (F) | Interaction (F) |
|---|---|---|---|---|---|---|---|
| RTI simple movement time (ms) | Young lower education (75) Older lower education (126) | −0.29± 0.40 0.18± 0.48 | 0.74, 1.34 | 1.04 | 22.93 *** | 0.01 | 0.001 |
| Young lower education (75) Young higher education (75) | −0.29± 0.40 −0.31 ± 0.29 | −0.26, 0.38 | 0.06 | ||||
| Young higher education (75) Older higher education (126) | −0.31 ± 0.29 0.17± 1.62 | 0.08, 0.66 | 0.37 | ||||
| Older lower education (126) Older higher education (126) | 0.18± 0.48 0.17± 1.62 | −0.24, 0.26 | 0.01 | ||||
| RTI five-choice movement time (ms) | Young lower education (75) Older lower education (126) | −0.47± 0.71 0.56± 1.05 | 0.79, 1.40 | 1.10 | 89.47 *** | 9.23 ** | 2.79 |
| Young lower education (75) Young higher education (75) | −0.47± 0.71 −0.60 ± 0.54 | −0.11, 0.53 | 0.21 | ||||
| Young higher education (75) Older higher education (126) | −0.60 ± 0.54 0.12 ± 0.97 | 0.56, 1.16 | 0.86 | ||||
| Older lower education (126) Older higher education (126) | 0.56± 1.05 0.12 ± 0.97 | 0.19, 0.69 | 0.44 | ||||
| RTI simple reaction time (ms) | Young lower education (75) Older lower education (126) | −0.29 ± 0.59 0.21± 1.00 | −0.73, −0.28 | 0.58 | 37.09 *** | 0.47 | 0.98 |
| Young lower education (75) Young higher education (75) | −0.29± 0.59 −0.46± 0.49 | −0.01, 0.64 | 0.31 | ||||
| Young higher education (75) Older higher education (126) | −0.46± 0.49 0.24 ± 1.24 | 0.38, 0.96 | 0.67 | ||||
| Older lower education (126) Older higher education (126) | 0.21± 1.00 0.24 ± 1.24 | −0.22, 0.27 | 0.03 | ||||
| RTI five-choice reaction time (ms) | Young lower education (75) Older lower education (126) | −0.36± 0.70 0.36 ± 1.06 | 0.47, 1.06 | 0.76 | 72.70 *** | 3.27 | |
| Young lower education (75) Young higher education (75) | −0.36 ± 0.70 −0.63 ± 0.71 | 0.06, 0.71 | 0.38 | ||||
| Young higher education (75) Older higher education (126) | −0.63 ± 0.71 0.28 ± 0.97 | 0.73, 1.33 | 1.03 | ||||
| Older lower education (126) Older higher education (126) | 0.36 ± 1.06 0.28 ± 0.97 | −0.24, 0.40 | 0.08 |
| Tests | Groups | Mean ± SD | CI 95% | d | Age (F) | Education (F) | Interaction (F) |
|---|---|---|---|---|---|---|---|
| DMS probability of error given correct (score) | Young lower education (75) Older lower education (126) | −0.45 ± 0.68 0.57 ± 1.04 | 0.80, 1.41 *** | 1.11 | 150.03 *** | 4.24 * | 1.33 |
| Young lower education (75) Young higher education (75) | −0.45 ± 0.68 −0.74 ± 0.46 | 0.17, 0.82 * | 0.50 | ||||
| Young higher education (75) Older higher education (126) | −0.74 ± 0.46 0.49 ± 0.92 | 1.25, 1.90 *** | 1.57 | ||||
| Older lower education (126) Older higher education (126) | 0.57 ± 1.04 0.49 ± 0.92 | −0.17, 0.33 | 0.08 | ||||
| DMS probability of error given error (score) | Young lower education (75) Older lower education (126) | −0.35 ± 0.86 0.45 ± 1.09 | 0.50, 1.09 *** | 0.79 | 43.76 *** | 5.16 * | 0.09 |
| Young lower education (75) Young higher education (75) | −0.35 ± 0.86 −0.57 ± 0.62 | −0.03, 0.62 | 0.29 | ||||
| Young higher education (75) Older higher education (126) | −0.57 ± 0.62 0.15 ± 0.93 | 0.57, 1.17 *** | 0.87 | ||||
| Older lower education (126) Older higher education (126) | 0.45 ± 1.09 0.15 ± 0.93 | 0.05, 0.54 * | 0.30 | ||||
| DMS total correct (score) | Young lower education (75) Older lower education (126) | 0.48 ± 0.73 −0.65 ± 0.90 | 1.03, 1.66 *** | 1.34 | 196.00 *** | 7.67 ** | 0.93 |
| Young lower education (75) Young higher education (75) | 0.48 ± 0.73 0.81 ± 0.49 | 0.21, 0.86 ** | 0.53 | ||||
| Young higher education (75) Older higher education (126) | 0.81 ± 0.49 −0.49 ± 0.88 | 1.38, 2.04 *** | 1.71 | ||||
| Older lower education (126) Older higher education (126) | −0.65 ± 0.90 −0.49 ± 0.88 | −0.07, 0.43 | 0.18 |
| Groups | Young Lower Education (YLE) | Young Higher Education (YHE) | Older Lower Education (OLE) | Older Higher Education (OHE) |
|---|---|---|---|---|
| Participants (n) | 75 | 75 | 126 | 126 |
| Age (years) | 25.49 ± 2.32 | 26.98 ± 2.12 | 70.79 ± 2.25 | 69.55 ± 2.35 |
| Sex (n) | Female: 37 Male: 38 | Female: 36 Male: 39 | Female: 102 Male: 24 | Female: 99 Male: 27 |
| MMSE (points) | 29.04 ± 1.60 | 29.23 ± 0.83 | 27.00 ± 2.27 | 28.32 ± 1.25 |
| Education (years) | 12.94 ± 1.60 | 17.66 ± 1.37 | 5.22 ± 1.38 | 12.14 ± 1.57 |
| Gene/rs | Vic/Fam Fluorophores | Localization | Outcomes |
|---|---|---|---|
| BDNF/rs6265 | C/T | Chr.11: 27658369 | T allele associated with memory impairment 1, increases susceptibility to developing Alzheimer’s disease 2. Associated with reduced hippocampal volume 3. |
| NTRK2/rs2289656 | A/G | Chr.9: 84948647 | G allele, lower risk of cognitive impairment 4. Patients with Alzheimer’s disease are more frequently heterozygous for this gene 5. |
| FNDC5/rs3480 | A/G | Chr.1: 32862564 | G allele associated with reduced expression, greater susceptibility to diabetes mellitus, and its metabolic dysfunctions 6. |
Disclaimer/Publisher’s Note: The statements, opinions and data contained in all publications are solely those of the individual author(s) and contributor(s) and not of MDPI and/or the editor(s). MDPI and/or the editor(s) disclaim responsibility for any injury to people or property resulting from any ideas, methods, instructions or products referred to in the content. |
© 2023 by the authors. Licensee MDPI, Basel, Switzerland. This article is an open access article distributed under the terms and conditions of the Creative Commons Attribution (CC BY) license (https://creativecommons.org/licenses/by/4.0/).
Share and Cite
Tomás, A.M.; Bento-Torres, N.V.O.; Jardim, N.Y.V.; Moraes, P.M.; da Costa, V.O.; Modesto, A.C.; Khayat, A.S.; Bento-Torres, J.; Picanço-Diniz, C.W. Risk Polymorphisms of FNDC5, BDNF, and NTRK2 and Poor Education Interact and Aggravate Age-Related Cognitive Decline. Int. J. Mol. Sci. 2023, 24, 17210. https://doi.org/10.3390/ijms242417210
Tomás AM, Bento-Torres NVO, Jardim NYV, Moraes PM, da Costa VO, Modesto AC, Khayat AS, Bento-Torres J, Picanço-Diniz CW. Risk Polymorphisms of FNDC5, BDNF, and NTRK2 and Poor Education Interact and Aggravate Age-Related Cognitive Decline. International Journal of Molecular Sciences. 2023; 24(24):17210. https://doi.org/10.3390/ijms242417210
Chicago/Turabian StyleTomás, Alessandra Mendonça, Natáli Valim Oliver Bento-Torres, Naina Yuki Vieira Jardim, Patrícia Martins Moraes, Victor Oliveira da Costa, Antônio Conde Modesto, André Salim Khayat, João Bento-Torres, and Cristovam Wanderley Picanço-Diniz. 2023. "Risk Polymorphisms of FNDC5, BDNF, and NTRK2 and Poor Education Interact and Aggravate Age-Related Cognitive Decline" International Journal of Molecular Sciences 24, no. 24: 17210. https://doi.org/10.3390/ijms242417210