Article

A Simplified and Efficient Method for Production of Manganese Ferrite Magnetic Nanoparticles and Their Application in DNA Isolation

1
Higher Education and Industrial Cooperation Centre, University of Miskolc, 3515 Miskolc, Hungary
2
Institute of Chemistry, Faculty of Materials and Chemical Engineering, University of Miskolc, 3515 Miskolc, Hungary
*
Authors to whom correspondence should be addressed.
Int. J. Mol. Sci. 2023, 24(3), 2156; https://doi.org/10.3390/ijms24032156
Submission received: 22 September 2022 / Revised: 11 January 2023 / Accepted: 17 January 2023 / Published: 21 January 2023
(This article belongs to the Collection Feature Papers in Molecular Genetics and Genomics)

Abstract

:
A simplified, fast, and effective production method has been developed for the synthesis of manganese ferrite (MnFe2O4) magnetic nanoparticles (MNPs). In addition to the wide applicability of MnFe2O4 MNPs, this work also reports their application in DNA isolation for the first time. An ultrasonic-cavitation-assisted combustion method was applied in the synthesis of MnFe2O4 MNPs at different furnace temperatures (573 K, 623 K, 673 K, and 773 K) to optimize the particles’ properties. It was shown that MnFe2O4 nanoparticles synthesized at 573 K consist of a spinel phase only with adequate size and zeta potential distributions and superparamagnetic properties. It was also demonstrated that superparamagnetic manganese ferrite nanoparticles bind DNA in buffer with a high NaCl concentration (2.5 M), and the DNA desorbs from the MNPs by decreasing the NaCl concentration of the elution buffer. This resulted in a DNA yield comparable to that of commercial DNA extraction products. Both the DNA concentration measurements and electrophoresis confirmed that a high amount of isolated bacterial plasmid DNA (pDNA) with adequate purity can be extracted with MnFe2O4 (573 K) nanoparticles by applying the DNA extraction method proposed in this article.

1. Introduction

MnFe2O4 is one of the most promising spinel ferrite nanoparticles (NPs) [1], since it is useful in fuel production, can serve as an anode material for Li+ batteries, and can also be used in the removal of heavy metals as adsorbents for wastewater treatment [2], as well as being used as a catalyst [3]. MnFe2O4 NPs are also efficient candidates for various biomedical applications such as in drug delivery, magnetic resonance imaging (MRI) [4,5,6,7], or as a heat source in magnetic hyperthermia-mediated cancer therapy [8]. The main reason for the wide applicability of MnFe2O4 NPs is their ferrimagnetic property, which can be controlled by the nanoparticle size. If a magnetic field is applied, magnetic moments of the magnetic domains align with the magnetic field, which results in a large net magnetic moment [9,10,11,12]. When the nanoparticles’ size decreases below a threshold value (commonly 20 nm [13]), the ferrimagnetic material becomes a single domain that is characterized by a uniform magnetization, and these nanoparticles have a larger, localized magnetic field compared to those of larger particles [9,10].
By changing the synthesis method, operation conditions, and the concentration of precursors, MnFe2O4 NPs can be produced in different sizes, morphologies, purities, and crystallinities, thus NPs can be easily adjusted according to the need of the application [3]. There are various preparation methods for magnetic material synthesis such as solvothermal synthesis [14], classical co-precipitation [15], hydrothermal reactions [16], sol–gel synthesis [17], thermal decomposition [18], microemulsion synthesis [19], sonochemical reactions [20], electrospray synthesis [21], and laser pyrolysis [22].
In the last two decades, nanoparticle-based biotechnology has shown great progress and has become a promising field due to its numerous applications. For instance, magnetic beads can be used for the construction of a novel modular-chip-based bacterial DNA extraction devices [23], in the isolation/pre-concentration of various target molecules, or in biomedical applications such as biosensing platforms [24]. Recently, iron oxide magnetic nanoparticles pre-mixed with DNA molecules have appeared as a potential component of tissue engineering scaffolds, since MNP–DNA-modified surfaces promote differentiation of mesenchymal stem cells [25]. A new hybrid magnetic composite (iron oxide nanoparticles coated with different polymers) has been used in novel, practical, and efficient pDNA extraction and purification protocols as well [26]. pDNA is a double-stranded extra-chromosomal DNA molecule of a relatively small size, high stability, and autonomous replication capability, thus it is an indispensable tool for genetic engineering. pDNA is usually used as a starting material in most biotechnology procedures, therefore the development of new, efficient protocols for pDNA extraction from bacterial cells is a hot topic [27]. pDNA separation from cell lysate with magnetic nanoparticles has several advantages compared to time-consuming, conventional isolation with toxic organic solvents or to the cartridge-based isolation method which requires several centrifugation steps and expensive kits. The magnetic solid-phase extraction method speeds up nucleic acid isolation from crude samples such as cell lysates [28] and thus enables the downstream applications of molecular biology to commence faster, such as amplification, cloning, sequencing, or hybridization [29,30,31].
To the best of our knowledge, MnFe2O4 MNPs have never been tested in nucleic acid isolation. Thus, the aim of this work was to achieve simple, fast, and efficient synthesis of MnFe2O4 magnetic nanoparticles that can then be further tested in molecular biological applications.
To produce manganese ferrite nanoparticles, combustion, and sonochemical treatments can be combined. The sonochemical method can provide a high reaction rate and controllable synthesis conditions, yielding high purity NPs, thus allowing a narrow size distribution, scalability, and environmental friendliness [32,33,34,35]. To get rid of the remaining organic compounds from the surface of the nanoparticles, a combustion step can be conducted. The great advantage of the method is that it consists of two simple steps, and it is quick and easy to implement without of need for washing, filtering, or centrifugation like in traditional co-precipitation procedures [36,37,38].
After the sonochemical-assisted combustion synthesis of MnFe2O4 magnetic nanoparticles, the physico-chemical characterization of these MNPs was carried out by X-ray diffraction (XRD), transmission electron microscopy (TEM), Fourier transform infrared spectroscopy (FTIR), and magnetization hysteresis experiments. Thereafter the bacterial pDNA binding capacity of nanoparticles was tested.

2. Results and Discussion

2.1. XRD Characterization

The presence of magnetically separable manganese ferrite spinel in the samples was confirmed by XRD measurements. As Figure 1 shows, the XRD reflection peaks were located at 18.1° (111), 29.9° (220), 35.3° (311), 36.8° (222), 42.5° (400), 52.7° (422), 56.3° (511), and 61.7° (440) two theta degrees, which match with the peaks corresponding to the manganese ferrite phase in all of the samples that were produced at the following temperatures: 573 K, 623 K, 673 K, and 773 K (PDF 74-2403). These reflections were also characteristic for manganese ferrite samples created by the co-precipitation method [36,37,38].
By increasing the temperature to 623 K and 673 K (Figure 1B,C), a new magnetic phase, namely magnetite was also identified next to the spinel structure. The magnetite was formed in a relatively large quantity in the case of these two samples, which were 38.9 wt% and 48.3 wt%, respectively. The characteristic reflections, which belong to Fe3O4, were visible at 18.2° (111), 30.3° (220), 35.7° (311), 43.2° (400), 53.5° (422), 57.1° (511), and 62.3° (440) two theta degrees (PDF 19-629). At a high temperature (773 K), other phases also formed (Figure 1D), and these were the hematite and bixbyite. The latter is a manganese iron oxide (Mn,Fe)2O3 whose appearance is known to be temperature dependent [39]. The bixbyite content of the sample (773 K) was low (3.9 wt%), its reflection peaks were found at 23.3° (211), 33.0° (222), 35.8° (321), 38.4° (400), 45.3° (332), 49.5° (431), 55.2° (440), 60.5° (611), 63.9° (541), and 65.9° (622) two theta degrees (PDF 89-4836). The reflections at 24.1° (012), 33.7° (104), 35.5° (110), 40.8° (113), 49.9° (024), 54.3° (116), 62.3° (214), and 64.2° (300) correspond to the Fe2O3 phase (PDF 33-0664).
Based on the XRD analysis, we can conclude that the sample that was heat-treated at 573 K contained the spinel (MnFe2O4) phase only, while others have inhomogeneous magnetic properties (e.g., hematite). Homogeneous magnetic properties are preferred in DNA isolation since DNA adsorbed onto the surface of weakly magnetic or non-magnetic particles, such as hematite, can cause the loss of a significant amount of the tested genetic material during the purification steps.
Based on the XRD results, the crystallite sizes were calculated using the full width at the half maximum (FWHM) (Table 1). The average crystallite sizes of the manganese ferrite and magnetite particles are very similar (11–14 nm). The crystallite sizes of the manganese ferrite samples, which were synthesized by co-precipitation, vary between 5–35 nm [7,38,40,41]. In the case of the MnFe2O4 NPs, which were synthesized by a thermal treatment method followed by calcination at various temperatures from 723 to 873 K, increasing crystallite sizes between 15–23 nm were shown [42]. All in all, the size of MnFe2O4 crystallites produced in this work is in line with the literature values.

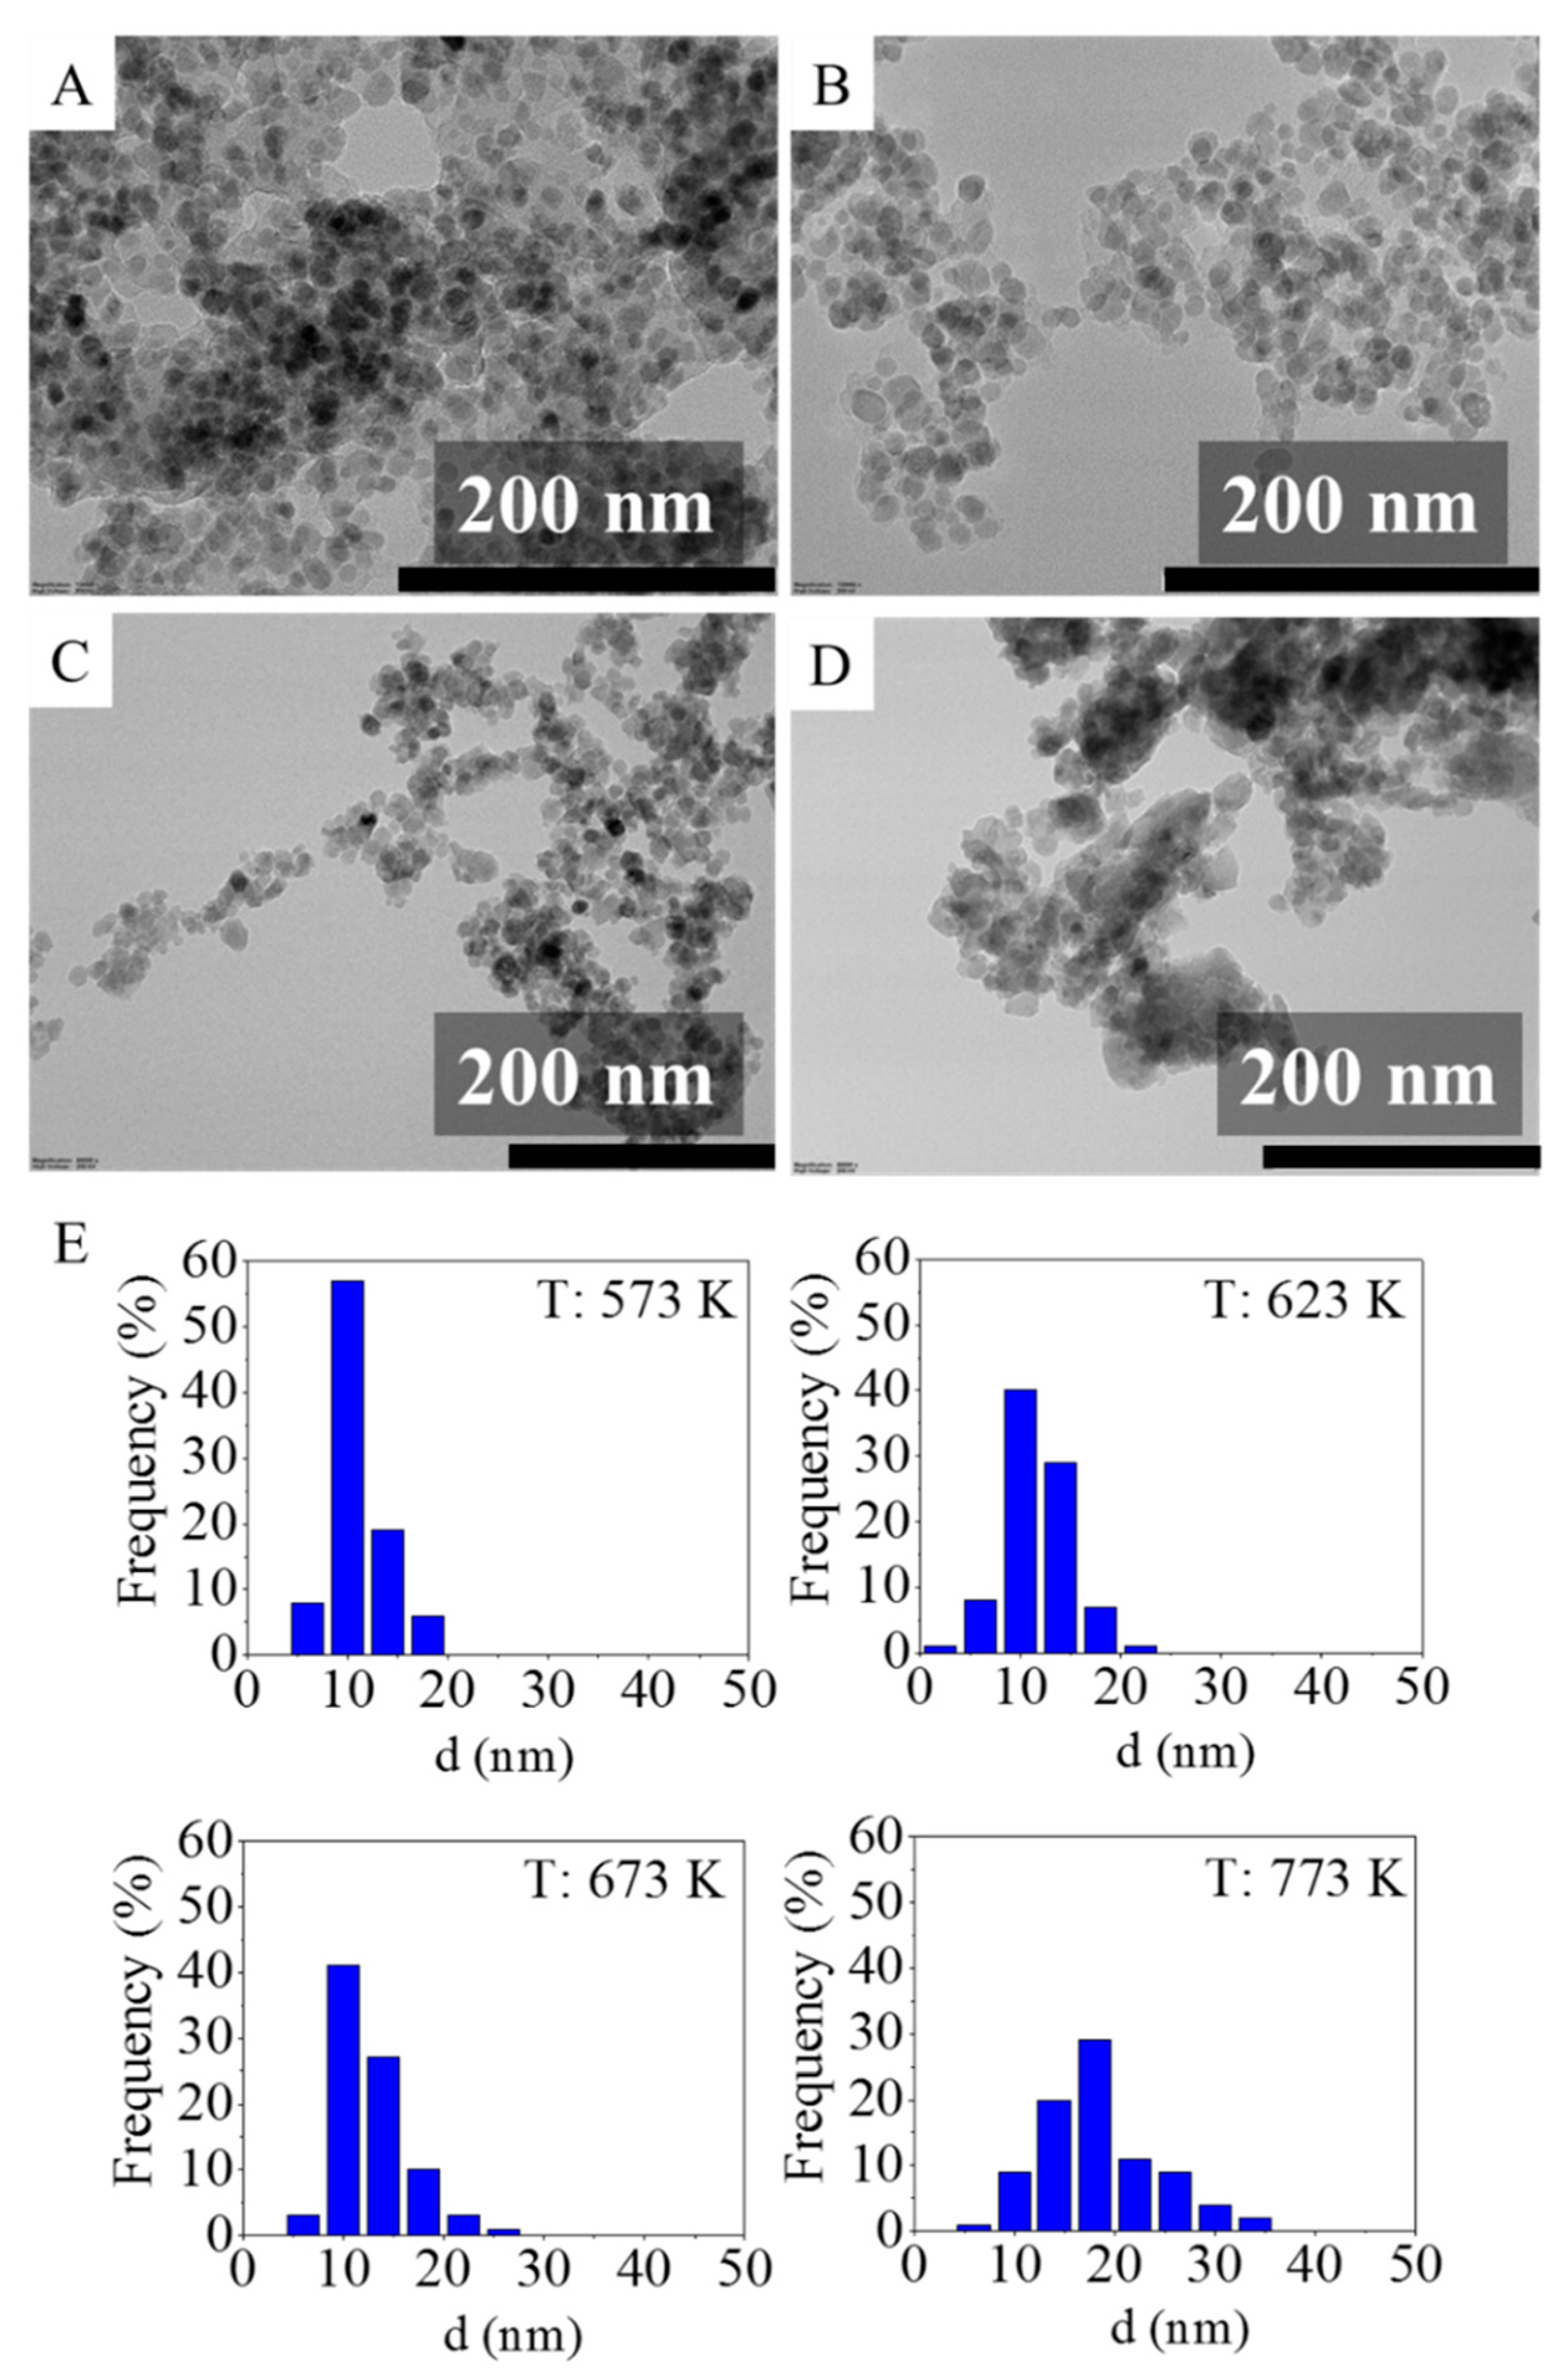
2.2. Transmission Electron Microscopy (TEM) Results

The smaller the nanoparticle, the larger the specific surface area for interaction with the DNA that is available, as is the amount of DNA that can be adsorbed [11]. Thus, the size distribution of the MNPs is a crucial parameter for DNA extraction applications, and this was determined by transmission electron microscopy (TEM) images taken from each magnetic nanopowder sample (presented in Figure 2A–D and shown in Supplementary Materials Figure S1 with higher resolution). These images were then analyzed using Image J software to characterize the nanoparticles. The statistical description of the nanoparticles is tabulated in Table 2 and the corresponding size distribution is shown in Figure 2E (box plot representation of these data is also available in Supplementary Materials Figure S2).
The mean of the nanoparticle size increased slightly as the temperature increased. According to ANOVA, the samples synthesized at 573 K, 623 K, and 673 K could not be considered significantly different at a 95% confidence level. The mean particle sizes were between 11.2 and 12.6 nm and were quite close to the corresponding median values, which is characteristic of normal distribution, an important assumption for ANOVA. On the other hand, the nanoparticles prepared at the highest investigated temperature (at 723 K) yielded a statistically different particle size distribution from the three aforementioned samples. These NPs were significantly larger and had an average size of 18.4 ± 5.9 nm and the median size was 17.5 nm. Despite these two particle size clusters, all of the produced nanoparticles were sufficiently small enough to retain superparamagnetic properties [43]. It is also important to mention that since the average particle sizes obtained from TEM images are within the respective standard error of the average crystallite sizes for each of the nanoparticles obtained from the XRD results, one can consider these nanoparticles to be of a single domain. This was confirmed with a HRTEM picture, where the ordered crystal planes are clearly visible (Supplementary Materials Figure S3). Li et al. [44] also reported preparation of cobalt ferrite nanoparticles for which the crystalline size (obtained by XRD) and the particle diameter (by TEM) are in good agreement. Based on this observation, they suggested that the vast majority of the particles are a single crystal.
The heating of the manganese ferrite particles caused them to sinter and form larger sized nanoparticles. This can be explained by the fact that the driving force of sintering is the minimization of the free surface energy caused by the elimination of interfaces, grain boundaries, and defects [45,46].

2.3. FTIR Measurements

As seen on the FTIR spectrum of the sample produced at 573 K, two characteristic peaks were shown, which are the absorption bands of the Mn–O and Fe–O bonds appearing at 448 cm−1 and 568 cm−1, respectively. These bands correspond to intrinsic stretching vibrations of the metal–oxygen bonds at the octahedral (448 cm−1) and tetrahedral (568 cm−1) sites for spinel MnFe2O4 [47]. The band at 1099 cm−1 originates from the stretching vibration of the C-O bond [48]. Other carbon-containing bonds were also identified, such as the FTIR band at 1557 cm−1 of the C=C bonds, whereas the two bands at 2864 cm−1 and 2927 cm−1 wavenumbers correspond to the symmetric and asymmetric stretching vibration of the aliphatic and aromatic C-H bonds, respectively [48]. Since polyethylene glycol (PEG) served as the reaction medium during MNP production, its imperfect burning could be the reason why traces of carbon were observed in the MNP samples. By increasing the heating temperature, the intensity of the νC-O, νC=C, and νC-H bands decreased. This reduction of the carbon content is a consequence of thermal oxidization and evaporation [49]. The band at 1410 cm−1 can be assigned to the bending vibration of the hydroxyl groups, while the stretching mode of OH located at 3429 cm−1 is associated with a wide band [7,50]. The -OH bands at 1410 cm−1 origin from the PEG, but this is found only in the samples which are made at lower synthesis temperatures. In the case of the samples synthesized at higher temperatures (673 K and 773 K), the abovementioned bands are not visible due the decomposition of the polyol. Bands were observed at 1641 cm−1 in all four samples (Figure 3A), which were assigned to the bending vibrations of the adsorbed water molecules [51,52] and the surface hydroxyl groups on the ferrite [53]. After the heat treatment, vaporized water molecules adsorb onto the surface of the manganese ferrite samples as they cool to room temperature. An interesting phenomenon was noted on the spectra of the samples produced at 673 K and 773 K. On the band of the metal-oxygen vibrations (568 cm−1), a shoulder was observed at 642 cm−1, which is attributed to the formation of magnetite in addition to manganese ferrite. A further increase in temperature caused the appearance of a second shoulder at 726 cm−1, which can be attributed to the appearance of hematite and bixbyite oxides.
The importance of hydroxyl groups on the surface of nanoparticles lies in the fact that they promote the formation of hydrogen bonds between the nanoparticles and DNA [54]. Such interaction sites enable the DNA to bind reversibly to the MNPs during the extraction process, and thus, by changing the buffer medium, it can be easily separated from the other unwanted macromolecules [55].

2.4. Electrokinetic Potential and Surface Area Measurements

Due to the deprotonation of surface hydroxyl groups, the electrokinetic potential showed negative average values between −11 mV and −17 mV (Figure 3B). With the increasing temperature of the heat treatment, the absolute values of the average zeta potentials showed a slight decrease. The nanoparticles electrostatically repel each other in aqueous media due to their negative surface charge, while their hydrophilic nature allows them to adequately disperse in the aqueous phase and enables them to interact with hydrophilic DNA molecules.
The MnFe2O4 sample created at 573 K contained only manganese ferrite nanoparticles, which means they were free from non-magnetic oxides. This is important because non-magnetic oxides would impair the efficiency of magnetic separation. Furthermore, the average zeta potential for this ferrite sample was the most negative (−17 ± 6 mV). Due to these properties, the manganese ferrite sample prepared at 573 K was chosen for further DNA purification tests. Surface area measurements were also performed on these samples by CO2 adsorption–desorption experiments at 273 K, using the Dubinin–Astakhov method. The specific surface area of MnFe2O4 prepared at 573 K was 76.0 m2/g. Based on the aforementioned characteristics of this nanoparticle, the MnFe2O4 sample produced at 573 K was considered promising for further biological applications [56,57,58].

2.5. Thermogravimetric Analysis of the Ferrite Samples

Thermal analysis studies of ferrite nanoparticles were carried out and the thermogravimetry (TG) curves of the samples are shown on Figure 4. The TG and DTG curves showed three weight losses.
As can be seen, the two samples prepared at high temperature (MnFe2O4 (673 K) and MnFe2O4 (773 K) had only minor change in mass in the temperature range studied. The evaporation of water is mainly responsible for this change which already occurred below 473 K [59,60]. These samples contained roughly 0.9 and 1.7 wt% adsorbed water as shown in Table 3. As has also been shown, there was only a small amount of organic compounds remaining in these samples.
Beside the water loss, there was a significant second weight loss in the case of the MnFe2O4 (573 K) and MnFe2O4 (623 K) samples between 500 and 600 K. This can be assigned to the decomposition of the physisorbed organic molecules which remained from ferrite synthesis, probably polyethylene glycol as was also suggested by Mukhopadhyay [48]. This finding is also in line with the TGA measurement of pure PEG reported by Massoumi et al., since PEG decomposition occurred as one step around 543–643 K [61]. Due to this decomposition, an endothermic peak appeared in the TDA curve (Supplementary Materials Figure S4) [48] and 3.3–6.9 wt% of the samples was lost in this way. At a higher temperature (between 600 and 705 K), the oxidation of the remaining organic compounds (including the remaining PEG) occurred. This process is responsible for roughly 10 and 20 wt% of the weight loss. These organic compounds remained from the incomplete burning of the PEG during the preparation of the nanoparticle [52] due to the lower preparation temperature. The burning of the remaining organic compound (PEG) and carbon led to the appearance of an exothermic peak on the DTA curve (Supplementary Materials Figure S4). Finally, small weight change occurs between 860 and 1016 K for each sample, ascribed to the phase transition (formation of oxides) from the ferrite [62,63,64].

2.6. Magnetization Measurements

The magnetization curve of the MnFe2O4 MNPs (573 K) was measured at 303 K for a magnetic field of 15,000 Oe using a vibrating sample magnetometer (VSM). The magnetic saturation (Ms) reached 72 emu/g as shown in Figure 5A. A similar Ms value (73 emu/g) was measured by Pradhan et al. in the case of annealed MnFe2O4 particles (created by co-precipitation) [41], and comparable Ms values (69.5 emu/g and 74 emu/g) have been reported in other literature as well [38,65].
The magnetization curve shows a very small hysteresis loop with low coercivity (Hc) and low remanent magnetization (Mr) as can be seen in the inlet of Figure 5A. The values of Hc (0.7 Oe) and Mr (0.1 emu/g) are quite small, indicating the superparamagnetic nature of the sample at room temperature (Figure 5B) [66]. This also supports our observation that our MnFe2O4 nanoparticles are single crystalline with a single magnetic domain [67]. Such a feature is very useful for our targeted DNA isolation application since superparamagnetic nanoparticles can be easily collected by magnets while the decantation of the supernatant is carried out. Without the presence of an external magnetic field, the magnetic properties of the nanoparticles become rather small and therefore no aggregation can occur due to the remanent magnetization of the nanoparticle. Preparation of ferrite nanoparticles with such superparamagnetic properties are not always the case. Properties of ferrite nanoparticles highly depend on the synthesis methods [44,64,68,69,70,71,72,73,74,75,76,77,78,79,80,81] (Supplementary Materials Figure S1).

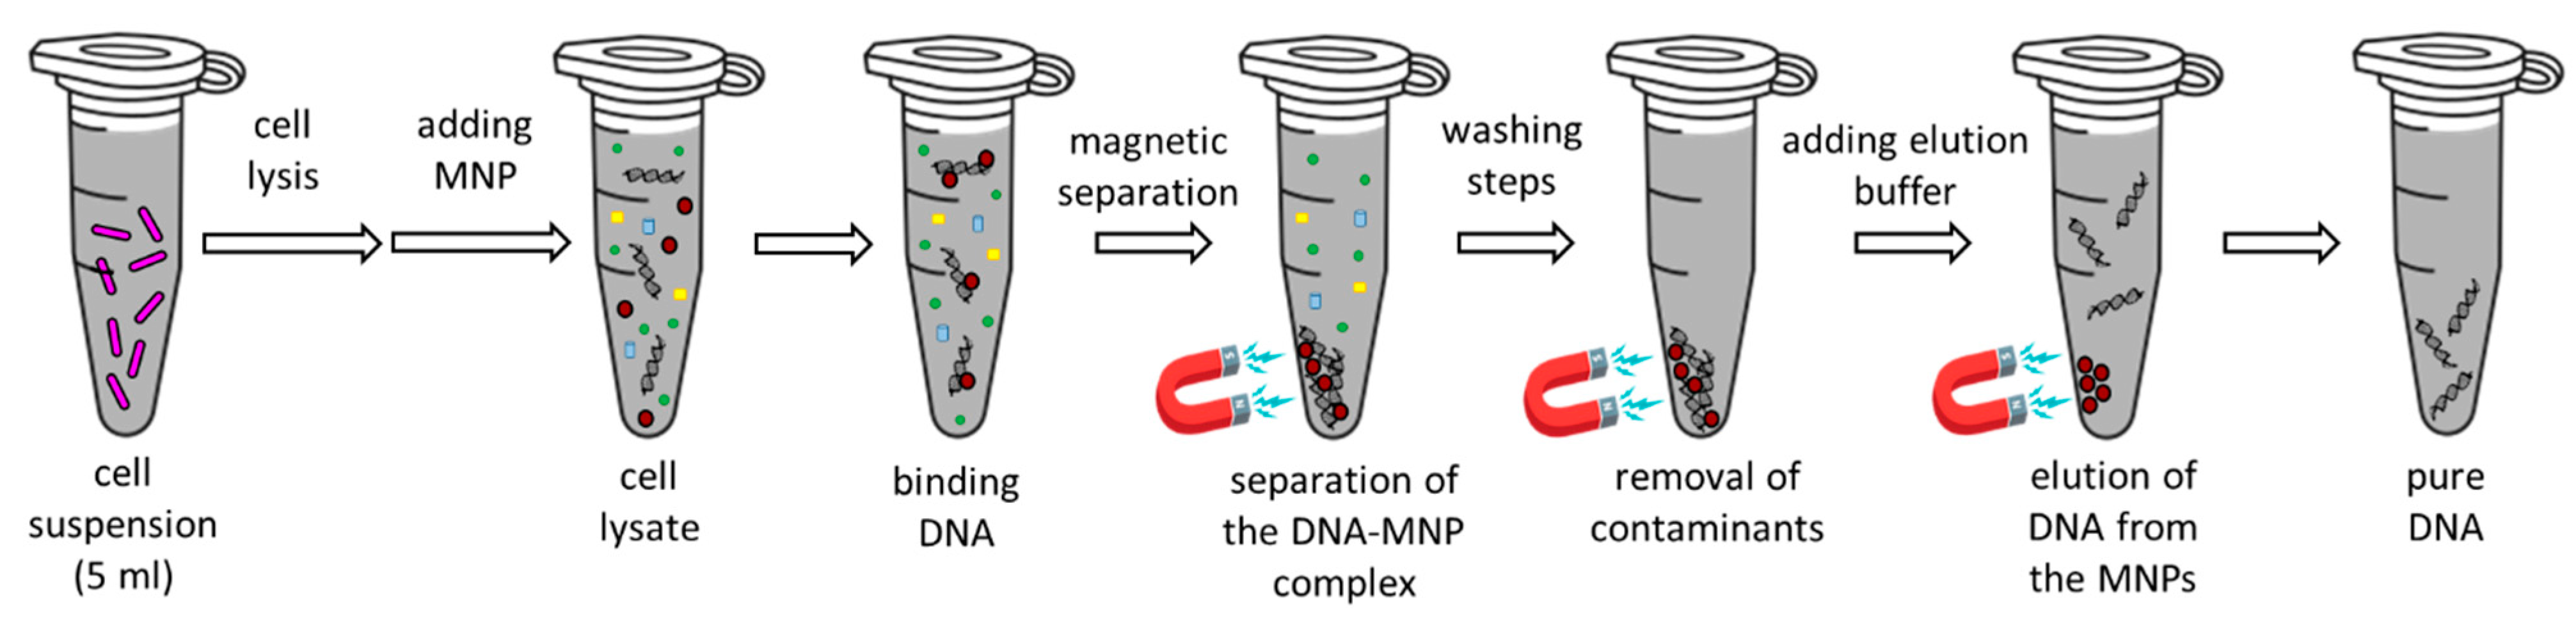
2.7. DNA Binding Experiments

The DNA binding property of MnFe2O4 nanoparticles was tested using the protocol described in Section 4.6. Reversible DNA–MNP binding experiments (Figure 6A,B) were performed at least three times to verify the reproducibility of the extraction process whereby a DNA-free sample (ultrapure water used instead of cell lysate) was used as a negative control (Figure 6B). This control served to demonstrate that MnFe2O4 NPs alone cannot bind the fluorescent dye used for the visualization of agarose gels in the electrophoresis experiments. Therefore, the fluorescence signal must only come from the DNA isolated with the MNPs. As seen in Figure 6A, the DNA fluorescence bands appeared only in the elution fractions (column 2 and 3) that correspond to the purified pBAD24 plasmid, and no fluorescent signal can be seen in the supernatant fraction (column 1). The lack of a signal in the supernatant sample also means that the amount of MNPs (20 mg/mL) used was sufficient for the extraction to bind all of the the pDNA present in 5 mL of cell lysate. The second column in Figure 5A is the first fraction eluted from MNPs with 80 µL of elution buffer. To maximize the amount of pDNA extracted by the MNPs, the elution step was repeated once with the same buffer volume (Figure 6A, column 3). A smaller but still significant amount of pure DNA was extracted in the second elution step. The extra, less intense bands in the second column may be due to the different pDNA conformations [82,83]. The DNA concentration of the first elution fraction was 390.60 ± 41.55 µg/mL and 178.77 ± 16.06 µg/mL in the second fraction, as shown in Table 4. To estimate the purity of the DNA in each solution, the absorbance at 260 nm and 280 nm (A260/280) was measured. The typical ratio for pure DNA is in between 1.7 and 2.0 [84]. In our experiment, the A260/280 ratio was found to be 2.06 ± 0.03 and 2.09 ± 0.05 for the isolated pDNA in the first and second elution fractions, respectively. Although these values are slightly above the upper limit of the specified purity range, references suggest that a 260/280 absorbance ratio between 1.93 and 2.27 indicates insignificant levels of contaminants [85,86].
The DNA binding capacity of MnFe2O4 MNPs using a smaller volume of cell culture (1.5 mL instead of 5 mL) and proportionally smaller amount of MNPs (6 mg/mL instead of 20 mg/mL) was also tested (columns 1–3 in Figure 7). The 1.5 mL cell suspension volume was chosen in order to fit into the most frequently used microcentrifuge tube (Eppendorf tube), and this 1.5 mL cell suspension is the commonly suggested quantity recommended by other DNA extraction kits as well [87,88]. During the DNA extraction process, using 6 mg/mL of MNPs, a detectable amount of pDNA with good purity was obtained (Table 4). Small amount of the target pDNA remained unbonded during the DNA–MNP coincubation, since a slight DNA-coupled fluorescent band was seen in the supernatant fraction (see column 1 in Figure 7). When the used cell culture volume remained unchanged and the amount of the MNPs was increased to 20 mg/mL (columns 4–6), 1.6 times more pDNA was extracted (in terms of the total quantity of the first and second elution steps, 61.58 µg/mL and 100.73 µg/mL, respectively) compared to the previous cell culture–MNP ratio. Since pBAD24 is a low copy number plasmid, for these types of plasmids we recommend the use of an initial cell culture volume of 5 mL with a 20 mg/mL MnFe2O4 magnetic nanoparticle to yield large-scale purified pDNA with adequate purity (Table 4 and columns 7–9 in Figure 7). As shown in Table 4, when a larger initial cell suspension volume was used, the purity of the extracted product reached the upper limit of the conventional purity range of 1.7–2.0. Therefore, we can conclude that cell culture–MNP ratio of 5 mL of cell suspension to 20 mg/mL of MnFe2O4 MNPs is a good compromise for the extraction of low copy number plasmids.

3. Conclusions

Albeit the biocompatibility of MnFe2O4 nanoparticles being investigated previously, no relevant studies on the nucleic acid binding ability of these nanoparticles have been reported. In this work, MnFe2O4 NPs were prepared by a sonochemical combustion method. Four different temperatures were applied in their preparation (573 K, 623 K, 673 K, and 773 K). We investigated the ferrite spinel content of the particles prepared at these temperatures and found that the NPs made at 573 K were entirely in the spinel phase. XRD results and TEM images were used to characterize the crystalline size and size distribution of the metal oxide nanoparticles, respectively. The average particle sizes of all four investigated particles (573 K, 623 K, 673 K, and 773 K) were in the range of 10–20 nm. Even though all of the produced nanoparticles were small enough to exhibit superparamagnetic properties, the MnFe2O4 NPs produced at 573 K had the smallest average particle size and a sufficiently high degree of magnetic saturation. Furthermore, this sample also had the most intensive -OH band. The presence of hydroxyl groups contributes to the negative zeta potential, which also improves the colloidal stability for MnFe2O4 NPs (573 K). These features demonstrated that the MnFe2O4 (573 K) NPs were suitable for nucleic acid isolation.
In this work, we successfully extracted DNA from a complex cell lysate using MnFe2O4 MNPs. We have also demonstrated that superparamagnetic manganese ferrite nanoparticles reversibly bind pDNA according to the salt concentration of the used buffers. The amount of magnetic nanoparticles required for the isolation depends on the volume of the cell suspension. For low copy number type plasmids, a 5 mL cell suspension and 600 µL of a 20 mg/mL MNP solution was sufficient for the extraction of a large quantity of pDNA with no DNA loss after a DNA–MNP coincubation step. Both the DNA concentration measurements and the agarose gel electrophoresis images confirmed that the resulting pDNA extract was suitable for further molecular biological applications.
We present a new biological application for MnFe2O4 MNPs and a fast and simple method for their preparation. The implemented method provides mass production of small-sized MNPs with a high DNA binding capacity. The significance of our results is demonstrated by the fact that the performance of MnFe2O4 NPs prepared at 573 K in the purification of pDNA matches that of commercially available kits.

4. Materials and Methods

4.1. Materials

The manganese ferrite nanoparticles were prepared from the following ingredients: manganese (II) nitrate tetrahydrate / Mn(NO3)2 ∙ 4 H2O (Carl Roth GmbH, Karlsruhe, Germany), iron (III) nitrate nonahydrate / Fe(NO3)3 ∙ 9 H2O (VWR International, Leuven, Belgium), and polyethylene glycol (PEG 400, [MW = 400 g/mol]) from VWR International (Fontenay-sous-Bois, France) and they were used as a reducing agent and dispersion media for the metal precursors.
For the maintenance of bacterial cell cultures and isolation of plasmid DNA with MnFe2O4 nanoparticles the following chemicals were used: tryptone, yeast extract (Neogen Culture Media, Lansing, MI, USA), sodium chloride, bacteriological agar, polyethylene glycol (VWR International, Leuven, Belgium), ampicillin sodium salt (Alfa Aesar, Kandel, Germany), a plasmid purification midi kit (Qiagen, Hilden, Germany), tris hydrochloride salt, bromophenol blue sodium salt (VWR International, Solon, OH, USA), ethylenediaminetetraacetic acid disodium salt dihydrate (Sigma-Aldrich, Louis, MO, USA), 96% ethanol (VWR International, Fontenay-sous-Bois, France), Tween 20, Gel Red nucleic acid gel stain, agarose (Merck Millipore, Billerica, MA, USA), and a 1 kb DNA ladder (New England Biolabs, Ipswich, MA, USA and Thermo Fisher Scientific, Waltham, MA, USA).

4.2. Synthesis of Manganese Ferrite Magnetic Nanoparticles

Manganese (II) nitrate (2.00 g) and iron (III) nitrate (6.44 g) were dissolved in 20 g of polyethylene glycol. The solution of the precursors was treated for 3 min with ultrasonic irradiation using a Hielscher UIP1000 Hdt. homogenizer (1000 W, 20 kHz) with Bs4d22 ultrasonic block sonotrode (D = 22 mm). The exposure of the liquid medium to intense ultrasonic effects results in the formation of bubbles of a few micrometers in the mixture. These bubbles then burst as the pressure increases [89], releasing thermal energy locally (forming a “hot spot”) which activates the reducing agents such as polyethylene glycol (PEG). This provides energy for the formation of highly dispersive metal hydroxide nanoparticles from the metal precursors. PEG can be removed from the dispersion produced in this way by thermal oxidation (burning). In order to do so, the PEG-based colloid system of the iron and manganese hydroxides was heated in a furnace at four different temperatures (573 K, 623 K, 673 K, and 773 K) for 3 h. After burning the polyol content, the metal hydroxide was dehydrated which resulted in magnetizable spinel nanoparticles.

4.3. Physico-Chemical Characterisation of the Nanoparticles

The size and morphology of the MnFe2O4 nanoparticles were studied by high-resolution transmission electron microscopy (HRTEM, Tecnai G2 electron microscope, 200 kV (FEI Company, Hillsboro, OR, USA). Sample preparation from aqueous dispersion was carried out by placing a drop of dispersion on a 300-mesh copper grids (Ted Pella Inc., Redding, CA, USA).
The phase identification and quantification of the different oxide forms was performed with X-ray diffraction measurements realized by Rietveld analysis. A Bruker D8 diffractometer (Cu-Kα source) in parallel beam geometry (Göbel mirror) with a Vantec detector was applied. The X-ray diffraction patterns from the manganese ferrite, magnetite, hematite, and bixbyite matched the patterns of the corresponding standards, PDF 74-2403, PDF 19-629, PDF 33-0664, and PDF 89-4836, respectively. The average crystallite size of the domains was calculated using the full width at the half maximum.
The carbon content of the ferrite samples was measured by a Vario Macro CHNS element analyzer, with phenanthrene applied as a standard (C: 93.538%, H: 5.629%, N: 0.179%, S: 0.453%) from Carlo Erba Inc. (Emmendingen, Germany). The carrier gas was helium (99.9990%), whereas oxygen (99.995%) was used as an oxidative atmosphere.
The zeta potentials of the nanoparticles were examined based on electrophoretic mobility measurements by applying laser Doppler electrophoresis using Zetasizer Nano ZS (Malvern Panalytical Ltd., Malvern, United Kingdom).
The identification of the spinel chemical bonds was carried out with Fourier transform infrared spectroscopy using a Vertex 70 spectroscope (Bruker Corporation, Billerica, MA, USA). During the preparation, a 10 mg sample was pelletized with 250 mg potassium bromide, and the measurements were realized in the transmission mode.
The specific surface area of the ferrite samples was examined by CO2 adsorption–desorption measurements at 273 K by using an ASAP 2020 sorptometer (Micromeritics Instrument Corporation, Norcross, GA, USA), based on the Dubinin–Astakhov method.
The measurement of moisture content, loss of volatile components, and the carbon content of the manganese ferrite samples was carried by thermogravimetric analysis (TGA) using a TG 209 Tarsus thermo-microbalance device (Erich Netzsch GmbH & Co. Holding KG, Selb, Germany). A nitrogen (4.5) and oxygen (5.0) mixture was used as an oxidative atmosphere in the measurements. The flow rates were set to 6 mL min−1 and 14 mL min−1 for the oxygen and nitrogen, respectively. The heating rate was 10 K min−1 in the 323–1073 K temperature range.
The magnetic characterization of ferrite nanoparticles was carried out with a vibrating sample magnetometer (Lake Shore Cryotronics Inc., Westerville, OH, USA), using the 8600 VSM system at a 303 K temperature. The magnetization (M) versus the applied magnetic field (H) was performed over H up to 15,000 Oe.

4.4. Biological Characterization of Nanoparticles

Nucleic acid isolation was carried out by means of a Mega Star 1.6R centrifuge (VWR International, Leuven, Belgium) and an NB-205QF cooling and shaking incubator (N-Biotek, Gyeonggi-do, Republic of Korea). The effectiveness of the nucleic acid isolation by MNPs was verified with a Mini-Sub Cell GT horizontal agarose gel electrophoresis system (Bio-Rad Laboratories, Hercules, CA, USA), a NanoDrop One Microvolume UV–Vis spectrophotometer (Thermo Fisher Scientific, Waltham, MA, USA) and a gel documentation system (Uvitec, Cambridge, United Kingdom).

4.5. Growth of Escherichia coli

An Escherichia coli DH5α bacterial strain with ampicillin antibiotic resistance on a pBAD24 plasmid was used for pDNA extraction. The cell cultures were preserved on agar plates in our laboratory at 37 °C. For preparing fresh bacterial cell suspensions, 35 mL Luria–Bertani (LB) medium containing 100 µg/mL of ampicillin was inoculated using a sterile inoculation loop. After overnight (18–20 h) incubation at 37 °C with vigorous shaking (160 rpm), the cell suspension was divided into centrifuge tubes, each containing 5 mL, as this quantity was used for each pDNA isolation experiment. The remaining suspension aliquots were stored at −20 °C for later experiments.

4.6. pDNA Isolation with MnFe2O4 Magnetic Nanoparticles

For the isolation process, bacterial cells were centrifuged for 5 min on 6000× g and the supernatant medium was decanted. Solutions P1–P3 from the plasmid purification midi kit (Qiagen) were used to lyse the cells and precipitate the macromolecules. Cell lysis was performed following the (Qiagen) manufacturer’s recommendations. With the help of the neutralization buffer, only the plasmid DNA was renatured in the solution. Using a high-speed centrifuge (14,500× g, 10 min) pDNA was separated from cell debris and the irreversibly denatured macromolecules. The nucleic acid binding capacity of the tested MnFe2O4 nanoparticles was carried out in such a way that the crude extract was mixed with the nanoparticles and the subsequent isolation steps were performed using a modified version of a procedure from the literature [90]. The supernatant solution of the cell lysate (600 µL) was added to 600 µL of a 20 mg/mL MnFe2O4 dispersion suspended in binding buffer (containing 2.5 M NaCl, 1 M Tris-HCl pH 8.0, 0.5 M EDTA, 20% (w/v) PEG 6000 and 0.05% Tween 20). Eppendorf tubes were flipped upside down for 10 min, thereby creating MNP–DNA complexes. This was followed by a 5 min incubation step (at room temperature) on a strong external magnet (a magnetic stand). The emerging crude supernatant fraction (containing potentially unbound DNA molecules and contaminants) was collected and pipetted into a new microcentrifuge tube and the residual pellet (the DNA–MNP complex) was washed as follows. In total, three washing steps were carried out, each using the same 1 M Tris-HCl pH 7.5 buffer with 96% ethanol. First, 1 mL of the wash buffer was added to the suspension of DNA-coated magnetic nanoparticles. After vortexing the tubes for a few seconds, 2 min incubation was performed on the magnet. After removal of the supernatant (while the Eppendorf tubes remained on the magnet), this washing step was repeated with 30 s incubation on the magnet. During the third washing step, 500 µL of washing solution was used and after vortexing, the samples were placed on the magnet for 2 more minutes. Finally, the supernatant was removed with a pipette. A short centrifugation step was carried out and the excess wash buffer was removed. The tubes were dried for 15 min in the 37 °C incubator with an open cap. The samples were eluted with Tris-HCl (pH 8.5). Within these circumstances, DNA dissociated from the MNPs. Eighty µL of the elution buffer completely wet the DNA–MNP complex, and after 10 min incubation at 37 °C, the purified pDNA was separated from the MNPs using 5 min incubation on a magnetic stand. To maximize the amount of extracted pDNA, an additional elution with a 80 µL volume was performed (Figure 8).

4.7. Gel Electrophoresis

To confirm the success of reversible DNA–MNP binding, gel electrophoresis experiments were carried out using 0.75-cm thick 1.0 w/v% agarose gels (1 g agarose powder, 100 mL of Tris-Acetate-EDTA buffer (TAE; 40 mM Tris-base, 20 mM acetic acid, 1 mM EDTA [91]). The running buffer for electrophoresis was also the TAE buffer. An amount of 6× gel loading dye solution was used (30 v/v% glycerol, 0.25 w/v% bromophenol blue dye, and ultrapure water) to provide the requisite density for loading the sample into the well and to monitor the progress of electrophoresis [91]. Using a 6× concentrated loading buffer means that the mixture prepared for electrophoresis contained one part DNA loading dye and five parts isolated DNA sample. The electrophoresis was run at 90 V for 45 min.

4.8. Determination of pDNA Concentration

DNA concentration measurements were performed with microvolume nucleic acid quantification (UV–Vis NanoDrop (Thermo Fisher Scientific, Waltham, MA, USA)) using the absorbance measured at 260 nm. To determine the purity of the extracted pDNA, the absorbance of the sample at 280 nm was also measured. A typical ratio of the absorbance at 260 nm and 280 nm (A260/280) for a pure DNA solution is considered to be between 1.7 and 2.0.

Supplementary Materials

The following supporting information can be downloaded at: https://www.mdpi.com/article/10.3390/ijms24032156/s1.

Author Contributions

Conceptualization, T.B.G., E.S.-D. and L.V.; methodology, T.B.G., G.S. and E.S.-D.; validation, T.B.G., E.S.-D. and L.V.; investigation, T.B.G. and E.S.-D.; resources, Á.M.I. and L.V.; data curation, T.B.G., M.S., E.S.-D. and L.V.; writing—original draft preparation, T.B.G., E.S.-D. and L.V.; writing—review and editing, T.B.G., M.S., E.S.-D. and L.V.; supervision, E.S.-D. and L.V.; funding acquisition, B.V. and C.V. All authors have read and agreed to the published version of the manuscript.

Funding

This research was funded by the European Union and the Hungarian State, co-financed by the European Regional Development Fund in the framework of the GINOP-2.3.4-15-2016-00004 and by 2020-1.1.6-Jövő-2021-00009 project supported by the National Research Development and Innovation Fund aimed at promoting development of an innovative diagnostic procedure for diseases with major public health importance. The research was also supported by the ÚNKP-22-3 New National Excellence Program of the Ministry for Innovation and Technology from the source of the National Research, Development and Innovation Fund.

Data Availability Statement

The data presented in this study are available on request from the corresponding author. The data are not publicly available due to the policy of the University of Miskolc.

Acknowledgments

The authors are thankful to Michael Owen for the corrections and fruitful scientific discussion.

Conflicts of Interest

The corresponding author states on behalf of all of the authors that there is no conflict of interest for the present study.

References

  1. Mondal, D.K.; Borgohain, C.; Paul, N.; Borah, J.P. Tuning hyperthermia efficiency of MnFe2O4/ZnS nanocomposites by controlled ZnS concentration. J. Mater. Res. Technol. 2019, 8, 5659–5670. [Google Scholar] [CrossRef]
  2. Soufi, A.; Hajjaoui, H.; Elmoubarki, R.; Abdennouri, M.; Qourzal, S.; Barka, N. Spinel ferrites nanoparticles: Synthesis methods and application in heterogeneous Fenton oxidation of organic pollutants—A review. Appl. Surf. Sci. 2021, 6, 100145. [Google Scholar] [CrossRef]
  3. Akhlaghi, N.; Najafpour-Darzi, G. Manganese ferrite (MnFe2O4) Nanoparticles: From synthesis to application—A review. J. Ind. Eng. Chem. 2021, 103, 292–304. [Google Scholar] [CrossRef]
  4. Asghar, K.; Qasim, M.; Das, D. Preparation and characterization of mesoporous magnetic MnFe2O4@mSiO2 nanocomposite for drug delivery application. Mater. Today Proc. 2020, 26, 87–93. [Google Scholar] [CrossRef]
  5. Baig, M.M.; Yousuf, M.A.; Agboola, P.O.; Khan, M.A.; Shakir, I.; Warsi, M.F. Optimization of different wet chemical routes and phase evolution studies of MnFe2O4 nanoparticles. Ceram. Int. 2019, 45, 12682–12690. [Google Scholar] [CrossRef]
  6. Kalaiselvan, C.R.; Thorat, N.D.; Sahu, N.K. Carboxylated PEG-Functionalized MnFe2O4 Nanocubes Synthesized in a Mixed Solvent: Morphology, Magnetic Properties, and Biomedical Applications. ACS Omega 2021, 6, 5266–5275. [Google Scholar] [CrossRef]
  7. Islam, K.; Haque, M.; Kumar, A.; Hoq, A.; Hyder, F.; Hoque, S.M. Manganese Ferrite Nanoparticles (MnFe2O4): Size Dependence for Hyperthermia and Negative/Positive Contrast Enhancement in MRI. Nanomaterials 2020, 10, 2297. [Google Scholar] [CrossRef]
  8. Patade, S.R.; Andhare, D.D.; Somvanshi, S.B.; Jadhav, S.A.; Khedkar, M.V.; Jadhav, K.M. Self-heating evaluation of superparamagnetic MnFe2O4 nanoparticles for magnetic fluid hyperthermia application towards cancer treatment. Ceram. Int. 2020, 46, 25576–25583. [Google Scholar] [CrossRef]
  9. Kolhatkar, A.G.; Jamison, A.C.; Litvinov, D.; Willson, R.C.; Lee, T.R. Tuning the Magnetic Properties of Nanoparticles. Int. J. Mol. Sci. 2013, 14, 15977–16009. [Google Scholar] [CrossRef] [Green Version]
  10. Yang, C.; Hou, Y.-L.; Gao, S. Nanomagnetism: Principles, nanostructures, and biomedical applications. Chin. Phys. B 2014, 23, 057505. [Google Scholar] [CrossRef]
  11. Issa, B.; Obaidat, I.M.; Albiss, B.A.; Haik, Y. Magnetic Nanoparticles: Surface Effects and Properties Related to Biomedicine Applications. Int. J. Mol. Sci. 2013, 14, 21266–21305. [Google Scholar] [CrossRef] [PubMed] [Green Version]
  12. Mathew, D.S.; Juang, R.-S. An overview of the structure and magnetism of spinel ferrite nanoparticles and their synthesis in microemulsions. Chem. Eng. J. 2007, 129, 51–65. [Google Scholar] [CrossRef]
  13. Kim, B.Y.S.; Rutka, J.T.; Chan, W.C.W. Nanomedicine. N. Engl. J. Med. 2010, 363, 2434–2443. [Google Scholar] [CrossRef] [PubMed] [Green Version]
  14. Li, Z.; Gao, K.; Han, G.; Wang, R.; Li, H.; Zhao, X.S.; Guo, P. Solvothermal synthesis of MnFe2O4 colloidal nanocrystal assemblies and their magnetic and electrocatalytic properties. New J. Chem. 2015, 39, 361–368. [Google Scholar] [CrossRef]
  15. Jiang, W.; Yang, H.C.; Yang, S.Y.; Horng, H.E.; Hung, J.C.; Chen, Y.C.; Hong, C.-Y. Preparation and properties of superparamagnetic nanoparticles with narrow size distribution and biocompatible. J. Magn. Magn. Mater. 2004, 283, 210–214. [Google Scholar] [CrossRef]
  16. Chen, D.; Xu, R. Hydrothermal synthesis and characterization of nanocrystalline Fe3O4 powders. Mater. Res. Bull. 1998, 33, 1015–1021. [Google Scholar] [CrossRef]
  17. da Costa, G.M.; De Grave, E.; de Bakker, P.M.A.; Vandenberghe, R.E. Synthesis and Characterization of Some Iron Oxides by Sol-Gel Method. J. Solid State Chem. 1994, 113, 405–412. [Google Scholar] [CrossRef]
  18. Hyeon, T.; Lee, S.S.; Park, J.; Chung, Y.; Na, H.B. Synthesis of Highly Crystalline and Monodisperse Maghemite Nanocrystallites without a Size-Selection Process. J. Am. Chem. Soc. 2001, 123, 12798–12801. [Google Scholar] [CrossRef]
  19. Deng, Y.; Wang, L.; Yang, W.; Fu, S.; Elaıssari, A. Preparation of magnetic polymeric particles via inverse microemulsion polymerization process. J. Magn. Magn. Mater. 2003, 257, 69–78. [Google Scholar] [CrossRef]
  20. Abu Mukh-Qasem, R.; Gedanken, A. Sonochemical synthesis of stable hydrosol of Fe3O4 nanoparticles. J. Colloid Interface Sci. 2005, 284, 489–494. [Google Scholar] [CrossRef]
  21. Basak, S.; Chen, D.-R.; Biswas, P. Electrospray of ionic precursor solutions to synthesize iron oxide nanoparticles: Modified scaling law. Chem. Eng. Sci. 2007, 62, 1263–1268. [Google Scholar] [CrossRef]
  22. Veintemillas-Verdaguer, S.; Morales, M.P.; Serna, C.J. Continuous production of γ-Fe2O3 ultrafine powders by laser pyrolysis. Mater. Lett. 1998, 35, 227–231. [Google Scholar] [CrossRef]
  23. Lim, S.Y.; Lee, T.J.; Shin, S.Y.; Bae, N.H.; Lee, S.J.; Park, Y.M. Development of a bacterial DNA extraction modular chip using a magnetic particle and portable vibration motor. Anal. Methods 2020, 12, 1197–1202. [Google Scholar] [CrossRef]
  24. Kim, S.-E.; Tieu, M.V.; Hwang, S.Y.; Lee, M.-H. Magnetic Particles: Their Applications from Sample Preparations to Biosensing Platforms. Micromachines 2020, 11, 302. [Google Scholar] [CrossRef] [PubMed] [Green Version]
  25. Ishmukhametov, I.; Batasheva, S.; Rozhina, E.; Akhatova, F.; Mingaleeva, R.; Rozhin, A.; Fakhrullin, R. DNA/Magnetic Nanoparticles Composite to Attenuate Glass Surface Nanotopography for Enhanced Mesenchymal Stem Cell Differentiation. Polymers 2022, 14, 344. [Google Scholar] [CrossRef] [PubMed]
  26. da Silva, R.J.; Pedro, G.C.; Gorza, F.D.; Maciel, B.G.; Ratkovski, G.P.; Mojica-Sánchez, L.C.; Medina-Llamas, J.C.; Chávez-Guajardo, A.E.; de Melo, C.P. DNA purification using a novel γ-Fe2O3/PEDOT hybrid nanocomposite. Anal. Chim. Acta 2021, 1178, 338762. [Google Scholar] [CrossRef]
  27. da Silva, R.J.; Maciel, B.G.; Medina-Llamas, J.C.; Chávez-Guajardo, A.E.; Alcaraz-Espinoza, J.J.; de Melo, C.P. Extraction of plasmid DNA by use of a magnetic maghemite-polyaniline nanocomposite. Anal. Biochem. 2019, 575, 27–35. [Google Scholar] [CrossRef]
  28. Sosa-Acosta, J.R.; Silva, J.A.; Fernández-Izquierdo, L.; Díaz-Castañón, S.; Ortiz, M.; Zuaznabar-Gardona, J.C.; Díaz-García, A.M. Iron Oxide Nanoparticles (IONPs) with potential applications in plasmid DNA isolation. Colloids Surf. A Physicochem. Eng. Asp. 2018, 545, 167–178. [Google Scholar] [CrossRef]
  29. Tan, S.C.; Yiap, B.C. DNA, RNA, and protein extraction: The past and the present. J. Biomed. Biotechnol. 2009, 2009, 574398. [Google Scholar] [CrossRef] [Green Version]
  30. Berensmeier, S. Magnetic particles for the separation and purification of nucleic acids. Appl. Microbiol. Biotechnol. 2006, 73, 495–504. [Google Scholar] [CrossRef]
  31. Corchero, J.L.; Villaverde, A. Biomedical applications of distally controlled magnetic nanoparticles. Trends Biotechnol. 2009, 27, 468–476. [Google Scholar] [CrossRef] [PubMed]
  32. Yadav, R.S.; Kuřitka, I.; Vilcakova, J.; Jamatia, T.; Machovsky, M.; Skoda, D.; Urbánek, P.; Masař, M.; Urbánek, M.; Kalina, L. Impact of sonochemical synthesis condition on the structural and physical properties of MnFe2O4 spinel ferrite nanoparticles. Ultrason. Sonochem. 2020, 61, 104839. [Google Scholar] [CrossRef] [PubMed]
  33. Wu, K.; Liu, D.; Lu, W.; Zhang, K. One-pot sonochemical synthesis of magnetite@ reduced graphene oxide nanocomposite for high performance Li ion storage. Ultrason. Sonochem. 2018, 45, 167–172. [Google Scholar] [CrossRef] [PubMed]
  34. Sakthivel, R.; Kubendhiran, S.; Chen, S.-M. Facile one-pot sonochemical synthesis of Ni doped bismuth sulphide for the electrochemical determination of promethazine hydrochloride. Ultrason. Sonochem. 2019, 54, 68–78. [Google Scholar] [CrossRef]
  35. Gupta, A.; Srivastava, R. Mini submersible pump assisted sonochemical reactors: Large-scale synthesis of zinc oxide nanoparticles and nanoleaves for antibacterial and anti-counterfeiting applications. Ultrason. Sonochem. 2019, 52, 414–427. [Google Scholar] [CrossRef] [PubMed]
  36. Martinez–Vargas, S.; Martínez, A.I.; Hernández–Beteta, E.E.; Mijangos–Ricardez, O.F.; Vázquez–Hipólito, V.; Patiño-Carachure, C.; López–Luna, J. As(III) and As(V) adsorption on manganese ferrite nanoparticles. J. Mol. Struct. 2018, 1154, 524–534. [Google Scholar] [CrossRef]
  37. Elahi, I.; Zahira, R.; Mehmood, K.; Jamil, A.; Amin, N. Co-precipitation synthesis, physical and magnetic properties of manganese ferrite powder. Afr. J. Pure Appl. Chem. 2012, 6, 1–5. [Google Scholar]
  38. Makridis, A.; Topouridou, K.; Tziomaki, M.; Sakellari, D.; Simeonidis, K.; Angelakeris, M.; Yavropoulou, M.P.; Yovos, J.G.; Kalogirou, O. In vitro application of Mn-ferrite nanoparticles as novel magnetic hyperthermia agents. J. Mater. Chem. B 2014, 2, 8390–8398. [Google Scholar] [CrossRef]
  39. Szczygieł, I.; Winiarska, K. Synthesis and characterization of manganese–zinc ferrite obtained by thermal decomposition from organic precursors. J. Therm. Anal. Calorim. 2014, 115, 471–477. [Google Scholar] [CrossRef] [Green Version]
  40. Egbosiuba, T.C.; Abdulkareem, A.S.; Kovo, A.S.; Afolabi, E.A.; Tijani, J.O.; Roos, W.D. Enhanced adsorption of As(V) and Mn(VII) from industrial wastewater using multi-walled carbon nanotubes and carboxylated multi-walled carbon nanotubes. Chemosphere 2020, 254, 126780. [Google Scholar] [CrossRef]
  41. Bandekar, A.S.; Gaikar, P.S.; Angre, A.P.; Chaughule, A.M.; Pradhan, N.S. Effect of Annealing on Microstructure and Magnetic Properties of Mn Ferrite Powder. J. Biol. Chem. Chron. 2019, 5, 74–78. [Google Scholar]
  42. Naseri, M.G.; Saion, E.B.; Ahangar, H.A.; Hashim, M.; Shaari, A.H. Synthesis and characterization of manganese ferrite nanoparticles by thermal treatment method. J. Magn. Magn. Mater. 2011, 323, 1745–1749. [Google Scholar] [CrossRef]
  43. Dolores, R.; Raquel, S.; Adianez, G.-L. Sonochemical synthesis of iron oxide nanoparticles loaded with folate and cisplatin: Effect of ultrasonic frequency. Ultrason. Sonochem. 2015, 23, 391–398. [Google Scholar] [CrossRef] [PubMed]
  44. Li, X.; Sun, Y.; Zong, Y.; Wei, Y.; Liu, X.; Li, X.; Peng, Y.; Zheng, X. Size-effect induced cation redistribution on the magnetic properties of well-dispersed CoFe2O4 nanocrystals. J. Alloys Compd. 2020, 841, 155710. [Google Scholar] [CrossRef]
  45. Eggersdorfer, M.L.; Kadau, D.; Herrmann, H.J.; Pratsinis, S.E. Aggregate morphology evolution by sintering: Number and diameter of primary particles. J. Aerosol Sci. 2012, 46, 7–19. [Google Scholar] [CrossRef] [PubMed] [Green Version]
  46. Eggersdorfer, M.L.; Pratsinis, S.E. Agglomerates and aggregates of nanoparticles made in the gas phase. Adv. Powder Technol. 2014, 25, 71–90. [Google Scholar] [CrossRef]
  47. Zipare, K.; Dhumal, J.; Bandgar, S.; Mathe, V.; Shahane, G. Superparamagnetic manganese ferrite nanoparticles: Synthesis and magnetic properties. J. Nanosci. 2015, 1, 178–182. [Google Scholar]
  48. Mukhopadhyay, A.; Joshi, N.; Chattopadhyay, K.; De, G. A Facile Synthesis of PEG-Coated Magnetite (Fe3O4) Nanoparticles and Their Prevention of the Reduction of Cytochrome C. ACS Appl. Mater. Interfaces 2012, 4, 142–149. [Google Scholar] [CrossRef]
  49. Zakiyah, L.B.; Saion, E.; Al-Hada, N.M.; Gharibshahi, E.; Salem, A.; Soltani, N.; Gene, S. Up-scalable synthesis of size-controlled copper ferrite nanocrystals by thermal treatment method. Mater. Sci. Semicond. 2015, 40, 564–569. [Google Scholar] [CrossRef]
  50. Venkatesha, P.S.; Srinivasanb, R.; Chandraboseb, A.; Alagara, M. Structural and Morphological Studies of Samarium Doped Yttrium Oxide Nanomaterials Synthesized by Chemical Co-precipitation Method. ANJAC J. Sci. 2013, 12, 9–17. [Google Scholar]
  51. Jacob, B.P.; Kumar, A.; Pant, R.; Singh, S.; Mohammed, E. Influence of preparation method on structural and magnetic properties of nickel ferrite nanoparticles. Bull. Mater. Sci. 2011, 34, 1345–1350. [Google Scholar] [CrossRef]
  52. Park, J.Y.; Daksha, P.; Lee, G.H.; Woo, S.; Chang, Y. Highly water-dispersible PEG surface modified ultra small superparamagnetic iron oxide nanoparticles useful for target-specific biomedical applications. Nanotechnology 2008, 19, 365603. [Google Scholar] [CrossRef] [PubMed]
  53. Xian, G.; Kong, S.; Li, Q.; Zhang, G.; Zhou, N.; Du, H.; Niu, L. Synthesis of spinel ferrite MFe2O4 (M=Co, Cu, Mn, and Zn) for persulfate activation to remove aqueous organics: Effects of m-site metal and synthetic method. Front. Chem. 2020, 8, 177. [Google Scholar] [CrossRef] [PubMed]
  54. Pershina, A.G.; Sazonov, A.E.; Filimonov, V.D. Magnetic nanoparticles–DNA interactions: Design and applications of nanobiohybrid systems. Russ. Chem. Rev. 2014, 83, 299–322. [Google Scholar] [CrossRef]
  55. Tang, C.; He, Z.; Liu, H.; Xu, Y.; Huang, H.; Yang, G.; Xiao, Z.; Li, S.; Liu, H.; Deng, Y.; et al. Application of magnetic nanoparticles in nucleic acid detection. J. Nanobiotechnol. 2020, 18, 62. [Google Scholar] [CrossRef] [Green Version]
  56. Vanyorek, L.; Ilosvai, Á.M.; Szőri-Dorogházi, E.; Váradi, C.; Kristály, F.; Prekob, Á.; Fiser, B.; Varga, T.; Kónya, Z.; Viskolcz, B. Synthesis of iron oxide nanoparticles for DNA purification. J. Dispers. Sci. Technol. 2021, 42, 693–700. [Google Scholar] [CrossRef]
  57. Min, J.H.; Woo, M.-K.; Yoon, H.Y.; Jang, J.W.; Wu, J.H.; Lim, C.-S.; Kim, Y.K. Isolation of DNA using magnetic nanoparticles coated with dimercaptosuccinic acid. Anal. Biochem. 2014, 447, 114–118. [Google Scholar] [CrossRef]
  58. Sharma, J.N.; Pattadar, D.K.; Mainali, B.P.; Zamborini, F.P. Size Determination of Metal Nanoparticles Based on Electrochemically Measured Surface-Area-to-Volume Ratios. Anal. Chem. 2018, 90, 9308–9314. [Google Scholar] [CrossRef]
  59. Neelamegan, H.; Yang, D.-K.; Lee, G.-J.; Anandan, S.; Sorrentino, A.; Wu, J.J. Synthesis of Magnetite-Based Polymers as Mercury and Anion Sensors Using Single Electron Transfer-Living Radical Polymerization. ACS Omega 2020, 5, 7201–7210. [Google Scholar] [CrossRef] [Green Version]
  60. Maity, D.; Chandrasekharan, P.; Feng, S.-S.; Jun, D. Synthesis and studies of APTES functionalized magnetite nanoparticles. In Proceedings of the 2010 International Conference on Nanoscience and Nanotechnology, Sydney, Australia, 22–26 February 2010; pp. 94–97. [Google Scholar]
  61. Massoumi, B.; Ramezani, M.; Jaymand, M.; Ahmadinejad, M. Multi-walled carbon nanotubes-g-[poly (ethylene glycol)-b-poly (ε-caprolactone)]: Synthesis, characterization, and properties. J. Polym. Res. 2015, 22, 214. [Google Scholar] [CrossRef]
  62. Mazo-Zuluaga, J.; Barrero, C.A.; Díaz-Terán, J.; Jerez, A. Thermally Induced Magnetite–Haematite Transformation. Hyperfine Interact. 2003, 148, 153–161. [Google Scholar] [CrossRef]
  63. Mahdavi, M.; Ahmad, M.B.; Haron, M.J.; Namvar, F.; Nadi, B.; Rahman, M.Z.A.; Amin, J. Synthesis, surface modification and characterisation of biocompatible magnetic iron oxide nanoparticles for biomedical applications. Molecules 2013, 18, 7533–7548. [Google Scholar] [CrossRef] [PubMed] [Green Version]
  64. Sinuhaji, P.; Simbolon, T.R.; Hamid, M.; Hutajulu, D.A.; Sembiring, T.; Rianna, M.; Ginting, M. Influences of Co compositions in CoFe2O4 on microstructures, thermal, and magnetic properties. Case Stud. Therm. Eng. 2021, 26, 101040. [Google Scholar] [CrossRef]
  65. Nikolic, A.; Boskovic, M.; Spasojevic, V.; Jancar, B.; Antic, B. Magnetite/Mn-ferrite nanocomposite with improved magnetic properties. Mater. Lett. 2014, 120, 86–89. [Google Scholar] [CrossRef]
  66. Quy, D.V.; Hieu, N.M.; Tra, P.T.; Nam, N.H.; Hai, N.H.; Thai Son, N.; Nghia, P.T.; Anh, N.T.V.; Hong, T.T.; Luong, N.H. Synthesis of Silica-Coated Magnetic Nanoparticles and Application in the Detection of Pathogenic Viruses. J. Nanomater. 2013, 2013, 603940. [Google Scholar] [CrossRef] [Green Version]
  67. Li, Q.; Kartikowati, C.W.; Horie, S.; Ogi, T.; Iwaki, T.; Okuyama, K. Correlation between particle size/domain structure and magnetic properties of highly crystalline Fe3O4 nanoparticles. Sci. Rep. 2017, 7, 9894. [Google Scholar] [CrossRef]
  68. Nitika; Rana, A.; Kumar, V. Influence of temperature on structural, magnetic and thermal properties of superparamagnetic MnFe2O4 nanoparticles. Mater. Today Proc. 2021, 45, 4773–4776. [Google Scholar] [CrossRef]
  69. Ceylan, A.; Ozcan, S. Effects of disordered surface structure on the magnetic properties of nanocrystalline MnFe2O4. Ceram. Int. 2015, 41, 3875–3878. [Google Scholar] [CrossRef]
  70. Iranmanesh, P.; Saeednia, S.; Mehran, M.; Dafeh, S.R. Modified structural and magnetic properties of nanocrystalline MnFe2O4 by pH in capping agent free co-precipitation method. J. Magn. Magn. Mater. 2017, 425, 31–36. [Google Scholar] [CrossRef]
  71. Bernaoui, C.R.; Bendraoua, A.; Zaoui, F.; Gallardo, J.J.; Navas, J.; Boudia, R.A.; Djediai, H.; Goual, N.e.H.; Adjdir, M. Synthesis and characterization of NiFe2O4 nanoparticles as reusable magnetic nanocatalyst for organic dyes catalytic reduction: Study of the counter anion effect. Mater. Chem. Phys. 2022, 292, 126793. [Google Scholar] [CrossRef]
  72. Sundararajan, M.; Sukumar, M.; Dash, C.S.; Sutha, A.; Suresh, S.; Ubaidullah, M.; Al-Enizi, A.M.; Raza, M.K.; Kumar, D. A comparative study on NiFe2O4 and ZnFe2O4 spinel nanoparticles: Structural, surface chemistry, optical, morphology and magnetic studies. Physica B Condens. Matter 2022, 644, 414232. [Google Scholar] [CrossRef]
  73. Nejati, K.; Zabihi, R. Preparation and magnetic properties of nano size nickel ferrite particles using hydrothermal method. Chem. Cent. J. 2012, 6, 23. [Google Scholar] [CrossRef] [PubMed] [Green Version]
  74. Ji, J.; Zhang, S.; Cao, C.; Su, S.; Jiang, R.; Xia, A.; Zhang, H.; Li, H.; Liu, Z.; Jin, C. Structural and magnetic properties of SrFe12O19/CoFe2O4 composites with exchange coupling interaction. J. Magn. Magn. Mater. 2022, 564, 170073. [Google Scholar] [CrossRef]
  75. Aslibeiki, B.; Eskandarzadeh, N.; Jalili, H.; Ghotbi Varzaneh, A.; Kameli, P.; Orue, I.; Chernenko, V.; Hajalilou, A.; Ferreira, L.P.; Cruz, M.M. Magnetic hyperthermia properties of CoFe2O4 nanoparticles: Effect of polymer coating and interparticle interactions. Ceram. Int. 2022, 48, 27995–28005. [Google Scholar] [CrossRef]
  76. Aslibeiki, B.; Varvaro, G.; Peddis, D.; Kameli, P. Particle size, spin wave and surface effects on magnetic properties of MgFe2O4 nanoparticles. J. Magn. Magn. Mater. 2017, 422, 7–12. [Google Scholar] [CrossRef]
  77. Araújo, J.C.R.; Araujo-Barbosa, S.; Souza, A.L.R.; Iglesias, C.A.M.; Xavier, J.; Souza, P.B.; Plá Cid, C.C.; Azevedo, S.; da Silva, R.B.; Correa, M.A.; et al. Tuning structural, magnetic, electrical, and dielectric properties of MgFe2O4 synthesized by sol-gel followed by heat treatment. J. Phys Chem. Solids 2021, 154, 110051. [Google Scholar] [CrossRef]
  78. Naik, M.Z.; Salker, A.V. Tailoring the super-paramagnetic nature of MgFe2O4 nanoparticles by In3+ incorporation. Mater. Sci. Eng. B 2016, 211, 37–44. [Google Scholar] [CrossRef]
  79. Ajeesha, T.; A, A.; George, M.; Manikandan, A.; Mary, J.A.; Slimani, Y.; Almessiere, M.A.; Baykal, A. Nickel substituted MgFe2O4 nanoparticles via co-precipitation method for photocatalytic applications. Phys. B Condens. Matter 2021, 606, 412660. [Google Scholar] [CrossRef]
  80. Sarkar, K.; Mondal, R.; Dey, S.; Kumar, S. Cation vacancy and magnetic properties of ZnFe2O4 microspheres. Phys. B Condens. Matter 2020, 583, 412015. [Google Scholar] [CrossRef]
  81. Kirtimala Devi, N.; Wareppam, B.; Herojit Singh, L. Effect of sintering temperature on the magnetic properties of ZnFe2O4 composite with cobaltic oxide synthesized by chemical co precipitation method. Mater. Today Proc. 2022, 68, 196–199. [Google Scholar] [CrossRef]
  82. Kowalczyk, P.; Madej, A.; Szymczak, M.; Ostaszewski, R. α-Amidoamids as New Replacements of Antibiotics—Research on the Chosen K12, R2–R4 E. coli Strains. Materials 2020, 13, 5169. [Google Scholar] [CrossRef] [PubMed]
  83. Thorne, H.V. Electrophoretic characterization and fractionation of polyoma virus DNA. J. Mol. Biol. 1967, 24, 203–211. [Google Scholar] [CrossRef] [PubMed]
  84. Lucena-Aguilar, G.; Sánchez-López, A.M.; Barberán-Aceituno, C.; Carrillo-Avila, J.A.; López-Guerrero, J.A.; Aguilar-Quesada, R. DNA source selection for downstream applications based on DNA quality indicators analysis. Biopreserv. Biobank. 2016, 14, 264–270. [Google Scholar] [CrossRef] [Green Version]
  85. Pervaiz, Z.; Turi, N.; Khaliq, I.; Rabbani, M.; Malik, S. Methodology: A modified method for high-quality DNA extraction for molecular analysis in cereal plants. Genet. Mol. Res. 2011, 10, 1669–1673. [Google Scholar] [CrossRef] [PubMed]
  86. Abdel-Latif, A.; Osman, G. Comparison of three genomic DNA extraction methods to obtain high DNA quality from maize. Plant Methods 2017, 13, 1. [Google Scholar] [CrossRef] [Green Version]
  87. GenElute Plasmid Miniprep Kit; Sigma Aldrich: Saint Louis, MO, USA, 2018; (quality release date); pp. 4–5. Available online: https://www.sigmaaldrich.com (accessed on 4 September 2022).
  88. Omega Bio-tek. Mag Bind Ultra-Pure Plasmid DNA Kit; Omega Bio-tek: Norcross, GA, USA, 2014; pp. 5–7. Available online: https://ca.vwr.com/ (accessed on 4 September 2022).
  89. Yasui, K. Numerical simulations for sonochemistry. Ultrason. Sonochem. 2021, 78, 105728. [Google Scholar] [CrossRef] [PubMed]
  90. Treitli, S.C. BOMB Plasmid DNA Extraction Using Sera-Mag Carboxylated Beads, in Protocol 5.3. Doctoral Dissertation, Louisiana State University, Baton Rouge, LA, USA, 2019; pp. 2–5. Available online: https://bomb.bio/protocols/ (accessed on 4 September 2022).
  91. Surzycki, S. Agarose Gel Electrophoresis of DNA. In Basic Techniques in Molecular Biology; Surzycki, S., Ed.; Springer: Berlin/Heidelberg, Germany, 2000; pp. 163–191. [Google Scholar]
Figure 1. X-ray diffractograms of the ferrite samples produced at 573 K (A), 623 K (B), 673 K (C) and 773 K (D) temperatures.
Ijms 24 02156 g001
Figure 2. TEM images of the nanoparticles synthesized at 573 K (A), 623 K (B), 673 K (C), and 773 K (D), and their size distribution analysis on histograms (E).
Ijms 24 02156 g002
Figure 3. FTIR spectrum (A) and zeta potential distribution (B) of the nanoparticle samples produced at four different temperatures.
Ijms 24 02156 g003
Figure 4. TG and DTG curves of the ferrite samples in air atmosphere.
Ijms 24 02156 g004
Figure 5. Magnetization curve of MnFe2O4 (573 K) (A) and its magnetic separability by using a magnetic field (B).
Ijms 24 02156 g005
Figure 6. Agarose gel electrophoresis image of isolated pBAD24 plasmid DNA extracted with MnFe2O4 MNPs (A) and DNA-free control isolation fractions (B). In both pictures, the DNA ladder notation refers to a 1 kb DNA marker. (1) is the supernatant fraction, (2) marks the first elution fractions using 80 µL of elution buffer, and (3) indicates the second elution fractions (also eluting with 80 µL of buffer).
Ijms 24 02156 g006
Figure 7. DNA binding capacity of the MnFe2O4 MNPs.
Ijms 24 02156 g007
Figure 8. pDNA isolation with MnFe2O4 magnetic nanoparticles.
Ijms 24 02156 g008
Table 1. Average crystallite sizes of the nanoparticles obtained from the XRD results.
T (K)MnFe2O4 (nm)Fe3O4 (nm)
57311-
6231114
6731312
7731414
Table 2. Results of the particle size distribution analysis based on TEM images.
T (K)Mean (nm)Min. (nm)Max. (nm)Median (nm)P90 (nm)P95 (nm)P99 (nm)
57311.2 ± 2.65.618.610.714.517.118.6
62311.7 ± 3.23.420.911.315.916.420.9
67312.6 ± 3.85.925.311.917.819.225.3
77318.4 ± 5.94.234.117.527.529.534.1
Table 3. The weight losses of the ferrite samples.
Adsorbed Water
(wt%)
Physisorbed Organic Compounds
(wt%)
Remaining Carbon Forms
(wt%)
MnFe2O4 (573 K)2.56.919.25
MnFe2O4 (623 K)1.93.310.9
MnFe2O4 (673 K)1.70.241.0
MnFe2O4 (773 K)0.90.150.11
Table 4. DNA concentration of the MnFe2O4-purified pDNA samples.
Volume of Initial Cell Suspension (mL)Concentration of MnFe2O4 MNP (mg/mL)Concentration of Purified pDNA in First (80 µL) Elution (µg/mL) A260/280Concentration of Purified pDNA in Second (80 µL) Elution (µg/mL)A260/280
1.5644.95 ± 19.871.87 ± 0.1216.63 ± 12.762.04 ± 0.14
1.52063.8 ± 13.011.87 ± 0.0736.93 ± 8.941.99 ± 0.07
520390.60 ± 41.552.06 ± 0.03178.77 ± 16.062.09 ± 0.05
Disclaimer/Publisher’s Note: The statements, opinions and data contained in all publications are solely those of the individual author(s) and contributor(s) and not of MDPI and/or the editor(s). MDPI and/or the editor(s) disclaim responsibility for any injury to people or property resulting from any ideas, methods, instructions or products referred to in the content.

